

Summary
Dopamine is a modulatory neurotransmitter involved in learning, motor functions, and reward. Many neuropsychiatric disorders including Parkinson’s disease, autism, and schizophrenia are associated with imbalances or dysfunction in the dopaminergic system. Yet, our understanding of these pervasive public health issues is limited by our ability to effectively image dopamine in humans, which has long been a goal for chemists and neuroscientists. The last two decades have witnessed the development of many molecules used to trace dopamine. We review the small molecules, nanoparticles, and protein sensors used with fluorescent microscopy / photometry, MRI, and PET that shape dopamine research today. None of these tools observe dopamine itself, but instead harness the biology of the dopamine system – its synthetic and metabolic pathways, synaptic vesicle cycle, and receptors – in elegant ways. Their advantages and weaknesses are covered here, along with recent examples and the chemistry and biology that allow them to function.
eTOC Blurb
Post and Sulzer broadly review the molecules and approaches used to image dopamine release. The small molecules, nanoparticles, and protein sensors that have been developed for use with fluorescent microscopy / photometry, MRI, PET and MRI are covered. Each technique’s advantages, disadvantages, and underlying chemistry and biology discussed.
Graphical Abstract
Introduction
Dopamine is a small molecule neurotransmitter that in contrast to glutamate and GABA, which interact with ionotropic receptors to inhibit or excite neurons, binds to G protein-coupled receptors to modulate neuronal responses (Berke, 2018; Surmeier et al., 2014). Dopamine’s effects vary with respect to the dopamine receptor type: dopamine type-1 receptors (which include D1 and D5 dopamine receptors) were classically identified by enhancing cyclic AMP levels and are Gs protein-coupled, while dopamine type-2 receptors (encompassing D2, D3, and D4 receptors) were defined by their decrease of cyclic AMP, and are coupled to Gi/o (Beaulieu and Gainetdinov, 2011). Dopamine’s activation of these receptors – which in the striatum are highly expressed on the primary spiny projection neurons (SPNs, also referred to as medium spiny neurons) – initiates chemical cascades that enhance or depress other signals, in some cases acting as a high-pass filter of other ionotropic synapses (Pignatelli and Bonci, 2015). Our understanding of dopamine continues to evolve, with new work suggesting it might act as a morphogen during development (Lieberman et al., 2018).
Classical studies used techniques in which a reaction of catecholamines with aldehydes, principally the Falck-Hillarp technique, produced fluorescent dopamine and norepinephrine (NE) derivatives, and were used to identify dopaminergic and norepinephrinergic neurons and projections in the brain (Falck et al., 1982). This approach indicated that the largest populations of dopaminergic neurons are those of the substantia nigra pars compacta (SNc) and the neighboring ventral tegmental area (VTA) (Falck, 1962). SNc neurons mostly project into the dorsal striatum and are classically associated with the development and selection of motor function (Hodge and Butcher, 1980). Neurons in the VTA extend mostly into the ventral striatum, including the nucleus accumbens (NAc), as well as some cortical regions, and they are classically associated with acquisition reward-mediated behaviors (Morales and Margolis, 2017). Both populations of neurons contain pools of dopamine-filled synaptic vesicles throughout their axons, typically of 40–50 nm diameter, although larger vesicles are also present, particularly at apparent en passant presynaptic varicosities (Arluison et al., 1984). Upon depolarization, the vesicles fuse with the axonal membrane to release their contents at various points along the axon from sites that often appear to have limited presynaptic and postsynaptic specialization; this stands in contrast to the morphology of classical synaptic terminals at motor endplates or pyramidal projection neurons that innervate dendritic spines (Cragg et al., 2004; Rice et al., 2011). In the dorsal striatum and NAc, most of these dopamine synaptic vesicle clusters appear near the neck of dendritic spines, which would be consistent with a role in modulating the synapses of pyramidal neurons.
Imbalances in dopamine neurotransmission are implicated in the pathogenesis of a myriad of psychiatric and neurological disorders, including schizophrenia, Parkinson’s disease (PD), autism, depression, drug dependence, and attention deficit disorders (Bohnen and Albin, 2011; Dunlop and Nemeroff, 2007; Howes and Kapur, 2009), and these diseases are treated by various drugs that regulate dopamine neurotransmission. However, except for the motor symptoms of PD, which are strongly linked to a loss of the neurons of the SNc, the roles of dopamine synapses in these disorders are unknown. All of these are pervasive public health issues; yet, understanding, diagnosing, and treating these disorders is limited by our ability to effectively analyze dopamine neurotransmission, particularly at the level of the synapse (Abi-Dargham and Horga, 2016). Such analysis requires the development of imaging approaches.
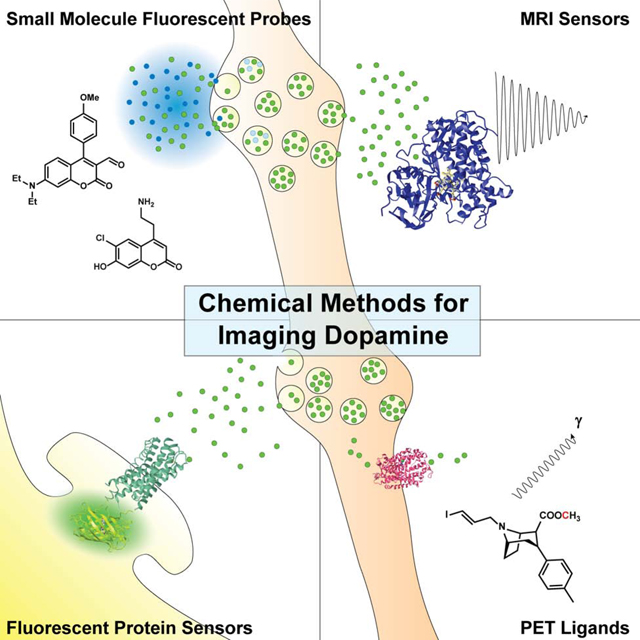
Over the past decade, many novel approaches to imaging dopamine release have been developed, some introducing entire new classes of molecules or elegant uses of chemical biology. This review is intended to provide a broad survey of the molecules and methods currently in use, including small molecules, nanoparticles, and biomolecules that are detected by fluorescence microscopy, positron emision tomography (PET) imaging, and magnetic resonance spectroscopy/imaging (MRS/MRI). While these techniques and modalities (summarized in Table 1) are quite diverse, they all take advantage of aspects of the basic biology of the dopaminergic system.
Table 1:
Summary of Dopamine Sensing Modalities
| Modality | Description | Spatial Resolution / Level of Analysis | Temporal Resolution | Advantages | Limitations |
|---|---|---|---|---|---|
| Microdialysis | A small dialysis probe is surgically implanted into the brain and analytes are collected over time | mm-cm / brain regions (e.g. dorsal lateral striatum) | seconds - minutes | HPLC separation allows complete analysis of small molecules within dialysate; can be used in an awake, behaving, free moving animal | Poor spatiotemporal resolution |
| FSCV | A redox electrode is inserted into slice or surgically implanted and the concentration of dopamine is electrochemically measured | mm / brain region; specific circuits if coupled with electro- or optogenetic stimulation | milliseconds | High temporal resolution; can be used in acute brain slice or behaving animals | Poor spatial resolution; difficult to implement in vivo |
| Fluorescent Microscopy | Small molecule- or protein-based sensors are used to indirectly monitor or measure dopamine release in slice or culture | μm - mm / synapses (e.g. release sites, cell bodies and projections) | milliseconds - seconds | High spatiotemporal resolution; diverse set of fluorescent dyes and protein sensors | Low biopenetrance and small wavelengths can be phototoxic; limited use in vivo |
| 2P Microscopy | Fluorescent sensors are imaged using two-photon excitation, typically at twice the wavelength | μm - mm / synapses | milliseconds - seconds | Longer wavelengths used in 2P allow higher biopenetrance and less phototoxicity; in vivo imaging is possible | Expensive and complicated to implement; biopenetrance is still limited to 10s – 100s of μm; incompatible with FRET sensors |
| Fiber Photometry | A fiberglass fluorescence probe is surgically implanted into the brain; changes in fluorescence intensity of genetic probes are measured over time | mm / brain region; specific circuits | milliseconds - seconds | Protein sensors can be used in vivo in behaving animals; widely adaptable in labs already measuring GCaMP | Limited spatial resolution |
| PET | Positron-emitting ligands can target specific receptors in order to monitor dopaminergic activity | mm / brain region | minutes | High sensitivity (i.e. small amount of ligand needed) with a diverse set of ligands; can be used in humans and coupled with behavior | Ligands are expensive, difficult to synthesize, and can have short half-lives; poor spatiotemporal resolution, impossible to resolve ligand signal from its metabolite signal |
| MRI | Magnetic resonance is used to image endogenous dopamine metabolites or exogenous MR-active ligands | sub-mm - mm | milliseconds - seconds | Potentially non-invasive, can be used in humans and coupled with behavior; ligands can be used to increase spatiotemporal resolution or highlight specific structures | Information is largely structural and not functional |
| MRS | Magnetic resonance is used to generate spectra that can identify specific metabolites and their relative concentrations | mm-cm | seconds - minutes | Can identify and resolve multiple molecules and their relative concentrations within the same voxel, including ligands from their respective metabolites | Highly specialized technique, lower spatiotemporal resolution than MRI and PET; certain nuclides (13C, 15N, and 31P) can have very long scan times |
Dopaminergic System and Non-imaging Approaches
Dopamine is synthesized in the cytosol from tyrosine, which is first hydroxylated by tyrosine hydroxylase (TH) to form L-DOPA and then decarboxylated by aromatic amino acid decarboxylase (AADC), as shown in Figure 1 (Molinoff and Axelrod, 1971). As mentioned, dopamine is stored in synaptic vesicles that cluster throughout the axon, often in apparent varicosities (Gaugler et al., 2012; Pereira et al., 2016). The synaptic vesicles are loaded by the vesicular monoamine transporter (VMAT2), which exchanges two protons for one monoamine: this transporter is promiscuous in that it transports not only dopamine but also serotonin, NE, drugs and metabolites such as tyramine (an observation that introduced the term “false transmitters” by Irwin Kopin), amphetamine, and some neurotoxins (Fischer et al., 1965). The pH gradient that VMAT2 relies on is established by the vacuolar ATPase in the vesicular membrane (Edwards, 2007; Knoth et al., 1981; Lohr et al., 2017). After release, dopamine is either metabolized by monoamine oxidase (MAO) or accumulated back into the neuronal cytosol through the dopamine active transporter (DAT) where it can be repackaged into synaptic vesicles by VMAT2 (Hersch et al., 1997).
Figure 1. Dopamine Pathways.

The biosynthetic, metabolic, and redox pathways of dopamine
As dopamine does not activate ionotropic receptors, its release cannot be straightforwardly detected by recording from a post-synaptic neuron using whole-cell electrophysiological recordings, the standard means by which glutamate or GABA release has been estimated. Instead, intensive research over several decades yielded two different non-imaging methods to study dopamine release.
Brain microdialysis is used to monitor dopamine release in awake behaving rats and was developed primarily by Urban Ungerstedt (Chefer et al., 2009; Justice, 1993). Here, a probe that contains a small stretch of microdialysis tubing is implanted and a cerebrospinal fluid-like solution is pumped through. Neurotransmitters and other molecules diffuse into the tubing, which is connected to an HPLC for monitoring the contents by electrochemical or mass spectrometry detection. This technique can be used to measure dopamine release on the timescale of minutes. Microdialysis is limited by low spatiotemporal resolution, which is due to the size of the probe, its surrounding dead-space, and a slow sample collection rate. For example, microdialysis has been used extensively to study reward-mediated behaviors such as drug addiction, and demonstrated an increase in extracellular dopamine but missed forms of rapid plasticity that were later detected by techniques with greater spatiotemporal resolution (Torregrossa and Kalivas, 2008),
The second technique takes advantage dopamine’s redox properties to measure release. Dopamine can be reversibly oxidized to dopamine-o-quinone (Figure 1) and is therefore amenable to amperometry and cyclic voltammetry. Fast-scan cyclic voltammetry (FSCV), introduced by Ralph “Buzz” Adams, Zygmunt Kruk, and Julian Millar, uses an electrode embedded amongst dopamine axons (Stamford et al., 1984). A major improvement in the technique was the introduction of the carbon fiber electrode by Francois Gonon (Gonon et al., 1980). Typically, the FSCV electrode applies a constant train of triangular voltage ramps from −0.4 to 1.0 V and back. The current measured at 0.6 V, the peak oxidation potential of dopamine, is proportional to the concentration of dopamine present (Robinson et al., 2003). Due to its ability to measure extracellular concentrations as low as 50 nM at a sampling rate of 10 Hz, FSCV offers a vast improvement in temporal resolution compared to microdialysis, and has been a major workhorse for studying dopamine release in rodent primary dopamine neuron culture and acute brain slice. Work from Regina Carelli and Mark Wightman’s labs developed in vivo FSCV to couple the analysis of dopamine release with behavior. For example, rapid changes in dopamine concentration were observed in the NAc at different stages of cocaine-taking behavior in rats, and this behavior could be recapitulated by electrically stimulating the same area to induce dopamine release (Phillips et al., 2003).
Constant potential amperometry, a technique closely related to FSCV, is sensitive and rapid enough to detect the release of dopamine from the fusion of synaptic vesicles from an individual presynaptic site; it was used to observe the “quantal” release of 10,000 molecules of dopamine in less than 100 μsec (Staal et al., 2004). Many additional discoveries and advances have been made with these electrochemical approaches, as recently reviewed by Roberts and Sombers (Roberts and Sombers, 2018). Furthermore, advances continue to be made in FSCV technology, from new fiber coatings to novel strategies to induce dopamine release (Rodeberg et al., 2017).
A downside of the electrochemical approaches is the limited spatial resolution in intact tissue, which is required to analyze how dopamine release is governed by release site properties or interactions on a synaptic scale. Additionally, electrochemical techniques are quite invasive when performed in vivo, making them difficult to translate into clinical research; although not impossible, as FSCV has been performed during open-brain surgery to demonstrate a relationship between dopamine and reward prediction error (Kishida et al., 2011, 2016).
In contrast, imaging techniques offer exquisite spatial resolution, in some cases without sacrificing temporal resolution. Ideally, dopamine could be mapped by directly observing it, as glutamate and GABA can be using MRS; however, dopamine’s brain concentration is orders of magnitude lower than glutamate and GABA, and this approach remains elusive (Rothman et al., 1993). Instead, the proteins involved in the life cycle of dopamine – TH, AADC, VMAT2, and DAT – as well as the dopamine receptors and dopamine itself can serve as targets for molecules that can then be imaged by a method appropriate for the experimental model at hand.
Fluorescent Approaches (Optical Dopamine Sensors)
As established by the classical studies from Falck, Hillarp, and colleagues, fluorescent microscopy offers spatial resolutions that provide synapse- and circuit-level detail. Ideally, dopamine would be imaged directly, as it has a fluorescence excitation peak at 280 nm and an emission maximum of 315 nm; however, light at this ultraviolet wavelength is phototoxic (Wang, 2002). Two-photon (2P) microscopy – in which the fluorophore absorbs two lower-energy photons to reach an excited state – may provide a potential work-around, and there are publications that use 2P to observe dopamine release by exciting at 540 nm in mouse slice (Bera et al., 2018; Sarkar et al., 2014). However, even with the 2P approach, this excitation wavelength can cause photodamage and lacks sufficient biopenetrance needed to image dopamine in vivo. Indeed, to observe a useful signal, the authors had to place their photomultiplier detector directly over the slice. Klioutchinikov et. al. recently developed a head-mounted three-photon microscopy system in rats, which they use to image a fluorescent calcium sensor (GCaMP, discussed below) (Klioutchnikov et al., 2020). Watt Webb and colleagues have shown serotonin can be imaged in cell culture natively using 3P excitation, so it may be possible to use such a system to image dopamine directly as well (Maiti, 1997).
While the direct observation of dopamine release would be ideal, multiple approaches have been developed to image dopamine indirectly. These novel techniques involve fluorescent sensors that either co-transit with dopamine through the synaptic vesicle cycle or reversibly bind to dopamine resulting in a change in fluorescence; they are depicted in Figure 2 and summarized in Table 2 (Beyene et al., 2019a; Sames et al., 2013; Wang et al., 2018).
Figure 2. Fluorescent Approaches.

A schematic of the different fluorescent techniques used to image dopamine in the brain and the corresponding chemical structures of the small molecule dyes referenced throughout this review
Table 2.
Summary of fluorescent dopamine sensors
| Name | Category | Functionality / excitation wavelength | Target | Advantages | Limitations |
|---|---|---|---|---|---|
| Dopamine (self) | 2P microscopy/540 nm | direct detection of dopamine | low biopenetrance, sensitivity | ||
| Acridine orange | small molecule | fluorescence microscopy/460 nm | acidic compartments (synaptic vesicles) | pH sensitive; can detect release | only reported in cell culture; not specific to dopamine |
| FM1–43 | small molecule | fluorescence microscopy/472 nm | cell membrane (synaptic vesicles, post-stimulation) | labels recycling vesicle pool | not neurotransmitter specific |
| FM4–64 | small molecule | fluorescence microscopy/515 nm | cell membrane (synaptic vesicles, post-stimulation) | red, can be used in conjunction with blue and green sensors | not neurotransmitter specific |
| NeuO | small molecule | fluorescence microscopy/468 nm | live neurons | can be used in vivo; reported in mice and zebrafish | not neurotransmitter specific |
| FFN511 | small molecule | fluorescence microscopy/406 nm; 2P/760 nm | DAT and VMAT2 | selective for dopamine axons | less specific than later FFNs; most FFNs are limited to practical use ex vivo |
| FFN102 | small molecule | fluorescence microscopy/406 nm; 2P/760 nm | DAT and VMAT2 | pH sensitive; can detect release | not as bright when stored in vesicles |
| FFN200 | small molecule | fluorescence microscopy/406 nm; 2P/760 nm | VMAT2 | DAT independent, can detect silent synapses | longer incubation period and wash than other FFNs |
| FFN270 | small molecule | fluorescence microscopy/406 nm; 2P/760 nm | NET, DAT, and VMAT2 | pH sensitive; can detect release; has been used in vivo | more potent at NET than DAT |
| FFN206 | small molecule | fluorescence microscopy/406 nm; 2P/760 nm | DAT, VMAT1, and VMAT2 | useful for high- throughput studies, and fly imaging | less effective in mice |
| APP+ | small molecule | fluorescence microscopy/416 nm; 2P/800 nm | DAT, NET, SERT | good monoamine sensor/high-throughput studies | not DA specific; labels mitochondria |
| NS521 | small molecule | fluorescence microscopy/488 nm | monoamines | survives fixation | not DA specific |
| ES517 | small molecule | fluorescence microscopy/488 nm | monoamines | adds pH sensitivity to NS521, can image release | not DA specific |
| nIRCat | nanoparticle | fluorescence microscopy/785 nm; 2P/1600 nm | dopamine, norepinephrine | near-IR sensor allows high biopenetrance; DNA sequence is tunable | not widely available; requires intracranial injection |
| CNiFER | HEK cell/protein sensor | fluorescence microscopy and fiber photometry/436 nm (FRET) | dopamine | does not require genetic manipulation | requires exogenous cell implant |
| DopR-Tango | genetic protein sensor | Postmortem analysis | D1R activation | good spatial resolution for post-synaptic analysis | requires 48 h postexcitation analysis |
| Name | Category | Functionality/excitation wavelength | Target | Advantages | Limitations |
| dlight/GRABDA | genetic protein sensor | fluorescence microscopy and fiber photometry/488 nm | Dopamine | Easy to introduce into mice and analyze dopamine release during behavior; newer generations come in red | newer approach, less characterized |
| VoLDeMo | targeted voltage-sensing dye | 2P microscopy/920 nm | DAT; changes in voltage | can sense changes in voltage in DAT-expressing membranes (axons) | targeted probes have less dynamic range than untargeted voltage-sensing dyes |
| Voltron | genetic voltage- sensing protein + small molecule | fluorescence microscopy (FRET)/variable | changes in voltage | allows for fine experimental control based on which halo-tag dye is used | FRET approach is not amenable to 2P microscopy |
Small Molecule Approaches
Rather than image dopamine directly, efforts have been made to track its transit through the vesicle cycle using fluorescent small molecules. Taking advantage of the acidic pH of vesicles established by ATPase and used by VMAT to transport dopamine, the fluorescent weak base acridine orange (AO) was one of the first tools used to image and characterize large secretory vesicles in adrenal gland-derived chromaffin cells (Kuijpers et al., 1989; Steyer et al., 1997; Sulzer and Holtzman, 1989). AO gains an excitation peak at 460 nm at low pH: after diffusing across the membrane into an acidic compartment, it is protonated and cannot diffuse outward. Inducing cells to release the contents of their synaptic vesicles causes AO to enter a pH-neutral environment, resulting in a decrease in fluorescence. This technique was used in mast cells that secrete serotonin to prove that both full exocytosis and more transient ‘kiss-and-run’ occur, in this case at a one-to-two ratio (Williams and Webb, 2000). Another report using AO showed that applying a weak base drug such as chloroquine or amphetamine decreases fluorescence, indicating a collapse in the pH gradient.(Sulzer and Rayport, 1990)
The endocytic probe, FM1–43 (Figure 2, sensor 2), provided a major innovation for imaging neurotransmitter release, as recently reviewed by Wong et al (Wong et al., 2015). This hydrophilic dye binds to the outer surface of the cell membrane via its nonpolar dibutylamino group. When applied to axons that are then stimulated, the probe is taken up into the lumen of synaptic vesicles following endocytosis, and in the acute brain slice, an ADVASEP-7 wash is used to remove non-specific labeling, effectively labeling the recycled vesicle pool (Betz and Bewick, 1992). After a subsequent stimulus, the recycling synaptic vesicles fuse again to the cell membrane, allowing the dye to diffuse into the extracellular membrane, thereby decreasing total fluorescence intensity. Importantly, FM1–43 does not specifically label particular neurotransmitter systems; rather, it concentrates amongst any recycling synaptic vesicle pool after the first stimulation. Therefore, in order to make conclusions about any dopamine-related activity, the dye must be co-imaged with some sort of dopamine marker. For example, Jomphe et al. use FM4–64, a red-shifted FM1–43 analogue, in a mouse expressing GFP driven by the TH promotor (TH-GFP), which specifically labels dopaminergic axons, to study exocytosis in primary dopaminergic culture (Jomphe et al., 2005). Another non-specific approach uses the dye NeuO, which selectively labels live neurons in vivo – studies in mice and zebrafish have been published – but does not discriminate between neurotransmitter types, and therefore requires post-hoc analysis or colocalization with a dopaminergic marker (Er et al., 2015; Chai Lean Teoh et al., 2015).
The fluorescent false neurotransmitter (FFN) approach (Figure 2, sensor 1), developed by the Sames and Sulzer labs, has been used to image specific neurotransmitter accumulation and release. The dopaminergic FFNs consist of a coumarin scaffold substituted with an amino-ethyl group thought to confer VMAT2- and in some cases DAT-recognition. The first of these probes developed, FFN511, effectively accumulated in synaptic vesicles in acute mouse brain slice, appearing as puncta that colocalized with TH-GFP. Puncta formation could be blocked by both VMAT2 and DAT inhibitors, and the puncta disappeared following electric stimulation or application of amphetamine in slice (Gubernator et al., 2009; Zhang et al., 2009). More recently, FFN511 was imaged in chromaffin granules using stimulated emission depletion (STED) microscopy to monitor vesicle shrink-fusion.(Shin et al., 2020) FFN511, however, is relatively non-selective compared to later generations of FFN and labels additional non-dopaminergic synapses. A more selective probe, FFN102, was designed to be pH-sensitive by utilizing chlorine and hydroxy ring substituents. With a pKa of 6.2, the probe is protonated when sequestered in acidic synaptic vesicles and deprotonated when in the cytoplasm or extracellular milieu (Lee et al., 2010; Rodriguez et al., 2013). The deprotonation introduces a new resonance form with increased fluorescence. When synaptic vesicles fuse to release FFN102, such as in response to electric stimulation or application of a secretagogue, this is observed as an optical “flash”.
FFN200, a substrate for VMAT2 but not DAT, offered a DAT-independent way of loading dopaminergic synaptic vesicles, making it useful in both the brain slice and dopaminergic primary neuronal culture (Pereira et al., 2016). The lack of pH-dependence is also useful for tracking the probe during both dopamine storage and release, as it maintains constant brightness through the entire cycle. FFN200 provided the observation of presynaptically silent synapses – axonal varicosities that accumulate FFN but do not form active release sites – in the lateral dorsal striatum and subsequently the globus pallidus (Meszaros et al., 2018; Pereira et al., 2016). Dopamine release ‘hot spots’ had previously been theorized based on FSCV experiments exploring ethanol- and sucrose-directed behaviors (Cacciapaglia et al., 2011; Robinson et al., 2009), and these FFN experiments offer an example of the insights gained when imaging at the scale of individual synapses using fluorescence microscopy.
FFN270 is more selective for the norepinephrine transporter (NET) than DAT, but it is transported by both as well as by VMAT2 (Dunn et al., 2018), and it is pH-sensitive like FFN102 (and ES517, see below). It has been used to image cortical NE neurotransmission in vivo using 2P microscopy at a cranial window, demonstrating release in response to both electrical stimulation and amphetamine (Dunn et al., 2018). Imaging striatal dopamine release in vivo using a cranial window is complicated by the need to deliver FFN to the striatum of a living mouse while simultaneously imaging such a deep structure, but is feasible.
Fluorescent probes of the dopamine system can also be useful for high throughput bioassays. FFN206 and APP+, a fluorescent analog of the toxin MPTP (available from Molecular Devices as their Neurotransmitter Transporter Uptake Assay Kit), have been developed as VMAT- and DAT-specific fluorescent probes (Bernstein et al., 2012; Hu et al., 2013; Karpowicz et al., 2013). While originally reported to be only DAT-specific, APP+ has been used in medium- and high-throughput assays that identified novel VMAT1 and VMAT2 inhibitors along with FFN206 (Bernstein et al., 2012). Additionally, FFN206 has been useful for Drosophila imaging as well as VMAT1 structure-function studies (Freyberg et al., 2016; Sato et al., 2019).
The Neurosensor dyes (Figure 2, sensor 4), developed by Timothy Glass’ lab, offer a somewhat different method from FFNs, in that these probes selectively bind to monoamine neurotransmitters within the synaptic vesicle, which results in a large increase in fluorescence. The first iteration, NS521, was used to image NE, dopamine, and glutamate release in acute mouse brain slice (Hettie et al., 2013). The next generation, Exosensor or ES517, features pH-sensitivity, so that it is only fluorescent when bound to neurotransmitter and in a pH-neutral environment and is therefore useful for imaging exocytosis (Klockow et al., 2013).
Notably, these dyes have faced hurdles for use in vivo, as they mostly operate in the blue-green range of the spectrum, which often causes photodamage and lacks biopenetrance. These challenges could be addressed in part by red shifting these small molecule dyes toward more biopenetrant near-infrared (IR) excitation wavelengths (800–122 nm). A near-IR Neurosensor selective for serotonin, NS715, was reported in 2016, but no small molecule DA sensor has been reported at these wavelengths (Hettie and Glass, 2016). Instead, nanoparticle sensors have filled this niche.
The Nanoparticle Approach
Nanoparticles offer a broader palate of functionality and photophysical properties than small molecules. There is a plethora of examples of probes where a graphene oxide or quantum dot core is functionalized to react specifically with dopamine, resulting in a decrease in fluorescence. Kamal Eddin and Wing Fen recently reviewed many of these probes with a focus on the engineering principles involved (Kamal Eddin and Wing Fen, 2020) Most are intended to serve as a lab-on-a-chip sensor component, including one where tyrosinase was immobilized on a quantum dot to achieve selective dopamine-induced fluorescent quenching (Arkan et al., 2019). Only a few nanoparticle probes have been tested in cells, such as in a recent report where graphene oxide was functionalized with tyrosine and iron and could detect dopamine in cell culture via fluorescence quenching (Jeon et al., 2019). Other nanoparticle probes have used surface plasmon resonance or Raman scattering to detect the presence of dopamine and other neurotransmitters (Choi et al., 2014; Pathak and Gupta, 2019; Yu et al., 2018).
Carbon nanotubes are promising for detecting specific neurotransmitter release; work originating in the Strano lab on near-IR catecholamine sensors (nIRCatS, Figure 2, sensor 3) provides an elegant example (Beyene et al., 2019b). The nIRCatS consist of a single-walled carbon nanotube functionalized by single stranded DNA that experiences more than a ten-fold increase in fluorescence in the presence of dopamine. This change is specific for dopamine – GABA, glutamate and acetylcholine do not generate a change in fluorescence, while NE does but with a maximal response and affinity that is much lower than DA and therefore not problematic – in a sequence-dependent manner, with (GT)6 showing the greatest selectivity for dopamine (Kruss et al., 2014). The sequence can be changed to select for other neurotransmitters, such as serotonin (Jeong et al., 2019). The mechanism remains unsolved, but experiments have ruled out dopamine forming a covalent bond to the probe or reactive oxygen species playing a role. A redox mechanism or π-π interactions between the DNA bases and the catechol ring of dopamine remain plausible (Beyene et al., 2018). nIRCatS have been used to image dopamine in brain slice from wild-caught mice, demonstrating its use as an alternative to genetically introduced dopamine sensors and applicability across species (Beyene et al., 2019b).
Genetically Targeted Protein Sensor Approaches
Genetically targeted fluorescent protein sensors in neurons have been in wide use since the first report of GCaMP by Nakai, Ohkura and Imoto in 2001 (Nakai et al., 2001). The GCaMP construct is a circularly permutated green fluorescent protein (cpGFP) fused to the calcium-binding motif of calmodulin on the C-terminal end, and its binding partner, myosin light chain RS20 peptide, on the N-terminal end (Sun et al., 2013). When calcium is present, the resulting structural change in the calmodulin portion forces the GFP into a fluorescent conformation (Wang et al., 2008). The GCaMP family (there are now at least 10 generations in multiple colors) has become a workhorse for studying neuronal activity in culture, in slice, and in vivo, using either head-fixed microscopy or free-moving fiber photometry, wherein an optical fiber is implanted in the brain that can measure fluorescence (Girven and Sparta, 2017). Dopamine release can be inferred by targeting GCaMP expression to SPNs, which upon exposure to dopamine, experience a change in intracellular calcium (Calipari et al., 2016; Muir et al., 2018).
Cell-based neurotransmitter fluorescent engineered reporters, or CNiFERs (Figure 2, sensor 5), utilized a different calcium protein-based sensor to detect dopamine release. Originally developed to detect acetylcholine, CNiFERs use HEK cells that express a Gq protein-coupled receptor and the FRET-based Ca2+ sensor TN-XXL (Nguyen et al., 2010). In the case of DA-CNiFERs, D2R is transfected in HEK cells that express a modified Gq/i5 protein chimera, which is activated by Gi/o-coupled receptors but recruits the Gq signaling pathway. When dopamine is present, it binds to D2 receptors, activating Gq/i5 and therefore a PLC/IP3 cascade that results in the release of stored Ca2+ (Lacin et al., 2016). The increased cytoplasm calcium concentration induces a conformational shift in TN-XXL that results in an increase in the FRET ratio, ΔR/R. To use CNiFERs in vivo, the HEK cells must be implanted into the brain area of interest, and ΔR/R can be monitored using fiber photometry.
DopR-Tango (Figure 2, sensor 7), used in Drosophila, is a novel dopamine imaging approach which relies on β-arrestin recruitment that occurs after dopamine binds to D1Rs. Here, flies are genetically modified to express three constructs: a TEV-protease fused to β-arrestin, D1R linked to the LexA transcription factor via a TEV-protease cleavage site, and a Lex-A promotor-driven membrane-bound GFP reporter gene. When dopamine is present, it binds to the modified D1R, causing β-arrestin-TEV recruitment, which in turn breaks the TEV cleavage site linkage, releasing LexA and driving GFP expression (Inagaki et al., 2012). Forty-eight hours after inducing expression of these genes, GFP expression was observed in the β and γ lobes of the mushroom body, a fly brain region innervated by dopaminergic neurons. In flies that were administered SCH23390, a D1R antagonist, GFP expression was significantly reduced.
Over the last decade, the cpGFP-calmodulin strategy was adapted for the direct detection of neurotransmitter release. The first example of this strategy was iGluSnFR, which replaced the calmodulin domain of GCaMP with a glutamate-binding domain, and this approach has since been optimized for higher sensitivity and greater temporal resolution in addition to blue, cyan, green, yellow, and red variants (Marvin et al., 2013, 2018; Wu et al., 2018).
More recently, the approach was adapted for dopamine. Two similar constructs have been introduced: the dLight sensors from the Tian lab and the GRABDA sensor from the Li lab (Figure 2, sensor 6). dLight consists of a dopamine receptor with cpGFP taken from a GCaMP6 sensor inserted into the third intracellular loop, so that the GFP fluorescence increases when dopamine is bound (Patriarchi et al., 2018). The first generation, dLight1.1, used D1R, while dLight1.2 used D4R. dLight1.1 has an EC50 value of 1.3 μM and experiences a change in fluorescence intensity upon activation (ΔF/F) of 182% in response to a single pulse stimulation in mouse slice. Fluorescence is blocked by the D1R antagonist SCH-23390. dLight1.1 and 1.2 have been used as fiber photometry sensors to study heroin addiction and sleep cycles (Corre et al., 2018; Dong et al., 2019). Another variant, dLight1.3, which contains an F129A mutation resulting in an improved ΔF/F of 660% but a higher EC50, was recently used to study effects of thirst on dopamine release (Augustine et al., 2019). It is unclear whether the different dLight1 variants have practical differences; one report combined results from 1.1 and 1.2 after finding no statistical difference (Mohebi et al., 2019).
GRABDA has a similar design but uses cpEGFP inserted into the third intracellular loop of the D2R (Sun et al., 2018). There are two GRABDA variants with EC50 values of 10 nM and 130 nM respectively. Both versions have a ΔF/F of 90% and can be blocked by the D2R antagonists haloperidol and eticlopride but not SCH-23390. The high affinity GRABDA is also responsive to NE, which may complicate attempts to use it in areas of the brain outside the striatum. GRABDA has been used to measure dopamine release in mice using cultured neurons, acute slice, and fiber photometry, and in fruit flies and zebrafish.
Both dLight and GRABDA are exciting developments that continue to evolve; recent studies have introduced a red fluorescent protein variant for each, as well as versions that can sense other neurotransmitters, allowing complex neurotransmitter interactions to be studied simultaneously (Jing et al., 2020; Nakamoto et al., 2020; Patriarchi et al., 2020; Sun et al., 2020). Most importantly, using these probes in behaving mice is at this point straightforward, as fiber photometry is already in wide use for GCaMP, thus providing a means for dopamine detection adaptable in labs already measuring calcium (Labouesse et al., 2020).
Voltage Sensing Probes
In contrast to measuring dopamine release by sensors within synaptic vesicles or the extracellular space, alternative approaches have inferred activity by measuring the voltage across the membrane, using voltage-sensing probes. The use of these small molecule dyes began in the early 1970’s in turtle retina (Baylor and Fuortes, 1970). This was followed by work in the 80’s, when Grinvald et al. used a merocyanine-rhodamine dye, WW401, which has a π-wire region of the molecule that spans the cell membrane and a more polar fluorescent headgroup (Grinvald et al., 1981). They initially developed these approaches in squid axons and tested them in cell culture and mouse hippocampal slice (Grinvald et al., 1982). Over the last few years, new rhodamine dyes have been developed, such as one from the Miller lab which can achieve −44% ΔF/F per 100 mV (Boggess et al., 2019; Kulkarni et al., 2018). A downside of this class of dyes is that they are not neurotransmitter-specific, and therefore to image dopamine activity, they require genetically expressing a fluorescent marker or co-labeling with a small molecule dye such as an FFN.
The Voltage Dye Molecular Recognition (VoLDeMo, Figure 2, sensor 9) probe aimed to surmount this challenge by linking a voltage-sensitive dye to a cocaine-like DAT anchor. This dye construct was found to label dopamine axon terminals in the striatum specifically, and could sense changes in voltage in DAT-expressing HEK cells that were manipulated with patch-clamp electrophysiology, although change in signal was far lower than the dye alone, at −4.7% ΔF/F per 100 mV (Fiala et al., 2020).
Similar to dLight and GRABDA, an entire class of genetically encoded voltage indicators (referred to as GEVIs in the literature) have been developed to monitor changes in membrane voltage in a targeted way, including the highly optimized ASAP3, somArchon, and Voltron, reviewed recently by Xu et al. and Bando et al. (Bando et al., 2019; Xu et al., 2017). The latter is especially interesting because it utilizes a hybrid genetic/small molecule approach (Abdelfattah et al., 2019). The Voltron sensors (Figure 2, sensor 8) fuse the rhodopsin Ace2N with an intracellular halo-tag. The halo-tag can form covalent bonds with small molecule dyes that contain a bio-orthogonal alkyl-halide group – the authors used JaneliaFluor rhodamine-based dyes. When Ace2N experiences a depolarizing change in membrane potential, its native retinal fluorophore undergoes a reversible increase in absorbance, becoming a FRET acceptor for the nearby halo-tag bonded dye. Thus, a decrease in FRET signal is observed of about −23 % ΔF/F per 100 mV in cultured neurons. In the initial report, Voltron was imaged during in vivo experiments in mice, zebrafish, and the dopaminergic neurons of Drosophila. In a follow-up report, the authors were able to invert the signal to yield an increase in FRET intensity (Abdelfattah et al., 2020). Because they rely on FRET, these probes are impractical for two-photon microscopy (the non-linear optics makes FRET measurements quite challenging)(Tao et al., 2015), an obstacle to their use for in vivo imaging.
MRI and PET Approaches
The fluorescent imaging approaches discussed above provide powerful tools to study model organisms but are not practical for use in humans due to the depth of dopamine neurons within the brain and the limited biopenetrance of UV and visible light. In contrast, MRI, MRS, and PET offer modalities to image the deeper brain structures necessary to assess dopaminergic function in humans.
The direct detection of dopamine by MRS would be an ideal way to quantify dopamine storage and study its release. MRS is similar to MRI in that a subject is placed in a strong magnetic field and nuclei (typically protons) are excited with a radio frequency pulse (Passe et al., 1995). With MRS, additional information is generated in the form of a spectrum, where individual peaks termed chemical shifts and measured in radio frequency or parts per million (ppm) can be assigned to each nucleus (Öngür, 2013; Prost, 2008). The identity and relative concentrations of molecules can be deduced by the heights and ppm values of each peak in the spectrum. MRS is analogous to an organic chemist’s use of NMR to solve the structure of a molecule and has been used successfully for the measurement of several neurotransmitters including glutamate, glutamine, and GABA as well as other important small molecule metabolites such as creatine and phosphocreatine, N-acetylaspartic acid, lactate, choline, and myo-inositol (Bogner et al., 2017). Importantly, MRS signal is directly proportional to the number of nuclei present in the voxel, and therefore metabolites found at lower concentrations or those that lack several nuclei in the same chemical environment (such as the trimethyl group of choline) are impossible to detect with current state-of-the-art instruments. Unfortunately, dopamine falls into both categories; thus, as with the fluorescent approaches, elegant solutions have been developed to detect dopamine and its associated networks using indirect methods.
Early attempts and fluorodopamine
Attempts to image dopamine indirectly by MRI were first published by Kenneth Kirk’s lab at the NIDDK and others at the NIMH in the 1980s. Rather than observing protons, as is typical with MRI, they used 19F-MRS to detect fluorinated dopamine analogs in a false neurotransmitter-like approach. Imaging 19-fluorine (19F) offers several advantages: it has a spin ½ and a gyromagnetic ratio similar to a proton, it is 100% abundant in nature but completely absent from the brain, it experiences chemical shifts over the span of 100 ppm, and standard industry instruments can be used with limited additional equipment (Ruiz-Cabello et al., 2011; Waiczies et al., 2019). The Kirk lab synthesized and characterized 2-, 5-, and 6-fluorodopamine and tested the latter in intact guinea pig neural sacks. They observed chemical shifts at 36.5 ppm (relative to hexafluorobenzene), 37.2 ppm, 36.2 ppm, and 44 ppm, corresponding to 6F-dopamine, 6F-dihydroxyphenylacetic acid (DOPAC, a dopamine metabolite), 6F-NE (NE is metabolized from DA by dopamine-beta-hydroxylase, DβH), and 6F-dihydroxymandelic acid, a NE metabolite (Eisenhofer et al., 1989; Goldberg et al., 1980). Notably, the 6F-dopamine peak had a linewidth twice that of 6F-DOPAC, suggesting it was observed in a much less mobile environment such as within a synaptic vesicle. When the neural sacs were pre-incubated in in reserpine and pargyline, VMAT2 and monoamine oxidase inhibitors respectively, the 6F-dopamine peak had a linewidth and height similar to 6F-DOPAC peak observed in the untreated sacs.
Despite initial promise, because NE and DOPAC were the predominant peaks in these experiments, and due to dopamine’s inability to cross the blood brain barrier (BBB) as well as the lack of sensitivity of the MRIs at the time, this work was abandoned in favor of PET imaging of [18F]-fluorodopamine (Chiueh et al., 1983). 18-fluorine (18F) is a positron-emitting isotope of fluorine that must be synthetically derived and incorporated into probes immediately prior to imaging. [18F]-fluorodopamine presented an especially difficult synthesis requiring 18F-18F gas, until very recently when Vavere et al. published a new route (Vāvere et al., 2018).
[18F]-Dopamine has similar challenges due to a poor penetration across the BBB, but has proven useful in imaging neuroblastoma tumors in which the BBB is damaged, as well as for pheochromocytomas in the adrenal gland (Ilias et al., 2003; Vāvere et al., 2018). Yanagisawa et al. revived the 19F-MRI effort in 2017, publishing a study that imaged eight different fluorinated compounds, and found some success with 19F-L-DOPA using 19F-MRS on PC-12 cell culture (an immortalized adrenal gland cell line that expresses TH and VMAT1) and ex vivo whole brain imaging, but no in vivo studies have been reported (Yanagisawa et al., 2017).
Stemming from this history, the field has been mostly dedicated to developing PET sensors that indirectly measure dopamine capacity by specifically binding to the enzymes, transporters, and receptors for which dopamine is a ligand. Kanthan et al. have written an outstanding perspective and history of the chemistry of these molecules (Kanthan et al., 2017). Here, we focus on the functionality of these PET ligands (Figure 3), organized by target, and discuss recent examples of innovative uses.
Figure 3. PET Approaches.

A schematic of the PET ligands used to image dopamine systems in the brain with their corresponding chemical structures; note that red-colored atoms represent their positron-emitting isotopes, i.e. 11C, 18F, and 123I respectively.
Dopamine Receptor Ligands
The most widely used PET ligand for imaging dopamine release is [11C]-raclopride, a D2R antagonist and antipsychotic drug (Ehrin et al., 1985; Farde et al., 1986). Raclopride quantifies dopamine release by acquiring images of the striatum before and immediately after amphetamine administration (Ross and Jackson, 1989). The first image provides a baseline level of D2R binding. The amphetamine causes high levels of dopamine release and inhibits reuptake (Sulzer et al., 2005), and the extracellular dopamine competes with raclopride at the D2R ligand-binding site. The second scan quantifies how much raclopride remains bound to the D2Rs and therefore indirectly measures how much dopamine was released. Subjects with greater dopamine release capacity exhibit a larger decrease in [11C]-raclopride signal following the amphetamine challenge. This technique has been used for studying multiple disorders and behaviors, most prominently schizophrenia, wherein elevated dopamine release has been observed compared to control subjects (Abi-Dargham, 2020; Laruelle et al., 1996). In addition to amphetamine, other stimuli have been explored. Lippert et al. report using milkshakes in place of amphetamine and imaged dopamine release on a sub-second timescale (Lippert et al., 2019). Cox et al. measured dopamine release by merely exposing habitual cocaine users to cues they associate with taking cocaine (Cox et al., 2017).
A different technique can be used where the second scan is acquired much later after the amphetamine challenge, as a way of measuring D2R internalization following a stimulus (Skinbjerg et al., 2010). Here, a second bolus of raclopride is administered before the post-amphetamine image is taken. With this approach, a decrease in signal is not related to the amount of dopamine that was released, but to the level of receptor internalization that occurred.
For regions where dopamine release is sparse, higher-affinity D2R PET ligands have been developed. These include [18F]-fallypride, [11C]-FLB-457, and [11C]-MNPA, the latter of which is actually selective for the high-affinity D2R isoform (Farde et al., 1997; Hernaus and Mehta, 2016; Seneca et al., 2008). The first two have been used to image D2Rs in the cortex: Aalto et al. used [11C]-FLB457 to measure extrastriatal dopamine release in response to amphetamine, while Ceccarini et al. measured task-induced striatal and cortical dopamine release with [18F]-fallypride (Aalto et al., 2009; Ceccarini et al., 2012).
Similar approaches have been attempted using D1R ligands. An early attempt used an isotope of a common D1R antagonist, [11C]-SCH23390, but the ligand was not replaced by dopamine as is raclopride (Chou et al., 1999). [11C]-N-methyl-NNC01–0259 is better at labeling D1Rs, but also fails to measure dopamine release (Finnema et al., 2013). D3R ligands, such as [11C]-PHNO, are useful for imaging the NAc where that receptor is more prevalent. Examples include a study of impulse control disorder in PD patients – those with symptoms had 20% lower [11C]-PHNO signal than those without – as well as the effect of the atypical antipsychotic cariprazine in schizophrenia patients (Girgis et al., 2016; Payer et al., 2015).
AADC, VMAT2, and DAT ligands
Whereas the PET ligands discussed above have focused on postsynaptic targets, a great deal of work has also gone into imaging presynaptic processes by targeting AADC, VMAT2, and DAT. Indeed, a recent review by Kaasinen and Vahlberg contains a meta-analysis of 142 such studies in PD (Kaasinen and Vahlberg, 2017).
[18F]-L-DOPA is converted to [18F]-dopamine by AADC as the rate-limiting step, prior to transport into synaptic vesicles. Therefore, lower PET signal with [18F]-DOPA is due to lower AADC concentrations and indicates a decreased capacity for dopamine synthesis. For example, [18F]-L-DOPA was administered to chronic cannabis users and AADC activity was inversely correlated to a measure of apathy (Bloomfield et al., 2014). [18F]-L-DOPA was also used to track the efficacy of stem cell grafts in PD patients over the course of a year, and indicated an increase in dopamine synthesis capacity over time (Ma et al., 2010).
A major disadvantage to [18F]-L-DOPA, and PET, is that the [18F]-DOPA signal is indistinguishable from its metabolic products, including [18F]-dopamine, [18F]-DOPAC, and [18F]-norepinephrine. Therefore, PET signal in the cortex and cerebellum is prevalent due to these metabolites, and signal from the striatum can be difficult to interpret. For this reason, [11C]-Me-mTyr, an AADC ligand which is not metabolized into NE, was recently developed. In monkeys, this probe shows lower cortical and cerebellar signal than [18F]-L-DOPA (Kanazawa et al., 2015; Tsukada et al., 2016).
PET ligands that target DAT have been used to assess the health of dopaminergic axons in the striatum, often to assess the progression of PD. A lower signal is inferred to be the result of less DAT on the axonal membrane, which is a sign of neurodegeneration. Tropanes serve as a common scaffold for the PET ligands such as [11C]-cocaine or [11C]-PE2I. The latter was used to study DAT levels in α-synuclein knockout mice, showing an increased signal in the caudate putamen of these mice compared to wild-type (Levigoureux et al., 2019).
DAT is also a common target for single-photon emission computed tomography (SPECT, a less technically demanding technique similar to PET but with lower resolution) ligands, including [123I]-β-CIT, [18F]- and [123I]-FP-CIT, as well as [11C]-CFT. The N-fluoropropyl-tropanes are the most common DAT ligands: [18F]-FP-CIT, for example, was used to compare PD patients with and without hyposmia, a common early symptom of PD (Oh et al., 2018), and [123I]-FP-CIT (marketed as DaTSCAN) was approved by the FDA for clinical use in 2011 (Park, 2012). DaTSCAN was recently utilized in a case study assessing the impact of SARS-CoV-2 on a PD patient (Méndez-Guerrero et al., 2020).
VMAT2-targeting PET ligands are mostly tetrabenazine derivatives, including [11C]-dihydrotetrabenazine and [18F]-AV-133, which is a fluoro-tripropyl analog. Both tracers have been used to study β-cell masses in pancreatic cancer, as well as tracking the effects of 6-hydroxydopamine in rats over time (Veluthakal and Harris, 2010; Walker et al., 2013; Wang et al., 2010). The latter has also been used with the MPTP mouse model (Toomey et al., 2012) and in PD patients (Okamura et al., 2010).
MRI Contrast Agents
Historically, the imaging field moved from MRI to PET ligands because the technology surrounding PET advanced at a faster rate. With major advances in computing and the arrival of stronger magnets – 14T magnets are now used for small animal experiments, while 9T magnets are beginning to be used with humans – MRI and MRS present major opportunities for creative solutions for imaging dopamine. Two recent approaches suggest what is possible.
One utilizes the paramagnetic iron atom found in the heme group of BM3h, a member of the bacterial cytochrome P450-BM3 family. Shapiro et al. used directed evolution on the enzyme BM3h, which normally metabolizes arachidonic acid, to create analogues that selectively bind to dopamine with Kd values in the micromolar range (Shapiro et al., 2010). In the absence of ligand, water molecules exchange in the empty coordination site, promoting T1 relaxation. When dopamine is present, it binds to this site, blocking water, therefore decreasing T1 relaxation. The authors tested two BM3h variants, BM3h-8C8 and BM3h-9D7, to quantify dopamine release from PC-12 cells. They then directly injected 8C8 into anesthetized rat striatum via cannula, along with either high or low K+ buffer. The rats underwent continuous T1-weighted MRI scans during this time, and a significant change in signal intensity with high K+ was found in voxels surrounding the cannula. The other variant, 9D7, was tested in the NAc in response to electrical stimulation of the medial forebrain bundle (Lee et al., 2014). The 9D7 variant was then imaged simultaneously with blood-oxygen-level-dependent (BOLD) fMRI to compare dopamine release to system-wide brain activity following electric stimulation of the lateral hypothalamus, which projects to the VTA (Li and Jasanoff, 2020). While the BM3h dopamine sensors have only been tested by direct infusion into the brain, because they are proteins, one can imagine system-wide dopamine imaging via genetic engineering.
The second technique uses neuromelanin (NM), the dark pigment for which the SNc and locus coeruleus receive their names, as an MRI contrast agent. NM is the product of the iron-dependent oxidation of dopamine that builds up within autophagic lysosomes over the course of a neuron’s lifespan, and it is only cleared by microglia after cell death occurs (Fasano et al., 2006; Monzani et al., 2019). Notably, NM contains high concentrations of iron chelated by oxidized catechol derivatives and is therefore paramagnetic. The effect is a shortened T1 relaxation time (Tosk et al., 1992; Trujillo et al., 2017). In NM-sensitive MRI protocols, high concentrations of NM appear as higher signal intensity. In healthy patients, the NM signal in the SNc grows more intense with age, but in PD patients, whose dopamine neurons are cleared by microglia as neurodegeneration progresses, the signal decreases over the course of the disease (Sulzer et al., 2018; Zecca et al., 2002). This effect has been shown to occur the locus coeruleus (Sasaki et al., 2006), and the signal intensity has been correlated with DatSCAN PET imaging, although there is some controversy, as Saari et al. reported no correlation between DatSCAN levels and post-mortem NM levels (Saari et al., 2017).
Cassidy and colleagues advanced the technique, showing that NM-MRI signal is indeed correlated to dopamine release capacity (Cassidy et al., 2019). They first demonstrated a relationship between the NM-MRI contrast-to-noise ratio in the SNc and the change in [11C]-raclopride PET intensity in the striatum following a dose of amphetamine. They then compared cerebral activity using fMRI to NM-MRI signal and found that individuals with higher NM-MRI signals had a higher rate of cerebral brain flow. Finally, they compared individuals with a history of psychosis, and found that they were more likely to have higher NM-MRI signals, suggesting that the technique could be a useful biomarker for both PD and psychotic disorders such as schizophrenia. A follow-up to that study applied the technique to participants with cocaine use disorder and found an increased signal compared to participants with no cocaine use (Cassidy et al., 2020). That the technique does not rely on any exogenous small molecules or genetic manipulation also makes it promising for wide use in patients, especially over long timespans, and possibly in children, although their signals are far lower.
Conclusion
The last twenty years have witnessed a boom in the methods available to assess dopaminergic function and health. These methods each have advantages as well as limitations. Fluorescent techniques provide synaptic-level observations and are applicable to a wide range of model cell lines and organisms but are not adaptable to humans. PET techniques offer high sensitivity but lack temporal-spatial resolution and require ligands with short half-lives. MRI techniques can distinguish ligands from their metabolites but are relatively new, less sensitive than PET or fluorescence, and not yet fully optimized for clinical use. Many techniques are undergoing a broad array of innovations and show great promise for the future. As new approaches continue to emerge, direct comparison studies will be important, so that results from these different techniques can be understood in context, and so that the field can eventually coalesce around some common protocols. It is also likely that soon, the limiting factor for imaging dopamine will no longer be the chemical biology required to detect it, but rather the technology necessary to detect and analyze signals. We expect that as computing and detector technology continue to advance, our ability to image dopamine storage and release will increase dramatically.
While the imaging modalities are vastly different, these approaches effectively target the same protein infrastructure involved in dopamine synthesis, storage, release, and reception. As technology continues to improve, direct detection of dopamine may eventually be possible. Until then, creative uses of chemistry and biology for indirect detection provide a broad range of opportunities.
Highlights.
New imaging techniques critical to understanding dopamine disorders are reviewed
The last 20 years have seen many new molecules developed to image dopamine
Fluorescence, MRI, and PET approaches all show promise
Acknowledgements
Our research in this field is supported by the JPB Foundation (1210) and the NIH (R01DA07418, R01MH108186, R01MH122470, and K99MH122659). We thank Ori Lieberman and Mark Wightman for advice and critique on this manuscript.
Footnotes
Declaration of Interests
The authors declare no competing interests.
Publisher's Disclaimer: This is a PDF file of an unedited manuscript that has been accepted for publication. As a service to our customers we are providing this early version of the manuscript. The manuscript will undergo copyediting, typesetting, and review of the resulting proof before it is published in its final form. Please note that during the production process errors may be discovered which could affect the content, and all legal disclaimers that apply to the journal pertain.
References
- Aalto S, Hirvonen J, Kaasinen V, Hagelberg N, Kajander J, Någren K, Seppälä T, Rinne JO, Scheinin H, and Hietala J. (2009). The effects of d-amphetamine on extrastriatal dopamine D2/D3 receptors: a randomized, double-blind, placebo-controlled PET study with [11C]FLB 457 in healthy subjects. Eur. J. Nucl. Med. Mol. Imaging 36, 475–483. [DOI] [PubMed] [Google Scholar]
- Abdelfattah AS, Kawashima T, Singh A, Novak O, Liu H, Shuai Y, Huang Y-C, Campagnola L, Seeman SC, Yu J, et al. (2019). Bright and photostable chemigenetic indicators for extended in vivo voltage imaging. Science 365, 699–704. [DOI] [PubMed] [Google Scholar]
- Abdelfattah AS, Valenti R, Zheng J, Wong A, GENIE Project Team, Podgorski K, Koyama M, Kim DS, and Schreiter ER (2020). A general approach to engineer positive-going eFRET voltage indicators. Nat. Commun. 11, 3444. [DOI] [PMC free article] [PubMed] [Google Scholar]
- Abi-Dargham A. (2020). From “bedside” to “bench” and back: A translational approach to studying dopamine dysfunction in schizophrenia. Neurosci. Biobehav. Rev. 110, 174–179. [DOI] [PubMed] [Google Scholar]
- Abi-Dargham A, and Horga G. (2016). The search for imaging biomarkers in psychiatric disorders. Nat. Med. 22, 1248–1255. [DOI] [PubMed] [Google Scholar]
- Arkan E, Karami C, and Rafipur R. (2019). Immobilization of tyrosinase on Fe3O4@Au core–shell nanoparticles as bio-probe for detection of dopamine, phenol and catechol. JBIC J. Biol. Inorg. Chem. 24, 961–969. [DOI] [PubMed] [Google Scholar]
- Arluison M, Dietl M, and Thibault J. (1984). Ultrastructural morphology of dopaminergic nerve terminals and synapses in the striatum of the rat using tyrosine hydroxylase immunocytochemistry: A topographical study. Brain Res. Bull. 13, 269–285. [DOI] [PubMed] [Google Scholar]
- Augustine V, Ebisu H, Zhao Y, Lee S, Ho B, Mizuno GO, Tian L, and Oka Y. (2019). Temporally and Spatially Distinct Thirst Satiation Signals. Neuron 103, 242–249.e4. [DOI] [PMC free article] [PubMed] [Google Scholar]
- Bando Y, Grimm C, Cornejo VH, and Yuste R. (2019). Genetic voltage indicators. BMC Biol. 17, 71. [DOI] [PMC free article] [PubMed] [Google Scholar]
- Baylor DA, and Fuortes MGF (1970). Electrical responses of single cones in the retina of the turtle. J. Physiol. 207, 77–92. [DOI] [PMC free article] [PubMed] [Google Scholar]
- Beaulieu J-M, and Gainetdinov RR (2011). The Physiology, signaling, and pharmacology of dopamine receptors. Pharmacol. Rev. 63, 182–217. [DOI] [PubMed] [Google Scholar]
- Bera K, Das AK, Rakshit A, Sarkar B, Rawat A, Maity BK, and Maiti S. (2018). Fluorogenic detection of monoamine neurotransmitters in live cells. ACS Chem. Neurosci. 9, 469–474. [DOI] [PubMed] [Google Scholar]
- Berke JD (2018). What does dopamine mean? Nat. Neurosci. 21, 787–793. [DOI] [PMC free article] [PubMed] [Google Scholar]
- Bernstein AI, Stout KA, and Miller GW (2012). A fluorescent-based assay for live cell, spatially resolved assessment of vesicular monoamine transporter 2-mediated neurotransmitter transport. J. Neurosci. Methods 209, 357–366. [DOI] [PMC free article] [PubMed] [Google Scholar]
- Betz W, and Bewick G. (1992). Optical analysis of synaptic vesicle recycling at the frog neuromuscular junction. Science 255, 200–203. [DOI] [PubMed] [Google Scholar]
- Beyene AG, Alizadehmojarad AA, Dorlhiac G, Goh N, Streets AM, Král P, Vuković L, and Landry MP (2018). Ultralarge modulation of fluorescence by neuromodulators in carbon nanotubes functionalized with self-assembled oligonucleotide rings. Nano Lett. 18, 6995–7003. [DOI] [PMC free article] [PubMed] [Google Scholar]
- Beyene AG, Yang SJ, and Landry MP (2019a). Review Article: Tools and trends for probing brain neurochemistry. J. Vac. Sci. Technol. A 37, 040802. [DOI] [PMC free article] [PubMed] [Google Scholar]
- Beyene AG, Delevich K, Bonis-O’Donnell JTD, Piekarski DJ, Lin WC, Thomas AW, Yang SJ, Kosillo P, Yang D, Prounis GS, et al. (2019b). Imaging striatal dopamine release using a nongenetically encoded near infrared fluorescent catecholamine nanosensor. Sci. Adv. 5, eaaw3108. [DOI] [PMC free article] [PubMed] [Google Scholar]
- Bloomfield MAP, Morgan CJA, Kapur S, Curran HV, and Howes OD (2014). The link between dopamine function and apathy in cannabis users: an [18F]-DOPA PET imaging study. Psychopharmacology (Berl.) 231, 2251–2259. [DOI] [PubMed] [Google Scholar]
- Boggess SC, Gandhi SS, Siemons BA, Huebsch N, Healy KE, and Miller EW (2019). New molecular scaffolds for fluorescent voltage indicators. ACS Chem. Biol. 14, 390–396. [DOI] [PMC free article] [PubMed] [Google Scholar]
- Bogner W, Hangel G, Esmaeili M, and Andronesi OC (2017). 1D-spectral editing and 2D multispectral in vivo 1 H-MRS and 1 H-MRSI - Methods and applications. Anal. Biochem. 529, 48–64. [DOI] [PubMed] [Google Scholar]
- Bohnen NI, and Albin RL (2011). The cholinergic system and Parkinson disease. Behav. Brain Res. 221, 564–573. [DOI] [PMC free article] [PubMed] [Google Scholar]
- Cacciapaglia F, Wightman RM, and Carelli RM (2011). Rapid dopamine signaling differentially modulates distinct microcircuits within the nucleus accumbens during sucrose-directed behavior. J. Neurosci. Off. J. Soc. Neurosci. 31, 13860–13869. [DOI] [PMC free article] [PubMed] [Google Scholar]
- Calipari ES, Bagot RC, Purushothaman I, Davidson TJ, Yorgason JT, Peña CJ, Walker DM, Pirpinias ST, Guise KG, Ramakrishnan C, et al. (2016). In vivo imaging identifies temporal signature of D1 and D2 medium spiny neurons in cocaine reward. Proc. Natl. Acad. Sci. 113, 2726–2731. [DOI] [PMC free article] [PubMed] [Google Scholar]
- Cassidy CM, Zucca FA, Girgis RR, Baker SC, Weinstein JJ, Sharp ME, Bellei C, Valmadre A, Vanegas N, Kegeles LS, et al. (2019). Neuromelanin-sensitive MRI as a noninvasive proxy measure of dopamine function in the human brain. Proc. Natl. Acad. Sci. 116, 5108–5117. [DOI] [PMC free article] [PubMed] [Google Scholar]
- Cassidy CM, Carpenter KM, Konova AB, Cheung V, Grassetti A, Zecca L, Abi-Dargham A, Martinez D, and Horga G. (2020). Evidence for dopamine abnormalities in the substantia nigra in cocaine addiction revealed by neuromelanin-sensitive MRI. Am. J. Psychiatry appi.ajp.2020.2. [DOI] [PMC free article] [PubMed] [Google Scholar]
- Ceccarini J, Vrieze E, Koole M, Muylle T, Bormans G, Claes S, and Van Laere K. (2012). Optimized in vivo detection of dopamine release using 18F-Fallypride PET. J. Nucl. Med. 53, 1565–1572. [DOI] [PubMed] [Google Scholar]
- Chai Lean Teoh Er, Cheng Jun, Mukherjee Parag, and Chang Young-Tae (2015). NeuO for neuronal labeling in zebrafish. Tomography 1, 30–36. [DOI] [PMC free article] [PubMed] [Google Scholar]
- Chefer VI, Thompson AC, Zapata A, and Shippenberg TS (2009). Overview of brain microdialysis. Curr. Protoc. Neurosci. 47. [DOI] [PMC free article] [PubMed] [Google Scholar]
- Chiueh CC, Zukowska-Grojec Z, Kirk KL, and Kopin IJ (1983). 6-Fluorocatecholamines as false adrenergic neurotransmitters. J. Pharmacol. Exp. Ther. 225, 529–533. [PubMed] [Google Scholar]
- Choi J-H, Lee J-H, Oh B-K, and Choi J-W (2014). Localized surface plasmon resonance-based label-free biosensor for highly sensitive detection of dopamine. J. Nanosci. Nanotechnol. 14, 5658–5661. [DOI] [PubMed] [Google Scholar]
- Chou Y-H, Karlsson P, Halldin C, Olsson H, and Farde L. (1999). A PET study of D1-like dopamine receptor ligand binding. Psychopharmacology (Berl.) 146, 220–227. [DOI] [PubMed] [Google Scholar]
- Corre J, van Zessen R, Loureiro M, Patriarchi T, Tian L, Pascoli V, and Lüscher C. (2018). Dopamine neurons projecting to medial shell of the nucleus accumbens drive heroin reinforcement. ELife 7, e39945. [DOI] [PMC free article] [PubMed] [Google Scholar]
- Cox SML, Yau Y, Larcher K, Durand F, Kolivakis T, Delaney JS, Dagher A, Benkelfat C, and Leyton M. (2017). Cocaine cue-induced dopamine release in recreational cocaine users. Sci. Rep. 7. [DOI] [PMC free article] [PubMed] [Google Scholar]
- Cragg SJ, Baufreton J, Xue Y, Bolam JP, and Bevan MD (2004). Synaptic release of dopamine in the subthalamic nucleus. Eur. J. Neurosci. 20, 1788–1802. [DOI] [PubMed] [Google Scholar]
- Dong H, Wang J, Yang Y-F, Shen Y, Qu W-M, and Huang Z-L (2019). Dorsal striatum dopamine levels fluctuate across the sleep–wake cycle and respond to salient stimuli in mice. Front. Neurosci. 13, 242. [DOI] [PMC free article] [PubMed] [Google Scholar]
- Dunlop BW, and Nemeroff CB (2007). The role of dopamine in the pathophysiology of depression. Arch. Gen. Psychiatry 64, 327. [DOI] [PubMed] [Google Scholar]
- Dunn M, Henke A, Clark S, Kovalyova Y, Kempadoo KA, Karpowicz RJ, Kandel ER, Sulzer D, and Sames D. (2018). Designing a norepinephrine optical tracer for imaging individual noradrenergic synapses and their activity in vivo. Nat. Commun. 9. [DOI] [PMC free article] [PubMed] [Google Scholar]
- Edwards RH (2007). The neurotransmitter cycle and quantal size. Neuron 55, 835–858. [DOI] [PubMed] [Google Scholar]
- Ehrin E, Farde L, de Paulis T, Eriksson L, Greitz T, Johnström P, Litton J-E, Nilsson JLG, Sedvall G, Stone-Elander S, et al. (1985). Preparation of 11C-labelled raclopride, a new potent dopamine receptor antagonist: Preliminary PET studies of cerebral dopamine receptors in the monkey. Int. J. Appl. Radiat. Isot. 36, 269–273. [DOI] [PubMed] [Google Scholar]
- Eisenhofer G, Hovevey-Sion D, Kopin IJ, Miletich R, Kirk KL, Finn R, and Goldstein DS (1989). Neuronal uptake and metabolism of 2- and 6-fluorodopamine: false neurotransmitters for positron emission tomographic imaging of sympathetically innervated tissues. J. Pharmacol. Exp. Ther. 248, 419–427. [PubMed] [Google Scholar]
- Er JC, Leong C, Teoh CL, Yuan Q, Merchant P, Dunn M, Sulzer D, Sames D, Bhinge A, Kim D, et al. (2015). NeuO: a fluorescent chemical probe for live neuron labeling. Angew. Chem. Int. Ed. 54, 2442–2446. [DOI] [PubMed] [Google Scholar]
- Falck B. (1962). Observations on the possibilities of the cellular localization of monoamines by a fluorescence method. Acta Physiol. Scand. Suppl. 197, 1–25. [PubMed] [Google Scholar]
- Falck B, Hillarp N-Å, Thieme G, and Torp A. (1982). Fluorescence of catechol amines and related compounds condensed with formaldehyde. Brain Res. Bull. 9, xi–xv. [DOI] [PubMed] [Google Scholar]
- Farde L, Hall H, Ehrin E, and Sedvall G. (1986). Quantitative analysis of D2 dopamine receptor binding in the living human brain by PET. Science 231, 258–261. [DOI] [PubMed] [Google Scholar]
- Farde L, Suhara T, Karlsson P, Hietala J, Nakashima Y, Halldin C, and Nyberg S. (1997). A PET-study of [11C]FLB 457 binding to extrastriatal D 2 -dopamine receptors in healthy subjects and antipsychotic drug-treated patients. Psychopharmacology (Berl.) 133, 396–404. [DOI] [PubMed] [Google Scholar]
- Fasano M, Bergamasco B, and Lopiano L. (2006). Modifications of the iron–neuromelanin system in Parkinson’s disease. J. Neurochem. 96, 909–916. [DOI] [PubMed] [Google Scholar]
- Fiala T, Wang J, Dunn M, Šebej P, Choi SJ, Nwadibia EC, Fialova E, Martinez DM, Cheetham CE, Fogle KJ, et al. (2020). Chemical targeting of voltage sensitive dyes to specific cells and molecules in the brain. J. Am. Chem. Soc. 142, 9285–9301. [DOI] [PMC free article] [PubMed] [Google Scholar]
- Finnema SJ, Bang-Andersen B, Jørgensen M, Christoffersen CT, Gulyás B, Wikström HV, Farde L, and Halldin C. (2013). The dopamine D 1 receptor agonist (S)-[11C] N -methyl-NNC 01–0259 is not sensitive to changes in dopamine concentration-a positron emission tomography examination in the monkey brain: (S)-[11C] N –Methyl-NNC 01–0259 in Monkey Brain. Synapse 67, 586–595. [DOI] [PubMed] [Google Scholar]
- Fischer JE, Horst WD, and Kopin IJ (1965). Beta-hydroxylated sympathomimetic amines as false neurotransmitters. Br. J. Pharmacol. Chemother. 24, 477–484. [DOI] [PMC free article] [PubMed] [Google Scholar]
- Freyberg Z, Sonders MS, Aguilar JI, Hiranita T, Karam CS, Flores J, Pizzo AB, Zhang Y, Farino ZJ, Chen A, et al. (2016). Mechanisms of amphetamine action illuminated through optical monitoring of dopamine synaptic vesicles in Drosophila brain. Nat. Commun. 7. [DOI] [PMC free article] [PubMed] [Google Scholar]
- Gaugler MN, Genc O, Bobela W, Mohanna S, Ardah MT, El-Agnaf OM, Cantoni M, Bensadoun J-C, Schneggenburger R, Knott GW, et al. (2012). Nigrostriatal overabundance of α-synuclein leads to decreased vesicle density and deficits in dopamine release that correlate with reduced motor activity. Acta Neuropathol. (Berl.) 123, 653–669. [DOI] [PubMed] [Google Scholar]
- Girgis RR, Slifstein M, D’Souza D, Lee Y, Periclou A, Ghahramani P, Laszlovszky I, Durgam S, Adham N, Nabulsi N, et al. (2016). Preferential binding to dopamine D3 over D2 receptors by cariprazine in patients with schizophrenia using PET with the D3/D2 receptor ligand [11C]-(+)-PHNO. Psychopharmacology (Berl.) 233, 3503–3512. [DOI] [PMC free article] [PubMed] [Google Scholar]
- Girven KS, and Sparta DR (2017). Probing deep brain circuitry: New advances in in vivo calcium measurement strategies. ACS Chem. Neurosci. 8, 243–251. [DOI] [PubMed] [Google Scholar]
- Goldberg LI, Kohli JD, Cantacuzene D, Kirk KL, and Creveling CR (1980). Effects of ring fluorination on the cardiovascular actions of dopamine and norepinephrine in the dog. J. Pharmacol. Exp. Ther. 213, 509–513. [PubMed] [Google Scholar]
- Gonon F, Buda M, Cespuglio R, Jouvet M, and Pujol JF (1980). In vivo electrochemical detection of catechols in the neostriatum of anaesthetized rats: dopamine or DOPAC? Nature 286, 902–904. [DOI] [PubMed] [Google Scholar]
- Grinvald A, Ross WN, and Farber I. (1981). Simultaneous optical measurements of electrical activity from multiple sites on processes of cultured neurons. Proc. Natl. Acad. Sci. 78, 3245–3249. [DOI] [PMC free article] [PubMed] [Google Scholar]
- Grinvald A, Manker A, and Segal M. (1982). Visualization of the spread of electrical activity in rat hippocampal slices by voltage-sensitive optical probes. J. Physiol. 333, 269–291. [DOI] [PMC free article] [PubMed] [Google Scholar]
- Gubernator NG, Zhang H, Staal RGW, Mosharov EV, Pereira DB, Yue M, Balsanek V, Vadola PA, Mukherjee B, Edwards RH, et al. (2009). Fluorescent False Neurotransmitters Visualize Dopamine Release from Individual Presynaptic Terminals. Science 324, 1441–1444. [DOI] [PMC free article] [PubMed] [Google Scholar]
- Hernaus D, and Mehta MA (2016). Prefrontal cortex dopamine release measured in vivo with positron emission tomography: Implications for the stimulant paradigm. NeuroImage 142, 663–667. [DOI] [PubMed] [Google Scholar]
- Hersch SM, Yi H, Heilman CJ, Edwards RH, and Levey AI (1997). Subcellular localization and molecular topology of the dopamine transporter in the striatum and substantia nigra. J. Comp. Neurol. 388, 211–227. [PubMed] [Google Scholar]
- Hettie KS, and Glass TE (2016). Turn-on near-infrared fluorescent sensor for selectively imaging serotonin. ACS Chem. Neurosci. 7, 21–25. [DOI] [PubMed] [Google Scholar]
- Hettie KS, Liu X, Gillis KD, and Glass TE (2013). Selective catecholamine recognition with NeuroSensor 521: A fluorescent sensor for the visualization of norepinephrine in fixed and live cells. ACS Chem. Neurosci. 4, 918–923. [DOI] [PMC free article] [PubMed] [Google Scholar]
- Hodge GK, and Butcher LL (1980). Pars compacta of the substantia nigra modulates motor activity but is not involved importantly in regulating food and water intake. Naunyn. Schmiedebergs Arch. Pharmacol. 313, 51–67. [DOI] [PubMed] [Google Scholar]
- Howes OD, and Kapur S. (2009). The dopamine hypothesis of schizophrenia: Version III--the final common pathway. Schizophr. Bull. 35, 549–562. [DOI] [PMC free article] [PubMed] [Google Scholar]
- Hu G, Henke A, Karpowicz RJ, Sonders MS, Farrimond F, Edwards R, Sulzer D, and Sames D. (2013). new fluorescent substrate enables quantitative and high-throughput examination of vesicular monoamine transporter 2 (VMAT2). ACS Chem. Biol. 8, 1947–1954. [DOI] [PMC free article] [PubMed] [Google Scholar]
- Ilias I, Yu J, Carrasquillo JA, Chen CC, Eisenhofer G, Whatley M, McElroy B, and Pacak K. (2003). Superiority of 6-[ 18 F]-fluorodopamine positron emission tomography versus [ 131 I]-metaiodobenzylguanidine scintigraphy in the localization of metastatic pheochromocytoma. J. Clin. Endocrinol. Metab. 88, 4083–4087. [DOI] [PubMed] [Google Scholar]
- Inagaki HK, Ben-Tabou de-Leon S, Wong AM, Jagadish S, Ishimoto H, Barnea G, Kitamoto T, Axel R, and Anderson DJ (2012). Visualizing neuromodulation in vivo: TANGO-mapping of dopamine signaling reveals appetite control of sugar sensing. Cell 148, 583–595. [DOI] [PMC free article] [PubMed] [Google Scholar]
- Jeon S-J, Choi C, Ju J-M, Lee S, Park JH, and Kim J-H (2019). Tuning the response selectivity of graphene oxide fluorescence by organometallic complexation for neurotransmitter detection. Nanoscale 11, 5254–5264. [DOI] [PubMed] [Google Scholar]
- Jeong S, Yang D, Beyene AG, Del Bonis-O’Donnell JT, Gest AMM, Navarro N, Sun X, and Landry MP (2019). High-throughput evolution of near-infrared serotonin nanosensors. Sci. Adv. 5, eaay3771. [DOI] [PMC free article] [PubMed] [Google Scholar]
- Jing M, Li Y, Zeng J, Huang P, Skirzewski M, Kljakic O, Peng W, Qian T, Tan K, Zou J, et al. (2020). An optimized acetylcholine sensor for monitoring in vivo cholinergic activity. Nat. Methods. [DOI] [PMC free article] [PubMed] [Google Scholar]
- Jomphe C, Bourque M-J, Fortin GD, St-Gelais F, Okano H, Kobayashi K, and Trudeau L-E (2005). Use of TH-EGFP transgenic mice as a source of identified dopaminergic neurons for physiological studies in postnatal cell culture. J. Neurosci. Methods 146, 1–12. [DOI] [PubMed] [Google Scholar]
- Justice JB (1993). Quantitative microdialysis of neurotransmitters. J. Neurosci. Methods 48, 263–276. [DOI] [PubMed] [Google Scholar]
- Kaasinen V, and Vahlberg T. (2017). Striatal dopamine in P arkinson disease: A meta-analysis of imaging studies. Ann. Neurol. 82, 873–882. [DOI] [PubMed] [Google Scholar]
- Kamal Eddin FB, and Wing Fen Y. (2020). Recent advances in electrochemical and optical sensing of dopamine. Sensors 20, 1039. [DOI] [PMC free article] [PubMed] [Google Scholar]
- Kanazawa M, Ohba H, Iwazaki A, Kakiuchi T, and Tsukada H. (2015). Synthesis of 6-[11C]methyl-m-tyrosine ([11C]6MemTyr) for dopamine synthesis imaging in living brain using PET. Bioorg. Med. Chem. 23, 729–734. [DOI] [PubMed] [Google Scholar]
- Kanthan M, Cumming P, Hooker JM, and Vasdev N. (2017). Classics in neuroimaging: Imaging the dopaminergic pathway with PET. ACS Chem. Neurosci. 8, 1817–1819. [DOI] [PubMed] [Google Scholar]
- Karpowicz RJ, Dunn M, Sulzer D, and Sames D. (2013). APP+, a fluorescent analogue of the neurotoxin MPP+, is a marker of catecholamine neurons in brain tissue, but not a fluorescent false neurotransmitter. ACS Chem. Neurosci. 4, 858–869. [DOI] [PMC free article] [PubMed] [Google Scholar]
- Kishida KT, Sandberg SG, Lohrenz T, Comair YG, Sáez I, Phillips PEM, and Montague PR (2011). Sub-second dopamine detection in human striatum. PLOS ONE 6, e23291. [DOI] [PMC free article] [PubMed] [Google Scholar]
- Kishida KT, Saez I, Lohrenz T, Witcher MR, Laxton AW, Tatter SB, White JP, Ellis TL, Phillips PEM, and Montague PR (2016). Subsecond dopamine fluctuations in human striatum encode superposed error signals about actual and counterfactual reward. Proc. Natl. Acad. Sci. 113, 200–205. [DOI] [PMC free article] [PubMed] [Google Scholar]
- Klioutchnikov A, Wallace DJ, Frosz MH, Zeltner R, Sawinski J, Pawlak V, Voit K-M, Russell P.St.J., and Kerr JND (2020). Three-photon head-mounted microscope for imaging deep cortical layers in freely moving rats. Nat. Methods 17, 509–513. [DOI] [PubMed] [Google Scholar]
- Klockow JL, Hettie KS, and Glass TE (2013). ExoSensor 517: A dual-analyte fluorescent chemosensor for visualizing neurotransmitter exocytosis. ACS Chem. Neurosci. 4, 1334–1338. [DOI] [PMC free article] [PubMed] [Google Scholar]
- Knoth J, Zallakian M, and Njus D. (1981). Stoichiometry of hydrogen ion-linked dopamine transport in chromaffin granule ghosts. Biochemistry 20, 6625–6629. [DOI] [PubMed] [Google Scholar]
- Kruss S, Landry MP, Vander Ende E, Lima BMA, Reuel NF, Zhang J, Nelson J, Mu B, Hilmer A, and Strano M. (2014). Neurotransmitter detection using corona phase molecular recognition on fluorescent single-walled carbon nanotube sensors. J. Am. Chem. Soc. 136, 713–724. [DOI] [PubMed] [Google Scholar]
- Kuijpers GA, Rosario LM, and Ornberg RL (1989). Role of intracellular pH in secretion from adrenal medulla chromaffin cells. J. Biol. Chem. 264, 698–705. [PubMed] [Google Scholar]
- Kulkarni RU, Vandenberghe M, Thunemann M, James F, Andreassen OA, Djurovic S, Devor A, and Miller EW (2018). In vivo two-photon voltage imaging with sulfonated rhodamine dyes. ACS Cent. Sci. [DOI] [PMC free article] [PubMed] [Google Scholar]
- Labouesse MA, Cola RB, and Patriarchi T. (2020). GPCR-based dopamine sensors-a detailed guide to inform sensor choice for in vivo imaging. Int. J. Mol. Sci. 21. [DOI] [PMC free article] [PubMed] [Google Scholar]
- Lacin E, Muller A, Fernando M, Kleinfeld D, and Slesinger PA (2016). Construction of cell-based neurotransmitter fluorescent engineered reporters (CNiFERs) for optical detection of neurotransmitters in vivo. J. Vis. Exp. [DOI] [PMC free article] [PubMed] [Google Scholar]
- Laruelle M, Abi-Dargham A, van Dyck CH, Gil R, D’Souza CD, Erdos J, McCance E, Rosenblatt W, Fingado C, Zoghbi SS, et al. (1996). Single photon emission computerized tomography imaging of amphetamine-induced dopamine release in drug-free schizophrenic subjects. Proc. Natl. Acad. Sci. 93, 9235–9240. [DOI] [PMC free article] [PubMed] [Google Scholar]
- Lee M, Gubernator NG, Sulzer D, and Sames D. (2010). Development of pH-Responsive Fluorescent False Neurotransmitters. J. Am. Chem. Soc. 132, 8828–8830. [DOI] [PMC free article] [PubMed] [Google Scholar]
- Lee T, Cai LX, Lelyveld VS, Hai A, and Jasanoff A. (2014). Molecular-level functional magnetic resonance imaging of dopaminergic signaling. Science 344, 533–535. [DOI] [PMC free article] [PubMed] [Google Scholar]
- Levigoureux E, Bouillot C, Baron T, Zimmer L, and Lancelot S. (2019). PET imaging of the influence of physiological and pathological α-synuclein on dopaminergic and serotonergic neurotransmission in mouse models. CNS Neurosci. Ther. 25, 57–68. [DOI] [PMC free article] [PubMed] [Google Scholar]
- Li N, and Jasanoff A. (2020). Local and global consequences of reward-evoked striatal dopamine release. Nature 580, 239–244. [DOI] [PMC free article] [PubMed] [Google Scholar]
- Lieberman OJ, McGuirt AF, Mosharov EV, Pigulevskiy I, Hobson BD, Choi S, Frier MD, Santini E, Borgkvist A, and Sulzer D. (2018). Dopamine triggers the maturation of striatal spiny projection neuron excitability during a critical period. Neuron 99, 540–554.e4. [DOI] [PMC free article] [PubMed] [Google Scholar]
- Lippert RN, Cremer AL, Edwin Thanarajah S, Korn C, Jahans-Price T, Burgeno LM, Tittgemeyer M, Brüning JC, Walton ME, and Backes H. (2019). Time-dependent assessment of stimulus-evoked regional dopamine release. Nat. Commun. 10. [DOI] [PMC free article] [PubMed] [Google Scholar]
- Lohr KM, Masoud ST, Salahpour A, and Miller GW (2017). Membrane transporters as mediators of synaptic dopamine dynamics: implications for disease. Eur. J. Neurosci. 45, 20–33. [DOI] [PMC free article] [PubMed] [Google Scholar]
- Ma Y, Tang C, Chaly T, Greene P, Breeze R, Fahn S, Freed C, Dhawan V, and Eidelberg D. (2010). Dopamine cell implantation in Parkinson’s Disease: Long-term clinical and 18F-FDOPA PET outcomes. J. Nucl. Med. 51, 7–15. [DOI] [PMC free article] [PubMed] [Google Scholar]
- Maiti S. (1997). Measuring serotonin distribution in live cells with three-photon excitation. Science 275, 530–532. [DOI] [PubMed] [Google Scholar]
- Marvin JS, Borghuis BG, Tian L, Cichon J, Harnett MT, Akerboom J, Gordus A, Renninger SL, Chen T-W, Bargmann CI, et al. (2013). An optimized fluorescent probe for visualizing glutamate neurotransmission. Nat. Methods 10, 162–170. [DOI] [PMC free article] [PubMed] [Google Scholar]
- Marvin JS, Scholl B, Wilson DE, Podgorski K, Kazemipour A, Müller JA, Schoch S, Quiroz FJU, Rebola N, Bao H, et al. (2018). Stability, affinity, and chromatic variants of the glutamate sensor iGluSnFR. Nat. Methods 15, 936–939. [DOI] [PMC free article] [PubMed] [Google Scholar]
- Méndez-Guerrero A, Laespada-García MI, Gómez-Grande A, Ruiz-Ortiz M, Blanco-Palmero VA, Azcarate-Diaz FJ, Rábano-Suárez P, Álvarez-Torres E, de Fuenmayor-Fernández de la Hoz CP, Pérez DV, et al. (2020). Acute hypokinetic-rigid syndrome following SARS-CoV-2 infection. Neurology 95, e2109–e2118. [DOI] [PubMed] [Google Scholar]
- Meszaros J, Cheung T, Erler MM, Kang UJ, Sames D, Kellendonk C, and Sulzer D. (2018). Evoked transients of pH-sensitive fluorescent false neurotransmitter reveal dopamine hot spots in the globus pallidus. ELife 7, e42383. [DOI] [PMC free article] [PubMed] [Google Scholar]
- Mohebi A, Pettibone JR, Hamid AA, Wong J-MT, Vinson LT, Patriarchi T, Tian L, Kennedy RT, and Berke JD (2019). Dissociable dopamine dynamics for learning and motivation. Nature 570, 65–70. [DOI] [PMC free article] [PubMed] [Google Scholar]
- Molinoff PB, and Axelrod J. (1971). Biochemistry of catecholamines. Annu. Rev. Biochem. 40, 465–500. [DOI] [PubMed] [Google Scholar]
- Monzani E, Nicolis S, Dell’Acqua S, Capucciati A, Bacchella C, Zucca FA, Mosharov EV, Sulzer D, Zecca L, and Casella L. (2019). Dopamine, oxidative stress and protein–quinone modifications in Parkinson’s and other neurodegenerative diseases. Angew. Chem. Int. Ed. 58, 6512–6527. [DOI] [PubMed] [Google Scholar]
- Morales M, and Margolis EB (2017). Ventral tegmental area: cellular heterogeneity, connectivity and behaviour. Nat. Rev. Neurosci. 18, 73–85. [DOI] [PubMed] [Google Scholar]
- Muir J, Lorsch ZS, Ramakrishnan C, Deisseroth K, Nestler EJ, Calipari ES, and Bagot RC (2018). In vivo fiber photometry reveals signature of future stress susceptibility in nucleus accumbens. Neuropsychopharmacology 43, 255–263. [DOI] [PMC free article] [PubMed] [Google Scholar]
- Nakai J, Ohkura M, and Imoto K. (2001). A high signal-to-noise Ca2+ probe composed of a single green fluorescent protein. Nat. Biotechnol. 19, 137–141. [DOI] [PubMed] [Google Scholar]
- Nakamoto C, Goto Y, Tomizawa Y, Fukata Y, Fukata M, Harpsøe K, Gloriam DE, Aoki K, and Takeuchi T. (2020). A genetically encoded red fluorescence dopamine biosensor enables dual imaging of dopamine and norepinephrine. bioRxiv doi: 10.1101/2020.05.25.115162 [DOI] [Google Scholar]
- Nguyen Q-T, Schroeder LF, Mank M, Muller A, Taylor P, Griesbeck O, and Kleinfeld D. (2010). An in vivo biosensor for neurotransmitter release and in situ receptor activity. Nat. Neurosci. 13, 127–132. [DOI] [PMC free article] [PubMed] [Google Scholar]
- Oh Y-S, Kim J-S, Hwang E-J, and Lyoo CH (2018). Striatal dopamine uptake and olfactory dysfunction in patients with early Parkinson’s disease. Parkinsonism Relat. Disord. 56, 47–51. [DOI] [PubMed] [Google Scholar]
- Okamura N, Villemagne VL, Drago J, Pejoska S, Dhamija RK, Mulligan RS, Ellis JR, Ackermann U, O’Keefe G, Jones G, et al. (2010). In vivo measurement of vesicular monoamine transporter type 2 density in parkinson disease with 18F-AV-133. J. Nucl. Med. 51, 223–228. [DOI] [PubMed] [Google Scholar]
- Öngür D. (2013). Making progress with magnetic resonance spectroscopy. JAMA Psychiatry 70, 1265. [DOI] [PubMed] [Google Scholar]
- Park E. (2012). A new era of clinical dopamine transporter imaging using 123I-FP-CIT. J. Nucl. Med. Technol. 40, 222–228. [DOI] [PubMed] [Google Scholar]
- Passe TJ, Charles HC, Rajagopalan P, and Krishnan KR (1995). Nuclear magnetic resonance spectroscopy: A review of neuropsychiatric applications. Prog. Neuropsychopharmacol. Biol. Psychiatry 19, 541–563. [DOI] [PubMed] [Google Scholar]
- Pathak A, and Gupta BD (2019). Ultra-selective fiber optic SPR platform for the sensing of dopamine in synthetic cerebrospinal fluid incorporating permselective nafion membrane and surface imprinted MWCNTs-PPy matrix. Biosens. Bioelectron. 133, 205–214. [DOI] [PubMed] [Google Scholar]
- Patriarchi T, Cho JR, Merten K, Howe MW, Marley A, Xiong W-H, Folk RW, Broussard GJ, Liang R, Jang MJ, et al. (2018). Ultrafast neuronal imaging of dopamine dynamics with designed genetically encoded sensors. Science 360. [DOI] [PMC free article] [PubMed] [Google Scholar]
- Patriarchi T, Mohebi A, Sun J, Marley A, Liang R, Dong C, Puhger K, Mizuno GO, Davis CM, Wiltgen B, et al. (2020). An expanded palette of dopamine sensors for multiplex imaging in vivo. Nat. Methods 17, 1147–1155. [DOI] [PMC free article] [PubMed] [Google Scholar]
- Payer DE, Guttman M, Kish SJ, Tong J, Strafella A, Zack M, Adams JR, Rusjan P, Houle S, Furukawa Y, et al. (2015). [11C]-(+)-PHNO PET imaging of dopamine D 2/3 receptors in Parkinson’s disease with impulse control disorders: [11C]PHNO binding in Parkinson’s disease. Mov. Disord. 30, 160–166. [DOI] [PubMed] [Google Scholar]
- Pereira DB, Schmitz Y, Mészáros J, Merchant P, Hu G, Li S, Henke A, Lizardi-Ortiz JE, Karpowicz RJ, Morgenstern TJ, et al. (2016). Fluorescent false neurotransmitter reveals functionally silent dopamine vesicle clusters in the striatum. Nat. Neurosci. 19, 578–586. [DOI] [PMC free article] [PubMed] [Google Scholar]
- Phillips PEM, Stuber GD, Heien MLAV, Wightman RM, and Carelli RM (2003). Subsecond dopamine release promotes cocaine seeking. Nature 422, 614–618. [DOI] [PubMed] [Google Scholar]
- Pignatelli M, and Bonci A. (2015). Role of dopamine neurons in reward and aversion: a synaptic plasticity perspective. Neuron 86, 1145–1157. [DOI] [PubMed] [Google Scholar]
- Prost RW (2008). Magnetic resonance spectroscopy: Magnetic resonance spectroscopy. Med. Phys. 35, 4530–4544. [DOI] [PubMed] [Google Scholar]
- Rice ME, Patel JC, and Cragg SJ (2011). Dopamine release in the basal ganglia. Neuroscience 198, 112–137. [DOI] [PMC free article] [PubMed] [Google Scholar]
- Roberts JG, and Sombers LA (2018). Fast-scan cyclic voltammetry: chemical sensing in the brain and beyond. Anal. Chem. 90, 490–504. [DOI] [PMC free article] [PubMed] [Google Scholar]
- Robinson DL, Venton BJ, Heien MLAV, and Wightman RM (2003). Detecting subsecond dopamine release with fast-scan cyclic voltammetry in vivo. Clin. Chem. 49, 1763–1773. [DOI] [PubMed] [Google Scholar]
- Robinson DL, Howard EC, McConnell S, Gonzales RA, and Wightman RM (2009). Disparity between tonic and phasic ethanol-induced dopamine increases in the nucleus accumbens of rats. Alcohol. Clin. Exp. Res. 33, 1187–1196. [DOI] [PMC free article] [PubMed] [Google Scholar]
- Rodeberg NT, Sandberg SG, Johnson JA, Phillips PEM, and Wightman RM (2017). Hitchhiker’s guide to voltammetry: acute and chronic electrodes for in vivo fast-scan cyclic voltammetry. ACS Chem. Neurosci. 8, 221–234. [DOI] [PMC free article] [PubMed] [Google Scholar]
- Rodriguez PC, Pereira DB, Borgkvist A, Wong MY, Barnard C, Sonders MS, Zhang H, Sames D, and Sulzer D. (2013). Fluorescent dopamine tracer resolves individual dopaminergic synapses and their activity in the brain. Proc. Natl. Acad. Sci. 110, 870–875. [DOI] [PMC free article] [PubMed] [Google Scholar]
- Ross SvanteB., and Jackson DavidM. (1989). Kinetic properties of the accumulation of 3H-raclopride in the mouse brain in vivo. Naunyn. Schmiedebergs Arch. Pharmacol. 340. [DOI] [PubMed] [Google Scholar]
- Rothman DL, Petroff OA, Behar KL, and Mattson RH (1993). Localized 1H NMR measurements of gamma-aminobutyric acid in human brain in vivo. Proc. Natl. Acad. Sci. 90, 5662–5666. [DOI] [PMC free article] [PubMed] [Google Scholar]
- Ruiz-Cabello J, Barnett BP, Bottomley PA, and Bulte JWM (2011). Fluorine (19F) MRS and MRI in biomedicine. NMR Biomed. 24, 114–129. [DOI] [PMC free article] [PubMed] [Google Scholar]
- Saari L, Kivinen K, Gardberg M, Joutsa J, Noponen T, and Kaasinen V. (2017). Dopamine transporter imaging does not predict the number of nigral neurons in Parkinson disease. Neurology 88, 1461–1467. [DOI] [PubMed] [Google Scholar]
- Sames D, Dunn M, Karpowicz RJ, and Sulzer D. (2013). Visualizing neurotransmitter secretion at individual synapses. ACS Chem. Neurosci. 4, 648–651. [DOI] [PMC free article] [PubMed] [Google Scholar]
- Sarkar B, Banerjee A, Das AK, Nag S, Kaushalya SK, Tripathy U, Shameem M, Shukla S, and Maiti S. (2014). Label-free dopamine imaging in live rat brain slices. ACS Chem. Neurosci. 5, 329–334. [DOI] [PMC free article] [PubMed] [Google Scholar]
- Sasaki M, Shibata E, Tohyama K, Takahashi J, Otsuka K, Tsuchiya K, Takahashi S, Ehara S, Terayama Y, and Sakai A. (2006). Neuromelanin magnetic resonance imaging of locus ceruleus and substantia nigra in Parkinson??s disease: NeuroReport 17, 1215–1218. [DOI] [PubMed] [Google Scholar]
- Sato DX, Ishii Y, Nagai T, Ohashi K, and Kawata M. (2019). Human-specific mutations in VMAT1 confer functional changes and multi-directional evolution in the regulation of monoamine circuits. BMC Evol. Biol. 19. [DOI] [PMC free article] [PubMed] [Google Scholar]
- Seneca N, Zoghbi SS, Skinbjerg M, Liow J-S, Hong J, Sibley DR, Pike VW, Halldin C, and Innis RB (2008). Occupancy of dopamine D 2/3 receptors in rat brain by endogenous dopamine measured with the agonist positron emission tomography radioligand [ 11 C]MNPA. Synapse 62, 756–763. [DOI] [PMC free article] [PubMed] [Google Scholar]
- Shapiro MG, Westmeyer GG, Romero PA, Szablowski JO, Küster B, Shah A, Otey CR, Langer R, Arnold FH, and Jasanoff A. (2010). Directed evolution of a magnetic resonance imaging contrast agent for noninvasive imaging of dopamine. Nat. Biotechnol. 28, 264–270. [DOI] [PMC free article] [PubMed] [Google Scholar]
- Shin W, Arpino G, Thiyagarajan S, Su R, Ge L, McDargh Z, Guo X, Wei L, Shupliakov O, Jin A, et al. (2020). Vesicle Shrinking and Enlargement Play Opposing Roles in the Release of Exocytotic Contents. Cell Rep. 30, 421–431.e7. [DOI] [PMC free article] [PubMed] [Google Scholar]
- Skinbjerg M, Liow J-S, Seneca N, Hong J, Lu S, Thorsell A, Heilig M, Pike VW, Halldin C, Sibley DR, et al. (2010). D2 dopamine receptor internalization prolongs the decrease of radioligand binding after amphetamine: A PET study in a receptor internalization-deficient mouse model. NeuroImage 50, 1402–1407. [DOI] [PMC free article] [PubMed] [Google Scholar]
- Staal RGW, Mosharov EV, and Sulzer D. (2004). Dopamine neurons release transmitter via a flickering fusion pore. Nat. Neurosci. 7, 341–346. [DOI] [PubMed] [Google Scholar]
- Stamford JA, Kruk ZL, Millar J, and Wightman RM (1984). Striatal dopamine uptake in the rat: In vivo analysis by fast cyclic voltammetry. Neurosci. Lett. 51, 133–138. [DOI] [PubMed] [Google Scholar]
- Steyer JA, Horstmann H, and Almers W. (1997). Transport, docking and exocytosis of single secretory granules in live chromaffin cells. Nature 388, 474–478. [DOI] [PubMed] [Google Scholar]
- Sulzer D, and Holtzman E. (1989). Acidification and endosome-like compartments in the presynaptic terminals of frog retinal photoreceptors. J. Neurocytol. 18, 529–540. [DOI] [PMC free article] [PubMed] [Google Scholar]
- Sulzer D, and Rayport S. (1990). Amphetamine and other psychostimulants reduce pH gradients in midbrain dopaminergic neurons and chromaffin granules: A mechanism of action. Neuron 5, 797–808. [DOI] [PubMed] [Google Scholar]
- Sulzer D, Sonders MS, Poulsen NW, and Galli A. (2005). Mechanisms of neurotransmitter release by amphetamines: A review. Prog. Neurobiol. 75, 406–433. [DOI] [PubMed] [Google Scholar]
- Sulzer D, Cassidy C, Horga G, Kang UJ, Fahn S, Casella L, Pezzoli G, Langley J, Hu XP, Zucca FA, et al. (2018). Neuromelanin detection by magnetic resonance imaging (MRI) and its promise as a biomarker for Parkinson’s disease. Npj Park. Dis. 4, 11. [DOI] [PMC free article] [PubMed] [Google Scholar]
- Sun F, Zeng J, Jing M, Zhou J, Feng J, Owen SF, Luo Y, Li F, Wang H, Yamaguchi T, et al. (2018). A genetically encoded fluorescent sensor enables rapid and specific detection of dopamine in flies, fish, and mice. Cell 174, 481–496.e19. [DOI] [PMC free article] [PubMed] [Google Scholar]
- Sun F, Zhou J, Dai B, Qian T, Zeng J, Li X, Zhuo Y, Zhang Y, Wang Y, Qian C, et al. (2020). Next-generation GRAB sensors for monitoring dopaminergic activity in vivo. Nat. Methods 17, 1156–1166. [DOI] [PMC free article] [PubMed] [Google Scholar]
- Sun XR, Badura A, Pacheco DA, Lynch LA, Schneider ER, Taylor MP, Hogue IB, Enquist LW, Murthy M, and Wang SS-H (2013). Fast GCaMPs for improved tracking of neuronal activity. Nat. Commun. 4, 2170. [DOI] [PMC free article] [PubMed] [Google Scholar]
- Surmeier DJ, Graves SM, and Shen W. (2014). Dopaminergic modulation of striatal networks in health and Parkinson’s disease. Curr. Opin. Neurobiol. 29, 109–117. [DOI] [PMC free article] [PubMed] [Google Scholar]
- Tao W, Rubart M, Ryan J, Xiao X, Qiao C, Hato T, Davidson MW, Dunn KW, and Day RN (2015). A practical method for monitoring FRET-based biosensors in living animals using two-photon microscopy. Am. J. Physiol.-Cell Physiol. 309, C724–C735. [DOI] [PMC free article] [PubMed] [Google Scholar]
- Toomey JS, Bhatia S, Moon LT, Orchard EA, Tainter KH, Lokitz SJ, Terry T, Mathis JM, and Penman AD (2012). PET imaging a MPTP-induced mouse model of Parkinson’s disease using the fluoropropyl-dihydrotetrabenazine analog [18F]-DTBZ (AV-133). PLoS ONE 7, e39041. [DOI] [PMC free article] [PubMed] [Google Scholar]
- Torregrossa MM, and Kalivas PW (2008). Microdialysis and the neurochemistry of addiction. Pharmacol. Biochem. Behav. 90, 261–272. [DOI] [PMC free article] [PubMed] [Google Scholar]
- Tosk JM, Holshouser BA, Aloia RC, Hinshaw DB, Hasso AN, Macmurray JP, Will AD, and Bozzetti LP (1992). Effects of the interaction between ferric iron and L-dopa melanin on T1 and T2 relaxation times determined by magnetic resonance imaging. Magn. Reson. Med. 26, 40–45. [DOI] [PubMed] [Google Scholar]
- Trujillo P, Summers PE, Ferrari E, Zucca FA, Sturini M, Mainardi LT, Cerutti S, Smith AK, Smith SA, Zecca L, et al. (2017). Contrast mechanisms associated with neuromelanin-MRI: Neuromelanin-MRI Contrast. Magn. Reson. Med. 78, 1790–1800. [DOI] [PubMed] [Google Scholar]
- Tsukada H, Kanazawa M, Ohba H, Nishiyama S, Harada N, and Kakiuchi T. (2016). PET imaging of mitochondrial complex I with 18F-BCPP-EF in the brains of MPTP-treated monkeys. J. Nucl. Med. 57, 950–953. [DOI] [PubMed] [Google Scholar]
- Vāvere AL, Neumann KD, Butch ER, Hu B, DiMagno SG, and Snyder SE (2018). Improved, one-pot synthesis of 6-[18F]fluorodopamine and quality control testing for use in patients with neuroblastoma. J. Label. Compd. Radiopharm. 61, 1069–1080. [DOI] [PubMed] [Google Scholar]
- Veluthakal R, and Harris P. (2010). In vivo beta-cell imaging with VMAT 2 ligands - current state-of-the-art and future perspectives. Curr. Pharm. Des. 16, 1568–1581. [DOI] [PMC free article] [PubMed] [Google Scholar]
- Waiczies S, Srinivas M, Flögel U, Boehm-Sturm P, and Niendorf T. (2019). Special issue on fluorine-19 magnetic resonance: technical solutions, research promises and frontier applications. Magn. Reson. Mater. Phys. Biol. Med. 32, 1–3. [DOI] [PubMed] [Google Scholar]
- Walker MD, Dinelle K, Kornelsen R, McCormick S, Mah C, Holden JE, Farrer MJ, Stoessl AJ, and Sossi V. (2013). In-vivo measurement of LDOPA uptake, dopamine reserve and turnover in the rat brain using [18F]FDOPA PET. J. Cereb. Blood Flow Metab. 33, 59–66. [DOI] [PMC free article] [PubMed] [Google Scholar]
- Wang H. (2002). Study on fluorescence property of dopamine and determination of dopamine by fluorimetry. Talanta 57, 899–907. [DOI] [PubMed] [Google Scholar]
- Wang H, Jing M, and Li Y. (2018). Lighting up the brain: genetically encoded fluorescent sensors for imaging neurotransmitters and neuromodulators. Curr. Opin. Neurobiol. 50, 171–178. [DOI] [PMC free article] [PubMed] [Google Scholar]
- Wang JL, Oya S, Parhi AK, Lieberman BP, Ploessl K, Hou C, and Kung HF (2010). In vivo studies of the SERT-selective [18F]FPBM and VMAT2-selective [18F]AV-133 radiotracers in a rat model of Parkinson’s disease. Nucl. Med. Biol. 37, 479–486. [DOI] [PMC free article] [PubMed] [Google Scholar]
- Wang Q, Shui B, Kotlikoff MI, and Sondermann H. (2008). Structural basis for calcium sensing by GCaMP2. Structure 16, 1817–1827. [DOI] [PMC free article] [PubMed] [Google Scholar]
- Williams RM, and Webb WW (2000). Single granule pH cycling in antigen-induced mast cell secretion. J. Cell Sci. 113 Pt 21, 3839–3850. [DOI] [PubMed] [Google Scholar]
- Wong MY, Borgkvist A, Choi SJ, Mosharov EV, Bamford NS, and Sulzer D. (2015). Dopamine-dependent corticostriatal synaptic filtering regulates sensorimotor behavior. Neuroscience 290, 594–607. [DOI] [PMC free article] [PubMed] [Google Scholar]
- Wu J, Abdelfattah AS, Zhou H, Ruangkittisakul A, Qian Y, Ballanyi K, and Campbell RE (2018). Genetically encoded glutamate indicators with altered color and topology. ACS Chem. Biol. 13, 1832–1837. [DOI] [PubMed] [Google Scholar]
- Xu Y, Zou P, and Cohen AE (2017). Voltage imaging with genetically encoded indicators. Curr. Opin. Chem. Biol. 39, 1–10. [DOI] [PMC free article] [PubMed] [Google Scholar]
- Yanagisawa D, Oda K, Inden M, Morikawa S, Inubushi T, Taniguchi T, Hijioka M, Kitamura Y, and Tooyama I. (2017). Fluorodopa is a promising fluorine-19 MRI probe for evaluating striatal dopaminergic function in a rat model of Parkinson’s disease: fluorodopa, a fluorine-19 MRI probe for DA neuron. J. Neurosci. Res. 95, 1485–1494. [DOI] [PMC free article] [PubMed] [Google Scholar]
- Yu X, He X, Yang T, Zhao L, Chen Q, Zhang S, Chen J, and Xu J. (2018). Sensitive determination of dopamine levels via surface-enhanced Raman scattering of Ag nanoparticle dimers. Int. J. Nanomedicine Volume 13, 2337–2347. [DOI] [PMC free article] [PubMed] [Google Scholar]
- Zecca L, Fariello R, Riederer P, Sulzer D, Gatti A, and Tampellini D. (2002). The absolute concentration of nigral neuromelanin, assayed by a new sensitive method, increases throughout the life and is dramatically decreased in Parkinson’s disease. FEBS Lett. 510, 216–220. [DOI] [PubMed] [Google Scholar]
- Zhang H, Gubernator NG, Yue M, Staal RGW, Mosharov EV, Pereira D, Balsanek V, Vadola PA, Mukherjee B, Edwards RH, et al. (2009). Dopamine Release at individual presynaptic terminals visualized with FFNs. J. Vis. Exp. [DOI] [PMC free article] [PubMed] [Google Scholar]