Abstract
Thalamic nuclei play critical roles in regulation of neurological functions like sleep and wakefulness. They are increasingly implicated in neurodegenerative and neurological diseases such as multiple sclerosis and essential tremor. However, segmentation of thalamic nuclei is difficult due to their poor visibility in conventional MRI scans. Sophisticated methods have been proposed which require specialized MRI acquisitions and complex post processing. There are few high spatial resolution (1 mm3 or higher) in vivo MRI thalamic atlases available currently. The goal of this work is the development of an in vivo MRI-based structural thalamic atlas at 0.7 × 0.7 × 0.5 mm resolution based on manual segmentation of 9 healthy subjects using the Morel atlas as a guide. Using data analysis from healthy subjects as well as patients with multiple-sclerosis and essential tremor and at 3T and 7T MRI, we demonstrate the utility of this atlas to provide fast and accurate segmentation of thalamic nuclei when only conventional T1 weighted images are available.
Subject terms: Brain, Magnetic resonance imaging
| Measurement(s) | thalamic nuclei |
| Technology Type(s) | multi-atlas segmentation |
| Sample Characteristic - Organism | Homo sapiens |
Machine-accessible metadata file describing the reported data: 10.6084/m9.figshare.16601045
Background & Summary
The thalamus has historically been associated with filtering and relaying sensory and motor signals to the cortex. It is also involved in the regulation of sleep, attention, waking, consciousness1, and episodic memory2. Histologically and functionally, the thalamus is divided into subdivisions called nuclei with specific projections to different cortical areas and associated with specific neurological functions. Thalamic nuclei involvement is increasingly reported in a number of neurodegenerative and psychiatric disorders such as multiple sclerosis3–5, alcohol use disorder6, schizophrenia7, and Parkinson’s disease8 among others. Specific nuclei such as the ventralis intermedius nucleus are being targeted for treatment of essential tremor9. However, thalamic nuclei are largely invisible on conventional T1 or T2 weighted MRI sequences. Specialized techniques such as susceptibility weighted imaging10,11 have been demonstrated at 7T for delineation of thalamic nuclei, usually involving manual segmentation. These have been used for targeting the ventralis intermedius nucleus for deep brain stimulation surgery12,13. Diffusion weighted imaging (DWI) based methods have shown promise for delineation of thalamic nuclei. Local14,15 properties such as orientation of the diffusion tensor have been utilized to segment the thalamic nuclei into multiple nuclei at 3T. To date, the most consistent and stable DWI-based technique uses orientation distribution functions represented by a spherical harmonic basis to cluster the thalamic nuclei16 at 3T. However, DWI uses echo-planar imaging for its underlying acquisition making it subject to spatial distortion and limiting its spatial resolution. Furthermore, the predominance of grey matter in the thalamus reduces diffusion anisotropy. As a result, DWI-based methods have been successful in only segmenting the larger nuclei.
Over the years, several MRI atlases for thalamic nuclei have been reported. Behrens et al.17,18 used probabilistic tractography to create an atlas with seven sub-regions. However, this atlas is based on structural connectivity to the cortex rather than anatomical correspondence to a histological atlas. While the Krauth atlas19 is a digital representation of the Morel stereotactic atlas20, it is built using 3 healthy postmortem brains. The probabilistic atlas of Iglesias et al.21 is also, primarily, based on 6 postmortem brains. Recently Najdenovska et al.22 reported an atlas based on the DWI clustering method of Battistella et al.16 using 70 healthy subjects from the Human Connectome Project. This atlas had seven clusters, six of which loosely corresponded to larger thalamic nuclei while the seventh cluster was a conglomerate of three histologically-defined nuclei. Resting state functional MRI based methods have also been used to segment thalamic nuclei and create atlases by Zhang et al.23 and Kumar et al.24. Even though qualitative correspondence to the Morel atlas was noted, there were no direct quantitative comparisons to manual segmentation ground truth in most of these methods.
T1- and T2-weighted structural MRI is usually performed at much higher spatial resolution than EPI-based methods which underlie DWI and functional MRI and would be more suitable for high spatial resolution atlas creation. However, T1 weighted Magnetization Prepared Rapid Gradient Echo (MP-RAGE) or T2 weighted fast spin echo structural imaging sequences possess very little inter-nuclear contrast to be of value in nuclei segmentation. Liu et al.25. used a combination of susceptibility weighted and MP-RAGE data acquired with different contrasts at 7T to create a manual segmentation multi-atlas which was then used to segment 3T MP-RAGE data. Recently, a method for thalamic segmentation called Thalamus optimized multi atlas segmentation (THOMAS)26 based on a variant of MP-RAGE has been proposed for 7T which shows great promise for high resolution thalamic nuclei segmentation. However, THOMAS requires the acquisition of a white-matter-nulled (WMn) MP-RAGE sequence27,28 to improve intra-thalamic contrast, which has not generally been part of the suite of standard MRI sequences. This also prevents retrospective analysis of large databases like Alzheimer’s Disease Neuroimaging Initiative (ADNI), which include only conventional structural imaging sequences like MP-RAGE.
The goal of this work was to create a high spatial resolution (0.7 × 0.7 × 0.5 mm3) in vivo MRI structural atlas based on a database of WMn MP-RAGE data, which were segmented manually using the Morel stereotactic atlas as a guide. This allowed delineation of thalamic nuclei from conventional MP-RAGE, enabling their segmentation from existing standard clinical imaging protocols. We describe the creation of this atlas and demonstrate its utility using 3T and 7T MRI data sets.
Methods
Datasets and manual segmentation
The structural atlas proposed in this work was generated using 9 WMn MP-RAGE prior datasets (6 male, 3 female; age = 24–43 years, mean = 32 years, SD = 5 years) acquired on a GE 7T MRI system from healthy control subjects with the following parameters:
180 coronal slices, TR/TE 6,000/10 ms, inversion time 680 ms, flip angle 4°, 0.7 × 0.7 × 0.5 mm3 image resolution, FOV 180 mm, parallel imaging factor 1.5 × 1.5 (6 datasets with no parallel imaging).
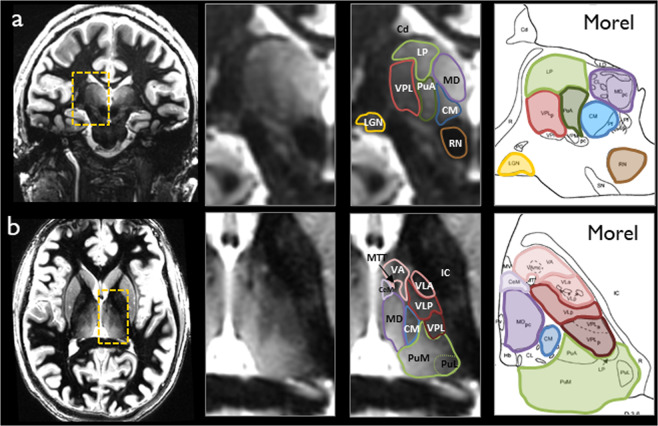
While histology is considered the gold standard, manual segmentation performed by an expert neuroradiologist using the Morel atlas20 as a reference was used in this work involving in vivo data where histological data are not available. A reproducible manual segmentation protocol was developed with excellent intra-rater reliability as measured by intraclass correlation coefficient (ICC) and mean distance discrepancy between centers of mass (ΔCoMs) for initial and repeat tracings 3 weeks later, yielding ICC of 0.997 (95% confidence interval 0.996–0.998) and ΔCoM of 0.69 ± 0.38 mm respectively. More details of the manual segmentation procedure can be found in Tourdias et al.27 Two example data sets in axial and coronal planes are shown in Fig. 1, demonstrating the superior contrast of the WMn MP-RAGE sequence that enables clear demarcation of nuclei boundaries for manual delineation in conjunction with the Morel atlas. All the prior datasets were manually segmented to identify 11 thalamic nuclei and the mammillothalamic tract (MTT). The eleven delineated nuclei are grouped as follows:
-
(i)
anterior group: anteroventral (AV)
-
(ii)
lateral group: ventral posterolateral (VPL), ventral lateral anterior (VLa), ventral lateral posterior (VLp), ventral anterior nucleus (VA)
-
(iii)
medial group: mediodorsal (MD), centromedian (CM), habenula (Hb)
-
(iv)
posterior group: pulvinar (Pul), medial geniculate nucleus (MGN), lateral geniculate nucleus (LGN)
Fig. 1.
Two example WMn-MPRAGE data sets in coronal (a) and axial (b) planes with manual segmentation overlays along with the approximate slice location in the Morel atlas for reference.
Custom template construction and atlas creation
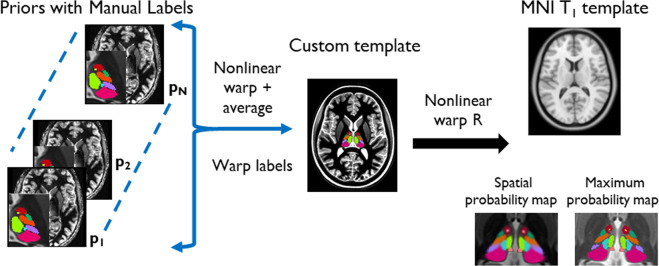
A custom template was created using the buildtemplate script of Advanced Normalization Tools (ANTs29) as described in Su et al.26. Briefly, this is achieved by iteratively registering each of the 9 priors to the average of the priors and then averaging the registered priors to create a custom template which has very high signal-to-noise ratio and contrast whilst including normal and diseased brain states. Registration was first affine followed by nonlinear warping using the symmetric group-wise diffeomorphic normalization (SyN) algorithm of ANTs. ANTs was chosen for its accuracy and precision as reported by Klein et al.30. The nonlinear warps from each prior to the custom template were also computed using ANTs. Finally, labels were transferred from the space of the 9 priors to the custom template space using the warps computed above and nearest-neighbor interpolation to generate the thalamic parcellations in template space. These 9 parcellations were then combined to calculate the spatial probability maps and maximum probability map using custom python scripts. Spatial probability maps were generated by computing the relative frequencies of labels at each voxel in template space to yield the probability of that voxel belonging to each thalamic nucleus. Maximum probability maps were computed using the mode of these distributions, thus assigning a single label to each voxel representative of the most probable thalamic nucleus at that location. All the final maps are at 0.7 × 0.7 × 0.5 mm spatial resolution. Lastly, the custom template was nonlinearly registered to MNI space (nonlinear ICBM152 asymmetric31) and this spatial warp was saved and used to warp the probability maps from custom template to MNI space. Transformations from the priors to custom template and custom template to MNI space were concatenated to minimize interpolation errors during generation of the thalamic nuclei labels in MNI space with 0.5 mm isotropic spatial resolution. These steps are summarized in Fig. 2.
Fig. 2.
Main steps in the creation of the proposed thalamic atlas.
Data Records
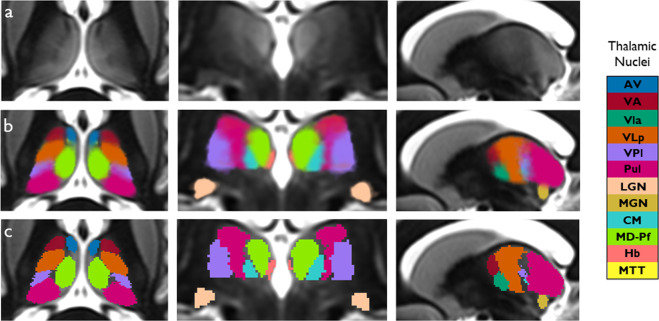
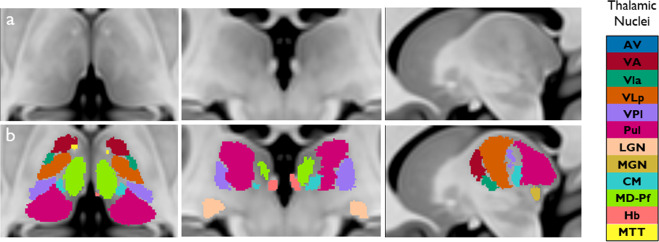
The primary contribution of our work are the spatial probability and maximum probability maps of thalamic nuclei in custom template space at 0.7 × 0.7 × 0.5 mm resolution. They are in compressed NIfTI-1 format (i.e. .nii.gz extension) with the spatial probability map a 4-D file, the 4th dimension of size 24 for the 12 left and 12 right thalamic nuclei and separate maximum probability maps for left and right thalami. The maximum probability maps are also provided in MNI 152 (nonlinear 2009b31) space at 0.5 mm isotropic resolution. In addition, the inferior half of the VLp nucleus i.e. the ventralis intermedius (VIM) nucleus is also provided as a separate file in both custom template and MNI spaces for the left and right sides. All file names follow the BIDS naming convention. Figure 3 shows the spatial probability maps and maximum probability maps overlaid on the custom template in all three planes. The maximum probability map in MNI space is shown in Fig. 4.
Fig. 3.
Spatial probability maps (b) and maximum probability maps (c) in custom WMn MP-RAGE template space shown in three orthogonal planes. The top row shows the custom WMn MP-RAGE template without overlays for reference.
Fig. 4.
Maximum probability thalamic maps overlaid (b) in MNI 152 space (a) in three orthogonal planes.
A customized color lookup table (.ctbl extension) recognized by standard visualization tools like 3D Slicer is also provided. This can be custom edited to change the color scheme or add additional nuclei. The data are available through zenodo32. In addition, code for segmentation of conventional MP-RAGE using the atlas and some extra files used by the code are also provided (see Code availability section). The original WMn MP-RAGE datasets used for atlas creation and their segmentation are available through zenodo33 in compressed NIfTI-1 format (i.e. .nii.gz extension). A summary of data records is shown in Table 1.
Table 1.
Summary of data records related to this study.
| Dataset | Data for atlas creation | Data used for testing |
|---|---|---|
| Number of subjects | 9 | 36 |
| Provenance | Prior data from Su et al.19 | Mixed (see Methods) |
| Available from | Zenodo33 | Zenodo Subset32 |
| Modalities used | WMn MP-RAGE | WMn MP-RAGE and MP- RAGE |
| Use | Atlas creation | Atlas validation |
| Provided output | Spatial and max. probability maps | THOMAS and atlas-based thalamic nuclei |
| Output format |
NifTI-1 (.gz) 4D and 3D BIDS naming convention |
NifTI-1 (.gz) 3D |
Technical Validation
To validate the accuracy of the nonlinear registration from the custom template to the MNI template, six anatomical landmarks were placed by an expert neuroradiologist on the MNI template and the custom template warped to MNI space and the distance computed between the two for each landmark, which represents warp errors arising from the nonlinear registration step. The six landmarks included anterior and posterior commissure, left and right mammillary bodies, left and right habenula, left and right peak of the pulvinar nucleus, and the left and right mammillothalamic tract (Supplemental Fig. 1), covering areas adjacent to and within the thalami.
To test the accuracy of the proposed atlas-based segmentation method, two datasets were used. The first comprised of data from 18 subjects- 13 patients with essential tremor, 4 with multiple sclerosis, and one healthy subject (9 male, 9 female; age = 41-86 years, mean = 67.8 years, SD = 14.5 years) acquired on a 7T GE scanner using a 32-channel array (Nova Medical Systems). These were completely separate from the prior subjects used for atlas construction. The second test dataset comprised of 18 healthy subjects (15 male, 3 female; age = 18-44 years, mean = 25.3 years, SD = 7.8 years) acquired on a 3T Siemens Prisma scanner using a 32-channel array. All subjects were scanned after written informed consent adhering to institutional review board (IRB) guidelines. The scan parameters for the sequences were as follows:
7T: Conventional MP-RAGE- 180 coronal slices, TR/TE 3,000/7.2 ms, flip angle 6°, inversion time 1200 ms, 1 mm isotropic resolution, Field of view (FOV) 180 mm, Autocalibrating reconstruction for Cartesian imaging (ARC) acceleration factor 2.
WMn MP-RAGE- 180 coronal slices, TR/TE 6,000/10 ms, inversion time 680 ms, flip angle 4°, 1 mm isotropic resolution, FOV 180 mm, ARC factor 1.5 × 1.5.
3T: Conventional MP-RAGE- 192 sagittal slices, TR/TE 2,000/2.52 ms, flip angle 12°, 1 mm isotropic resolution, FOV 256 mm, generalized autocalibrating partially parallel acquisitions (GRAPPA) factor 2.
WMn MP-RAGE: 160 axial slices, TR/TE 4,000/3.75 ms, inversion time 500 ms, flip angle 7°, 1 mm isotropic resolution, FOV 256 mm, GRAPPA factor 2.
To perform thalamic nuclei segmentation on conventional MP-RAGE data using the proposed atlas, the input images were first bias corrected using the N4 bias correction function of ANTs, then automatically cropped to encompass bilateral thalami and finally nonlinearly registered to a cropped custom template using Mutual Information (MI) for the registration cost function. The use of N4 bias correction and cropping to cover both thalami ensured minimal distortion and B1 inhomogeneity effects even on 7T MRI data. The custom template thalamic nuclei labels were than warped back to input space using nearest-neighbor interpolation. A simple shell script for performing this segmentation is also included in the distribution.
For both 7T and 3T datasets, WMn MP-RAGE images from each patient were segmented using THOMAS and conventional MP-RAGE using the proposed atlas-based segmentation approach, respectively.
For the 7T data, manual segmentation on WMn MP-RAGE performed by a trained neuroradiologist guided by the Morel atlas were also available. As a result, THOMAS and the atlas-based segmentations were individually compared to the manual segmentation ground truth. For the 3T data set, the atlas-based segmentation was directly compared to THOMAS segmentation, due to lack of manual segmentation ground truth. The WMn and conventional MP-RAGE data from each patient were affine registered to each other prior to quantitative comparisons. Their associated labels were also registered by applying the same affine transform with nearest neighbor interpolation. Figure 5 shows comparison of THOMAS segmentation on WMn MP-RAGE (left column) with atlas-based segmentation on conventional MP-RAGE (right column) for a MS patient at 7T (top row) and a healthy subject at 3T (bottom row). The qualitative agreement of the methods can be appreciated.
Fig. 5.
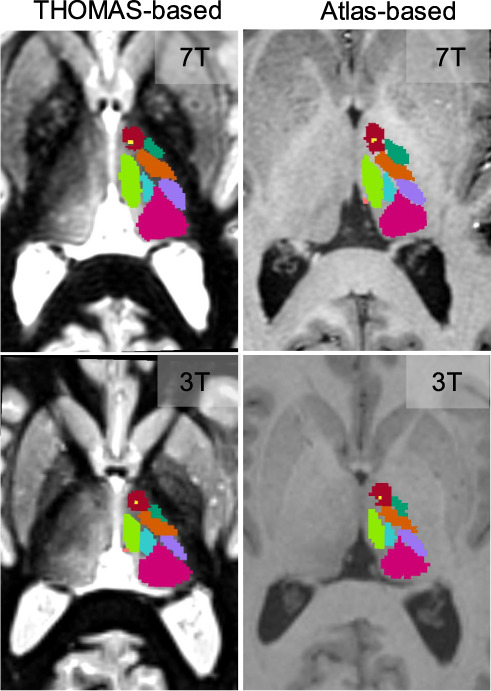
Comparison of THOMAS-based and the proposed atlas-based segmentation on an MS patient at 7T (top row) and a healthy subject at 3T (bottom row).
The main quantitative measures used for comparisons were Dice coefficients and Volume Similarity Index (VSI). These are defined as
| 1 |
where A and B refer to the two segmentation labels compared and |A| and |B| refers to the number of pixels in A and B respectively.
Results
Misregistration errors between the landmarks in MNI space and the custom template warped to MNI space are reported in mm in Table 2 and attest to the quality of the nonlinear registration step.
Table 2.
Errors on anatomical landmarks arising from custom template to MNI registration step.
| Landmark | Error (mm) |
|---|---|
| Anterior commissure | 0.37 |
| Posterior commissure | 0.24 |
| Mammillary body (left) | 0.32 |
| Mammillary body (right) | 0.35 |
| Habenula (left) | 0.26 |
| Habenula (right) | 0.34 |
| Pulvinar peak (left) | 0.33 |
| Pulvinar peak (right) | 0.39 |
| Mammillothalamic tract (left) | 0.37 |
| Mammillothalamic tract (right) | 0.22 |
Dice and VSI values for the 7T test data are shown in Table 3 for the whole thalamus and 11 segmented nuclei. For THOMAS segmentation, mean Dice and VSI were 0.73 and 0.91 for the larger nuclei (nuclei 2-6) and 0.64 and 0.86 for the smaller nuclei (nuclei 7-12) using THOMAS. For the atlas-based segmentation, mean Dice and VSI were 0.67 and 0.91 for the larger nuclei and 0.59 and 0.89 for the smaller nuclei. While there is a slight reduction in Dice for the atlas-based method, especially for the smaller nuclei, the reductions are < = 10% except for VPL (22%) and MGN (11%). VSI was comparable for most nuclei. The mean Dice for all nuclei was 0.68 for THOMAS and 0.63 for the atlas-based segmentation. These are slightly smaller than mean Dice of 0.78 using the shape-based segmentation of Liu et al.23. and much better than the mean Dice of 0.49 using the registration-based image enhancement method of Bao et al.34. The THOMAS Dice results are slightly lower than the original THOMAS26 results for the smaller nuclei, presumably due to the use of data from patients with essential tremor (13 out of 18) in this work with the attendant motion artifacts. Note that Liu et al.23. report results only on 9 healthy subjects and do not report small nuclei such as LGN and MGN.
Table 3.
Dice and VSI values for 7T test data.
| Nucleus | Dice THOMAS vs. manual | Dice Atlas vs. manual | VSI THOMAS vs. manual | VSI Atlas vs. manual |
|---|---|---|---|---|
| 1 Whole thalamus | 0.89 ± 0.02† | 0.88 ± 0.02 | 0.95 ± 0.03 | 0.96 ± 0.03 |
| 2 Pulvinar (Pul) | 0.84 ± 0.03† | 0.79 ± 0.04 | 0.95 ± 0.03 | 0.92 ± 0.06 |
| 3 Ventrolateral posterior (VLp) | 0.76 ± 0.03† | 0.71 ± 0.05 | 0.89 ± 0.07 | 0.89 ± 0.07 |
| 4 Mediodorsal (MD) | 0.83 ± 0.03† | 0.80 ± 0.04 | 0.92 ± 0.05 | 0.93 ± 0.05 |
| 5 Ventral posterior lateral (VPl) | 0.61 ± 0.14† | 0.47 ± 0.15 | 0.89 ± 0.09 | 0.89 ± 0.07 |
| 6 Ventral Anterior (VA) | 0.63 ± 0.09 | 0.60 ± 0.11 | 0.92 ± 0.05 | 0.91 ± 0.08 |
| 7 Anteroventral (AV) | 0.67 ± 0.11 | 0.60 ± 0.07 | 0.79 ± 0.13 | 0.88 ± 0.09 |
| 8 Centromedian (CM) | 0.66 ± 0.14† | 0.60 ± 0.15 | 0.91 ± 0.07 | 0.89 ± 0.08 |
| 9 Lateral geniculate nucleus (LGN) | 0.59 ± 0.15† | 0.54 ± 0.11 | 0.89 ± 0.10 | 0.92 ± 0.07 |
| 10 Ventral lateral anterior (VLa) | 0.52 ± 0.13 | 0.52 ± 0.11 | 0.76 ± 0.17 | 0.81 ± 0.11 |
| 11 Medial geniculate nucleus(MGN) | 0.66 ± 0.10† | 0.59 ± 0.08 | 0.87 ± 0.09 | 0.91 ± 0.08 |
| 12 Habenula (Hb) | 0.74 ± 0.07 | 0.69 ± 0.06 | 0.93 ± 0.04 | 0.94 ± 0.05 |
†indicates p < 0.05/12 for paired t-test comparisons with correction for multiple comparisons (12).
Dice and VSI for the 3T test data are shown in Table 4 for the whole thalamus and 11 segmented nuclei. Note that these are in comparison to THOMAS as opposed to a manual segmentation gold standard. The mean Dice and VSI were 0.8 and 0.95 for the larger nuclei (nuclei 2-6) and 0.7 and 0.91 for the smaller nuclei (nuclei 7-12), indicating a fairly high degree of concordance.
Table 4.
Dice and VSI values for 3T test data.
| Nucleus | Dice Atlas vs. THOMAS | VSI Atlas vs. THOMAS |
|---|---|---|
| 1 Whole thalamus | 0.91 ± 0.01 | 0.98 ± 0.01 |
| 2 Pulvinar (Pul) | 0.85 ± 0.02 | 0.96 ± 0.03 |
| 3 Ventrolateral posterior (VLp) | 0.80 ± 0.04 | 0.96 ± 0.02 |
| 4 Mediodorsal (MD) | 0.85 ± 0.03 | 0.96 ± 0.03 |
| 5 Ventral posterior lateral (VPl) | 0.69 ± 0.08 | 0.89 ± 0.06 |
| 6 Ventral Anterior (VA) | 0.74 ± 0.05 | 0.96 ± 0.03 |
| 7 Anteroventral (AV) | 0.72 ± 0.05 | 0.92 ± 0.10 |
| 8 Centromedian (CM) | 0.74 ± 0.07 | 0.96 ± 0.04 |
| 9 Lateral geniculate nucleus (LGN) | 0.70 ± 0.07 | 0.94 ± 0.05 |
| 10 Ventral lateral anterior (VLa) | 0.63 ± 0.10 | 0.83 ± 0.10 |
| 11 Medial geniculate nucleus (MGN) | 0.73 ± 0.06 | 0.89 ± 0.06 |
| 12 Habenula (Hb) | 0.71 ± 0.07 | 0.91 ± 0.05 |
Usage Notes
The atlases provided are in slice correspondence with the standard MNI 152 nonlinear 2009b atlases. Code is also provided for users to efficiently derive thalamic parcellation of their input data using the supplied templates and atlases. A readme file explains the different files and their roles.
Supplementary information
Author contributions
M.S.- co-designed the study, programmed the segmentation method, analyzed the data, wrote the manuscript. C.I.- helped with data analysis and figure preparation. T.T.- interpretation and discussions, revised the manuscript. M.M.- interpretation and discussions, revised the manuscript B.R.- co-designed the study, revised the manuscript.
Code availability
The code for the segmentation is a shell script which is provided in the Zenodo repository32. It performs an automatic cropping of the input dataset prior to registering to a cropped custom template. This is done to speed up registration and for accuracy by focusing on the thalami as the crop region encompasses both thalami. A mask for automatic cropping and the cropped custom template are also provided.
Competing interests
The authors declare no competing interests.
Footnotes
Publisher’s note Springer Nature remains neutral with regard to jurisdictional claims in published maps and institutional affiliations.
Supplementary information
The online version contains supplementary material available at 10.1038/s41597-021-01062-y.
References
- 1.Sherman SM. The thalamus is more than just a relay. Current Opinion in Neurobiology. 2007;17:417–422. doi: 10.1016/j.conb.2007.07.003. [DOI] [PMC free article] [PubMed] [Google Scholar]
- 2.Aggleton JP, Pralus A, Nelson AJD, Hornberger M. Thalamic pathology and memory loss in early Alzheimer’s disease: moving the focus from the medial temporal lobe to Papez circuit. Brain. 2016;139:1877–90. doi: 10.1093/brain/aww083. [DOI] [PMC free article] [PubMed] [Google Scholar]
- 3.Minagar A, et al. The thalamus and multiple sclerosis: Modern views on pathologic, imaging, and clinical aspects. Neurology. 2013;80:210–219. doi: 10.1212/WNL.0b013e31827b910b. [DOI] [PMC free article] [PubMed] [Google Scholar]
- 4.Houtchens MK, et al. Thalamic atrophy and cognition in multiple sclerosis. Neurology. 2007;69:1213–1223. doi: 10.1212/01.wnl.0000276992.17011.b5. [DOI] [PubMed] [Google Scholar]
- 5.Planche V, et al. White-matter-nulled MPRAGE at 7T reveals thalamic lesions and atrophy of specific thalamic nuclei in multiple sclerosis. Mult. Scler. J. 2020;26:987–992. doi: 10.1177/1352458519828297. [DOI] [PMC free article] [PubMed] [Google Scholar]
- 6.Zahr NM, Sullivan EV, Pohl KM, Pfefferbaum A, Saranathan M. Sensitivity of ventrolateral posterior thalamic nucleus to back pain in alcoholism and CD4 nadir in HIV. Hum. Brain Mapp. 2020;41:1351–1361. doi: 10.1002/hbm.24880. [DOI] [PMC free article] [PubMed] [Google Scholar]
- 7.Huang P, et al. Decreased bilateral thalamic gray matter volume in first-episode schizophrenia with prominent hallucinatory symptoms: A volumetric MRI study. Sci. Rep. 2015;5:14505. doi: 10.1038/srep14505. [DOI] [PMC free article] [PubMed] [Google Scholar]
- 8.Halliday GM. Thalamic changes in Parkinson’s disease. Park. Relat. Disord. 2009;15:S152–5. doi: 10.1016/S1353-8020(09)70804-1. [DOI] [PubMed] [Google Scholar]
- 9.Benabid AL, et al. Chronic electrical stimulation of the ventralis intermedius nucleus of the thalamus as a treatment of movement disorders. J. Neurosurg. 1996;84:203–214. doi: 10.3171/jns.1996.84.2.0203. [DOI] [PubMed] [Google Scholar]
- 10.Jorge J, et al. Improved susceptibility-weighted imaging for high contrast and resolution thalamic nuclei mapping at 7T. Magn. Reson. Med. 2020;84:1218–1234. doi: 10.1002/mrm.28197. [DOI] [PubMed] [Google Scholar]
- 11.Abosch A, Yacoub E, Ugurbil K, Harel N. An assessment of current brain targets for deep brain stimulation surgery with susceptibility-weighted imaging at 7 tesla. Neurosurgery. 2010;67:1745–1756. doi: 10.1227/NEU.0b013e3181f74105. [DOI] [PMC free article] [PubMed] [Google Scholar]
- 12.Gravbrot N, Saranathan M, Pouratian N, Kasoff WS. Advanced Imaging and Direct Targeting of the Motor Thalamus and Dentato-Rubro-Thalamic Tract for Tremor: A Systematic Review. Stereotact. Funct. Neurosurg. 2020;98:220–240. doi: 10.1159/000507030. [DOI] [PubMed] [Google Scholar]
- 13.Najdenovska E, et al. Comparison of MRI-based automated segmentation methods and functional neurosurgery targeting with direct visualization of the Ventro-intermediate thalamic nucleus at 7T. Sci. Rep. 2019;9:1119. doi: 10.1038/s41598-018-37825-8. [DOI] [PMC free article] [PubMed] [Google Scholar]
- 14.Kumar V, Mang S, Grodd W. Direct diffusion-based parcellation of the human thalamus. Brain Struct. Funct. 2015;220:1619–1635. doi: 10.1007/s00429-014-0748-2. [DOI] [PubMed] [Google Scholar]
- 15.Mang SC, Busza A, Reiterer S, Grodd W, Klose AU. Thalamus segmentation based on the local diffusion direction: a group study. Magn. Reson. Med. 2012;67:118–26. doi: 10.1002/mrm.22996. [DOI] [PubMed] [Google Scholar]
- 16.Battistella G, et al. Robust thalamic nuclei segmentation method based on local diffusion magnetic resonance properties. Brain Struct. Funct. 2017;222:2203–2216. doi: 10.1007/s00429-016-1336-4. [DOI] [PMC free article] [PubMed] [Google Scholar]
- 17.Behrens TEJ, et al. Non-invasive mapping of connections between human thalamus and cortex using diffusion imaging. Nat. Neurosci. 2003;6:750–757. doi: 10.1038/nn1075. [DOI] [PubMed] [Google Scholar]
- 18.Johansen-Berg H, et al. Functional-anatomical validation and individual variation of diffusion tractography-based segmentation of the human thalamus. Cereb. Cortex. 2005;15:31–39. doi: 10.1093/cercor/bhh105. [DOI] [PubMed] [Google Scholar]
- 19.Krauth A, et al. A mean three-dimensional atlas of the human thalamus: Generation from multiple histological data. Neuroimage. 2010;49:2053–2062. doi: 10.1016/j.neuroimage.2009.10.042. [DOI] [PubMed] [Google Scholar]
- 20.Morel A, Magnin M, Jeanmonod D. Multiarchitectonic and stereotactic atlas of the human thalamus. J. Comp. Neurol. 1997;387:588–630. doi: 10.1002/(SICI)1096-9861(19971103)387:4<588::AID-CNE8>3.0.CO;2-Z. [DOI] [PubMed] [Google Scholar]
- 21.Iglesias JE, et al. A probabilistic atlas of the human thalamic nuclei combining ex vivo MRI and histology. Neuroimage. 2018;183:314–326. doi: 10.1016/j.neuroimage.2018.08.012. [DOI] [PMC free article] [PubMed] [Google Scholar]
- 22.Najdenovska E, et al. In-vivo probabilistic atlas of human thalamic nuclei based on diffusion-weighted magnetic resonance imaging. Sci. Data. 2018;5:180270. doi: 10.1038/sdata.2018.270. [DOI] [PMC free article] [PubMed] [Google Scholar]
- 23.Zhang D, et al. Intrinsic functional relations between human cerebral cortex and thalamus. J. Neurophysiol. 2008;100:1740–1748. doi: 10.1152/jn.90463.2008. [DOI] [PMC free article] [PubMed] [Google Scholar]
- 24.Kumar VJ, van Oort E, Scheffler K, Beckmann CF, Grodd W. Functional anatomy of the human thalamus at rest. Neuroimage. 2017;147:678–691. doi: 10.1016/j.neuroimage.2016.12.071. [DOI] [PubMed] [Google Scholar]
- 25.Liu Y, D’Haese PF, Newton AT, Dawant BM. Generation of human thalamus atlases from 7 T data and application to intrathalamic nuclei segmentation in clinical 3 T T1-weighted images. Magn. Reson. Imaging. 2020;65:114–128. doi: 10.1016/j.mri.2019.09.004. [DOI] [PubMed] [Google Scholar]
- 26.Su JH, et al. Thalamus Optimized Multi Atlas Segmentation (THOMAS): fast, fully automated segmentation of thalamic nuclei from structural MRI. Neuroimage. 2019;194:272–282. doi: 10.1016/j.neuroimage.2019.03.021. [DOI] [PMC free article] [PubMed] [Google Scholar]
- 27.Tourdias T, Saranathan M, Levesque IR, Su J, Rutt BK. Visualization of intra-thalamic nuclei with optimized white-matter-nulled MPRAGE at 7T. Neuroimage. 2014;84:534–545. doi: 10.1016/j.neuroimage.2013.08.069. [DOI] [PMC free article] [PubMed] [Google Scholar]
- 28.Saranathan M, Tourdias T, Bayram E, Ghanouni P, Rutt BK. Optimization of white-matter-nulled magnetization prepared rapid gradient echo (MP-RAGE) imaging. Magn. Reson. Med. 2015;73:1786–1794. doi: 10.1002/mrm.25298. [DOI] [PMC free article] [PubMed] [Google Scholar]
- 29.Avants BB, Tustison NJ, Wu J, Cook PA, Gee JC. An open source multivariate framework for N-tissue segmentation with evaluation on public data. Neuroinformatics. 2011;9:381–400. doi: 10.1007/s12021-011-9109-y. [DOI] [PMC free article] [PubMed] [Google Scholar]
- 30.Klein A, et al. Evaluation of 14 nonlinear deformation algorithms applied to human brain MRI registration. Neuroimage. 2009;46:786–802. doi: 10.1016/j.neuroimage.2008.12.037. [DOI] [PMC free article] [PubMed] [Google Scholar]
- 31.Fonov V, Evans A, McKinstry R, Almli C, Collins D. Unbiased nonlinear average age-appropriate brain templates from birth to adulthood. Neuroimage. 2009;47:S102. doi: 10.1016/S1053-8119(09)70884-5. [DOI] [Google Scholar]
- 32.Saranathan M, Iglehart C, Monti M, Tourdias T, Rutt B. 2020. Data for In vivo structural MRI-based atlas of human thalamic nuclei. Zenodo. [DOI] [PMC free article] [PubMed]
- 33.Saranathan M. 2020. Data used to create the atlas for In vivo structural MRI-based atlas of human thalamic nuclei. Zenodo. [DOI] [PMC free article] [PubMed]
- 34.Bao S, et al. Registration-based image enhancement improves multi-atlas segmentation of the thalamic nuclei and hippocampal subfields. Magn. Reson. Imaging. 2019;59:143–152. doi: 10.1016/j.mri.2019.03.014. [DOI] [PMC free article] [PubMed] [Google Scholar]
Associated Data
This section collects any data citations, data availability statements, or supplementary materials included in this article.
Data Citations
- Saranathan M, Iglehart C, Monti M, Tourdias T, Rutt B. 2020. Data for In vivo structural MRI-based atlas of human thalamic nuclei. Zenodo. [DOI] [PMC free article] [PubMed]
- Saranathan M. 2020. Data used to create the atlas for In vivo structural MRI-based atlas of human thalamic nuclei. Zenodo. [DOI] [PMC free article] [PubMed]
Supplementary Materials
Data Availability Statement
The code for the segmentation is a shell script which is provided in the Zenodo repository32. It performs an automatic cropping of the input dataset prior to registering to a cropped custom template. This is done to speed up registration and for accuracy by focusing on the thalami as the crop region encompasses both thalami. A mask for automatic cropping and the cropped custom template are also provided.


