

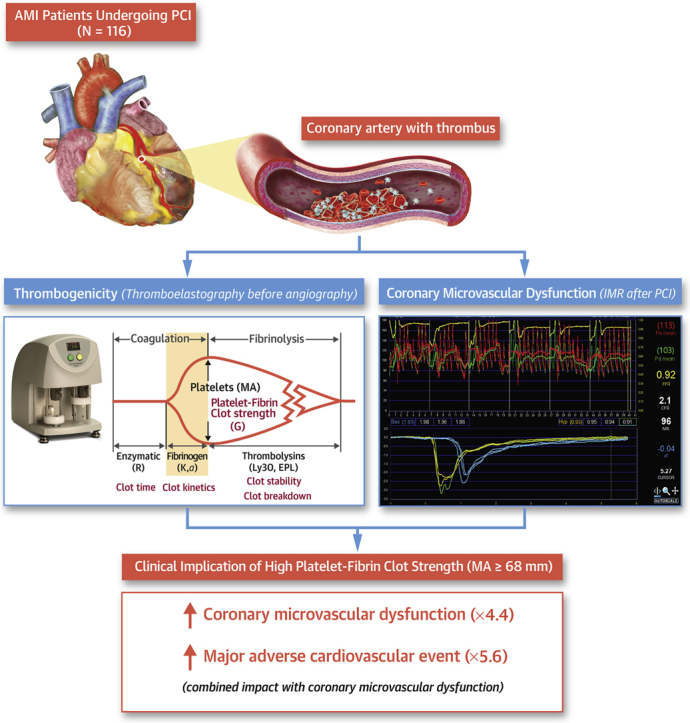
Visual Abstract
Key Words: acute myocardial infarction, cardiovascular event, clot strength, coronary microvascular dysfunction, thrombogenicity
Abbreviations and Acronyms: AMI, acute myocardial infarction; CFR, coronary flow reserve; CMD, coronary microvascular dysfunction; IMR, index of microcirculatory resistance; LASSO, least absolute shrinkage and selection operator; MA, maximum amplitude; MACE, major adverse cardiovascular events; OR, odds ratio; PCI, percutaneous coronary intervention; P-FCS, platelet-fibrin clot strength; PRU, P2Y12 reaction units; R, reaction time; TEG, thromboelastography; TIMI, Thrombolysis in Myocardial Infarction; Tmn, mean transit time
Highlights
-
•
Our study supports the feasibility of measuring thrombogenicity in patients with acute myocardial infarction, with intent to predict periprocedural and long-term clinical events, in real-world clinical practice.
-
•
Preprocedural assessment of ex vivo thrombogenicity (eg, platelet-fibrin clot strength by thromboelastography) was significantly associated with the risk of coronary microvascular dysfunction.
-
•
A combined risk stratification with coronary microvascular dysfunction and platelet-fibrin clot strength increased the prognostic implication to predict the rates of long-term clinical outcomes.
Summary
The association between thrombogenicity and coronary microvascular dysfunction (CMD) has been poorly explored in patients with acute myocardial infarction (AMI). In our real-world clinical practice (N = 116), thrombogenicity was evaluated with thromboelastography and conventional hemostatic measures, and CMD was defined as index of microcirculatory resistance of >40 U using the invasive physiologic test. High platelet-fibrin clot strength (P-FCS) (≥68 mm) significantly increased the risk of postprocedural CMD (odds ratio: 4.35; 95% CI: 1.74-10.89). Patients with both CMD and high P-FCS had a higher rate of ischemic events compared to non-CMD subjects with low P-FCS (odds ratio: 5.58; 95% CI: 1.31-23.68). This study showed a close association between heightened thrombogenicity and CMD and their prognostic implications after reperfusion in acute myocardial infarction patients.
Acute myocardial infarction (AMI) is one of the significant causes of death and is associated with high morbidity despite recent advances in procedural and pharmacologic modalities. Over the last few decades, the focus has been on timely reperfusion of the epicardial coronary artery in patients with AMI (1). Decreased myocardial perfusion has been associated with extensive myocardial infarction leading to adverse left ventricular remodeling and increased cardiac mortality (2). Coronary microvascular dysfunction (CMD) after reperfusion, such as microvascular obstruction, is also associated with poor clinical outcome. The index of microcirculatory resistance (IMR) is a quantitative and reproducible wire-based method to assess the CMD (3). High IMR following percutaneous coronary intervention (PCI) predicted the risk of atherothrombotic events in patients with acute coronary syndromes (4, 5, 6, 7, 8).
Restoration of perfusion triggers a cascade of events encompassing myocyte swelling, development of endothelial projections that occlude capillaries, platelet-neutrophil recruitment, and fibrin deposition (1). In an experimental model, coronary microembolization by atherothrombotic debris has been shown to contribute to the occurrence of microvascular obstruction (9). Because intrinsic hemostatic properties may affect the risk of microvascular obstruction (10), proper assessment and pharmacologic modulation of these properties could be an effective therapeutic strategy to prevent the risk of CMD (11, 12, 13, 14).
Hemostasis is a complex process involving both cellular elements (eg, platelet function and inflammatory cells) and plasma proteins (inflammatory, procoagulant, anticoagulant, and fibrinolytic factors) (15). However, few comprehensive studies have evaluated the impact of hemostatic components on CMD occurrence in patients with AMI. Moreover, there is a lack of strong clinical evidence to suggest a close relationship between ex vivo thrombogenicity properties and the occurrence of CMD assessed by an intracoronary physiologic test. The aim of this study was to evaluate the association between thrombogenicity indices and CMD, as well as its prognostic implications in patients with AMI.
Methods
Patient population
The study population was derived from the Gyeongsang-National University Hospital registry (NCT04650529), which was a prospective, 2-center database that enrolled PCI-treated patients with significant coronary artery disease, and evaluated multiple hemostatic, vascular, and physiologic parameters if indicated (16). In this retrospective analysis, we enrolled AMI patients who underwent uneventful PCI with available invasive physiologic assessments and thrombogenicity indices between January 2013 and December 2017 (Figure 1). AMI was defined as increased cardiac troponin values with ischemic symptoms or ischemic changes on electrocardiogram or imaging evidence of recent loss of viable myocardium or new regional wall motion abnormality (17).
Figure 1.

Measurements from Intracoronary Physiologic Testing and Thromboelastography
(A) Index of microcirculatory resistance. (B) Thromboelastography. α = the angle in degrees formed by the tangent line to the thromboelastography tracing measure at the reaction time; CFR = coronary flow reserve; EPL = estimated percent lysis; IMR = index of microcirculatory index; K = coagulation time; LY30 = percentage of the clot that has lysed 30 minutes after the time of maximum amplitude; MA = maximum amplitude; R = reaction time; Tmn = mean transit time.
Major inclusion criteria were timely PCI for AMI with standard pharmacologic therapy based on the current guidelines (18). Exclusion criteria were: 1) post-PCI Thrombolysis in Myocardial Infarction (TIMI) flow grade of ≤2; 2) previous history of myocardial infarction (MI); 3) cardiogenic shock; 4) New York Heart Association class 4; and 5) fibrinolytic therapy.
Baseline demographic, angiographic, and procedural characteristics and clinical outcome data were collected prospectively. Patients were routinely followed up at 1, 6, and 12 months after the index procedure and annually thereafter. Further information was collected by medical records or telephone contact if necessary. The Institutional Review Board of the hospital approved the study protocol (GNUH 2020-04-026) and waived the requirement for written informed consent for access to an institutional registry. The study was performed in accordance with the Good Clinical Practice Guidelines and the principles of the Declaration of Helsinki.
Procedures
After arrival at the emergency department, patients with suspected AMI planned for emergent PCI were treated with standard loading doses of aspirin and a P2Y12 receptor inhibitor. For anticoagulation, unfractionated heparin was administered with dosage according to label instructions (100 IU/kg). Glycoprotein IIb/IIIa inhibitor use was allowed during the procedure at the discretion of attending interventionists for bailout cases.
All the angiographic variables for calculating the SYNTAX (Synergy Between PCI With Taxus and Cardiac Surgery) score were obtained by reviewing the diagnostic angiograms acquired before the procedure. All PCI procedures were performed according to the standard technique (19). After uneventful PCI, we evaluated post-PCI TIMI flow. In cases of post-PCI TIMI flow 3, an invasive physiologic testing was conducted according to the predefined protocol. All patients were treated with guideline-recommended pharmacologic therapy.
Intracoronary physiologic testing
Coronary angiography was performed by standard techniques. All angiograms were analyzed at a local core laboratory in a blinded fashion. At the end of PCI, IMR was measured by 1 of 2 dedicated physicians (Drs Koh and Kang), using a pressure- and temperature-sensing guidewire (Abbott Vascular) through a guiding catheter (5-F to 7-F) without side holes (3). All patients received 200 mg of intracoronary nitroglycerin before the physiologic assessment. The calibrated wire was equalized to guide catheter pressure and then advanced to the distal third of the culprit artery. Intravenous adenosine infusion (140 μg/kg/min for 2 minutes) was used for hyperemia induction. Continuous recordings of aortic pressure and distal pressure were obtained during baseline and drug infusion periods. During maximal hyperemia, the fractional flow reserve was calculated as the ratio of mean distal to aortic pressure. Mean transit time (Tmn) during a hand-injected room temperature saline (3-mL bolus) was measured using the standard thermodilution methodology, in triplicate at rest and during steady-state maximal hyperemia.
IMR was quantified by distal coronary pressure × Tmn during hyperemia. Coronary flow reserve (CFR) was quantified by dividing resting Tmn by hyperemic Tmn (Figure 1A). All data were extracted from the RadiAnalyzer Xpress instrument and then analyzed offline using Coroflow software (Coroventis Research AB) by an investigator blinded to the results of hemostatic measurements.
Hemostatic measurements
According to the predetermined protocol, baseline biochemical assessment was performed in whole blood samples drawn immediately after arrival to the emergency department. Fibrinogen level was measured by the Clauss method with STA-Fibrinogen reagent (Diagnostica Stago), and D-dimer levels were measured by the immunoturbidimetric method with the STALiatest D-DI reagent (Diagnostica Stago), using a Stago STA-R Evolution hemostasis system (Diagnostica Stago). High-sensitivity C-reactive protein level was measured with a commercially available enzyme-linked immunosorbent assay using UniCel DxC 800 Synchron Clinical System (Beckman Coulter). Other biochemical measurements, including complete blood count, lipid profile, and chemistry profile, were performed immediately after arrival to the emergency department using standard laboratory assays.
Platelet function testing
Immediately after the arterial sheath insertion for coronary angiography, blood samples for platelet function analysis by VerifyNow assay (Accriva) were collected in 3.2% citrate Vacuette tubes (Greiner Bio-One Vacuette North America, Inc). The VerifyNow P2Y12 assay is a whole-blood, point-of-care, turbidimetric-based optical detection assay designed to measure platelet aggregation in response to an agonist that is based on the ability of activated platelets to bind to fibrinogen (20).
The first channel contains fibrinogen-coated polystyrene beads, 20 μmol/L adenosine diphosphate, and 22 nmol/L prostaglandin E1; the optical signal of this channel is reported as P2Y12 reaction units (PRU). The second channel contains fibrinogen-coated polystyrene beads, 3.4 mmol/L isothrombin receptor-activating peptide (protease-activated receptor-1 [PAR-1] agonist), and PAR-4–activating peptide; the optical signal of this channel is reported as the Base, which indicates the maximal platelet function independent of P2Y12 receptor blockade.
Thromboelastography
Immediately after the arterial sheath insertion for coronary angiography, blood samples for global hemostasis by thromboelastography (TEG) were drawn into Vacutainer tubes containing 3.2% trisodium citrate (Becton Dickinson). The assay was performed using the TEG 5000 Hemostasis Analyzer System (Haemonetics Corp) with automated analytical software (21) (Figure 1B), which provides measurements of the viscoelastic properties of a clot. Briefly, 500 μL of citrated blood is mixed with kaolin by inversion, and 340 μL of the activated blood is then transferred to a reaction cup, to which 20 μL of 200 mmol/L calcium chloride is added. In heparin-pretreated cases, a vial containing heparinase is used to neutralize the heparin effect. A stationary pin is suspended into an oscillating cup that contains the whole blood sample. As the blood clots, it links the pin to the cup. Pin movement is converted into an electrical signal by a transducer and is interpreted by the computer to create a tracing. The degree of platelet contribution to the clot strength through platelet-fibrin bonding directly influences the magnitude of pin movement and, ultimately, the amplitude of the tracing.
Reaction time (R, in minutes), a representative of the initiation phase of enzymatic clotting, is the time from the start of the sample run to the point of the first significant clot formation corresponding to an amplitude of 2 mm reading on the TEG tracing. K is a measure of the time to reach 20-mm clot strength from R. Angle (α) is reflective of fibrinogen activity and is the degrees of the angle formed by the tangent line to TEG tracing measure at R. Kaolin-induced maximum amplitude (MA, in millimeters) represents the maximum platelet-fibrin clot strength (P-FCS) and is influenced by changes in fibrinogen, platelet count, and platelet function. Multiple clinical studies have suggested the influence of P-FCS on the occurrence of clinical events in patients with coronary artery disease undergoing PCI (16,21). LY30 indicates the percentage of the clot that has lysed 30 minutes after the occurrence of MA and indicates the level of fibrinolytic activity.
Endpoints and definitions
The primary endpoint was P-FCS level between the CMD and non-CMD groups (16,21). The secondary endpoints were: 1) other thrombogenicity indices between the groups; and 2) the impact of major thrombogenicity indices on clinical events according to CMD status.
Major adverse cardiovascular events (MACE) were defined as a composite of death, MI, revascularization, or rehospitalization caused by heart failure (22). All-cause death included death from cardiovascular and noncardiovascular causes during the follow-up. MI was defined as increased cardiac troponin values with ischemic symptoms or ischemic changes on electrocardiography or imaging evidence of recent loss of viable myocardium or new regional wall motion abnormality (17).
Statistical analysis
A previous trial suggested that patients with an IMR of >40 U were observed in 28% of AMI patients after PCI (23). Our previous study demonstrated a greater P-FCS in high-risk patients with versus without peripheral artery disease (68.8 ± 9.8 vs 62.0 ± 10.0 mm; P < 0.001) (16). We assumed that the level of P-FCS would be similar according to CMD status. Based on previous results, at least 114 patients were needed to detect an absolute difference of 6.8 mm, with a power of 90% and a 2-sided alpha error of 0.05.
The Kolmogorov-Smirnov test was performed to analyze the normal distribution of continuous variables. Continuous variables are presented as mean ± SD or as median (interquartile range), as appropriate, and categorical variables were reported as frequencies (percentages). The unpaired Student’s t-test for parametric continuous variables and the Mann-Whitney U test for nonparametric continuous variables are used to compare the CMD versus non-CMD groups. Comparisons between categorical variables were performed using the chi-square or Fisher exact test, as appropriate.
The least absolute shrinkage and selection operator (LASSO) method, which is suitable for a regression model with high-dimensional data, was used to determine the risk factors for CMD. With larger penalties, the estimates of weaker factors shrink toward 0 (minimal λ value) so that only the strongest predictors remain in the model. Then, the odds ratios (ORs) for the risk factors were calculated by the exponential of coefficients and are presented with the c-index. Receiver-operating characteristic (ROC) curve analysis was performed to find the optimal cutoff for P-FCS to further evaluate the association between CMD status and MACE. Kaplan-Meier methods were used to both compare MACE over time (log-rank test) and estimate the rate of MACE at 3 years (chi-square test). Cox proportional hazards models were used to estimate HRs with 95% CIs. Penalized Cox proportional hazards regression models were used to determine independent predictors of MACE. A P value of <0.05 was considered statistically significant, and statistical analyses were performed using SPSS software, version 24.0 (SPSS Inc) and R software, version 4.0.3 (R Core Team).
Results
Patient characteristics
During the study period, 140 patients who presented with AMI underwent invasive physiologic testing. After exclusion, 116 patients were enrolled in the final cohort (Figure 2). CMD (IMR: >40 U) was observed in 26 patients (22.4%). Patients with CMD were older and had lower levels of hemoglobin and left ventricular ejection fraction compared to patients without CMD (Table 1). There were no differences in lesional and procedural characteristics between the groups. Patients with CMD showed lower CFR levels than those without CMD (1.5 ± 1.0 vs 2.0 ± 0.9; P = 0.039) (Table 2).
Figure 2.

Flow Diagram of the Study
AMI = acute myocardial infarction; IMR = index of microcirculatory resistance; MI = myocardial infarction; NYHA = New York Heart Association; PCI = percutaneous coronary intervention.
Table 1.
Baseline Characteristics
| Total (N = 116) | CMD Group (n = 26) | Non-CMD Group (n = 90) | P Value | |
|---|---|---|---|---|
| Index presentation with AMI | 116 (100) | 26 (100) | 90 (100) | >0.999 |
| Time from symptom onset to balloon, min | 205 ± 123 | 189 ± 94 | 211 ± 132 | 0.491 |
| Age, y | 62 ± 12 | 67 ± 14 | 60 ± 10 | 0.006 |
| Female | 28 (24.1) | 12 (46.2) | 16 (17.8) | 0.008 |
| Body mass index, kg/m2 | 24.1 ± 3.3 | 23.1 ± 3.6 | 24.4 ± 3.2 | 0.089 |
| Risk factor or past medical history | ||||
| Diabetes mellitus | 26 (22.4) | 5 (19.2) | 21 (23.3) | 0.793 |
| Hypertension | 47 (40.5) | 13 (50.0) | 34 (37.8) | 0.365 |
| Dyslipidemia | 54 (46.6) | 9 (34.6) | 45 (50.0) | 0.187 |
| Chronic kidney disease | 13 (11.2) | 2 (7.7) | 11 (12.2) | 0.730 |
| Anemia | 20 (17.2) | 6 (23.1) | 14 (15.6) | 0.385 |
| Previous MI | 0 (0) | 0 (0) | 0 (0) | >0.999 |
| Previous PCI | 6 (5.2) | 1 (3.8) | 5 (5.6) | >0.999 |
| Previous stroke | 6 (5.2) | 2 (7.7) | 4 (4.4) | 0.615 |
| Laboratory findings | ||||
| WBC count, ×10³/mm³ | 9.9 ± 3.6 | 9.9 ± 2.6 | 9.8 ± 3.8 | 0.877 |
| Hemoglobin, g/dL | 14.2 ± 1.8 | 13.4 ± 1.7 | 14.4 ± 1.8 | 0.012 |
| Platelet count, ×10³/mm³ | 248 ± 70 | 263 ± 69 | 244 ± 70 | 0.231 |
| Hemoglobin A1c, % | 6.3 ± 1.6 | 6.1 ± 1.7 | 6.3 ± 1.5 | 0.466 |
| GFR, mL/min/1.73 m2 (MDRD) | 87 ± 23 | 85 ± 15 | 88 ± 25 | 0.671 |
| Total cholesterol, mg/dL | 190 ± 51 | 186 ± 33 | 191± 55 | 0.599 |
| HDL cholesterol, mg/dL | 44 ± 12 | 43 ± 12 | 44 ± 12 | 0.680 |
| LDL cholesterol, mg/dL | 133 ± 41 | 127 ± 30 | 135 ± 43 | 0.407 |
| Left ventricular ejection fraction, % | 53 ± 10 | 49 ± 10 | 54 ± 8 | 0.008 |
| Concomitant medications | ||||
| Aspirin | 112 (96.6) | 25 (96.2) | 87 (96.7) | >0.999 |
| P2Y12 receptor inhibitor | 0.238 | |||
| Clopidogrel | 75 (64.7) | 20 (76.9) | 55 (61.1) | |
| Ticagrelor | 27 (23.3) | 3 (11.5) | 24 (26.7) | |
| Prasugrel | 4 (3.4) | 1 (3.8) | 3 (3.3) | |
| Beta blocker | 87 (75.0) | 15 (57.7) | 72 (80.0) | 0.037 |
| Angiotensin blockade | 80 (69.0) | 13 (50.0) | 67 (74.4) | 0.029 |
| Statin | 113 (98.3) | 25 (96.2) | 88 (98.9) | 0.403 |
| Proton pump inhibitor | 83 (72.2) | 19 (73.1) | 64 (71.9) | >0.999 |
| Procedural characteristics | ||||
| Pre-PCI TIMI grades 0-2 | 96 (82.8) | 22 (84.6) | 74 (82.2) | >0.999 |
| Thrombus grades 4 or 5 | 94 (81.0) | 21 (80.8) | 73 (81.1) | >0.999 |
| Post-PCI TIMI grade 3 | 116 (100) | 26 (100) | 90 (100) | >0.999 |
| Infarct-related artery | 0.234 | |||
| Left anterior descending | 73 (62.9) | 15 (57.7) | 58 (64.4) | |
| Left circumflex | 16 (13.8) | 2 (7.7) | 14 (15.6) | |
| Right coronary artery | 27 (23.3) | 9 (34.6) | 18 (20.0) | |
| Collateral flow grade | 0.372 | |||
| 0 | 83 (71.6) | 17 (65.4) | 66 (73.3) | |
| I | 19 (16.4) | 7 (26.9) | 12 (13.3) | |
| II | 9 (7.8) | 1 (3.8) | 8 (8.9) | |
| III | 5 (4.3) | 1 (3.8) | 4 (4.4) | |
| I-III | 33 (28.4) | 9 (34.6) | 24 (26.7) | 0.289 |
| II-III | 14 (12.1) | 2 (7.7) | 12 (13.3) | 0.348 |
| Multivessel disease | 60 (51.7) | 16 (61.5) | 44 (48.9) | 0.275 |
| ACC/AHA lesion type B2/C | 66 (56.9) | 15 (57.7) | 51 (56.7) | >0.999 |
| Chronic total occlusion lesion | 3 (2.6) | 1 (3.8) | 2 (2.2) | 0.536 |
| SYNTAX score | ||||
| Culprit vessel score | 11.9 ± 2.2 | 12.3 ± 2.2 | 11.8 ± 2.2 | 0.255 |
| Total score | 21.8 ± 11.3 | 24.5 ± 9.7 | 21.0 ± 11.7 | 0.174 |
| Multivessel PCI | 11 (9.5) | 2 (7.7) | 9 (10.0) | 0.534 |
| Aspiration thrombectomy | 58 (50.0) | 16 (61.5) | 42 (46.7) | 0.265 |
| Bailout use of tirofiban | 31 (26.7) | 9 (34.6) | 22 (24.4) | 0.321 |
| Intervention method | 0.615 | |||
| Everolimus-eluting stent | 57 (49.1) | 15 (57.7) | 42 (46.7) | |
| Zotarolimus-eluting stent | 31 (26.7) | 6 (23.1) | 25 (27.8) | |
| Sirolimus-eluting stent | 11 (9.5) | 1 (3.8) | 10 (11.1) | |
| BVS | 17 (14.7) | 4 (15.4) | 13 (14.4) | |
| Number of stents | 1.2 ± 0.4 | 1.1 ± 0.4 | 1.2 ± 0.5 | 0.591 |
| Stent diameter, mm | 3.2 ± 0.4 | 3.2 ± 0.4 | 3.2 ± 0.5 | 0.909 |
| Stent length, mm | 30 ± 16 | 28 ± 14 | 31 ± 16 | 0.318 |
| Postdilation | 90 (77.6) | 18 (69.2) | 72 (80.0) | 0.288 |
Values are n (%) or mean ± SD.
ACC/AHA = American College of Cardiology/American Heart Association; AMI = acute myocardial infarction; BVS = bioresorbable vascular scaffold; GFR = glomerular filtration rate; HDL = high-density lipoprotein; LDL = low-density lipoprotein; MDRD = modification of diet in renal disease; MI = myocardial infarction; PCI = percutaneous coronary intervention; SYNTAX = Synergy Between PCI With Taxus and Cardiac Surgery; TIMI = thrombolysis in myocardial infarction; WBC = white blood cell.
Table 2.
Hemostatic and Physiologic Tests According to Coronary Microvascular Dysfunction
| Total (N = 116) | CMD Group (n = 26) | Non-CMD Group (n = 90) | P Value | |
|---|---|---|---|---|
| Hemostatic measurement | ||||
| NT-proBNP, pg/mL | 337.6 ± 587.2 | 417.9 ± 786.2 | 313.1 ± 515.3 | 0.438 |
| hs-CRP, mg/L | 4.7 ± 11.2 | 5.0 ± 9.3 | 4.7 ± 11.6 | 0.915 |
| Fibrinogen, mg/dL | 331 ± 88 | 334 ± 94 | 331 ± 87 | 0.863 |
| D-dimer, μg/L | 543 ± 447 | 787 ± 646 | 473 ± 345 | 0.001 |
| VerifyNow P2Y12 assay (Accriva_ | ||||
| PRU | 204 ± 95 | 235 ± 110 | 195 ± 89 | 0.065 |
| Base | 249 ± 64 | 253 ± 70 | 247 ± 62 | 0.678 |
| Post-PCI physiologic test | ||||
| FFR | 0.89 ± 0.06 | 0.88 ± 0.07 | 0.89 ± 0.05 | 0.225 |
| CFR | 1.9 ± 0.9 | 1.5 ± 1.0 | 2.0 ± 0.9 | 0.039 |
| IMR, U | 29.2 ± 21.1 | 60.3 ± 23.3 | 20.2 ± 7.8 | <0.001 |
| Pd | 78.1 ± 18.8 | 79.9 ± 16.7 | 77.6 ± 19.4 | 0.609 |
| 1/Tmn | 3.7 ± 1.9 | 1.5 ± 0.6 | 4.3 ± 1.7 | <0.001 |
Values are mean ± SD.
CFR = coronary flow reserve; CMD = coronary microvascular dysfunction; FFR = fractional flow reserve; hs-CRP = high-sensitivity C-reactive protein; IMR = index of microcirculatory resistance; NT-proBNP = N-terminal pro–B-type natriuretic peptide; PCI = percutaneous coronary intervention; Pd = distal coronary pressure; Tmn = mean transit time; PRU = P2Y12 reaction units.
TEG parameters
Compared with the non-CMD group, the CMD group had higher P-FCS (MA: 69.9 ± 5.8 vs 62.5 ± 8.8 mm; P < 0.001) (Figure 3). In addition, the CMD group showed a different dynamic profile of clot development as compared to the non-CMD group (α: 68.6° ± 10.6° vs 62.1° ± 14.0°; P = 0.032). However, there were no significant differences in reaction time (R) and clot lysis (LY30) between the groups.
Figure 3.

Thromboelastography Measurement in the CMD Versus Non-CMD Groups
CMD = coronary microvascular dysfunction; P-FCS = platelet-fibrin clot strength; other abbreviations as in Figure 1.
Conventional hemostatic measurements
D-dimer value was greater in patients with versus without CMD (787 ± 646 vs 473 ± 345 μg/L; P = 0.001) (Table 2). Platelet reactivity was numerically greater in the CMD group than in the non-CMD group (235 ± 110 vs 196 ± 89 PRU; P = 0.065). Other hemostatic profiles did not show any statistical differences between the groups (Table 2).
Determinants of CMD occurrence
The 46 variables evaluated at hospital admission were included in the LASSO regression. After LASSO regression selection (Supplemental Figure 1), 5 variables remained as predictors of CMD (c-index: 0.809): age (OR: 1.005), sex (OR: 1.298), left ventricular ejection fraction (OR: 0.991), D-dimer (OR: 1.472), and P-FCS (OR: 1.058).
To further evaluate the relationship between CMD and P-FCS, we categorized P-FCS using both the quartiles and the optimal cutoff based on the ROC curve analysis. The prevalence of CMD was positively correlated with P-FCS (3.6% vs 21.9% vs 25.9% vs 41.4% by quartile distribution; P for trend <0.001) (Figure 4A). P-FCS of ≥68 mm was identified as the optimal cutoff of high P-FCS to predict CMD occurrence (c-index: 0.747; 95% CI: 0.644-0.850; P < 0.001) (Figure 4B). Patients with P-FCS of ≥68 mm had an approximate 4-fold increased odds of CMD (OR: 4.35; 95% CI: 1.74-10.89; P = 0.001) (Figure 4C).
Figure 4.

Association Between P-FCS and CMD Occurrence
(A) Distribution of P-FCS and prevalence of CMD. (B) Receiver-operating characteristic curve analysis: the optimal cutoff of P-FCS for CMD. (C) Risk of high P-FCS for CMD occurrence. OR = odds ratio; other abbreviations as in Figures 1 and 3.
Clinical outcomes
The median follow-up duration was 40 months (interquartile range 20-60). During the total follow-up period, 17 patients experienced a MACE occurrence, including 12 patients by the 3-year follow-up (3 deaths, 2 nonfatal MIs, 5 revascularizations, and 2 rehospitalizations caused by heart failure). Patients with high P-FCS did not show a statistically significant increased hazard of MACE (16.0% vs 8.7% at 3 years; OR: 2.23; 95% CI: 0.71-7.02; P = 0.172). The CMD group had a statistically significantly increased likelihood of MACE versus the non-CMD group (25.3% vs 7.8% at 3 years; OR: 4.20; 95% CI: 1.22-14.40; P = 0.022) (Figure 5A). However, patients with high CFR (>2) did not show a statistically significant increased risk of MACE compared with subjects with low CFR (≤2) (14.6% vs 6.0% at 3 years; OR: 2.76; 95% CI: 0.57-13.27; P = 0.205) (Figure 5B). In the LASSO regression selection, 3 variables still remained as predictors of MACE (c-index: 0.858): age (OR: 1.019), left ventricular ejection fraction (OR: 0.991), and IMR (OR: 1.149).
Figure 5.

Kaplan-Meier Curves of 3-Year MACE
(A) Groups divided by IMR. (B) Groups divided by CFR. (C) Groups divided by IMR and P-FCS. (D) Groups divided by CFR and P-FCS. CFR = coronary flow reserve; MACE = major adverse cardiovascular events; other abbreviations as in Figures 1 and 3.
Risk stratification with CMD and P-FCS criteria appeared to be synergistic to predict 3-year MACE (Table 3). Patients with both high IMR and high P-FCS showed a higher risk of MACE occurrence compared to those with both low IMR and low P-FCS (HR: 5.58; 95% CI: 1.31 to 23.68; P = 0.024) (Figures 5C and 5D).
Table 3.
Univariable Risk Ratio of 3-Year MACE Occurrence
| HR | 95% CI | P Value | |
|---|---|---|---|
| IMR ≤40 U + P-FCS <68 mm vs | |||
| IMR ≤40 U + P-FCS ≥68 mm | 1.12 | 0.19 – 6.48 | >0.999 |
| IMR >40 U + P-FCS <68 mm | 2.07 | 0.20 – 21.24 | 0.465 |
| IMR >40 U + P-FCS ≥68 mm | 5.58 | 1.31 – 23.68 | 0.024 |
| CFR >2 + P-FCS <68 mm vs | |||
| CFR >2 + P-FCS ≥68 mm | 0.92 | 0.83 – 1.03 | 0.544 |
| CFR ≤2 + P-FCS <68 mm | 0.88 | 0.14 – 5.63 | >0.999 |
| CFR ≤2 + P-FCS ≥68 mm | 3.23 | 0.61 – 17.10 | 0.274 |
CFR = coronary flow reserve; IMR = index of microcirculatory resistance; MACE = major adverse cardiovascular event; OR = odds ratio; P-FCS = platelet-fibrin clot strength.
Discussion
This is the first study, to our knowledge, to suggest the influence of thrombogenicity on CMD occurrence and its prognostic implications in patients with AMI. The main findings of the study are as follows: 1) preprocedural P-FCS levels were associated with the risk of CMD indicated by IMR at the end of PCI (P-FCS of ≥68 mm increased the risk for CMD by about 4-fold); 2) preprocedural levels of D-dimer and platelet reactivity showed the limited influence on the occurrence of post-PCI CMD risk; and 3) a combined risk stratification with CMD and high P-FCS increased the prognostic power to predict 3-year MACE.
Small arteries (100-400 μm) are most responsive to intravascular perfusion and flow changes, whereas arterioles (10 to <100 μm) are sensitive to tissue metabolites (1). These structures constitute a major resistance conduit in myocardial blood flow (indicated by IMR) and maintain a constant coronary blood flow through dynamic changes in lumen diameter. Therefore, prompt re-establishment of coronary blood flow after prolonged coronary occlusion always does not lead to positive changes at the microvascular level.
During the coronary recanalization procedure, multiple biochemical factors (eg, ischemia-reperfusion injury, endothelial abnormality, and external compression) may induce structural changes in resistance vessels (24). The activity of the thromboinflammatory axis may be related to the initiation and progression of clot formation and migration in the injured vessel and its downstream microvessels. Therefore, microembolization via atherosclerotic debris, platelet-neutrophil recruitment, and the deposition of fibrin can determine the degree of microvessel occlusion (1). Because microvascular obstruction itself contributes to the occurrence of CMD, this complex process related with CMD may be associated with a worse prognosis in patients with AMI (25).
It is uncertain which ex vivomeasured thrombogenicity indices can reflect better a in vivo thromboembolic cascade in humans. Along this line, the present analysis suggested important evidence regarding this issue. Hemostasis is a finely regulated process composed of approximately 80 biochemical reactions including both cellular elements and plasma proteins (15). Because routine hemostatic tests mostly ignore these interactions and focus on assessing a specific pathway, their values on predicting the clinical manifestation of thromboembolic events would be very limited. In this analysis, several biomarkers and surrogates (eg, hemoglobin, white blood cell count, platelet count, cholesterol, N-terminal pro–B-type natriuretic peptide, high-sensitivity C-reactive protein, fibrinogen, and PRU) did not show considerable relevance to predicting CMD occurrence. In line with this observation, a recent randomized trial showed a similar value of post-PCI IMR following clopidogrel versus ticagrelor loading in patients with acute coronary syndrome (26).
In the current analysis, a marked elevation in D-dimer levels was observed in patients with versus without CMD. D-dimers indicate the hypercoagulation activity and the presence of a thrombus (27). Coagulopathy in patients with COVID-19 increases the risk of thromboembolic events. An elevated level of D-dimer has been related to the risk of death and the level of thrombus burden in AMI patients (27,28). High D-dimer in COVID-19 may be associated with a prothrombotic state, a hypofibrinolytic state, or both. Therefore, this biomarker may have the potential to monitor COVID-19 coagulopathy and CMD occurrence. Our study also demonstrated the significant value of D-dimer in predicting important thromboembolic occlusion.
The TEG assay is a whole-blood ex vivo assay that measures the dynamic viscoelastic properties of clot generation from the time of initial plasmatic thrombin generation, to platelet-fibrin dependent clot formation, to clot strengthening, and finally to clot lysis (21). The TEG assay also provides comprehensive information on thrombin generation, the interaction between fibrinogen/fibrin and platelets to form a platelet-fibrin clot, the contribution of platelet count and function as well as fibrinogen level and activity to clot strength, and the stability of the clot (15). P-FCS (ie, MA measured by TEG) levels are affected by changes in fibrinogen level and activity as well as platelet count and function. In addition, our previous reports suggested close relationships with coagulation activity (prothrombin time), fibrinogen level, hemoglobin, and platelet count (21,29).
Because P-FCS can reflect the global hemostatic potential including both cellular elements and plasma proteins, this surrogate may better demonstrate in vivo thromboembolic processes and the risk of CMD occurrence following PCI in AMI patients. Because both CFR and fractional flow reserve reflect the physiologic status of the proximal epicardial coronary artery (>400 μm in diameter), the influence of TEG measurement on these indicators appeared insignificant in the present study. It’s a matter of course to observe the synergistic risk stratification with IMR and P-FCS, not with CFR and P-FCS.
Our study showed that post-PCI IMR of >40 U (the classic criterion of CMD) (4) was well correlated with pre-PCI P-FCS of ≥68 mm (16,21,29), indicating a strong association between intrinsic hypercoagulability and CMD risk. Moreover, thrombogenic phenotype (ie, elevated P-FCS) significantly increased the risk of MACE only in AMI patients with CMD. In line with these observations, the combined assessment of CMD and P-FCS may enhance the prognosis assessment and assist in potential personalization of adjunctive therapeutic strategy in high-risk AMI patients (25). High P-FCS may be a therapeutic target to determine the risks of CMD and long-term ischemic events (30). Hence, more intensified antithrombotic therapy, such as a glycoprotein IIb/IIIa inhibitor during PCI and adjunctive use of vascular-dose rivaroxaban for long-term treatment, can be considered in patients with this risk factor (31). Future clinical trials of novel adjunctive therapies are needed to lessen the risk of CMD in AMI patients treated with PCI.
Study limitations
The study was a single-center experience with a limited number of AMI patients having heterogeneous demographics and treatments, which was related with the character of this registry. Because post hoc testing to adjust type I error for multiple testing was not done, the results should be interpreted with caution. Because there has been critical concern regarding the clinical safety of potent P2Y12 inhibitors versus clopidogrel in East Asian patients presented with AMI (32), the type of antiplatelet regimen appeared not consistent in this analysis. However, the level of platelet reactivity did not show a significant relationship with CMD risk. One would indicate the limitation of the TEG assay with kaolin activator in measuring an antiplatelet effect. However, the present study did not show any difference in fibrin level according to CMD occurrence, and previous reports demonstrated that P-FCS level is significantly associated with multiple hemostatic components, including prothrombin time, fibrinogen, hemoglobin, and platelet count and function (21,29). The study is underpowered to suggest the definite clinical impact of CMD and P-FCS criteria. In addition, currently available hemostatic measurements were selected by the investigators’ experiences and updated knowledge; other important hemostatic biomarkers related to microvascular obstruction may have been missed.
Conclusions
This is the first study to suggest a close relation of hypercoagulability (high P-FCS) assessed by TEG to CMD after reperfusion in AMI patients. In addition, the combined measurements of P-FCS and CMD may enhance the risk stratification and facilitate future targeting of adjunctive antithrombotic therapies.
Perspectives.
COMPETENCY IN MEDICAL KNOWLEDGE: This study offers novel evidence to evaluate the influence of thrombogenicity on microvascular obstruction. This is the first study, to our knowledge, to demonstrate the close association between P-FCS (indicated with a thromboelastography-based parameter) and coronary microvascular dysfunction (indicated with the wire-based IMR). Furthermore, combined risk stratification with P-FCS and IMR could more precisely predict long-term clinical outcomes. Future studies to expand on this pilot study would yield insightful knowledge regarding the relationship between thrombogenicity indices and invasive physiologic profiles after reperfusion.
TRANSLATIONAL OUTLOOK: Coronary microvascular dysfunction is a common complication following acute myocardial infarction, presenting an unmet therapeutic need. The translational outlook will involve the large-scale evaluation of patients with enhanced thrombogenicity for preventing the occurrence of coronary microvascular dysfunction. Future therapeutic interventions may involve periprocedural and long-term control of hypercoagulability in high-risk patients with coronary artery disease (eg, glycoprotein IIb/IIIa inhibitor and oral anticoagulant) aimed at reducing the risks of coronary microvascular dysfunction and long-term adverse clinical events.
Funding Support and Author Disclosures
This study was supported by the Basic Science Research Program through the National Research Foundation (NRF) of Korea funded by the Ministry of Science, ICT, and Future Planning (NRF-2015R1A5A2008833). The content is solely the responsibility of the authors and does not necessarily represent the official views of any funding agencies. Dr Gurbel has received grants and personal fees from Bayer HealthCare, Otitopic, Amgen, and Janssen, US WorldMeds; grants from Instrumentation Laboratory, Hikari Dx, Haemonetics, Medicure, and Idorsia Pharmaceuticals; and personal fees from UpToDate and has patents “Detection of Restenosis Risk in Patients Issued” and “Assessment of Cardiac Health and Thrombotic Risk in a Patient.” Dr Jeong has received honoraria for lectures from AstraZeneca, Daiichi Sankyo, Sanofi-Aventis, Han-mi Pharmaceuticals, and Yuhan Pharmaceuticals and research grants or support from Yuhan Pharmaceuticals and U and I Corporation. All other authors have reported that they have no relationships relevant to the contents of this paper to disclose.
Footnotes
The authors attest they are in compliance with human studies committees and animal welfare regulations of the authors’ institutions and Food and Drug Administration guidelines, including patient consent where appropriate. For more information, visit the Author Center.
Appendix
For a supplemental figure, please see the online version of this paper.
Contributor Information
Jin-Sin Koh, Email: kjs0175@gmail.com.
Young-Hoon Jeong, Email: goodoctor@naver.com.
Appendix
References
- 1.Clarke J.D., Kennedy R., Duarte Lau F., Lancaster G.I., Zarich S.W. Invasive evaluation of the microvasculature in acute myocardial infarction: coronary flow reserve versus the index of microcirculatory resistance. J Clin Med. 2019;9:86. doi: 10.3390/jcm9010086. [DOI] [PMC free article] [PubMed] [Google Scholar]
- 2.Pfeffer M.A., Braunwald E. Ventricular remodeling after myocardial infarction. Experimental observations and clinical implications. Circulation. 1990;81:1161–1172. doi: 10.1161/01.cir.81.4.1161. [DOI] [PubMed] [Google Scholar]
- 3.Fearon W.F., Balsam L.B., Farouque H.M. Novel index for invasively assessing the coronary microcirculation. Circulation. 2003;107:3129–3132. doi: 10.1161/01.CIR.0000080700.98607.D1. [DOI] [PubMed] [Google Scholar]
- 4.Fearon W.F., Low A.F., Yong A.S. Prognostic value of the index of microcirculatory resistance measured after primary percutaneous coronary intervention. Circulation. 2013;127:2436–2441. doi: 10.1161/CIRCULATIONAHA.112.000298. [DOI] [PMC free article] [PubMed] [Google Scholar]
- 5.de Waha S., Patel M.R., Granger C.B. Relationship between microvascular obstruction and adverse events following primary percutaneous coronary intervention for ST-segment elevation myocardial infarction: an individual patient data pooled analysis from seven randomized trials. Eur Heart J. 2017;38:3502–3510. doi: 10.1093/eurheartj/ehx414. [DOI] [PubMed] [Google Scholar]
- 6.Murai T., Yonetsu T., Kanaji Y. Prognostic value of the index of microcirculatory resistance after percutaneous coronary intervention in patients with non-ST-segment elevation acute coronary syndrome. Catheter Cadiovasc Interv. 2018;92:1063–1074. doi: 10.1002/ccd.27529. [DOI] [PubMed] [Google Scholar]
- 7.Camici P.G., Crea F. Coronary microvascular dysfunction. N Engl J Med. 2007;356:830–840. doi: 10.1056/NEJMra061889. [DOI] [PubMed] [Google Scholar]
- 8.Duran J.R., 3rd, Taffet G. Coronary microvascular dysfunction. N Engl J Med. 2007;356:2324–2325. doi: 10.1056/NEJMc070666. author reply 2325. [DOI] [PubMed] [Google Scholar]
- 9.Heusch G., Schulz R., Haude M., Erbel R. Coronary microembolization. J Mol Cell Cardiol. 2004;37:23–31. doi: 10.1016/j.yjmcc.2004.04.011. [DOI] [PubMed] [Google Scholar]
- 10.Zalewski J., Undas A., Godlewski J., Stepien E., Zmudka K. No-reflow phenomenon after acute myocardial infarction is associated with reduced clot permeability and susceptibility to lysis. Arterioscler Thromb Vasc Biol. 2007;27:2258–2265. doi: 10.1161/ATVBAHA.107.149633. [DOI] [PubMed] [Google Scholar]
- 11.Sezer M., Cimen A., Aslanger E. Effect of intracoronary streptokinase administered immediately after primary percutaneous coronary intervention on long-term left ventricular infarct size, volumes, and function. J Am Coll Cardiol. 2009;54:1065–1071. doi: 10.1016/j.jacc.2009.04.083. [DOI] [PubMed] [Google Scholar]
- 12.McCartney P.J., Eteiba H., Maznyczka A.M. Effect of low-dose intracoronary alteplase during primary percutaneous coronary intervention on microvascular obstruction in patients with acute myocardial infarction: a randomized clinical trial. JAMA. 2019;321:56–68. doi: 10.1001/jama.2018.19802. [DOI] [PMC free article] [PubMed] [Google Scholar]
- 13.Solbeck S., Meyer M.A., Johansson P.I. Monitoring of dabigatran anticoagulation and its reversal in vitro by thrombelastography. Int J Cardiol. 2014;176:794–799. doi: 10.1016/j.ijcard.2014.07.084. [DOI] [PubMed] [Google Scholar]
- 14.van Leeuwen M.A.H., van der Hoeven N.W., Janssens G.N. Evaluation of microvascular injury in revascularized patients with ST-segment-elevation myocardial infarction treated with ticagrelor versus prasugrel. Circulation. 2019;139:636–646. doi: 10.1161/CIRCULATIONAHA.118.035931. [DOI] [PubMed] [Google Scholar]
- 15.Wegner J., Popovsky M.A. Clinical utility of thromboelastography: one size does not fit all. Semin Thromb Hemost. 2010;36:699–706. doi: 10.1055/s-0030-1265286. [DOI] [PubMed] [Google Scholar]
- 16.Bae J.S., Ahn J.H., Jang J.Y. The Impact of platelet-fibrin clot strength on occurrence and clinical outcomes of peripheral artery disease in patients with significant coronary artery disease. J Thromb Thrombolysis. 2020;50:969–981. doi: 10.1007/s11239-020-02103-w. [DOI] [PubMed] [Google Scholar]
- 17.Thygesen K., Alpert J.S., Jaffe A.S. Fourth universal definition of myocardial infarction. J Am Coll Cardiol. 2018;72:2231–2264. doi: 10.1016/j.jacc.2018.08.1038. [DOI] [PubMed] [Google Scholar]
- 18.Amsterdam E.A., Wenger N.K., Brindis R.G. 2014 AHA/ACC guideline for the management of patients with non-ST-elevation acute coronary syndromes: a report of the American College of Cardiology/American Heart Association Task Force on Practice Guidelines. J Am Coll Cardiol. 2014;64:e139–e228. doi: 10.1016/j.jacc.2014.09.017. [DOI] [PubMed] [Google Scholar]
- 19.Dehmer G.J., Badhwar V., Bermudez E.A. 2020 AHA/ACC key data elements and definitions for coronary revascularization: a report of the American College of Cardiology/American Heart Association Task Force on Clinical Data Standards (Writing Committee to Develop Clinical Data Standards for Coronary Revascularization) J Am Coll Cardiol. 2020;75:1975–2088. doi: 10.1016/j.jacc.2020.02.010. [DOI] [PubMed] [Google Scholar]
- 20.Jeong Y.H., Bliden K.P., Antonino M.J., Park K.S., Tantry U.S., Gurbel P.A. Usefulness of the VerifyNow P2Y12 assay to evaluate the antiplatelet effects of ticagrelor and clopidogrel therapies. Am Heart J. 2012;164:35–42. doi: 10.1016/j.ahj.2012.03.022. [DOI] [PubMed] [Google Scholar]
- 21.Jeong Y.H., Bliden K.P., Shuldiner A.R., Tantry U.S., Gurbel P.A. Thrombin-induced platelet-fibrin clot strength: relation to high on-clopidogrel platelet reactivity, genotype, and post-percutaneous coronary intervention outcomes. Thromb Haemost. 2014;111:713–724. doi: 10.1160/TH13-08-0643. [DOI] [PubMed] [Google Scholar]
- 22.Reboussin D.M., Allen N.B., Griswold M.E. Systematic review for the 2017 ACC/AHA/AAPA/ABC/ACPM/AGS/APhA/ASH/ASPC/NMA/PCNA Guideline for the Prevention, Detection, Evaluation, and Management of High Blood Pressure in Adults: a report of the American College of Cardiology/American Heart Association Task Force on Clinical Practice Guidelines. J Am Coll Cardiol. 2018;71:2176–2198. doi: 10.1016/j.jacc.2017.11.004. [DOI] [PMC free article] [PubMed] [Google Scholar]
- 23.Carrick D., Haig C., Ahmed N. Comparative prognostic utility of indexes of microvascular function alone or in combination in patients with an acute ST-segment-elevation myocardial infarction. Circulation. 2016;134:1833–1847. doi: 10.1161/CIRCULATIONAHA.116.022603. [DOI] [PMC free article] [PubMed] [Google Scholar]
- 24.Konijnenberg L.S.F., Damman P., Duncker D.J. Pathophysiology and diagnosis of coronary microvascular dysfunction in ST-elevation myocardial infarction. Cardiovasc Res. 2020;116:787–805. doi: 10.1093/cvr/cvz301. [DOI] [PMC free article] [PubMed] [Google Scholar]
- 25.Maznyczka A.M., Oldroyd K.G., McCartney P., McEntegart M., Berry C. The potential use of the index of microcirculatory resistance to guide stratification of patients for adjunctive therapy in acute myocardial infarction. J Am Coll Cardiol Intv. 2019;12:951–966. doi: 10.1016/j.jcin.2019.01.246. [DOI] [PubMed] [Google Scholar]
- 26.Park K., Cho Y.R., Park J.S., Park T.H., Kim M.H., Kim Y.D. Comparison of the effects of ticagrelor and clopidogrel on microvascular dysfunction in patients with acute coronary syndrome using invasive physiologic indices. Circ Cardiovasc Interv. 2019;12 doi: 10.1161/CIRCINTERVENTIONS.119.008105. [DOI] [PubMed] [Google Scholar]
- 27.Levi M., Thachil J., Iba T., Levy J.H. Coagulation abnormalities and thrombosis in patients with COVID-19. Lancet Haematol. 2020;7:e438–e440. doi: 10.1016/S2352-3026(20)30145-9. [DOI] [PMC free article] [PubMed] [Google Scholar]
- 28.Choudry F.A., Hamshere S.M., Rathod K.S. High thrombus burden in patients with COVID-19 presenting with ST-segment elevation myocardial infarction. J Am Coll Cardiol. 2020;76:1168–1176. doi: 10.1016/j.jacc.2020.07.022. [DOI] [PMC free article] [PubMed] [Google Scholar]
- 29.Jeong Y.H., Kevin B., Ahn J.H. Viscoelastic properties of clot formation and their clinical impact in East Asian versus Caucasian patients with stable coronary artery disease: a COMPARE-RACE analysis. J Thromb Thrombolysis. 2021;51:454–465. doi: 10.1007/s11239-020-02240-2. [DOI] [PubMed] [Google Scholar]
- 30.Ziegler M., Wang X., Peter K. Platelets in cardiac ischaemia/reperfusion injury: a promising therapeutic target. Cardiovasc Res. 2019;115:1178–1188. doi: 10.1093/cvr/cvz070. [DOI] [PMC free article] [PubMed] [Google Scholar]
- 31.Eikelboom J.W., Connolly S.J., Bosch J. Rivaroxaban with or without aspirin in stable cardiovascular disease. N Engl J Med. 2017;377:1319–1330. doi: 10.1056/NEJMoa1709118. [DOI] [PubMed] [Google Scholar]
- 32.Park D.W., Kwon O., Jang J.S. Clinically significant bleeding with ticagrelor versus clopidogrel in Korean patients with acute coronary syndromes intended for invasive management: a randomized clinical trial. Circulation. 2019;140:1865–1877. doi: 10.1161/CIRCULATIONAHA.119.041766. [DOI] [PubMed] [Google Scholar]
Associated Data
This section collects any data citations, data availability statements, or supplementary materials included in this article.