

Abstract
Activating transcription factor 3 (ATF3) has been shown to play an important role in HDL metabolism; yet, the role of hepatocytic ATF3 in the development of steatohepatitis remains elusive. Here we show that adenoassociated virus-mediated overexpression of human ATF3 in hepatocytes prevents diet-induced steatohepatitis in C57BL/6 mice and reverses steatohepatitis in db/db mice. Conversely, global or hepatocyte-specific loss of ATF3 aggravates diet-induced steatohepatitis. Mechanistically, hepatocytic ATF3 induces hepatic lipolysis and fatty acid oxidation and inhibits inflammation and apoptosis. We further show that hepatocyte nuclear factor 4α (HNF4α) is required for ATF3 to improve steatohepatitis. Thus, the current study indicates that ATF3 protects against steatohepatitis through, at least in part, hepatic HNF4α. Targeting hepatic ATF3 may be useful for treatment of steatohepatitis.
Introduction
Nonalcoholic fatty liver disease (NAFLD), which includes nonalcoholic fatty liver (NAFL)/simple steatosis and nonalcoholic steatohepatitis (NASH), is one of the most common liver diseases worldwide. While dysregulation of lipid metabolism may cause NAFL, the progression of NAFL to NASH may involve multiple pathological processes or mediators, such as insulin resistance, abnormal apoptosis, reactive oxygen species (ROS), lipotoxicity, and inflammation (1–7). In addition, defective lipolysis is also believed to play a role in the pathogenesis of NAFLD (8–10).
Activating transcription factor 3 (ATF3) is a member of the ATF/cAMP response element-binding protein family of transcription factors. In macrophages, ATF3 inhibits inflammatory response and mediates the anti-inflammatory effects of HDL (11–13). In adipocytes, ATF3 inhibits adipogenesis and induces adipocyte browning (14). Cardiomyocyte-specific Atf3−/− mice have impaired heart function after being fed a high-fat diet (HFD) (15). Very recently, hepatic ATF3 is shown to play a key role in regulating HDL metabolism, reverse cholesterol transport, and atherosclerosis (16). So far, the role of hepatic ATF3 in the development or reversal of NAFLD remains to be determined.
Hepatocyte nuclear factor 4α (HNF4α) is highly expressed in the liver and to a lesser extent in the intestine, pancreas, and kidney (17). HNF4α is required for the expression of a number of hepatic genes that regulate hepatocyte differentiation, energy metabolism, xenobiotic detoxification, bile acid synthesis, and plasma protein production (18,19). A recent study shows that hepatic HNF4α plays a key role in the development and progression of NAFLD (20). Hepatic HNF4α is also shown to interact with ATF3 and mediate the effect of ATF3 on bile acid metabolism (16).
In this report, we show that hepatic ATF3 protein levels are reduced in NAFLD patients or diabetic/obese mice, which likely results from an induction of hepatic miRNA 149 (miR-149). Adenoassociated virus 8 (AAV8)-mediated overexpression of human ATF3 (AAV8-ALB-hATF3) in hepatocytes protects against steatohepatitis induced by a high-fat/cholesterol/fructose (HFCF) diet. In contrast, hepatocyte-specific Atf3−/− (Atf3Hep−/−) mice have aggravated steatohepatitis upon being fed an HFCF diet. Mechanistically, we show that ATF3 regulates hepatic lipolysis, fatty acid oxidation (FAO), apoptosis, inflammation, and fibrosis. We further show that hepatic HNF4α plays a critical role in mediating these protective effects of ATF3. Our data indicate that hepatic ATF3 plays a key role in the pathogenesis of NAFLD by interaction with HNF4α.
Research Design and Methods
Mice, Diets, and Human Tissues
C57BL/6J mice (stock # 000664), Hnf4αfl/fl mice (stock # 004665), ACTB:FLPe mice (stock # 019100), db/db mice (stock # 000697), and ob/ob mice (stock # 000632) were purchased from The Jackson Laboratory (Bar Harbor, ME). Hnf4αfl/fl mice were cross-bred with C57BL/6J mice for at least 10 generations. Atf3tm2a(EUCOMM)Wtsi mice (knockout first with conditional potential) were purchased from the Mutant Mouse Resource & Research Center (MMRRC; stock # MMRRC_037805-UCD). Atf3tm2a(EUCOMM)Wtsi mice were crossed with ACTB:FLPe mice to remove the Frt-flanked LacZ-Neo cassette, resulting in floxed Atf3 mice. AAV8-TBG-Null or AAV8-TBG-Cre (produced by Vector Biolabs) was i.v. injected to Hnf4αfl/fl or Atf3fl/fl mice to generate control mice (Hnf4αfl/fl or Atf3fl/fl mice), hepatocyte-specific Hnf4α−/− (Hnf4αHep−/−) mice, or hepatocyte-specific Atf3−/− (Atf3Hep−/−) mice, respectively.
All mice were kept in a temperature- and humidity-controlled room with a 12-h light/dark cycle and free access to water and food. The HFCF diet contained 40% fat/0.2% cholesterol (AIN-76A Western Diet; TestDiet), and 4.2% fructose (in drinking water). Mice were fed a chow diet or the HFCF diet for 16–20 weeks. Unless otherwise stated, male mice were used and were fasted for 5–6 h prior to euthanasia. All of the animal experiments were approved by the Northeast Ohio Medical University Institutional Animal Care and Use Committee. Human liver tissues were obtained from the Liver Tissue Cell Distribution System at University of Minnesota, which was funded by National Institutes of Health (contract # HSN276201200017) (21). The use of human tissue samples was approved by the Northeast Ohio Medical University Institutional Review Board.
AAVs and Adenoviruses
Human ATF3 coding sequence was cloned into an AAV vector under the control of a mouse albumin promoter to generate AAV-ALB-hATF3. A similar strategy was used for cloning AAV-ALB-miR-149, which contained pri-miR-149 and 300 base-pair flanking sequences. AAV8-ALB-Null (control) or AAV8-ALB-ATF3 was produced using AAV serotype 8 and titrated by Vector Biolabs. Each mouse was i.v. injected with 3 × 10¹¹ genome copies of AAV and then fed the chow diet or the HFCF diet for up to 16 weeks. Ad-miR-149, containing the pri-miR-149 sequence plus 300 base-pair flanking sequences, was constructed as described before (22) and was purified using cesium chloride gradient centrifugation.
Cell Culture
Mouse primary hepatocytes (23), Kupffer cells (24), and stellate cells (25) were isolated from chow-fed mice or otherwise indicated. Mouse primary hepatocytes were cultured in DMEM containing vehicle or lipid mixture (100 μmol/L palmitate, 100 μmol/L oleic acid, 100 μmol/L linoleic acid, and 1 μg/mL cholesterol). After 24 h, the culture media were collected and used for treatment of Kupffer cells for 12 h. Tumor necrosis factor-α (TNFα) (cat # 900-TM54), interleukin (IL)-1β (cat # 900-M47), and MCP1 (cat # 900-M126) levels in the media were measured using ELISA kits from PeproTech. In a separate study, mouse primary hepatocytes or mouse primary hepatocytes plus Kupffer cells were cultured for 24 h in DMEM containing the lipid mixture (300 μmol/L palmitate, 300 μmol/L oleic acid, 300 μmol/L linoleic acid, and 1 μg/mL cholesterol). The cell culture media were collected and used for treatment of freshly isolated stellate cells for 24 h, and mRNA levels were determined.
Mouse Atf3 3′ untranslated region (UTR) was cloned into pMIR-Report (Promega). Mutagenesis was performed using a kit from Agilent to generate the mutant Atf3 3′UTR using the primer 5′-GCCTGTGGAGACCAGGGTTGGAAcggtGGTGCAGGGCCAGGCATCTGCATTGTGGG-3′ (plus strand). Plasmids were cotransfected into HepG2 cells with 75 nmol/L miRDIAN miR-149 mimics or scramble oligos using DharmaFECT 2 Transfection Reagent. After 36 h, luciferase activity was determined and normalized to β-galactosidase activity.
mRNA, miRNA, and Quantitative Real-Time PCR
RNA was extracted using Trizol Reagent (Thermo Fisher Scientific, Waltham, MA), and mRNA levels were quantified by quantitative real-time PCR using PowerUP SYBR Green Master Mix (Thermo Fisher) on a 7500 Real-Time PCR machine (Applied Biosystems). mRNA levels were normalized to 36B4. miRNAs were isolated using a mirVana miRNA Isolation kit (Thermo Fisher Scientific, cat # AM1560), reverse transcribed, and quantified using specific TaqMan Small RNA Assay reagents and TaqMan Universal PCR Master Mix II (Thermo Fisher Scientific, cat # 4440040), as described (21). miRNA levels were normalized to U6.
Western Blot and Immunoblotting Assays
Western blot assays were performed using whole-liver lysates or membrane extracts of the liver samples, as described previously (26,27). Antibodies against ATF3 (cat # ab207434), carboxylesterase (CES) 1 (cat # ab45957), CES2 (cat # ab56528), or tubulin (cat # ab4074) were purchased from Abcam. Antibodies against cholesterol 7α-hydroxylase (CYP7A1) (cat # TA351400) or sterol 12α-hydroxylase (CYP8B1) (cat # TA313734) were purchased from OriGene. Calnexin antibody (cat # NB100-1965) was purchased from Novus. Antibodies against phosphorylated Smad2/3 (cat # 8828), total Smad2/3 (cat # 5678), cleaved caspase 3 (CASP3) (cat # 9661), and total CASP3 (cat # 9662) were purchased from Cell Signaling Technology. Immunostaining was performed using an ABC-HRP kit from Vector Laboratories (cat # PK-4001) and an F4/80 antibody from Abcam (cat # ab6640).
Analysis of Lipids, Hydroxyproline, ROS, AST, ALT, β-Hydroxybutyrate, Cytokines, and Apoptosis
Liver tissue (∼100 mg) was homogenized in methanol and lipids were extracted in chloroform/methanol (2:1 v/v) as described (28). Triglycerides (TG) and cholesterol in the liver and plasma ALT or AST levels were measured using Infinity reagents from Thermo Fisher Scientific. Hepatic hydroxyproline level was quantified using a kit (cat # STA675) from Cell Biolabs (San Diego, CA). Hepatic ROS levels were measured using an OxiSelect in Vitro ROS/RNS Assay kit (cat # STA-347) from Cell Biolabs, as previously described (29). Plasma β-hydroxybutyrate (β-HB) level was determined using a kit from Pointe Scientific (Canton, MI). Plasma levels of IL-2 (cat # 900-M108), IL-4 (cat # 900-M49), and IL-5 (cat # 900-M406) were determined using ELISA kits from Peprotech. Plasma interferon-γ levels were analyzed using an ELISA kit (cat # DY485-05) from R&D Biosystems. Apoptosis was determined using a kit (cat # ab206386) from Abcam.
Triglyceride Hydrolase Activity Assays
Hepatic microsome proteins were isolated, and triglyceride hydrolase (TGH) activity was measured using [3H]triolein as the substrate as previously described (30).
Fatty Acid Oxidation
Primary hepatocytes were isolated and cultured in DMEM in 12-well dishes. Fatty acid oxidation (FAO) was performed using [3H]palmitate as the substrate as previously described (31,32).
De Novo Lipogenesis
Mice were injected with heavy water. After 4 h, newly synthesized TGs were analyzed by gas chromatography–mass spectrometry, as previously described (32).
Oil Red O, Hematoxylin and Eosin, or Picrosirius Red Staining
Liver was fixed in 10% formalin and then embedded in optimum cutting temperature compound or paraffin. Oil Red O (ORO), hematoxylin and eosin (H&E), or picrosirius red staining was performed as descried (32).
Analysis of Fatty Acid Levels and Composition
Hepatic total free fatty acids (FFAs) were measured using a kit from Wako Chemicals USA (Richmond, VA). Hepatic fatty acid composition was analyzed by gas chromatography–mass spectrometry as previously described (30).
Statistical Analysis
Statistical significance was analyzed using the unpaired Student t test or ANOVA (GraphPad Prism, San Diego, CA). All values are expressed as mean ± SEM. Differences were considered statistically significant at P < 0.05.
Data and Resource Availability
The data sets and source data generated and/or analyzed during the current study are available from the corresponding author upon reasonable request.
Results
Hepatic ATF3 Expression Is Reduced in NAFLD Patients and Diabetic or Western Diet-Fed Mice
To investigate the role of hepatic ATF3 in the pathogenesis of NAFLD, we first determined hepatic ATF3 expression in NAFLD patients. Hepatic ATF3 protein level was reduced by 63% in NAFL patients and 78% in NASH patients (Fig. 1A and B). In db/db, ob/ob, or Western diet (WD)-fed mice, hepatic ATF3 protein levels were reduced by 53%, 73%, and 58%, respectively (Fig. 1C and D). These results agreed with a recent study showing that ATF3 mRNA expression was reduced in the liver, muscle, and adipose tissue of obese people (14).
Figure 1.
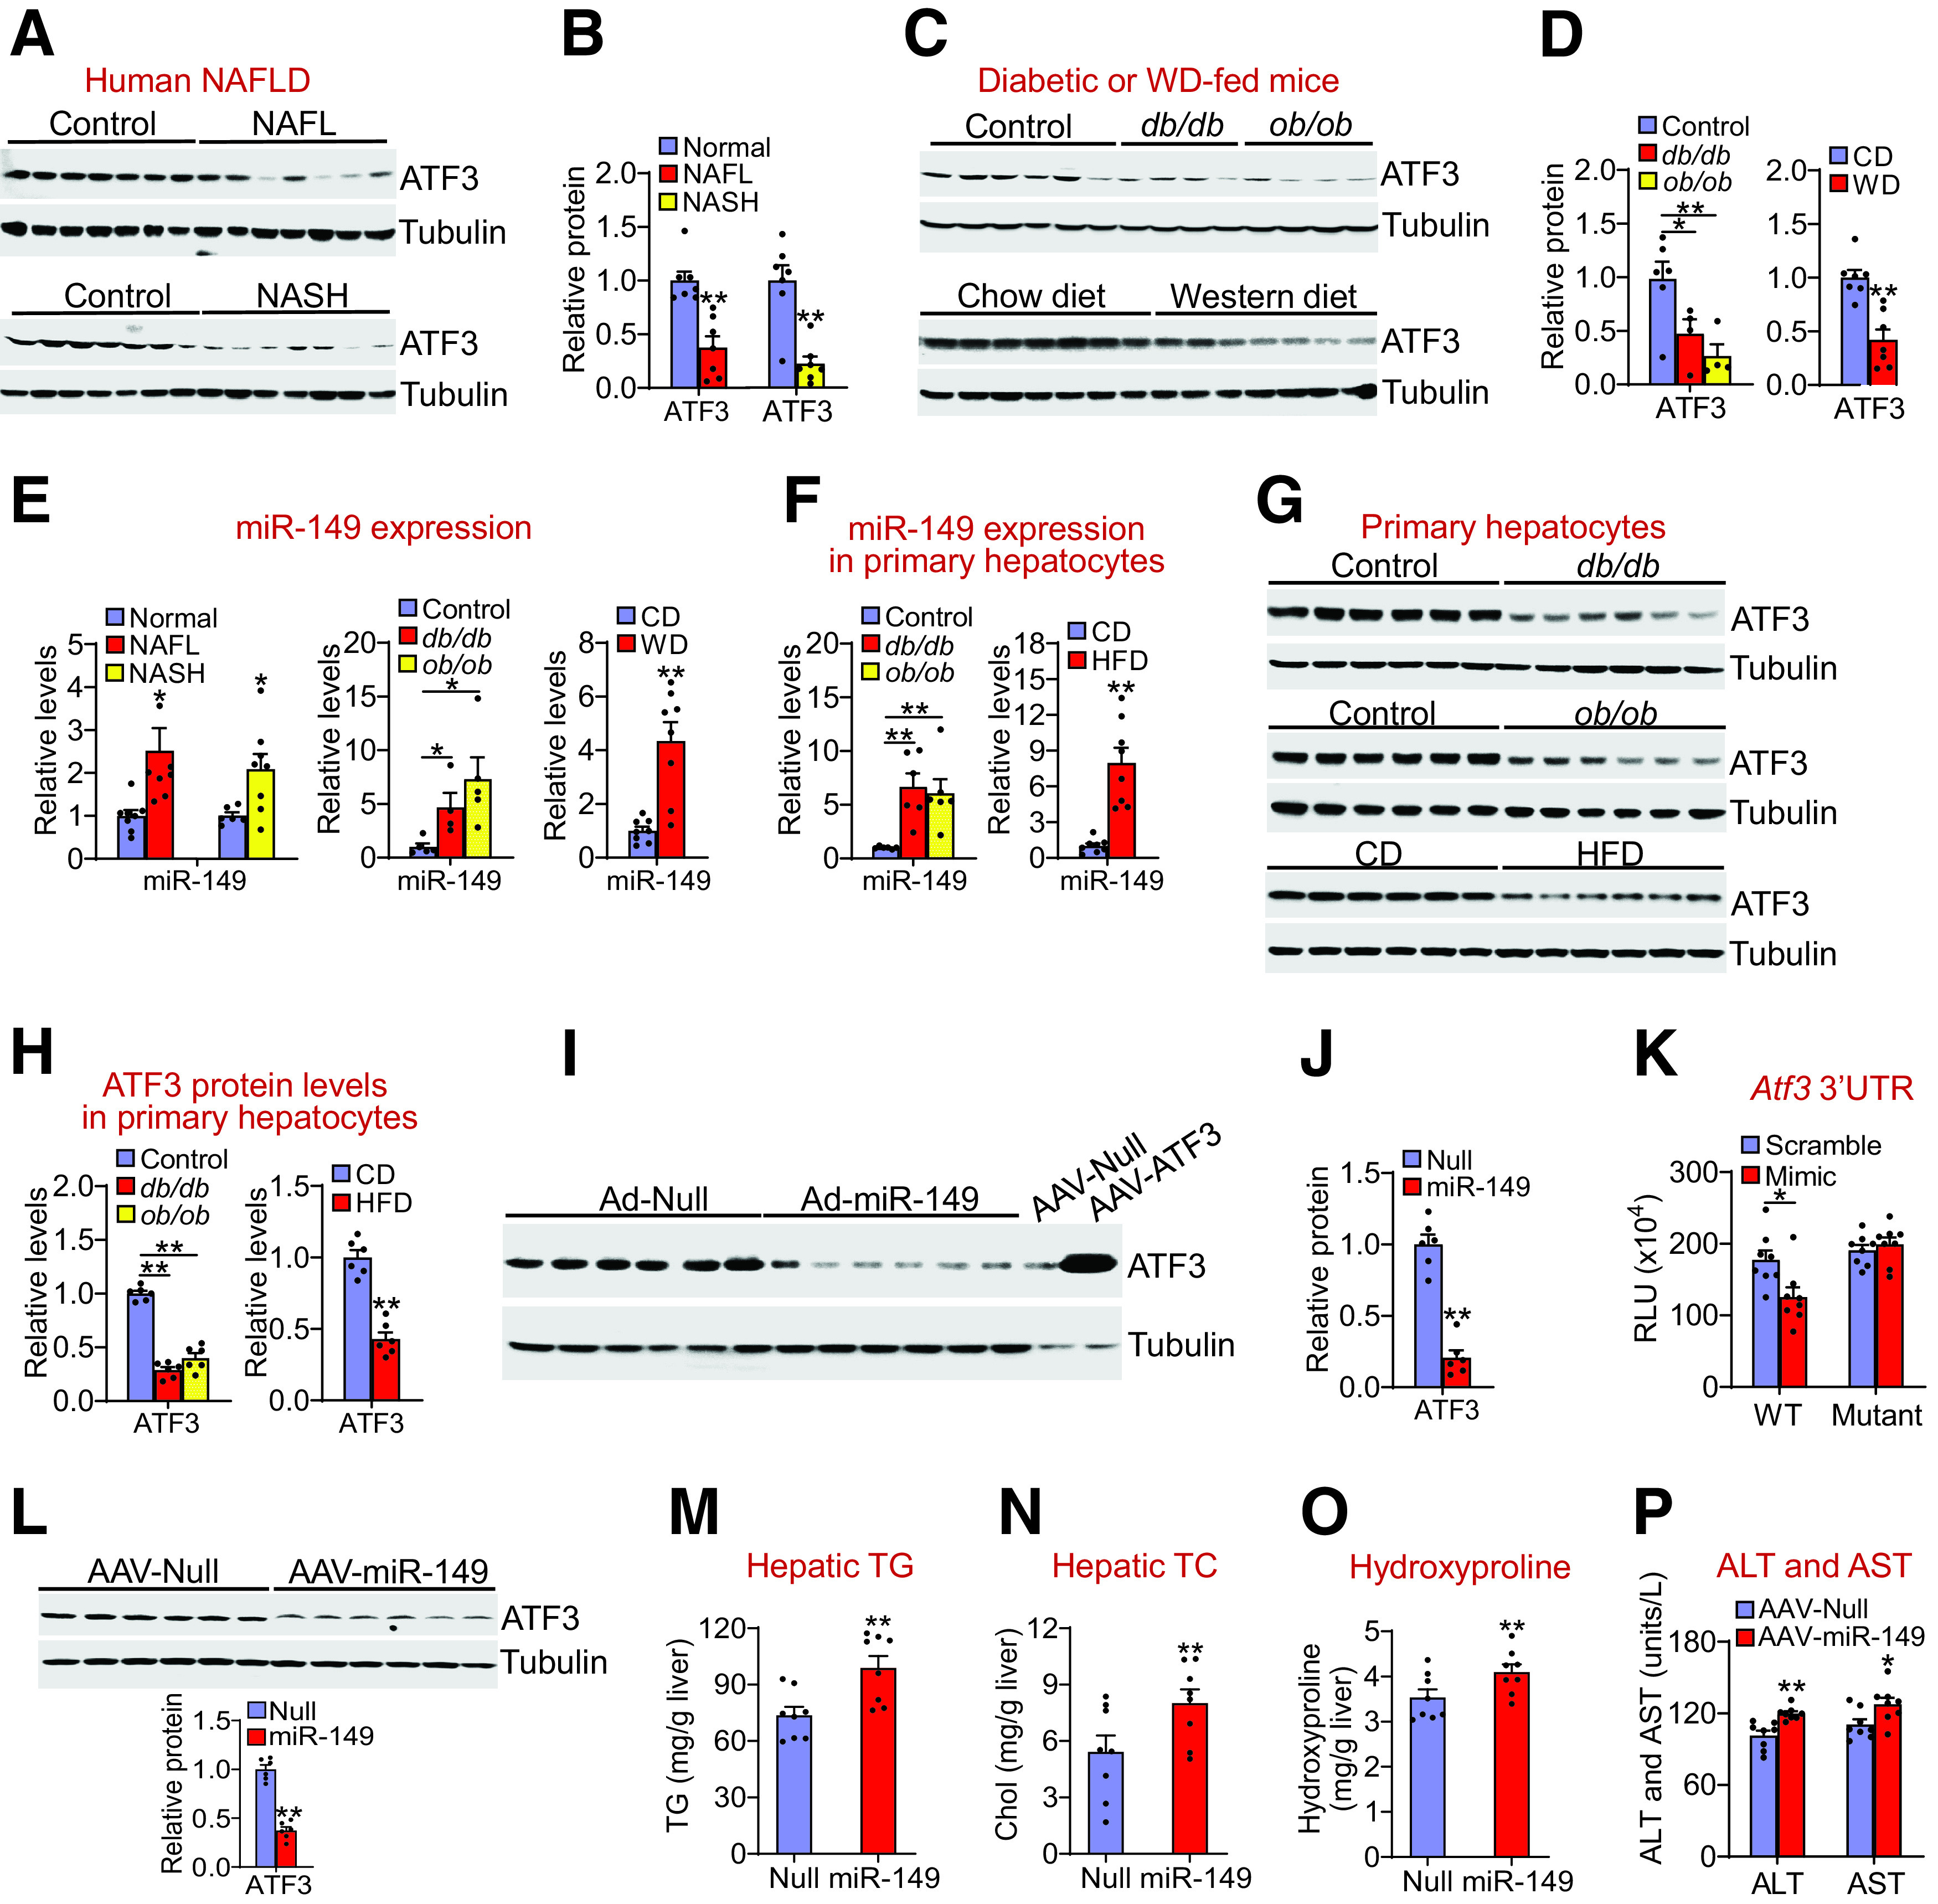
Hepatic ATF3 expression is reduced in NAFLD and is inhibited by miR-149. Hepatic proteins in normal individuals (control), NAFL patients (top panel), or NASH patients (bottom panel) were determined by Western blot assays (A), and ATF3 protein levels were quantified (B) (n = 7 per group). Hepatic proteins in the control, db/db, or ob/ob mice (top panel; n = 4–6 per group), or in the C57BL/6J mice fed a chow diet (CD) or WD (bottom panel; n = 7 per group) were determined by Western blot assays (C), and ATF3 protein levels were quantified (D). E: Hepatic miR-149 levels in NAFL or NASH patients (left panel; n = 6–8 per group), db/db or ob/ob mice (middle panel; n = 4–5 per group), or WD-fed mice (right panel; n = 8 per group) were determined. F–H: Primary hepatocytes were isolated from control mice, db/db mice, or ob/ob mice (n = 6 per group), or mice fed a chow diet (CD) or HFD for 2 months (n = 8 per group). MiR-149 levels were quantified (F), and protein levels were determined by Western blot assays (G and H). I and J: C57BL/6 mice were i.v. injected with Ad-Empty or Ad-miR-149. After 7 days, Western blot assays were performed (I), and hepatic ATF3 protein levels were quantified (J) (n = 6 per group). Hepatic protein lysates from mice infected with AAV8-ALB-Null or AAV8-ALB-ATF3 were used for a positive control (I). K: Wild-type or mutant Atf3 3′UTR luciferase plasmids were cotransfected with miR-149 mimics or scramble controls. After 36 h, luciferase activity was determined (n = 8 per group). RLU, relative luciferase units. L–P: C57BL/6J mice were i.v. injected with AAV8-ALB-Null or AAV8-ALB-miR-149 and then fed the HFCF diet for 16 weeks (n = 8 per group). L: Hepatic protein levels were determined by Western blot assays (top and bottom panels). Hepatic levels of TG (M), TC (N), and hydroxyproline (O) as well as plasma ATL and AST levels (P) were determined. All values are expressed as mean ± SEM. *P < 0.05, **P < 0.01 vs. control.
Hepatic miR-149 Is Induced in NAFLD and Inhibits ATF3 Expression
So far, the role of miR-149 in metabolic homeostasis is unknown. Interestingly, miR-149 levels were increased by more than twofold in NAFL or NASH patients and in db/db, ob/ob, or WD-fed mice (Fig. 1E). In primary hepatocytes isolated from db/db mice, ob/ob mice, or HFD-fed mice, miR-149 levels were increased by more than sixfold (Fig. 1F), whereas ATF3 protein levels were reduced >50% (Fig. 1G and H). These data suggest that miR-149 may play a role in inhibition of ATF3 expression.
Consistent with our hypothesis, adenovirus-mediated overexpression of miR-149 in the liver reduced hepatic ATF3 protein levels by 80% (Fig. 1I and J). Furthermore, adenovirus-mediated overexpression of miR-149 also reduced ATF3 protein expression in both HepG2 cells and mouse primary hepatocytes (Supplementary Fig. 1A–D). These data suggest that increased miR-149 expression can reduce ATF3 expression in hepatocytes. In addition, miR-149 mimics reduced Atf3 3′UTR activity, which was abolished when the miR-149 binding site was mutated (Fig. 1K).
To determine the role of hepatocytic miR-149 in fatty liver disease, we i.v. injected AAV8-ALB-miR-149 or AAV8-ALB-Null into C57BL/6J mice, which were then fed the HFCF diet for 16 weeks. Overexpression of miR-149 in hepatocytes reduced hepatic ATF3 protein levels by 63% (Fig. 1L) and increased hepatic levels of TG (Fig. 1M), total cholesterol (TC) (Fig. 1N), and hydroxyproline (Fig. 1O).
To understand how miR-149 was induced in NAFLD, we treated HepG2 cells or mouse primary hepatocytes with vehicle or FFAs, because hepatic FFAs are known to be elevated in NAFLD. Treatment of HepG2 cells or primary hepatocytes with palmitic acid (PA), oleic acid (OA), or linoleic acid (LA) induced miR-149 levels by more than twofold (Supplementary Fig. 1E and F). Importantly, treatment of HepG2 cells or mouse primary hepatocytes with PA, OA, or LA also reduced ATF3 protein levels by >50% (Supplementary Fig. 1G and H).
Taken together, the data of Fig. 1 and Supplementary Fig. 1 indicate that hepatic ATF3 expression is reduced, whereas miR-149 is induced in NAFLD, and that the inhibition of ATF3 expression in NAFLD may be mediated, at least in part, by induction of hepatocytic miR-149. In addition, our data suggest that the increased hepatic miR-149 expression may contribute to the pathogenesis of NAFLD.
Global Loss of ATF3 Aggravates Diet-Induced Steatohepatitis
The finding that hepatic ATF3 is reduced in NAFLD led us to ask whether genetic loss of ATF3 regulated the development of NAFLD. Atf3+/+ and Atf3−/− mice were fed the HFCF diet for 20 weeks. Atf3−/− mice had increased hepatic levels of TC, free cholesterol (FC), TG, FFAs, and hydroxyproline (Supplementary Fig. 2A–D), which were also confirmed in part by ORO, H&E, and picrosirius red staining (Supplementary Fig. 2E). In addition, Atf3−/− mice had increased hepatic macrophage infiltration (Supplementary Fig. 2E and F). Thus, global loss of ATF3 exacerbates diet-induced steatohepatitis.
Hepatocyte-Specific Expression of Human ATF3 Prevents Diet-Induced Steatohepatitis
So far, the role of hepatic ATF3 in the development of NAFLD has not been reported. We generated an AAV that expressed human ATF3 under the control of an albumin promoter (AAV8-ALB-hATF3) (16). When mice were fed the HFCF diet for 16 weeks, hepatocyte-specific expression of human ATF3 did not affect body weight but reduced liver weight (Supplementary Fig. 3A) and plasma levels of ALT and AST (Fig. 2A) and TC and TG (Fig. 2B and C). ATF3 overexpression also reduced hepatic levels of TC, FC (Fig. 2D), TG (Fig. 2E), FFAs (Fig. 2F), and C14:0, C16:0, C18:1, and C22:6 fatty acyl-CoAs (Fig. 2G). In addition, ATF3 overexpression reduced hepatic mRNA levels of genes involved in inflammation or fibrogenesis, including TNFα (Tnfα), IL-6 (Il6), IL-1β (Il1β), MCP1 (Mcp1), intercellular adhesion molecule 1 (Icam1), Toll-like receptor 2 (Tlr2), Tlr4, F4/80, cluster of differentiation 68 (Cd68), transforming growth factor-β (Tgfβ), tissue inhibitor of metalloproteinase 1 (Timp1), α-smooth muscle actin (α-Sma), collagen type 1 alpha1 (Col1α1), and Col1α2 (Fig. 2H). Consistent with the gene expression data, hepatic hydroxyproline levels were significantly reduced by ATF3 overexpression (Fig. 2I). Histological studies showed that ATF3 overexpression reduced hepatic neutral lipid accumulation (Fig. 2J), hepatic fibrosis, and macrophage infiltration (Fig. 2K and L). Together, these data demonstrate that overexpression of hepatocytic ATF3 protects against diet-induced steatohepatitis.
Figure 2.
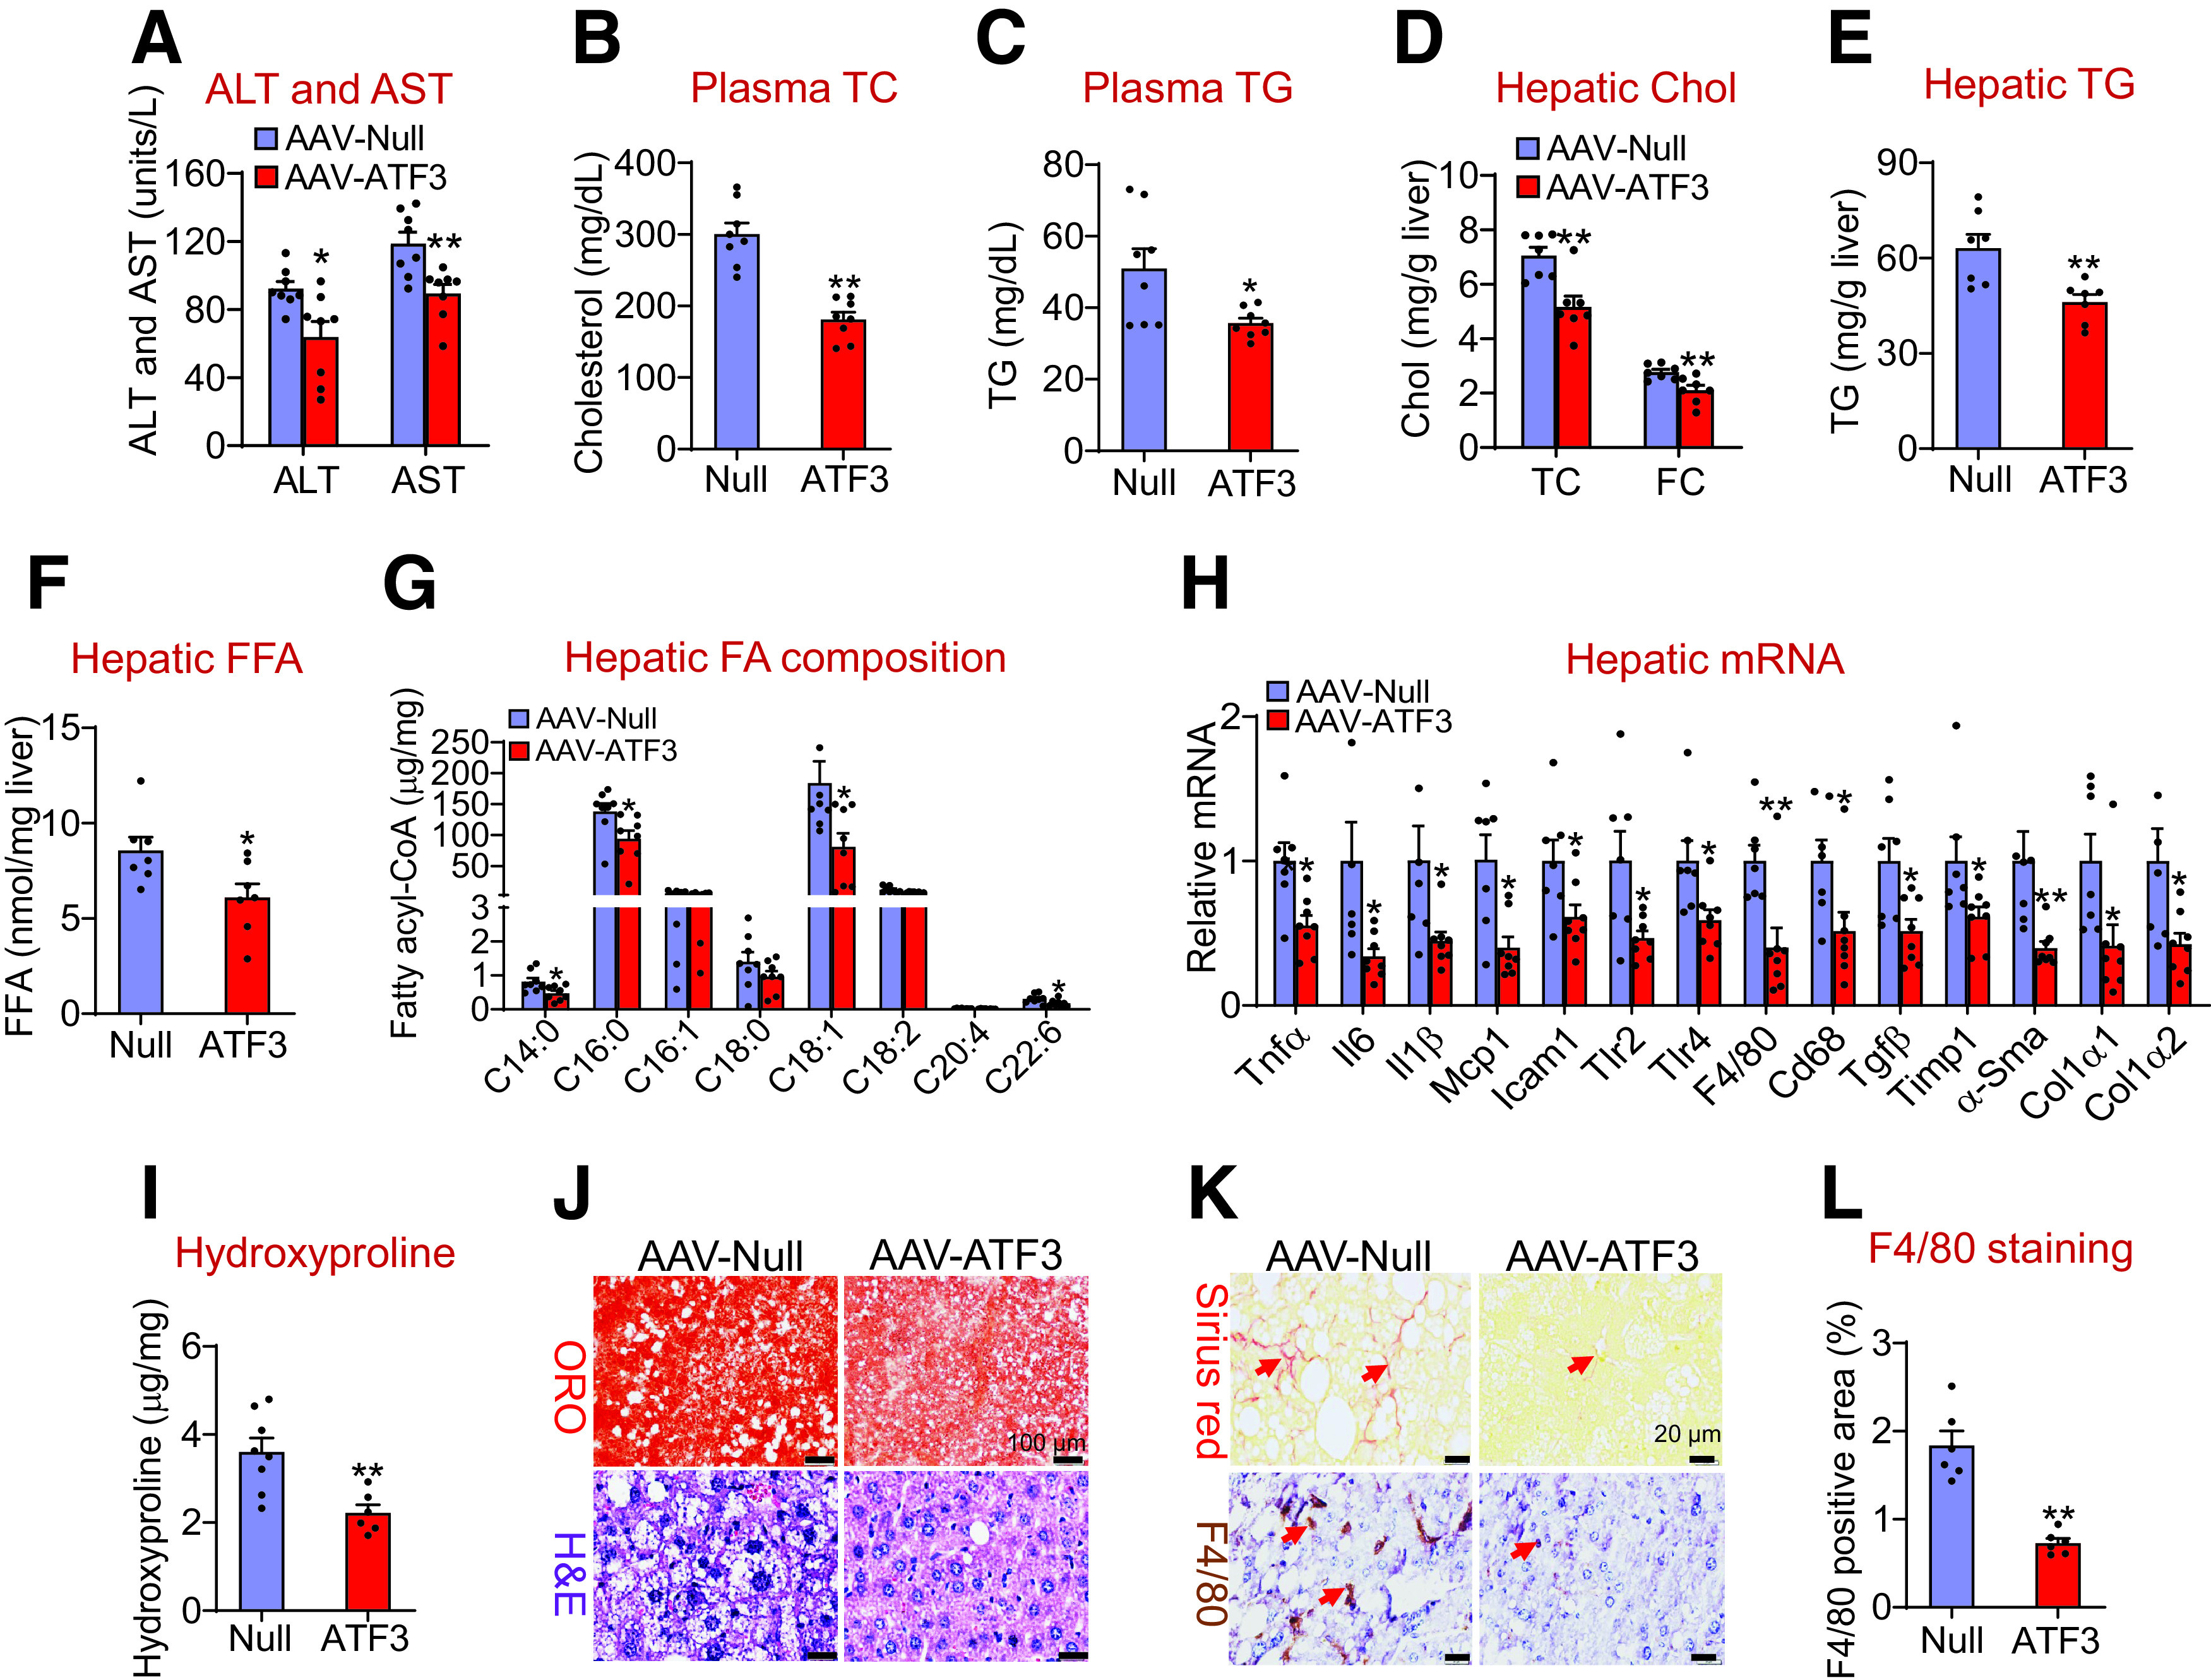
Hepatocyte-specific expression of human ATF3 protects against HFCF diet-induced steatohepatitis. C57BL/6J mice were i.v. injected with AAV8-ALB-Null or AAV8-ALB-hATF3 and then fed the HFCF diet for 16 weeks (n = 8 per group). Plasma levels of ALT and AST (A), TC (B), and TG (C) were analyzed. Hepatic levels of TC, FC (D), TG (E), FFA (F), and individual fatty acyl-CoAs (G) were quantified. Chol, cholesterol. Hepatic mRNA (H) and hydroxyproline (I) levels were determined. Liver sections were stained with ORO, H&E (J), or picrosirius red, or were immunohistochemically stained with an F4/80 antibody (K). The arrows in K point to fibrosis (top panel) or macrophages (bottom panel). L: The F4/80-positive areas were quantified. All values are expressed as mean ± SEM. *P < 0.05, **P < 0.01 vs. control.
Hepatocytic ATF3 Is Required for Protection Against Diet-Induced Steatohepatitis
To investigate the role of hepatocytic ATF3 ablation in NAFLD, we fed Atf3fl/fl mice and hepatocyte-specific Atf3−/− (Atf3Hep−/−) mice the HFCF diet for 16 weeks. Compared with Atf3fl/fl mice, Atf3Hep−/− mice had similar body weight but increased liver weight (Supplementary Fig. 3B). Atf3Hep−/− mice had increased plasma ALT levels (Fig. 3A) and hepatic levels of TC, FC, TG, FFAs (Fig. 3B–D), C16:0, C18:1, and C18:2 fatty acyl-CoAs (Fig. 3E), and hydroxyproline (Fig. 3F). In addition, Atf3Hep−/− mice had increased hepatic levels of genes involved in inflammation and fibrogenesis, including Tnfα, Il6, Il1β, Mcp1, Tlr4, F4/80, Cd68, Tgfβ, α-Sma, Col1α1, and Col1α2 (Fig. 3G). These data were further supported by histological staining with ORO, H&E, or picrosirius red, and immunohistochemical staining with an F4/80 antibody (Fig. 3H and Supplementary Fig. 3C). Thus, the data of Fig. 3 demonstrate that hepatocytic ATF3 is required for protection against diet-induced steatohepatitis.
Figure 3.
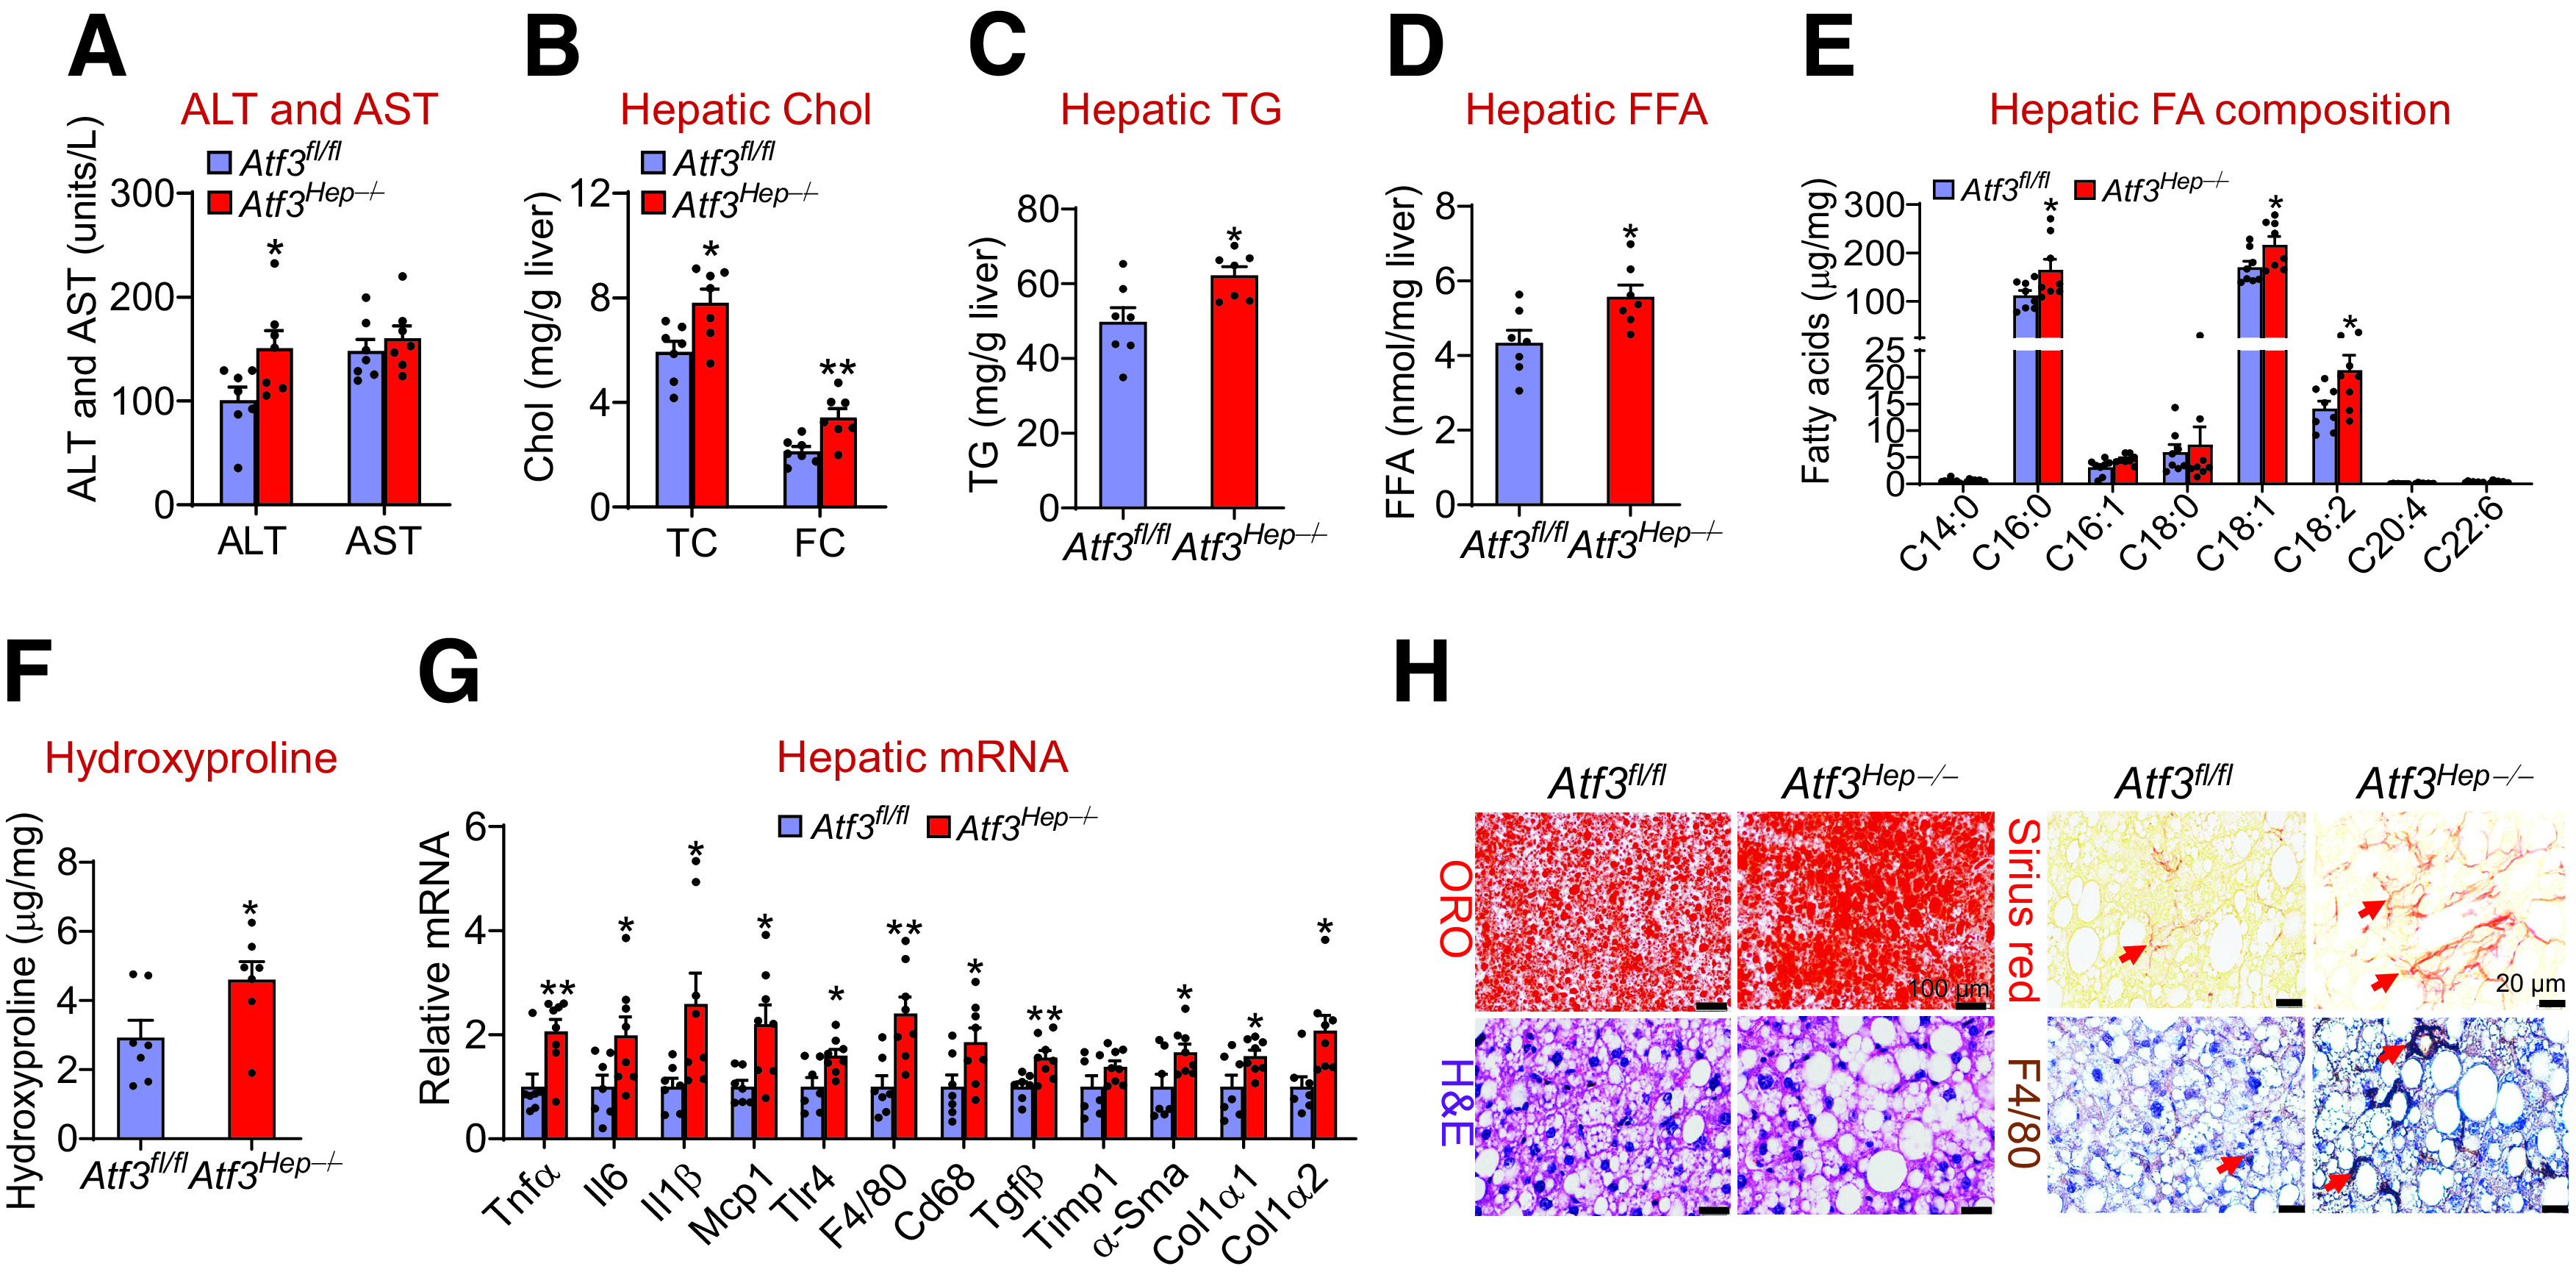
Hepatocytic ATF3 is required for protection against HFCF diet-induced steatohepatitis. Atf3fl/fl mice and Atf3Hep−/− mice were fed the HFCF diet for 16 weeks (n = 7). A: Plasma ALT and AST levels were analyzed. Hepatic levels of TC, FC (B), TG (C), FFAs (D), individual fatty acyl-CoAs (E), and hydroxyproline (F) were determined. Chol, cholesterol. G: Hepatic mRNA levels were measured. H: Representative liver sections were stained with ORO (left top panel), H&E (left bottom panel), or picrosirius red (right top panel), or immunohistochemically stained with an F4/80 antibody (right bottom panel). Arrows point to fibrosis (right top panel) or macrophages (right bottom panel). All values are expressed as mean ± SEM. *P < 0.05, **P < 0.01 vs. control.
ATF3 Is a Key Regulator of Hepatic Lipolysis and FAO
To investigate the mechanisms underlying the regulation of steatohepatitis by ATF3, we first explored whether ATF3 regulates de novo lipogenesis (DNL). Overexpression of human ATF3 or inactivation of Atf3 in hepatocytes did not affect hepatic expression of genes involved in DNL or VLDL secretion (Supplementary Fig. 4A and B), including sterol regulatory element-binding protein 1c (Srebp1c), acetyl-CoA carboxylase 1 (Acc1), fatty acid synthase (Fasn), apolipoprotein B (Apob), and microsomal triglyceride transfer protein (Mttp). Consistent with these findings, overexpression of human ATF3 did not affect DNL in vivo (Fig. 4A). Interestingly, overexpression of human ATF3 induced hepatic genes involved in lipolysis, carboxylesterase 1 (Ces1) (32) and Ces2 (30) and FAO, such as peroxisome proliferator-activated receptor-α (Pparα), carnitine palmitoyltransferase 1 (Cpt1), Cpt2, and pyruvate dehydrogenase kinase 4 (Pdk4) (Fig. 4B). Consistent with the mRNA levels, ATF3 increased hepatic CES1 and CES2 protein levels by >2.5-fold (Fig. 4C and D). In line with these latter data, overexpression of human ATF3 increased hepatic TGH activity by more than twofold (Fig. 4E) and induced plasma β-HB levels by 145% (Fig. 4F) and hepatocytic FAO by twofold (Fig. 4G).
Figure 4.
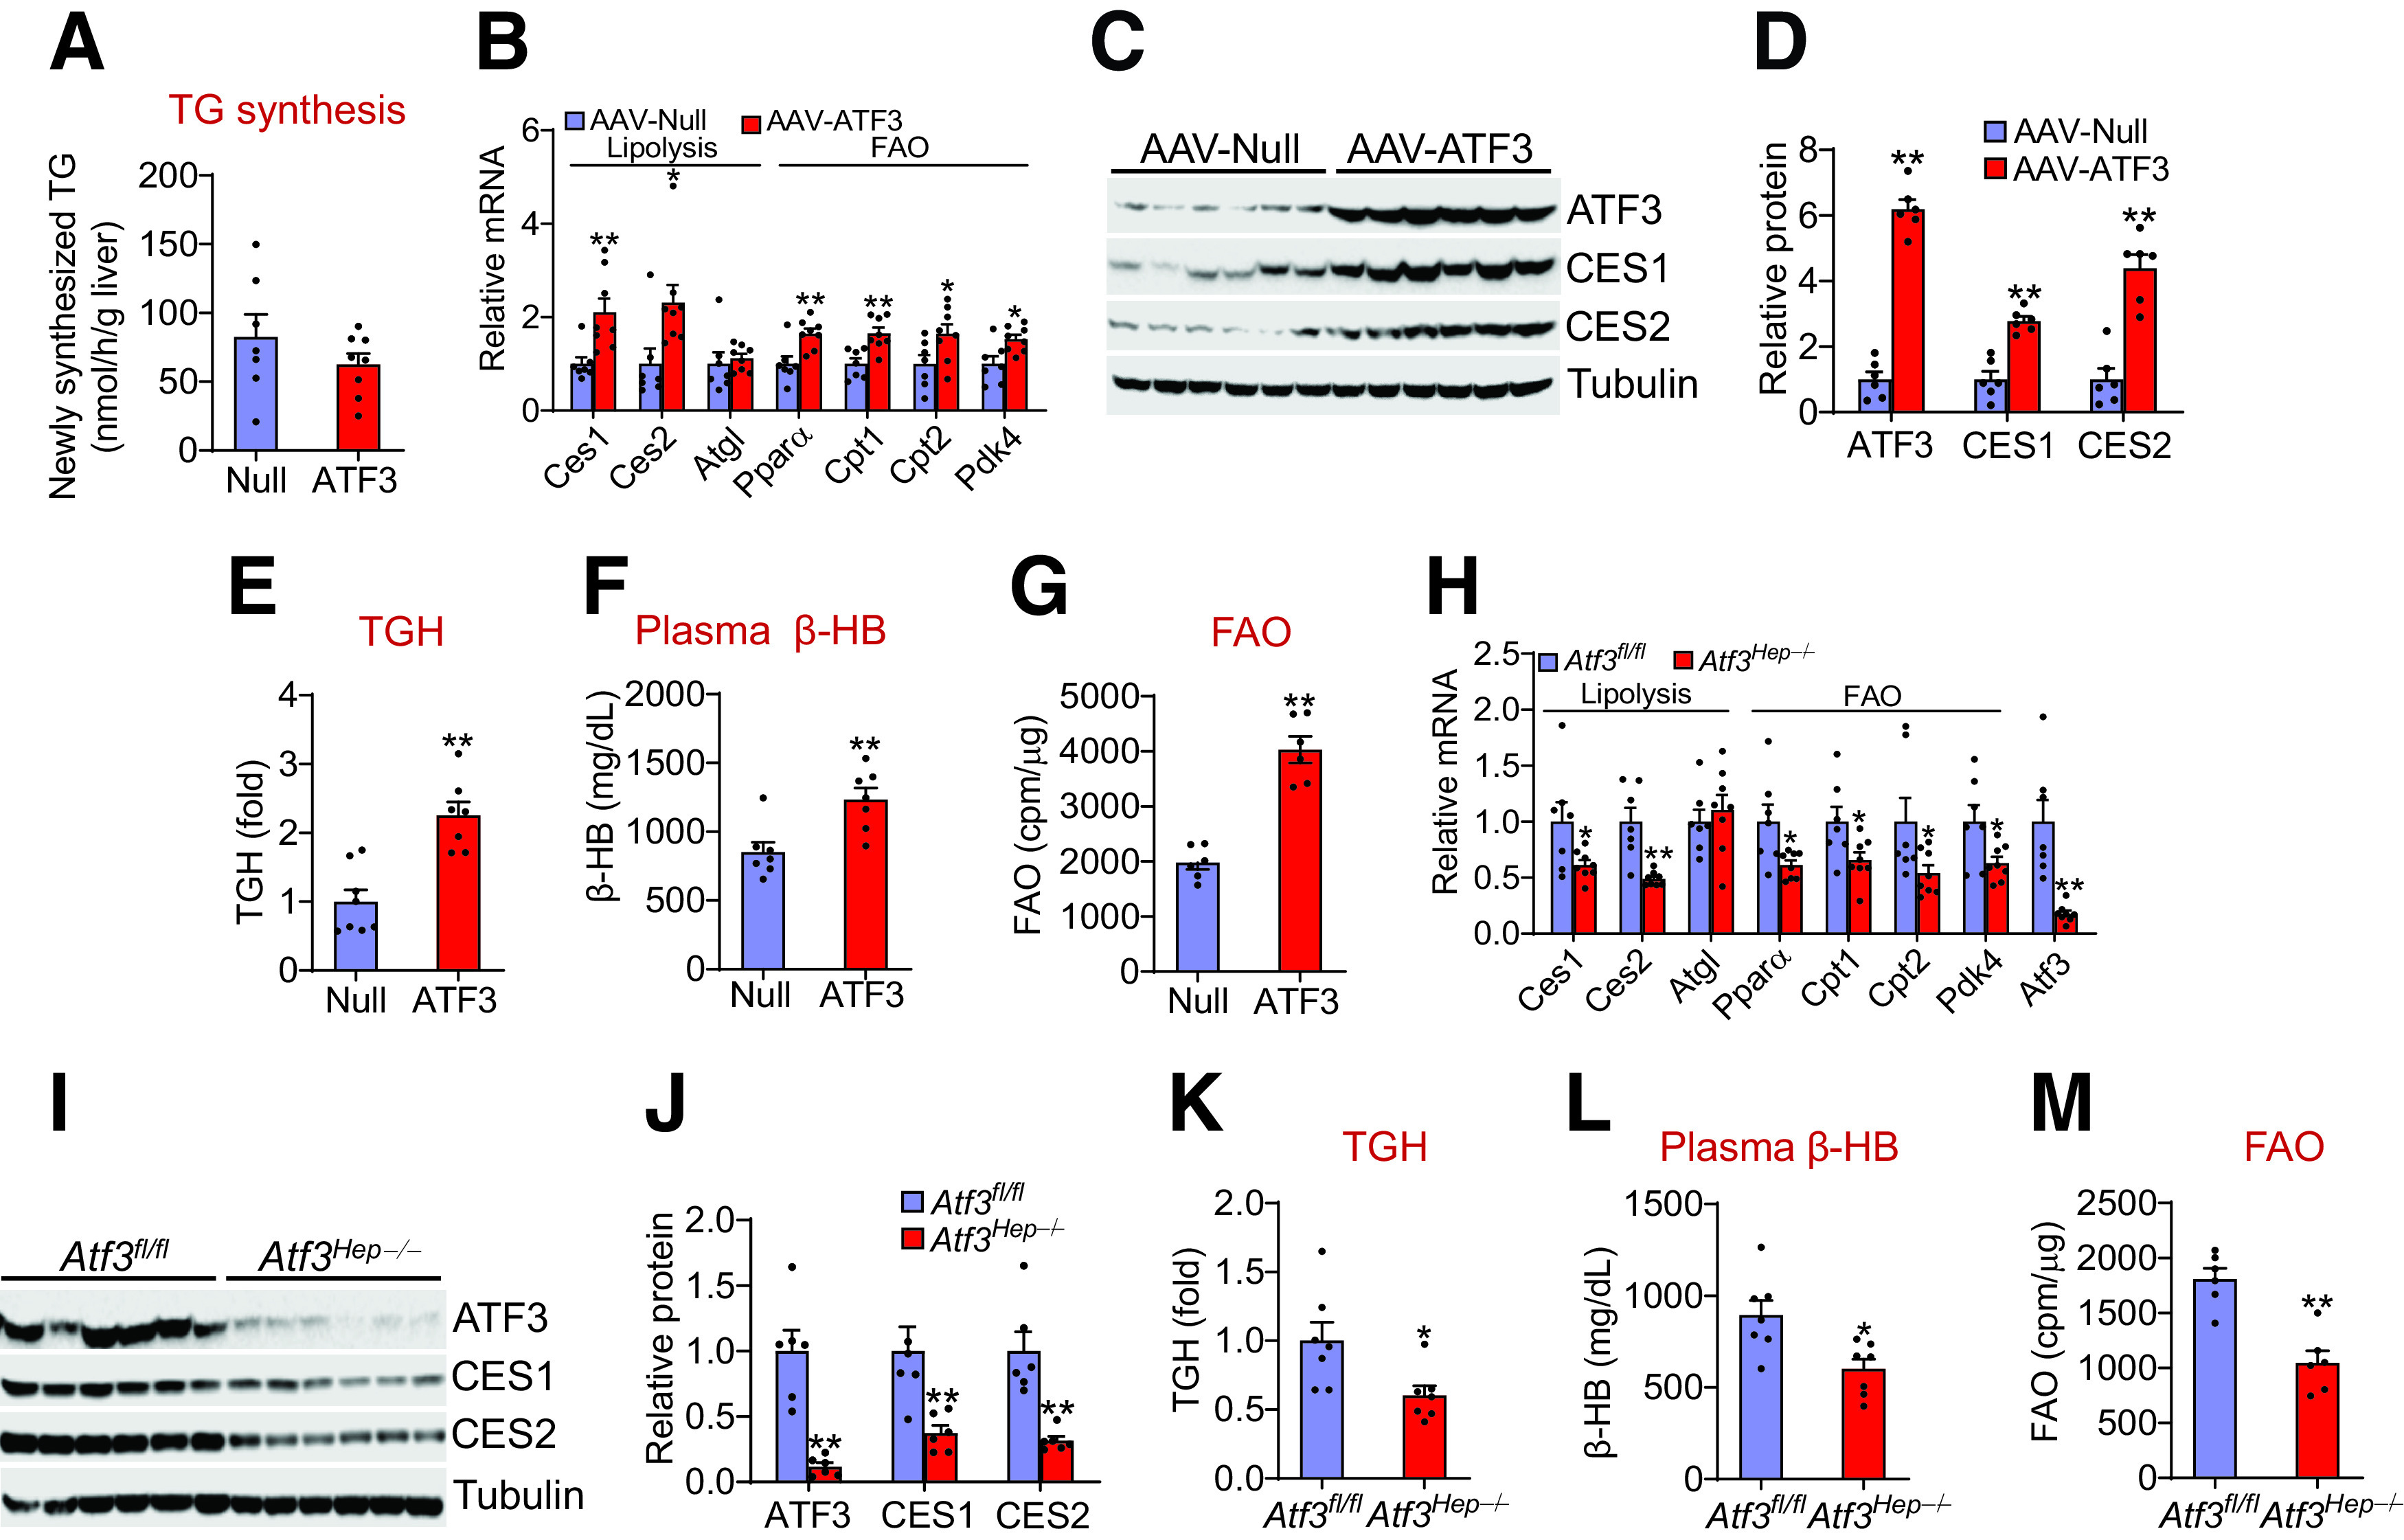
Hepatocytic ATF3 is a key regulator of lipolysis and fatty acid oxidation A–F: C57BL/6J mice were i.v. injected with AAV8-ALB-Null or AAV8-ALB-hATF3 and then fed the HFCF diet 16 weeks (n = 7 per group). A: Newly synthesized TG was determined after intraperitoneal injection of heavy water. Hepatic mRNA (B) and protein (C and D) levels were determined. Hepatic TGH activity (E) and plasma β-HB levels (F) were analyzed. G: FAO in hepatocytes was analyzed (n = 6). cpm, counts per min. H–L: Atf3fl/fl mice and Atf3Hep−/− mice were fed the HFCF diet for 16 weeks (n = 7). Hepatic mRNA (H) and protein (I and J) levels were determined. Hepatic TGH activity (K) and plasma β-HB levels (L) were analyzed. M: FAO in hepatocytes was determined (n = 6). All values are expressed as mean ± SEM. *P < 0.05, **P < 0.01 vs. controls.
In contrast, Atf3Hep−/− mice had reduced hepatic expression of Ces1, Ces2, Cpt1, Cpt2, Pparα, and Pdk4 mRNA levels (Fig. 4H), and CES1 and CES2 protein levels (Fig. 4I and J). In addition, Atf3Hep−/− mice had a 40% reduction in hepatic TGH activity (Fig. 4K), a 33% reduction in plasma β-BH levels (Fig. 4L), and a 42% reduction in FAO in hepatocytes (Fig. 4M). Taken together, the data of Fig. 4 demonstrate that hepatocytic ATF3 is a key regulator of hepatic TGH activity and FAO, which may account for the regulation of hepatic TG levels by ATF3.
ATF3 Inhibits Hepatic ROS Production and Apoptosis
ROS production and apoptosis are believed to play an important role in NASH development. Accumulation of saturated FFAs and FC in hepatocytes is known to cause lipotoxicity, leading to ROS production, apoptosis, inflammation, fibrogenesis, and NASH development (33,34). The finding that ATF3 reduces hepatic saturated fatty acid and FC levels suggests that ATF3 may regulate hepatic ROS production and apoptosis. Indeed, overexpression of hepatocytic ATF3 reduced hepatic ROS and malondialdehyde (MDA) levels by 44% and 35%, respectively (Fig. 5A and B), and apoptosis by 36% (Fig. 5C and D). Consistent with these findings, ATF3 overexpression reduced hepatic levels of cleaved CASP3 by 62% (Fig. 5E and F). In addition, ATF3 overexpression reduced hepatic levels of phosphorylated Smad2/3 by 66% (Fig. 5E and F), suggesting that ATF3 inhibits TGFβ signaling. In contrast, Atf3Hep−/− mice had increased hepatic levels of ROS and MDA (Fig. 5G and H), apoptosis (Fig. 5I and J), as well as cleaved CASP3 and phosphorylated Smad2/3 levels (Fig. 5K and 5L). Thus, the data of Fig. 5 indicate that hepatic ATF3 inhibits ROS production and apoptosis.
Figure 5.

Hepatocytic ATF3 inhibits ROS production and apoptosis A–F: C57BL/6J mice were i.v. injected with AAV8-ALB-Null or AAV8-ALB-hATF3 and then fed the HFCF diet for 16 weeks. Hepatic ROS (A) and MDA (B) levels were determined (n = 7–8). DCF, 2′,7′-dichlorofluorescein. C and D: TUNEL assays were performed to analyze hepatic apoptosis (% cells) (n = 5–6). Hepatic protein levels were analyzed by Western blot assays (E) and then quantified (F) (n = 6). F: Shows the ratio of phosphorylated (P) to total (T) Smad2/3. G–L: Atf3fl/fl mice and Atf3Hep−/− mice were fed the HFCF diet for 16 weeks. Hepatic ROS (G) and MDA (H) levels were quantified (n = 7). I and J: Hepatic apoptosis levels were determined by TUNEL assays (n = 6). K and L: Hepatic protein levels were determined by Western blot assays (n = 6). All values are expressed as mean ± SEM. *P < 0.05, **P < 0.01 vs. controls.
Hepatocytic ATF3 Inhibits Kupffer Cell and Stellate Cell Activation
Although the expression of ATF3 in macrophages is important for inhibiting inflammatory response, it remains unknown whether the expression of ATF3 in hepatocytes played any role in inflammatory response of macrophages. Therefore, we isolated primary hepatocytes from mice infected with AAV8-ALB-null or AAV8-ALB-hATF3, or Atf3Hep−/− mice and their control mice. After the hepatocytes were treated with lipids to mimic WD feeding, cell culture media were collected and used for treatment of Kupffer cells. In the control Kupffer cells, the presence of lipids in the media induced Tnfα, Il6, Il1β, and Mcp1 mRNA levels (Fig. 6A and 6C) and led to secretion of more TNFα, IL-1β, and MCP1 to the media (Fig. 6B and D). Interestingly, these changes were greatly attenuated by ATF3 overexpression (Fig. 6A and B) but were potentiated by Atf3 ablation (Fig. 6C and D). These data indicate that ATF3 in hepatocytes can modulate Kupffer cell expression and secretion of proinflammatory cytokines. In contrast, ATF3 did not regulate plasma levels of type 1 T-helper cells (Th1)-type (IFN-γ, IL-2) or Th2-type (IL-4, IL-5) cytokines (Supplementary Fig. 4C and D), suggesting that the Th1 or Th2 response does not play a role in ATF3-regulated inflammatory response.
Figure 6.
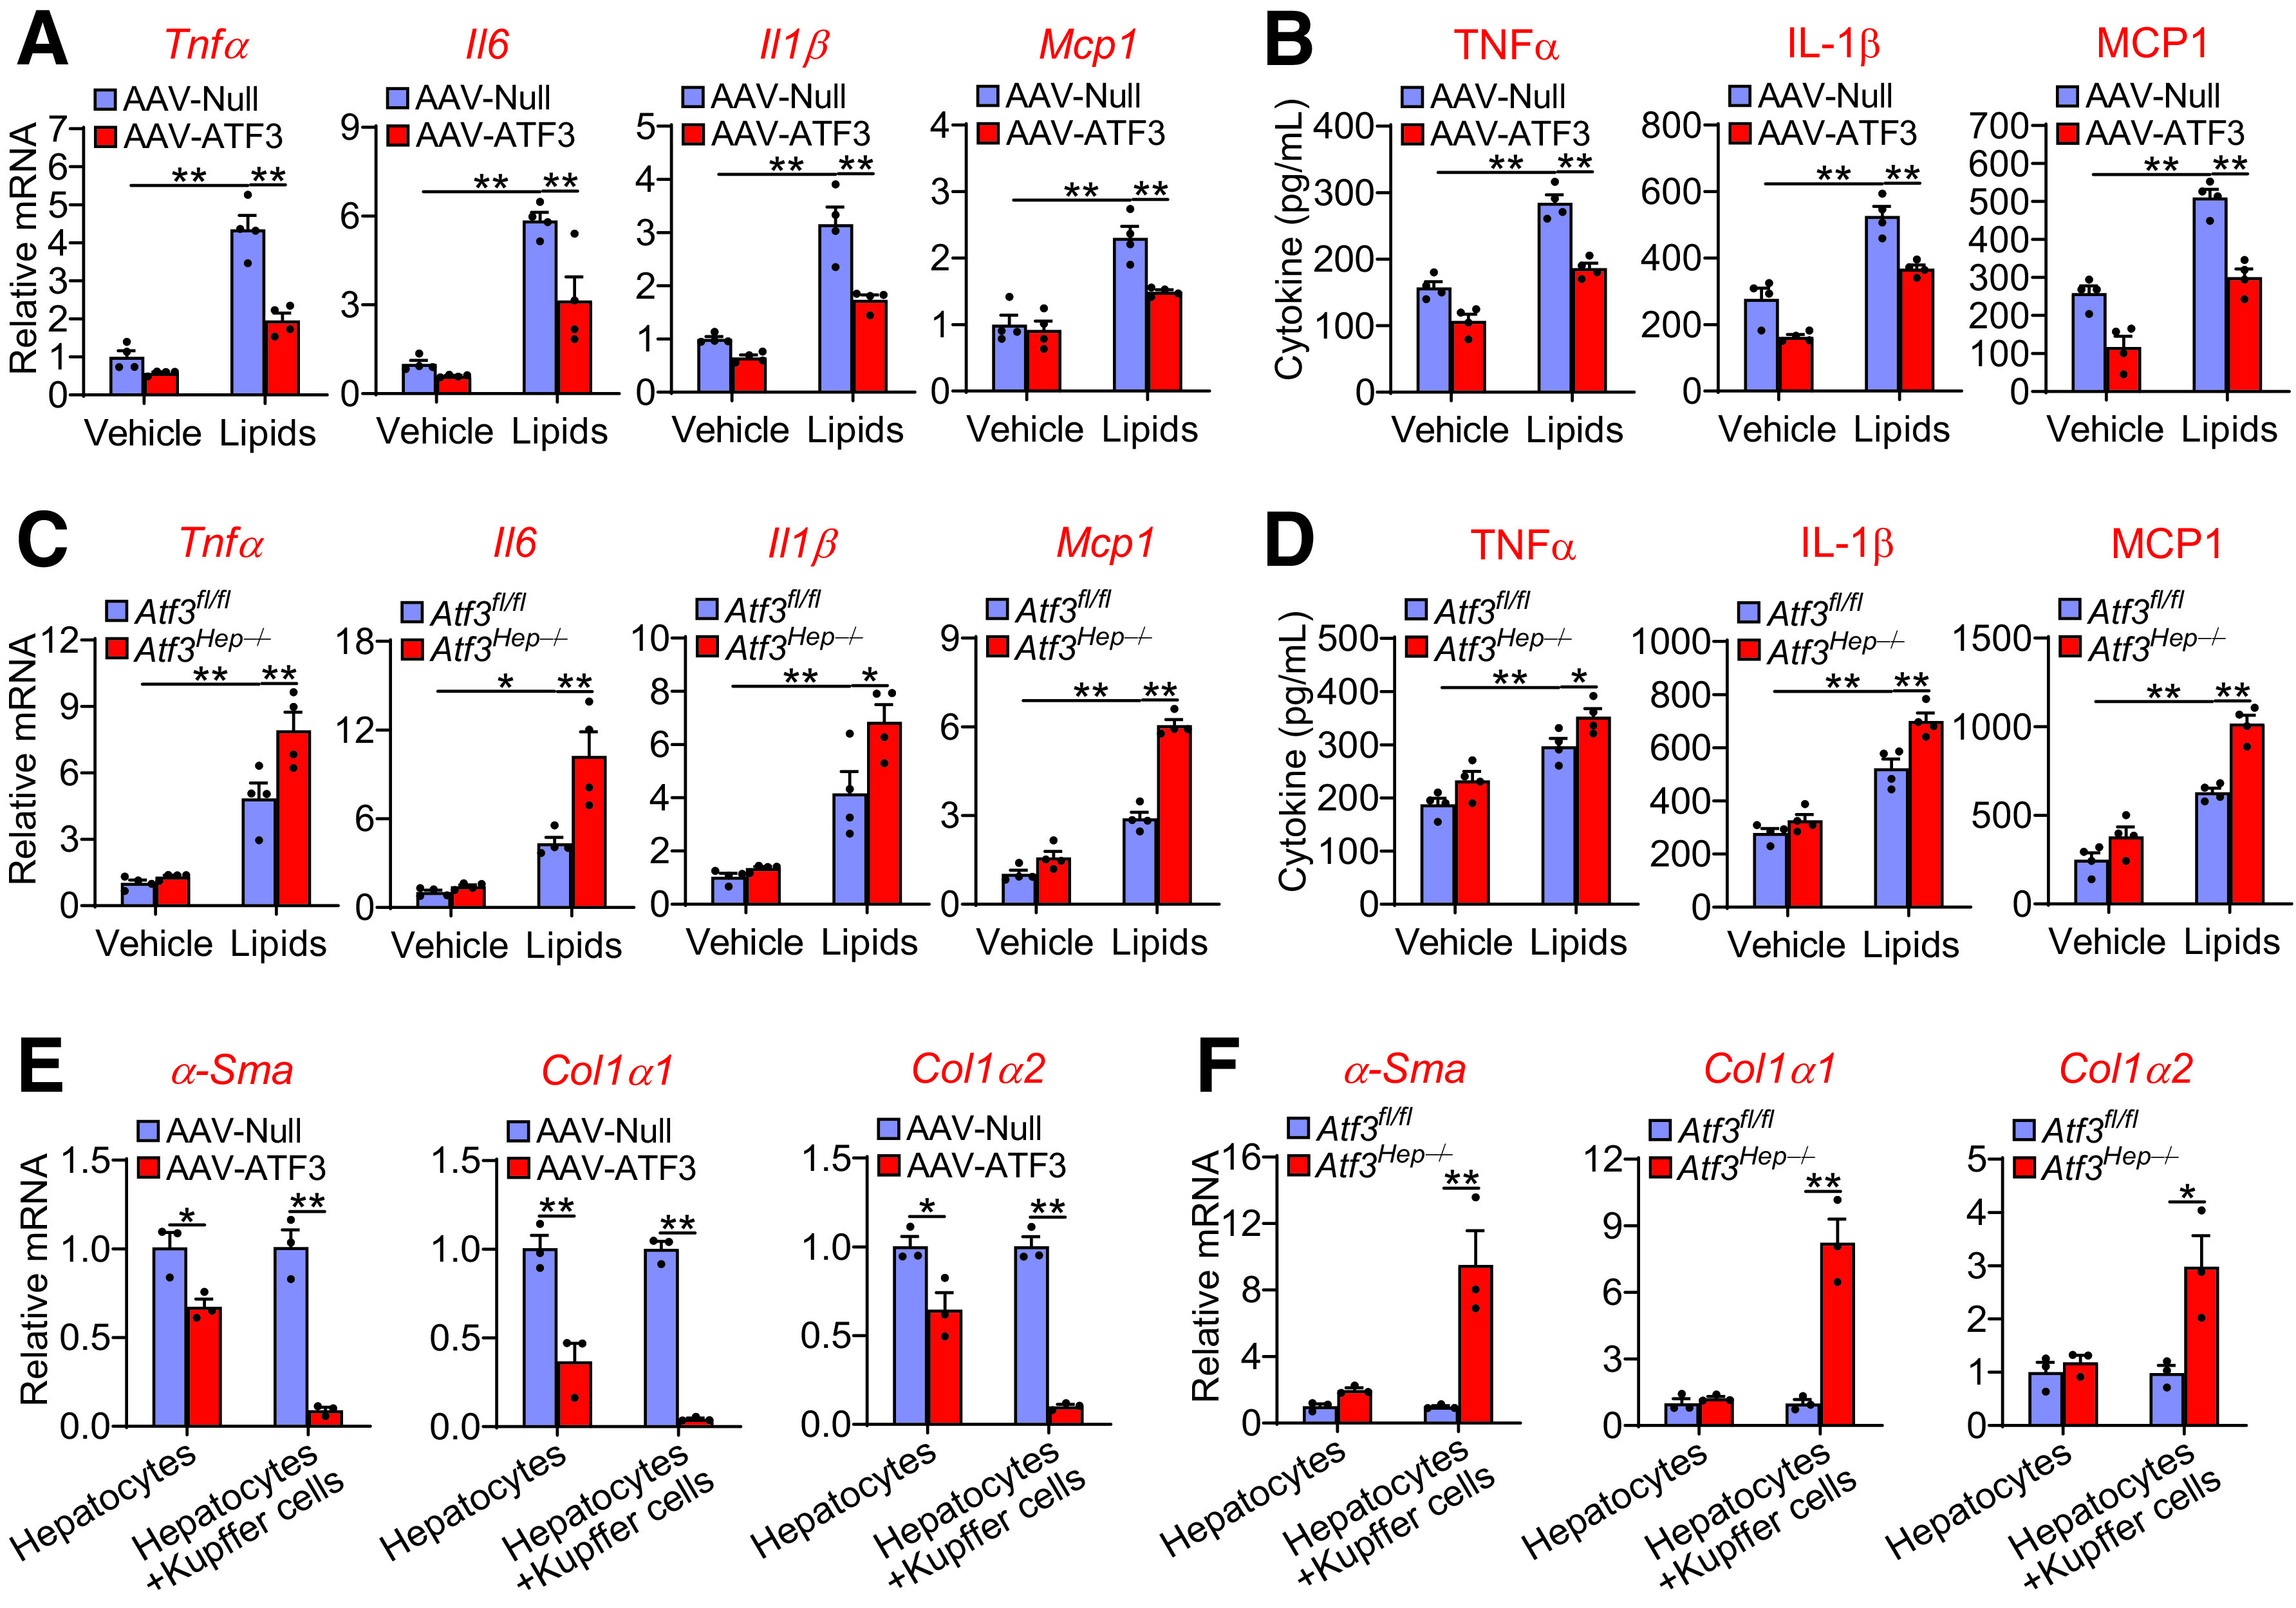
Hepatocytic ATF3 regulates Kupffer cell and stellate cell activation. A and B: Primary hepatocytes were isolated from mice injected i.v. with AAV8-ALB-Null or AAV8-ALB-ATF3 and then treated with vehicle or lipid mixture containing FFAs and cholesterol. After 24 h, the culture media were collected and used for treatment of Kupffer cells for 12 h. mRNA levels in Kupffer cells (A) as well as TNFα, IL-1β, and MCP1 levels in the media (B) were quantified (n = 4). C and D: Primary hepatocytes were isolated from Atf3fl/fl or Atf3Hep−/− mice and then treated with vehicle or lipid mixture for 24 h. The culture media were collected and used for treatment of Kupffer cells for 12 h. mRNA levels in Kupffer cells (C) and TNFα, IL-1β, and MCP1 levels in the media (D) were quantified (n = 4). E and F: Primary hepatocytes or primary hepatocyte plus Kupffer cells were incubated with lipid mixture for 24 h. The culture media were then used for treatment of stellate cells for 24 h, which were isolated from mice infected with AAV8-ALB-Null or AAV8-ALB-ATF3 (E) or Atf3fl/fl mice or Atf3Hep−/− mice (F). mRNA levels were determined (n = 3). All values are expressed as mean ± SEM. Two-way ANOVA was used for statistical analysis. *P < 0.05, **P < 0.01.
To investigate whether hepatocytic ATF3 can regulate stellate cell activation directly or indirectly, we cultured primary hepatocytes or cocultured primary hepatocytes with Kupffer cells in the presence of lipids for 24 h and then harvested the culture media and used them to treat stellate cells isolated from C57BL/6 mice. The expression of α-Sma, Col1α1, and Col1α2 in stellate cells was inhibited when they were treated with culture media collected from hepatocytes overexpressing ATF3, and this inhibition was markedly potentiated when hepatocytes were cocultured with Kupffer cells (Fig. 6E). In contrast, the expression of α-Sma, Col1α1, and Col1α2 in stellate cells was greatly induced only when they were treated with culture media collected from the coculture of hepatocytes lacking Atf3 with Kupffer cells (Fig. 6F). These data indicate that Kupffer cells play a key role in mediating the effect of ATF3 in hepatocytes on stellate cell activation.
HNF4α Is Required for Hepatocytic ATF3 to Prevent the Development of NAFLD
In NAFL and NASH patients, hepatic HNF4α mRNA levels were significantly reduced (Fig. 7A), which is consistent with our previous finding that hepatic HNF4α protein levels are markedly reduced in NASH patients (21). We recently showed that hepatic HNF4α plays a key role in protection against the development of NAFLD by regulating hepatic TGH activity, FAO, apoptosis, and inflammation (34). We also showed that hepatic ATF3 regulates CYP7A1 and CYP8B1 expression, intestinal fat and cholesterol absorption, and reverse cholesterol transport by interaction with HNF4α (16). Interestingly, the data of Figs. 1–6 show that hepatocytic ATF3 also regulates hepatic TGH activity, FAO, apoptosis, and inflammation. The functional similarities between ATF3 and HNF4α led us to ask whether HNF4α was required for ATF3 to regulate the development of NAFLD. Hnf4αfl/fl mice and Hnf4αHep−/− mice were i.v. injected with AAV8-ALB-hATF3 or AAV8-ALB-Null and then fed the HFCF diet for 16 weeks. In Hnf4αfl/fl mice, hepatic overexpression of ATF3 significantly reduced plasma ALT and AST levels (Fig. 7B and C) and hepatic TC, FC, TG, FFA, and hydroxyproline levels (Fig. 7D–I), and induced hepatic TGH activity (Fig. 7J). All of these changes were absent in Hnf4αHep−/− mice (Fig. 7B–J). In hepatocytes isolated from Hnf4αfl/fl mice, ATF3 overexpression also induced FAO by 184%, and this induction was much attenuated in hepatocytes isolated from Hnf4αHep−/− mice (Fig. 7K).
Figure 7.
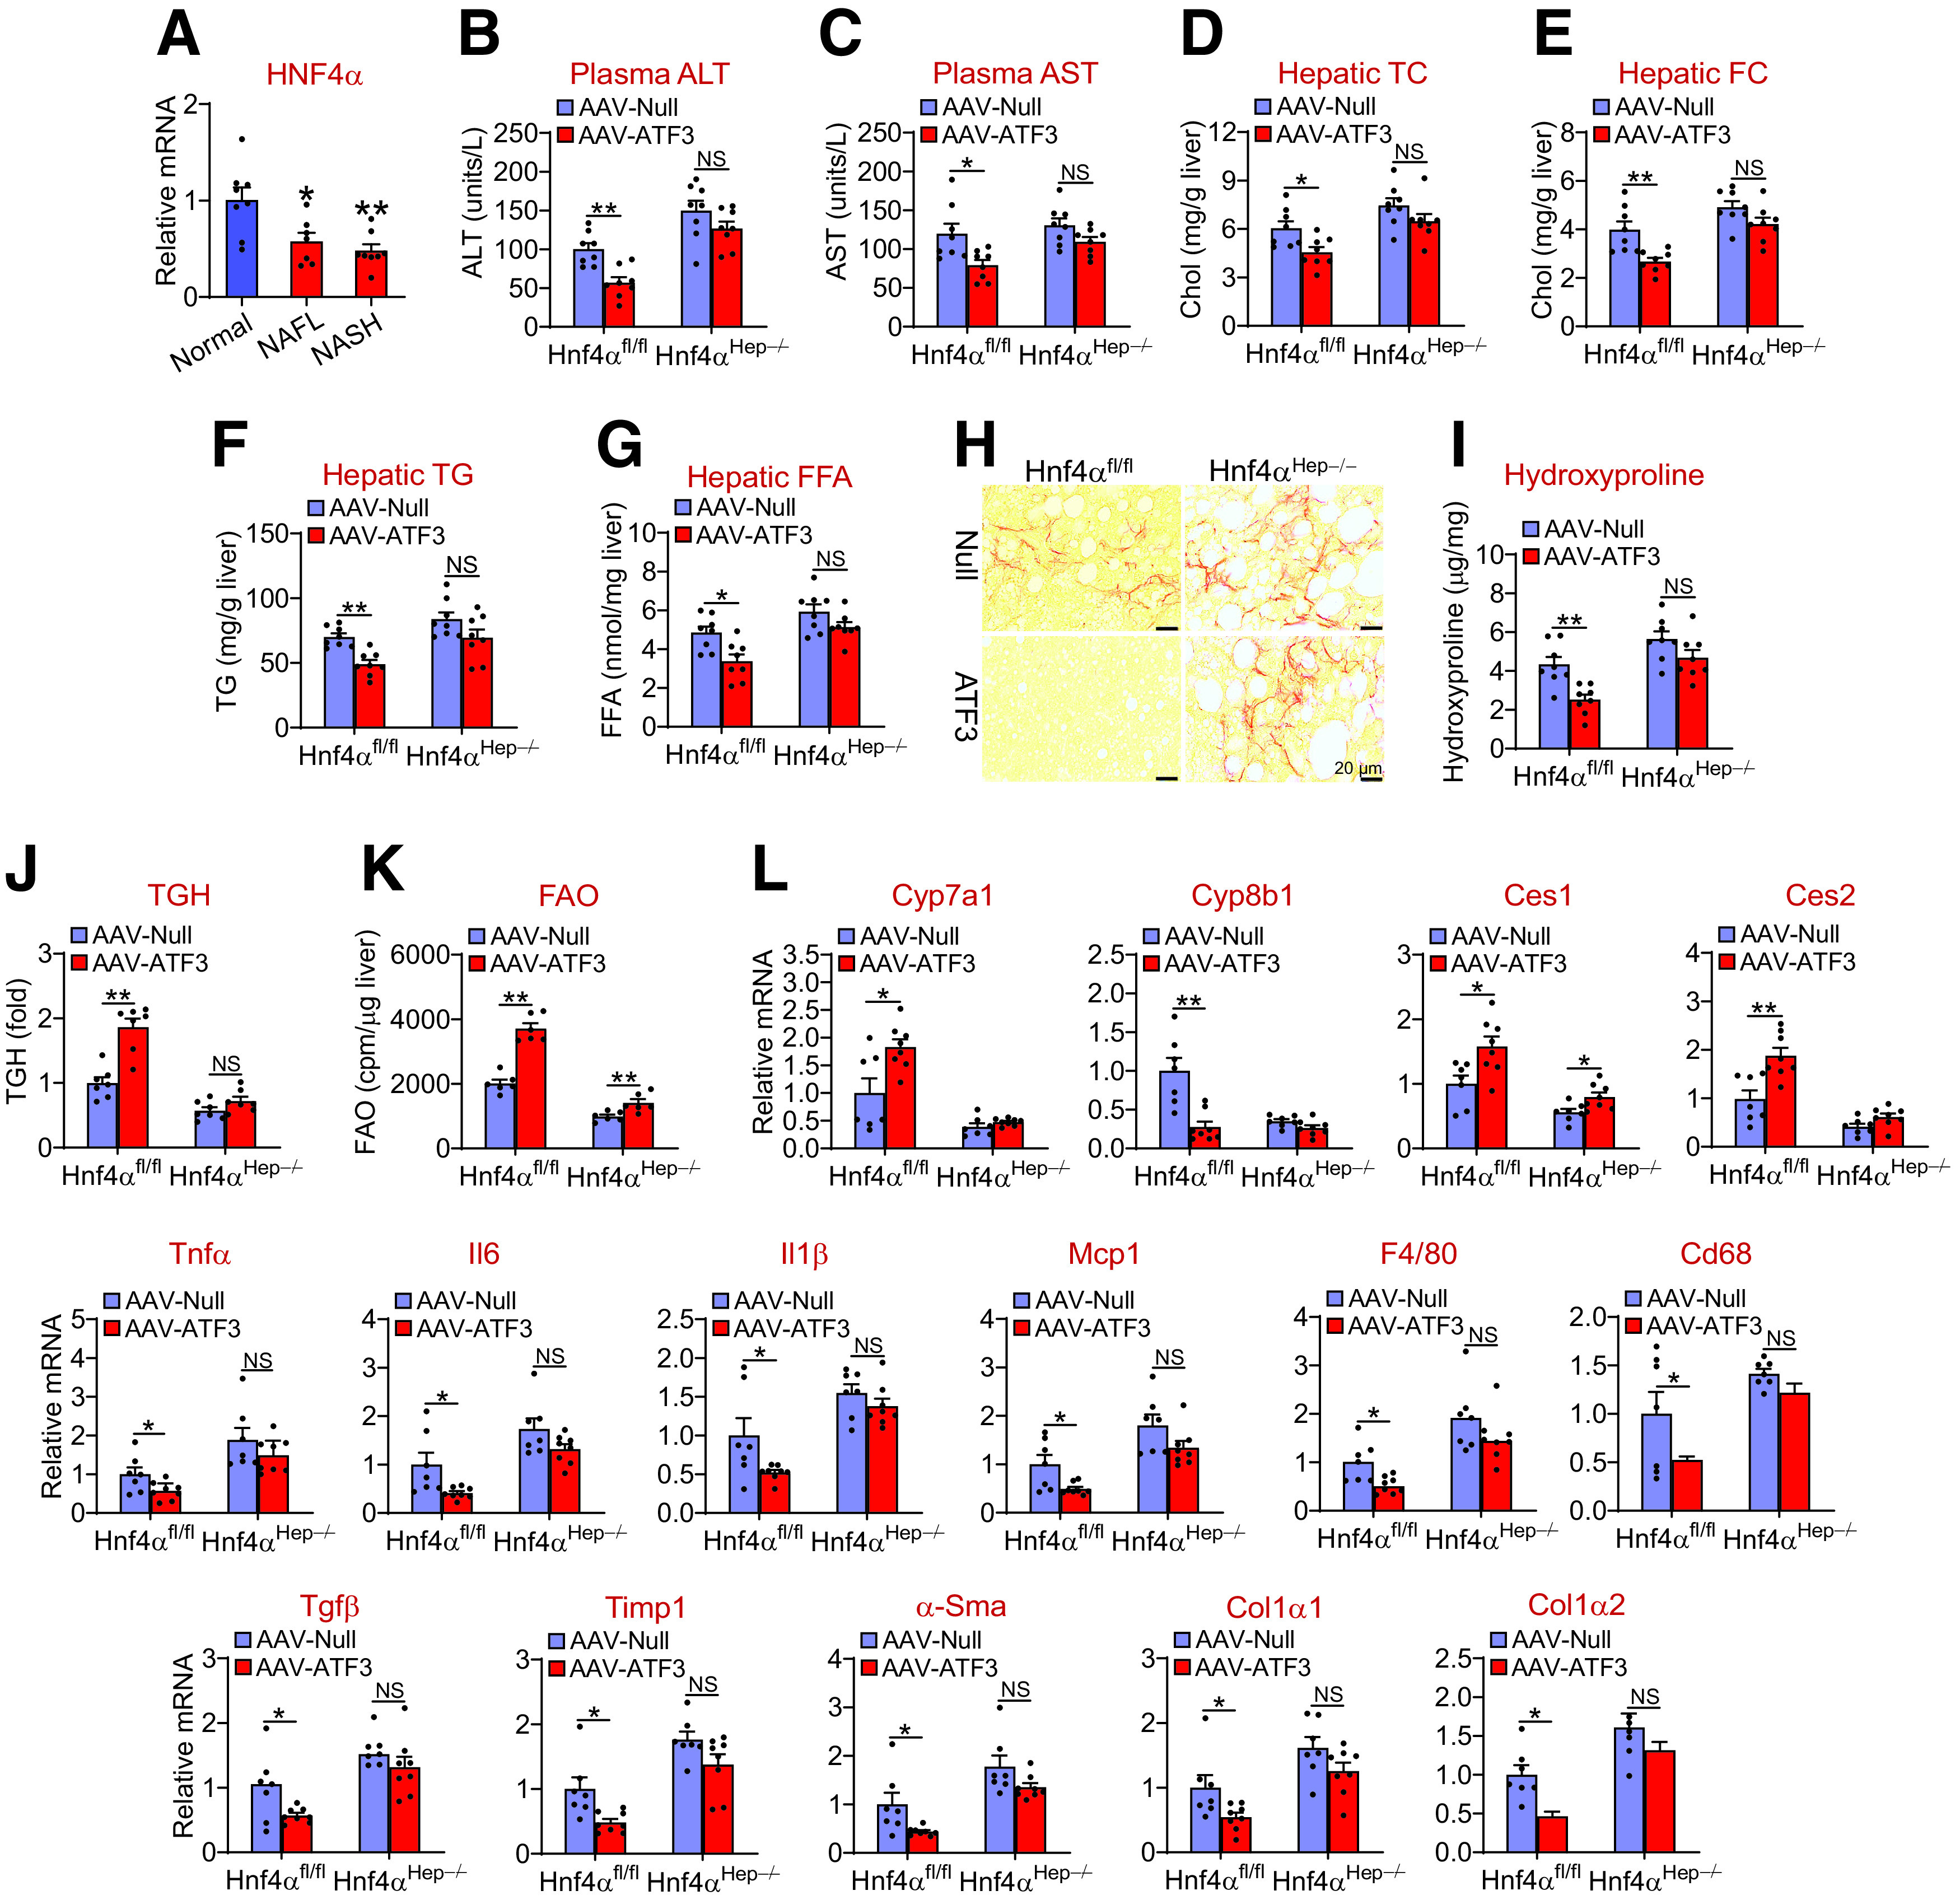
Hepatic HNF4α is required for ATF3 to protect against HFCF diet-induced steatohepatitis. A: Hepatic HNF4α mRNA levels in normal individuals and NAFL or NASH patients (n = 7–8). B–L: Hnf4αfl/fl mice and Hnf4αHep−/− mice were i.v. injected with AAV8-ALB-Null or AAV8-ALB-hATF3 and then fed the HFCF diet for 16 weeks (n = 8). Plasma ALT (B) and AST (C) levels and hepatic TC (D), FC (E), TG (F), and FFA (G) levels were determined (n = 8). Liver sections were stained with picro Sirius red (H), and hepatic hydroxyproline levels (I) were quantified (n = 7). Hepatic TGH activity (J) (n = 7) and FAO in hepatocytes (K) (n = 6) were analyzed. cpm, counts per minute. L: Hepatic mRNA levels were determined (n = 7). All values are expressed as mean ± SEM. Two-way ANOVA was used for statistical analysis. *P < 0.05, **P < 0.01.
In the liver, ATF3 induced Cyp7a1 and Ces2 mRNA levels and repressed Cyp8b1, Tnfα, Il6, Il1β, Mcp1, F4/80, Cd68, Tgfβ, Timp1, α-Sma, Col1α1, and Col1α2 mRNA levels in Hnf4αfl/fl mice but not in Hnf4αHep−/− mice (Fig. 7L). In addition, ATF3 also induced Ces1 mRNA levels in Hnf4αfl/fl mice, but this induction was attenuated in Hnf4αHep−/− mice (Fig. 7L). Taken together, the data of Fig. 7 demonstrate that hepatic HNF4α is required for ATF3 to protect against diet-induced NAFLD.
ATF3 Reverses Steatohepatitis in db/db Mice
The data of Figs. 1–7 show that ATF3 plays an important role in preventing diet-induced steatohepatitis. To investigate whether ATF3 could also reverse steatohepatitis, we overexpressed ATF3 in the livers of db/db mice. Overexpression of ATF3 reduced plasma ALT levels (Fig. 8A) and hepatic levels of TC, FC (Fig. 8B), TG (Fig. 8C), FFAs (Fig. 8D), C16:0, C18:0 and C18:1 fatty acyl-CoAs (Fig. 8E), and hydroxyproline (Fig. 8F). Consistent with these findings, ATF3 overexpression increased hepatic TGH activity (Fig. 8G) and plasma β-HB levels (Fig. 8H) and reduced hepatic levels of ROS, MDA, and apoptosis (Fig. 8I–K). In addition, ATF3 induced Ces1, Ces2, Pparα, Cpt2, Pdk4, and Cyp7a1 expression but repressed Cyp8b1, Tnfα, Il6, Il1β, Mcp1, F4/80, Cd68, Tgfβ, Timp1, α-Sma, Col1α1, and Col1α2 in the liver (Fig. 8L). Thus, hepatic expression of ATF3 can reverse steatohepatitis in db/db mice.
Figure 8.
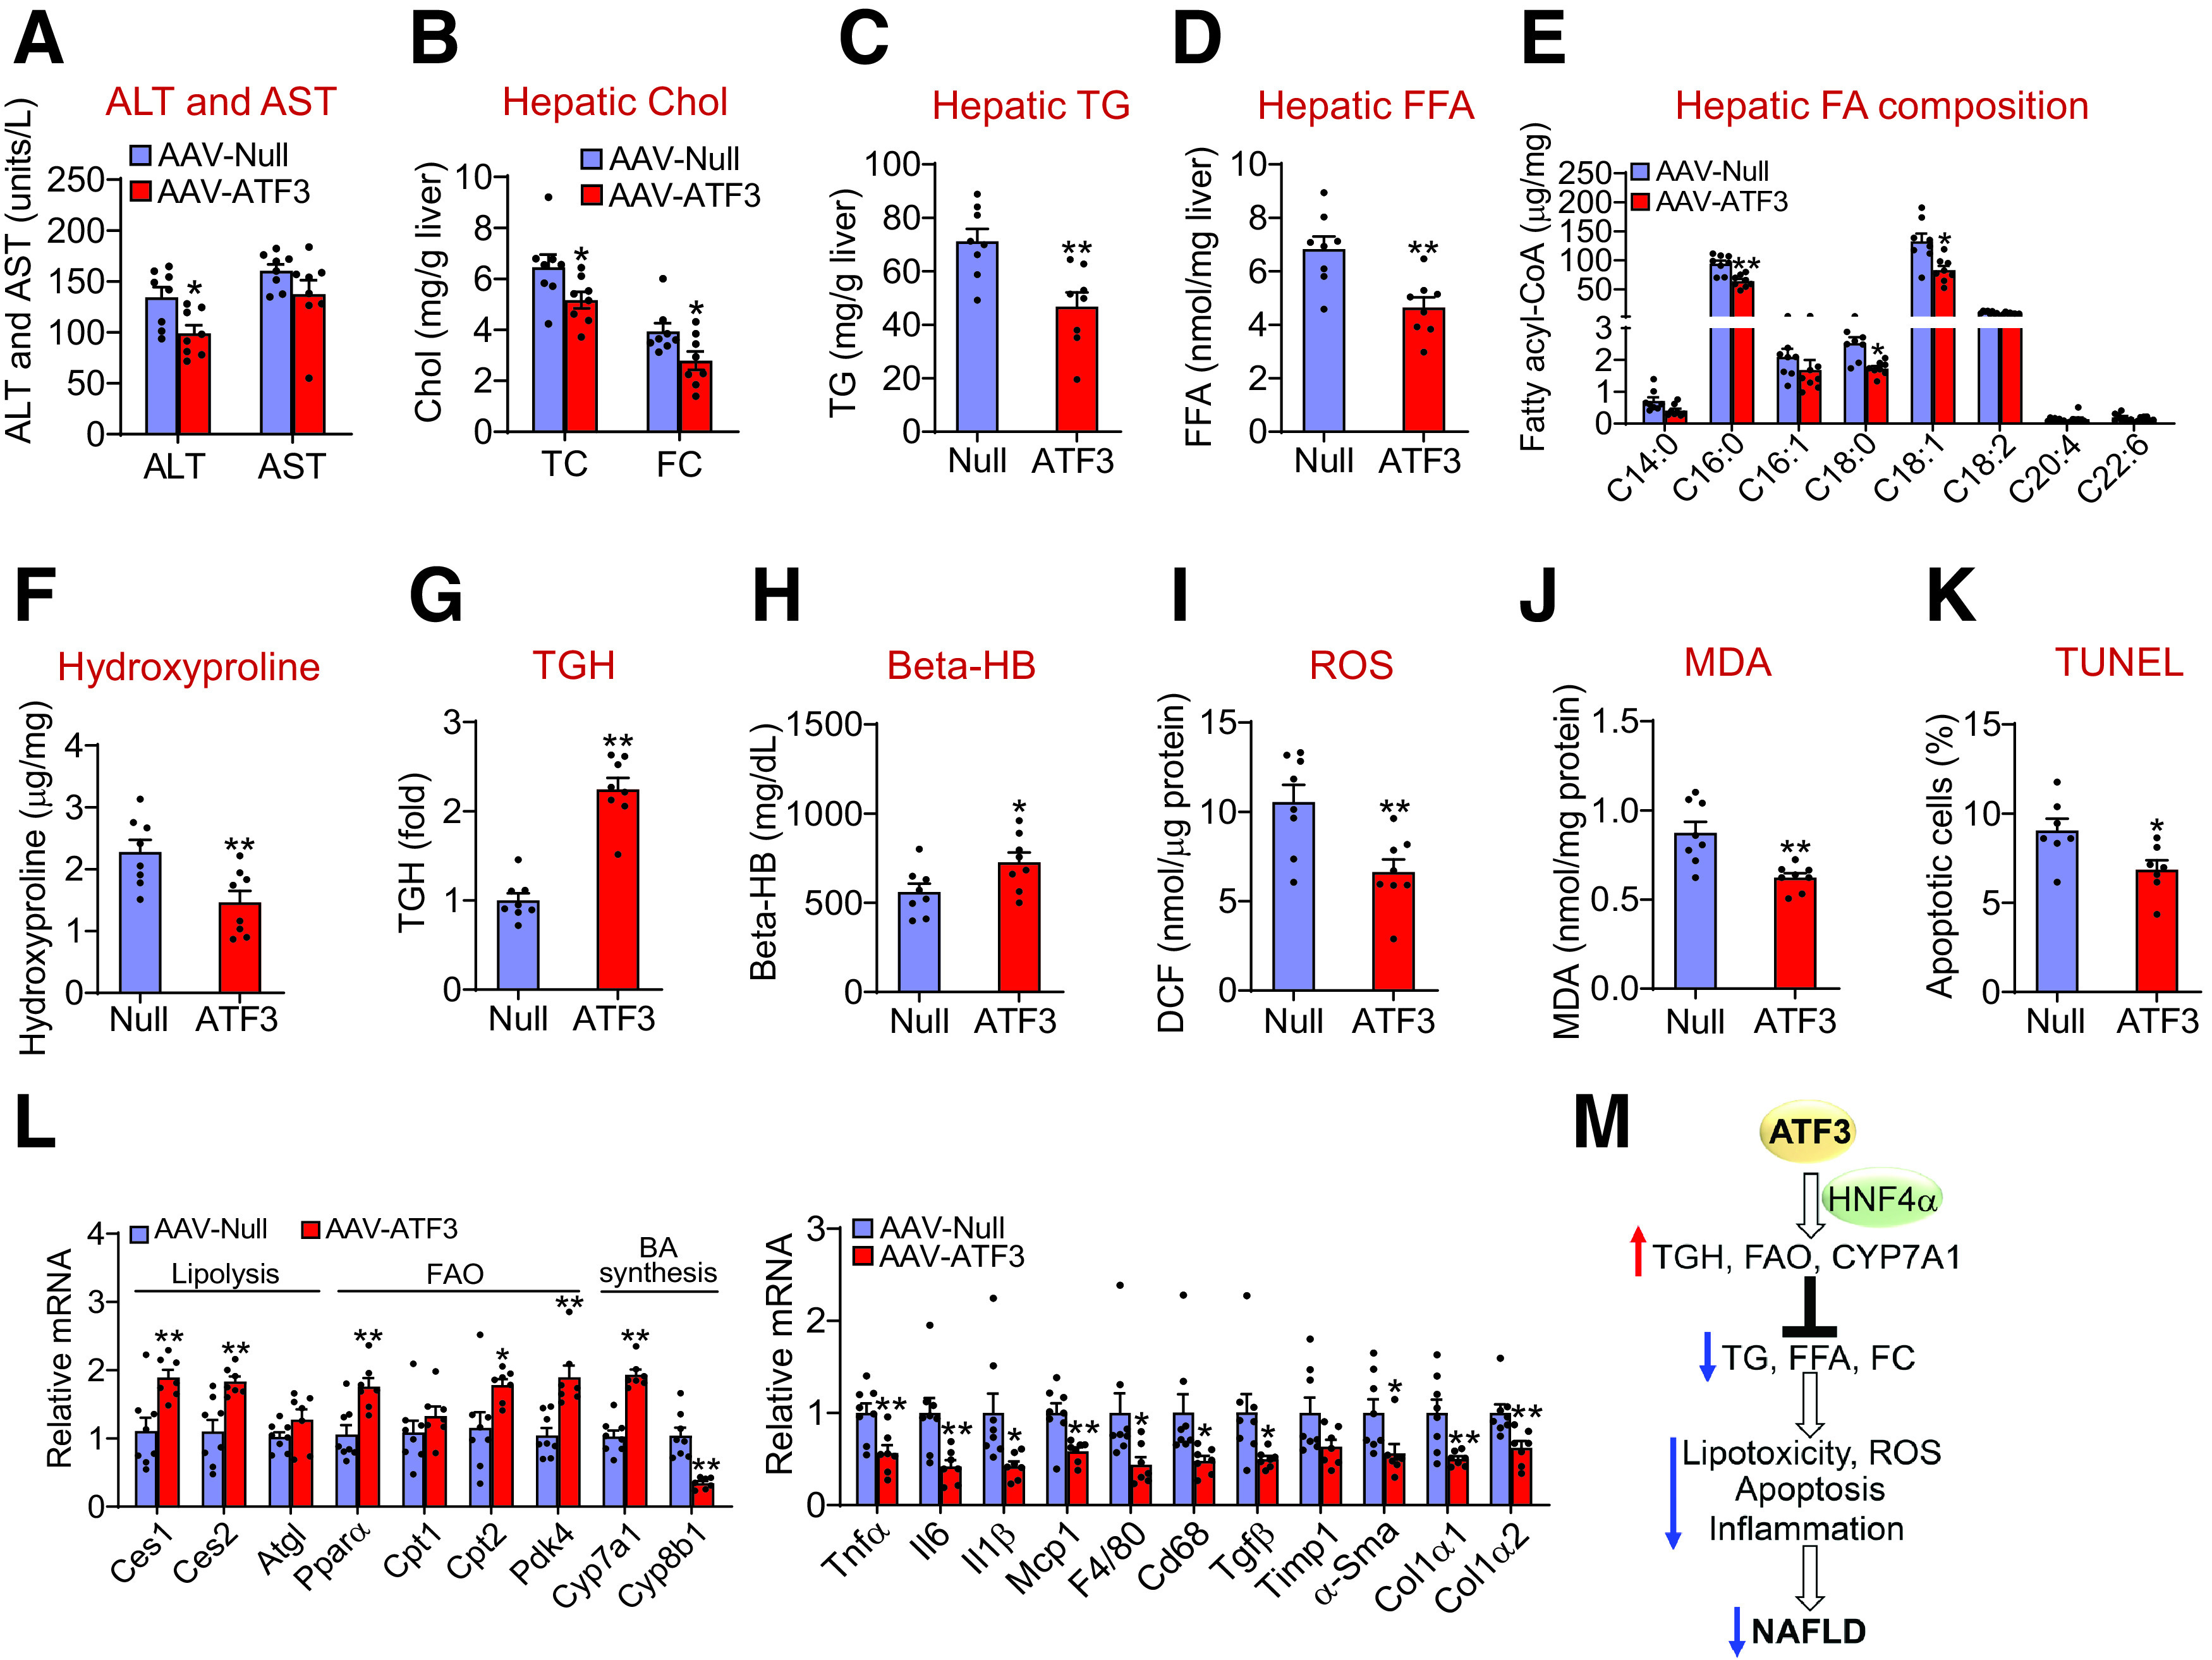
Overexpression of hepatic ATF3 reverses steatohepatitis in db/db mice A–L: db/db mice were i.v. injected with AAV8-ALB-Null or AAV8-ALB-ATF3 (n = 8). A: Plasma ALT and AST levels were quantified. Hepatic levels of cholesterol (Cho) (B), TG (C), FFAs (D), individual fatty acyl-CoAs (E), hydroxyproline (F), and TGH activity (G) were determined. Plasma β-HB levels (H) and hepatic levels of ROS (I), MDA (J), apoptosis (K), and mRNAs (L) were quantified. M: A model for hepatocytic ATF3 to regulate the development and progression of NAFLD. ATF3 in hepatocytes induces hepatic TGH activity, FAO, and CYP7A1 expression via HNF4α, leading to a reduction in hepatic levels of TG, FFA, and FC, which in turn decrease lipotoxicity, ROS production, apoptosis, and inflammation. As a result, hepatic ATF3 protects against the development and progression of NAFLD. All values are expressed as mean ± SEM. *P < 0.05, **P < 0.01.
Discussion
So far, the mechanism underlying the development of NAFLD has not been fully understood. In this work, we show that hepatic ATF3 expression is reduced in NAFLD. Global or hepatocyte-specific loss of ATF3 aggravates HFCF diet-induced steatohepatitis. In contrast, hepatocyte-specific expression of human ATF3 prevents HFCF diet-induced steatohepatitis and reverses steatohepatitis in db/db mice. Mechanistically, ATF3 interacts with HNF4α to induce hepatic TGH activity and FAO and reduce hepatic TG, FFA, and FC levels, resulting in reduced lipotoxicity, ROS production, apoptosis, and steatohepatitis (Fig. 8M).
Hepatic ATF3 protein levels are markedly reduced in NAFL and NASH patients and in diabetic or WD-fed mice. Interestingly, hepatic miR-149 is highly induced under the same conditions. The finding that overexpression of hepatocytic miR-149 represses ATF3 expression in hepatocytes suggests that the induction of miR-149 accounts, at least in part, for the inhibition of ATF3 in NAFLD. Importantly, overexpression of hepatocytic miR-149 promotes the development and progression of diet-induced NAFLD, which is consistent with our finding that loss of hepatocytic ATF3 aggravates NAFLD.
ATF3 in macrophages is known to inhibit inflammation. However, the role of hepatocytic ATF3 in the development of NAFLD has not been reported before. By using gain and loss of function approaches, we show that ATF3 reduces hepatic TG and FFA levels by inducing TGH activity and FAO and decreases FC levels likely by inducing CYP7A1 expression. ATF3 does not affect hepatic genes involved in cholesterol biosynthesis (16) or DNL. The selective regulation of FAO but not DNL may be accounted for by the findings that ATF3 regulates some of its metabolic effects via interaction with HNF4α (16) and that HNF4α does not regulate DNL but regulates FAO (20). Indeed, our data show that the induction of FAO by ATF3 is almost diminished in hepatocyte-specific Hnf4α−/− mice. The role of saturated fatty acids and FC in the development and progression of NAFLD has been well established (33,34). Our data strongly suggest that ATF3 inhibits lipotoxicity, leading to suppression of ROS production, apoptosis, and inflammation in the liver (Fig. 8M). Intriguingly, hepatic HNF4α regulates the development of NAFLD via similar mechanisms (34). Moreover, ATF3 is shown to interact with HNF4α to regulate hepatic CYP7A1 and CYP8B1 expression (16), and the induction of hepatic CYP7A1 expression is secondary to CYP8B1 inhibition (16). By using hepatocyte-specific Hnf4α−/− mice, we demonstrate a critical role of HNF4α in mediating the effect of hepatic ATF3 on the development of NAFLD. In agreement with these findings, hepatic HNF4α expression is reduced in NAFLD patients or mice under metabolic stress (21). Thus, ATF3 regulates the development of NAFLD through, at least in part, interaction with HNF4α.
Our in vitro data show that hepatocytic ATF3 can directly regulate Kupffer cell activation and that Kupffer cells are important for hepatocytic ATF3 to regulate stellate cell activation. It is possible that ATF3 modulates the composition of extracellular vesicles secreted by hepatocytes, which are then taken up by Kupffer cells or stellate cells to regulate their activation. The secretion of inflammatory cytokines by Kupffer cells appears to be critical for ATF3 in hepatocytes to modulate stellate cell activation. In the future, we will investigate whether HNF4α is also required for ATF3 in hepatocytes to regulate Kupffer cell and stellate cell activation.
In addition to regulating hepatic TG, fatty acid, and cholesterol metabolism, ATF3 also represses intestinal fat and cholesterol absorption by altering bile acid composition, therefore reducing plasma lipid levels (16). The decrease in plasma lipids levels may in turn contribute to a reduction in hepatic lipid levels.
ATF3 is a stress-responsive gene, and its functions in metabolic homeostasis have been poorly characterized. Two previous studies used nongenetic approaches to globally knock down ATF3 expression in rats or mice. Kim et al. (35) found that Atf3 siRNA injected into ZDF rats induced FAO, inhibited inflammatory response, and improved glucose tolerance. Shi et al. (36) injected lentiviruses expressing Atf3 shRNA to Balb/c mice and found the Atf3 knockdown attenuated liver fibrosis induced by carbon tetrachloride (CCl4) and bile duct ligation. However, the specificity of Atf3 siRNA or shRNA has been challenged by the use of genetic mouse models. Transgenic expression of ATF3 in the liver is shown to repress hepatic gluconeogenic genes (37). Using Atf3−/− mice, Zhu et al. (38) showed that global loss of ATF3 exacerbates liver inflammation and damage in a liver ischemia/reperfusion injury model. The latter finding is consistent with our data that global loss of ATF3 aggravates diet-induced steatohepatitis. Importantly, we have used hepatocyte-specific overexpression and knockout approaches to further confirm our in vivo findings. In addition, our finding that ATF3 inhibits apoptosis is consistent with a previous report that ATF3 induces DNA synthesis and cyclin D1 expression in hepatocytes (39).
In summary, we have used a complimentary approach to demonstrate that hepatic ATF3 is a key regulator of the development and progression of NAFLD. ATF3 regulates hepatic TGH activity, FAO, cholesterol catabolism, apoptosis, and inflammation through, at least in part, interaction with hepatic HNF4α. Given that hepatic ATF3 also plays a key role in reverse cholesterol transport and protection against atherosclerosis (16), our current studies suggest that hepatic ATF3 may be targeted for treatment of NAFLD.
Article Information
Funding. This work was supported by National Institutes of Health, National Heart, Lung and Blood Institute grant R01HL142086 and National Institute of Diabetes and Digestive and Kidney Diseases grants R01DK118941, R01DK118805, and R01DK121548 to Y. Zha.
Duality of Interest. No potential conflicts of interest relevant to this article were reported.
Author Contributions. Y.X. S.H., K.J., Y.Zhu, X.P., and F.C.B. performed the studies. Y.X., S.H., L.Y., and Y.Zha. designed the studies. Y.Zha. wrote the manuscript. All of the authors reviewed and approved the manuscript. Y.X. and Y.Zha. are the guarantors of this work, as such, had full access to all the data in the study and take responsibility for the integrity of the data and accuracy of the data analysis.
Footnotes
Y.X. and S.H. contributed equally to this work.
Y.X. is currently affiliated with the Department of Pathology, School of Basic Medical Sciences, Fudan University, Shanghai, China.
This article contains supplementary material online at https://doi.org/10.2337/figshare.16435314.
References
- 1. Edmison J, McCullough AJ. Pathogenesis of non-alcoholic steatohepatitis: human data. Clin Liver Dis 2007;11:75–104, ix [DOI] [PubMed] [Google Scholar]
- 2. Day CP, James OF. Steatohepatitis: a tale of two “hits”? Gastroenterology 1998;114:842–845 [DOI] [PubMed] [Google Scholar]
- 3. Jou J, Choi SS, Diehl AM. Mechanisms of disease progression in nonalcoholic fatty liver disease. Semin Liver Dis 2008;28:370–379 [DOI] [PubMed] [Google Scholar]
- 4. Lewis JR, Mohanty SR. Nonalcoholic fatty liver disease: a review and update. Dig Dis Sci 2010;55:560–578 [DOI] [PubMed] [Google Scholar]
- 5. Adams LA, Lymp JF, St Sauver J, et al. The natural history of nonalcoholic fatty liver disease: a population-based cohort study. Gastroenterology 2005;129:113–121 [DOI] [PubMed] [Google Scholar]
- 6. Charlton M, Sreekumar R, Rasmussen D, Lindor K, Nair KS. Apolipoprotein synthesis in nonalcoholic steatohepatitis. Hepatology 2002;35:898–904 [DOI] [PubMed] [Google Scholar]
- 7. Marra F, Svegliati-Baroni G. Lipotoxicity and the gut-liver axis in NASH pathogenesis. J Hepatol 2018;68:280–295 [DOI] [PubMed] [Google Scholar]
- 8. Fuchs CD, Claudel T, Trauner M. Role of metabolic lipases and lipolytic metabolites in the pathogenesis of NAFLD. Trends Endocrinol Metab 2014;25:576–585 [DOI] [PubMed] [Google Scholar]
- 9. Schweiger M, Lass A, Zimmermann R, Eichmann TO, Zechner R. Neutral lipid storage disease: genetic disorders caused by mutations in adipose triglyceride lipase/PNPLA2 or CGI-58/ABHD5. Am J Physiol Endocrinol Metab 2009;297:E289–E296 [DOI] [PubMed] [Google Scholar]
- 10. Romeo S, Kozlitina J, Xing C, et al. Genetic variation in PNPLA3 confers susceptibility to nonalcoholic fatty liver disease. Nat Genet 2008;40:1461–1465 [DOI] [PMC free article] [PubMed] [Google Scholar]
- 11. Gilchrist M, Thorsson V, Li B, et al. Systems biology approaches identify ATF3 as a negative regulator of Toll-like receptor 4. Nature 2006;441:173–178 [DOI] [PubMed] [Google Scholar]
- 12. Whitmore MM, Iparraguirre A, Kubelka L, Weninger W, Hai T, Williams BR. Negative regulation of TLR-signaling pathways by activating transcription factor-3. J Immunol 2007;179:3622–3630 [DOI] [PubMed] [Google Scholar]
- 13. De Nardo D, Labzin LI, Kono H, et al. High-density lipoprotein mediates anti-inflammatory reprogramming of macrophages via the transcriptional regulator ATF3. Nat Immunol 2014;15:152–160 [DOI] [PMC free article] [PubMed] [Google Scholar]
- 14. Cheng CF, Ku HC, Cheng JJ, et al. Adipocyte browning and resistance to obesity in mice is induced by expression of ATF3. Commun Biol 2019;2:389. [DOI] [PMC free article] [PubMed] [Google Scholar]
- 15. Kalfon R, Koren L, Aviram S, Schwartz O, Hai T, Aronheim A. ATF3 expression in cardiomyocytes preserves homeostasis in the heart and controls peripheral glucose tolerance. Cardiovasc Res 2017;113:134–146 [DOI] [PubMed] [Google Scholar]
- 16. Xu Y, Li Y, Jadhav K, et al. Hepatocyte ATF3 protects against atherosclerosis by regulating HDL and bile acid metabolism. Nat Metab 2021;3:59–74 [DOI] [PMC free article] [PubMed] [Google Scholar]
- 17. Sladek FM, Zhong WM, Lai E, Darnell JE Jr. Liver-enriched transcription factor HNF-4 is a novel member of the steroid hormone receptor superfamily. Genes Dev 1990;4:2353–2365 [DOI] [PubMed] [Google Scholar]
- 18. Watt AJ, Garrison WD, Duncan SA. HNF4: a central regulator of hepatocyte differentiation and function. Hepatology 2003;37:1249–1253 [DOI] [PubMed] [Google Scholar]
- 19. Parviz F, Matullo C, Garrison WD, et al. Hepatocyte nuclear factor 4alpha controls the development of a hepatic epithelium and liver morphogenesis. Nat Genet 2003;34:292–296 [DOI] [PubMed] [Google Scholar]
- 20. Xu Y, Zhu Y, Hu S, et al. Hepatocyte nuclear factor 4α prevents the steatosis-to-NASH progression by regulating p53 and bile acid signaling. Hepatology 2021;73:2251–2265 [DOI] [PMC free article] [PubMed] [Google Scholar]
- 21. Xu Y, Zalzala M, Xu J, Li Y, Yin L, Zhang Y. A metabolic stress-inducible miR-34a-HNF4α pathway regulates lipid and lipoprotein metabolism. Nat Commun 2015;6:7466. [DOI] [PMC free article] [PubMed] [Google Scholar]
- 22. Yin L, Ma H, Ge X, Edwards PA, Zhang Y. Hepatic hepatocyte nuclear factor 4α is essential for maintaining triglyceride and cholesterol homeostasis. Arterioscler Thromb Vasc Biol 2011;31:328–336 [DOI] [PMC free article] [PubMed] [Google Scholar]
- 23. Zhang Y, Castellani LW, Sinal CJ, Gonzalez FJ, Edwards PA. Peroxisome proliferator-activated receptor-gamma coactivator 1alpha (PGC-1alpha) regulates triglyceride metabolism by activation of the nuclear receptor FXR. Genes Dev 2004;18:157–169 [DOI] [PMC free article] [PubMed] [Google Scholar]
- 24. Li PZ, Li JZ, Li M, Gong JP, He K. An efficient method to isolate and culture mouse Kupffer cells. Immunol Lett 2014;158:52–56 [DOI] [PubMed] [Google Scholar]
- 25. Mederacke I, Dapito DH, Affò S, Uchinami H, Schwabe RF. High-yield and high-purity isolation of hepatic stellate cells from normal and fibrotic mouse livers. Nat Protoc 2015;10:305–315 [DOI] [PMC free article] [PubMed] [Google Scholar]
- 26. Zhang Y, Yin L, Hillgartner FB. SREBP-1 integrates the actions of thyroid hormone, insulin, cAMP, and medium-chain fatty acids on ACCalpha transcription in hepatocytes. J Lipid Res 2003;44:356–368 [DOI] [PubMed] [Google Scholar]
- 27. Zhang Y, Lee FY, Barrera G, et al. Activation of the nuclear receptor FXR improves hyperglycemia and hyperlipidemia in diabetic mice. Proc Natl Acad Sci U S A 2006;103:1006–1011 [DOI] [PMC free article] [PubMed] [Google Scholar]
- 28. Bligh EG, Dyer WJ. A rapid method of total lipid extraction and purification. Can J Biochem Physiol 1959;37:911–917 [DOI] [PubMed] [Google Scholar]
- 29. Xu J, Xu Y, Li Y, et al. Carboxylesterase 1 is regulated by hepatocyte nuclear factor 4α and protects against alcohol- and MCD diet-induced liver injury. Sci Rep 2016;6:24277. [DOI] [PMC free article] [PubMed] [Google Scholar]
- 30. Li Y, Zalzala M, Jadhav K, et al. Carboxylesterase 2 prevents liver steatosis by modulating lipolysis, endoplasmic reticulum stress, and lipogenesis and is regulated by hepatocyte nuclear factor 4 alpha in mice. Hepatology 2016;63:1860–1874 [DOI] [PMC free article] [PubMed] [Google Scholar]
- 31. Rune A, Osler ME, Fritz T, Zierath JR. Regulation of skeletal muscle sucrose, non-fermenting 1/AMP-activated protein kinase-related kinase (SNARK) by metabolic stress and diabetes. Diabetologia 2009;52:2182–2189 [DOI] [PMC free article] [PubMed] [Google Scholar]
- 32. Xu J, Li Y, Chen WD, et al. Hepatic carboxylesterase 1 is essential for both normal and farnesoid X receptor-controlled lipid homeostasis. Hepatology 2014;59:1761–1771 [DOI] [PMC free article] [PubMed] [Google Scholar]
- 33. Ibrahim SH, Kohli R, Gores GJ. Mechanisms of lipotoxicity in NAFLD and clinical implications. J Pediatr Gastroenterol Nutr 2011;53:131–140 [DOI] [PMC free article] [PubMed] [Google Scholar]
- 34. Ioannou GN. The role of cholesterol in the pathogenesis of NASH. Trends Endocrinol Metab 2016;27:84–95 [DOI] [PubMed] [Google Scholar]
- 35. Kim JY, Park KJ, Hwang JY, et al. Activating transcription factor 3 is a target molecule linking hepatic steatosis to impaired glucose homeostasis. J Hepatol 2017;67:349–359 [DOI] [PubMed] [Google Scholar]
- 36. Shi Z, Zhang K, Chen T, et al. Transcriptional factor ATF3 promotes liver fibrosis via activating hepatic stellate cells. Cell Death Dis 2020;11:1066. [DOI] [PMC free article] [PubMed] [Google Scholar]
- 37. Allen-Jennings AE, Hartman MG, Kociba GJ, Hai T. The roles of ATF3 in glucose homeostasis. A transgenic mouse model with liver dysfunction and defects in endocrine pancreas. J Biol Chem 2001;276:29507–29514 [DOI] [PubMed] [Google Scholar]
- 38. Zhu Q, Wang H, Jiang B, et al. Loss of ATF3 exacerbates liver damage through the activation of mTOR/p70S6K/ HIF-1α signaling pathway in liver inflammatory injury. Cell Death Dis 2018;9:910. [DOI] [PMC free article] [PubMed] [Google Scholar]
- 39. Allan AL, Albanese C, Pestell RG, LaMarre J. Activating transcription factor 3 induces DNA synthesis and expression of cyclin D1 in hepatocytes. J Biol Chem 2001;276:27272–27280 [DOI] [PubMed] [Google Scholar]