

Summary
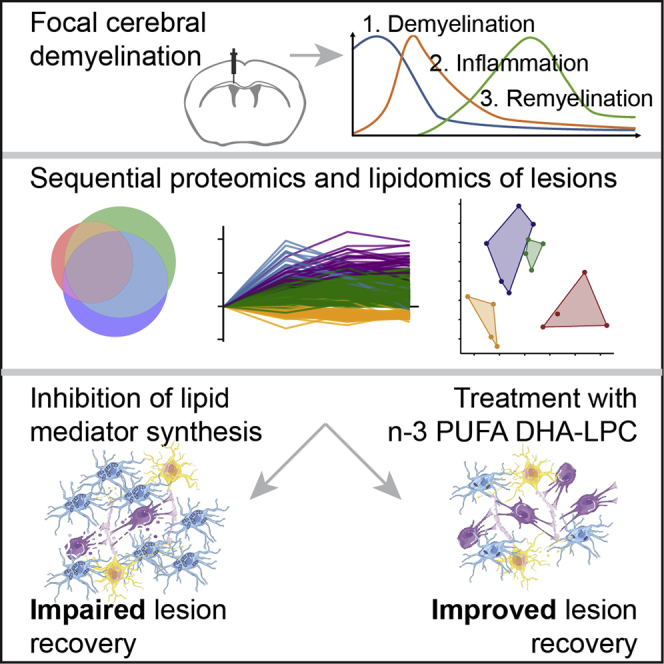
After demyelinating injury of the central nervous system, resolution of the mounting acute inflammation is crucial for the initiation of a regenerative response. Here, we aim to identify fatty acids and lipid mediators that govern the balance of inflammatory reactions within demyelinating lesions. Using lipidomics, we identify bioactive lipids in the resolution phase of inflammation with markedly elevated levels of n-3 polyunsaturated fatty acids. Using fat-1 transgenic mice, which convert n-6 fatty acids to n-3 fatty acids, we find that reduction of the n-6/n-3 ratio decreases the phagocytic infiltrate. In addition, we observe accelerated decline of microglia/macrophages and enhanced generation of oligodendrocytes in aged mice when n-3 fatty acids are shuttled to the brain. Thus, n-3 fatty acids enhance lesion recovery and may, therefore, provide the basis for pro-regenerative medicines of demyelinating diseases in the central nervous system.
Keywords: myelin, demyelination, remyelination, microglia, inflammation resolution, lipids
Graphical abstract
Highlights
-
•
Lipid and fatty acid abundance is specifically altered during de- and remyelination
-
•
Reduction of pro- and anti-inflammatory lipid mediators impairs lesion recovery
-
•
DHA supplementation fosters phagocyte decline and oligodendrocyte generation
-
•
n-3 fatty acid supplementation may be a strategy to promote remyelination
Penkert et al. employ sequential proteomics and lipidomics to elucidate the role of lipid mediators in lesion recovery in a mouse model of focal, cerebral demyelination. Using genetic and pharmacologic interventions, they find n-3 fatty acid supplementation, specifically DHA, to enhance innate inflammation resolution and oligodendrocyte generation.
Introduction
Demyelinating injury as it occurs in multiple sclerosis (MS) in the central nervous system (CNS) is followed by a repair process, which attempts to re-establish tissue structure (Franklin and Ffrench-Constant, 2008, 2017). However, remyelination is inefficient, and, particularly in aged patients, persistent neurological deficits often remain (Franklin et al., 2012; Kuhlmann et al., 2008; Patrikios et al., 2006). Identifying the mechanisms that determine how remyelination occurs is, therefore, an important goal for the design of regenerative medicines for MS (Lubetzki et al., 2020; Plemel et al., 2017; Stangel et al., 2017). A major reaction to acute demyelinating injury is a multicellular response that consists of activated microglia, monocyte-derived macrophages, astrocytes, and oligodendrocyte progenitor cells (OPCs) (Molina-Gonzalez and Miron, 2019; Murphy and Franklin, 2017; Rawji et al., 2020). Each of these different cell types is attracted to the lesion site, where they demarcate the area, remove injured myelin, and, finally, attempt to promote homeostasis and remyelination. The regenerative response requires the activation of the innate immune system, starting with a mounting microglia/macrophage infiltration that subsequently resolves in a precisely controlled manner (Domingues et al., 2016; Lloyd and Miron, 2019; McMurran et al., 2016). While innate immune cells play an important role in phagocytosing myelin debris and producing pro-regenerative factors, maladaptive and prolonged immune reactions can lead to chronic or uncontrolled inflammation, which impedes repair (Bosch-Queralt et al., 2021; Cantuti-Castelvetri et al., 2018; Cunha et al., 2020; Dong et al., 2021; Kotter et al., 2005, 2006; Miron et al., 2013; Gouna et al., 2021; Shen et al., 2021). Thus, identifying the factors that control innate immune activation and inflammation resolution is essential for our understanding of remyelination. Pro-inflammatory lipid mediators such as n-6 arachidonic acid (AA)-derived prostaglandins and leukotrienes are widely appreciated for their important role in initiating acute inflammation, whereas specialized pro-resolving lipid mediators (SPMs) produced from n-3 eicosapentaenoic acid (EPA) and docosahexaenoic acid (DHA) control the resolution phase (Basil and Levy, 2016; Buckley et al., 2014; Dennis and Norris, 2015; Serhan, 2014). Therefore, we aimed at identifying fatty acids (FAs) and lipid mediators that govern the balance of the inflammatory reactions within demyelinating lesions.
Results
Proteomic and lipidomic profiling of demyelinating lesions
To identify factors in lesion recovery after demyelinating injury in mice, we used a toxin-induced model in which a single dose of lysolecithin is injected into the corpus callosum (CC) to induce focal demyelination (Blakemore and Franklin, 2008) and performed proteomics and lipidomics on isolated lesions at different time points. In this model, demyelination occurs within 3 days post-injection (dpi), which is accompanied and followed by an innate inflammatory response consisting mainly of microglia and a reparative process carried out by cells of the oligodendrocyte lineage. Thus, we dissected lesions of C57BL/6J mice around the peak of demyelination (i.e., 3 dpi), in the transitioning phase of maximal inflammation and start of remyelination (7 dpi), and during remyelination (14 dpi) and used healthy CC for comparison (0 dpi, untreated). Performing proteomics, we detected 6,301 proteins, of which 2,383 showed alterations over time, with 727 proteins being altered between healthy CC and the individual time points. Most changes were detected at 7 or 14 dpi (Figures 1A, 1B, and S1; Table S1). Clustering resulted in four groups with distinct dynamics of protein abundance (Figure 1C). Cluster 3 consists of blood-derived proteins with the highest levels at 3 dpi (e.g., albumin, transferrin), cell adhesion molecules (e.g., integrins, annexins), and regulators of peptidases (e.g., serpins; Table S1), confirming significant edema in early lesions. Cluster 1 is enriched with microglial proteins and peaks at 7 dpi, whereas proteins found in cluster 2 increase their abundances toward 14 dpi (Figure 1C). Cluster 4 is enriched in proteins, which decrease over time. Gene Ontology (GO) analysis for biological processes (BPs) shows an enrichment of terms associated with immune cell activation, cell development/migration, and “leukocyte activation” in cluster 1 (Table S1). Cluster 2 is enriched in “cellular lipid catabolic process,” “lysosome,” “lytic vacuole,” “peptide metabolic process,” “cellular macromolecule biosynthetic process,” and others (Figure 1D). Myelin-associated GO terms like “constituent of myelin sheath” or “compact myelin,” as well as the more general GO term “nervous system process,” are among others enriched in cluster 4 (data not shown). Several clusters are enriched in terms connected to lipid metabolism. For example, proteins involved in “isoprenoid biosynthetic processes,” “cholesterol biosynthetic processing,” and “terpenoid backbone biosynthesis”—which leads to the formation of sterol precursors—as well as “glycerophospholipid metabolism” are found in cluster 4. Terms connected to catabolic lipid metabolism such as “fatty acid beta-oxidation,” “lipid oxidation,” and “cellular lipid catabolic processing” are associated with a subcluster of cluster 2 (Figure S1). The Kyoto Encyclopedia of Genes and Genomes (KEGG) pathway terms “fatty acid elongation/metabolism/degradation” and “terpenoid backbone biosynthesis” are enriched at 14 dpi (Figure 1E).
Figure 1.

Sequential proteomics of demyelinated lesions in C57BL/6J mice reveal alterations in lipid and FA metabolism
(A) Venn diagram of 727 proteins altered between healthy (untreated, 0 dpi) and lesioned corpus callosum (thresholds: absolute fold change > 2ˆ(0.5), two-sided unpaired Student’s t test, p < 0.05) illustrates that most changes occur at 7 and 14 dpi (green and purple circles, respectively) with a large overlap between both groups (blue area). See also Table S1. n0dpi, n3dpi, n7dpi, and n14dpi: 5, 5, 4, and 5 samples, respectively.
(B) Volcano plots between 7 versus 0 dpi (left) and 14 versus 7 dpi (right). The minus log10-transformed p value of each protein is plotted against its log2-transformed label-free quantification (LFQ) ratio. A permutation-based false discovery rate (FDR) estimation was applied and is visualized as a hyperbolic, dotted curve (p = 0.05, s0 = 0.1). Significantly altered proteins are plotted in red.
(C) Automated clustering of altered proteins (absolute fold change > 0.5, p < 0.05) results in four clusters with (top) distinct temporal expression (log2 ratio of mean LFQs), (middle) clear cluster separation by principal-component analysis (principal component 1 and principal component 2 explaining 59% and 36% of the observed difference, respectively), and (bottom) differential putative cell composition as assessed by proteins with abundance in selective cell types (definition of abundance: fold change > 2∧(0.5), Student’s t test p value < 0.05). See also Figure S1.
(D) Gene ontology (GO) term enrichment analysis of cluster 2 depicting the five terms with lowest p values for molecular function, cellular component, and biological process. As cluster 2 increases over time, it putatively contains proteins that influence the cessation of inflammation and remyelination.
(E) In accordance, enrichment analysis of KEGG pathways of proteins altered at 14 dpi shows FA metabolism and terpenoid backbone biosynthesis within the top five hits.
∗p < 0.05, ∗∗∗p < 0.001 after Benjamin-Hochberg FDR correction.
To determine changes in lipid species within lesions over time, we performed shotgun and liquid-chromatography-tandem-mass-spectrometry-based lipidomics of demyelinating lesions. Principal-component analysis showed a clear distinction between lipid profiles at 0, 3, 7, and 14 dpi (Figure 2A; Table S2). Lysophospholipids (LPLs) were predominantly altered and depicted a clear peak at 3 dpi (Figures 2B and 2C). Lysophosphatidylcholine, which was applied to induce demyelination, as well as other lysophosphatidyls such as lysophosphatidylethanolamine (LPE), lysophosphatidylserine (LPS), and LPE ether (LPE O-) show an increase at 3 dpi (Figure 2C), possibly as a result of enhanced phospholipase activities (Figure S2) (Glukhova et al., 2015; Hiraoka et al., 2002). As free FAs and their oxygenated derivatives exert key functions as lipid mediators in inflammation and its resolution (Basil and Levy, 2016; Buckley et al., 2014; Dennis and Norris, 2015; Jordan et al., 2020; Serhan, 2014), we next performed metabololipidomics of white matter lesions. We observed an increase in n-6 and n-3 polyunsaturated FAs (PUFAs)—namely, AA, DHA, and EPA, of which the increase in EPA was most pronounced (Figures 2D and 2E). The PUFA increase was accompanied by a reduction of the ratio of AA/(EPA+DHA), which has implications for the production of pro- and anti-inflammatory lipid mediators by cyclooxygenases and lipoxygenases. In parallel, an increase of prostaglandins and lipoxygenase-derived products was detected (Figures 2F and 2G). Of note, the release of n-6 and n-3 PUFAs and derived lipid mediators differs between aged and young mice, depicting a greater relative decrease of the n-6/n-3 ratio after demyelination in lesions of young mice (Figure S2). The observed effects are specific to demyelination, as PBS-injected mice do not show a comparable increase of PUFA and lipid mediator levels (Figures S3A and S3B).
Figure 2.

Sequential lipid profiles of demyelinated lesions show specific alterations of LPLs, FAs, and lipid mediators during lesion resolution
(A) Principal-component analysis based on lipid class sums reveals distinct lipidomes of healthy CC (yellow, untreated, 0 dpi) and demyelinated lesions of C57BL/6J mice at 3, 7, and 14 dpi (red, green, and blue, respectively). While principal component 1 discriminates between healthy and inflamed tissue (0 versus 3 dpi), principal component 2 discriminates between healthy and remyelinating tissue (0 versus 14 dpi). See also Table S2 and Figure S2. n0dpi, n3dpi, n7dpi, and n14dpi: 4, 4, 4, and 5 samples, respectively.
(B) The –log(q) values of one-way ANOVAs of lipid classes corrected for multiple comparison (y axis, q ≤ 0.01 plotted in red) plotted against log2 of maximal fold change between time points (x axis). Lysophosphatidylethanolamine ether (LPE O-), lysophosphatidylserine (LPS), and lysophosphatidylcholine (LPC) are beside triacylglyceride (TAG) the mostly altered lipid classes over time. 1 PE, 2 PC O-, 3 PS, 4 DAG, 5 PI, 6 LPA, 7 PC, 8 HexCer, 9 PE O-.
(C) Percentage of (selective) significantly altered lipid classes of total lipid amount over time (one-way ANOVA with Dunnett’s multiple comparison test). Various LPLs increase at 3 dpi (red).
(D) Scheme of lipid mediator production. Upon inflammation, phospholipase A hydrolyzes phospholipids in LPLs and free FAs. Among these are arachidonic acid (AA), eicosapentaenoic acid (EPA), and docosahexaenoic acid (DHA). Lipoxygenases (e.g., ALOX5 and ALOX15) and cyclooxygenases (COX-1/2) catalyze the oxidation of FAs into lipid mediators with multifaceted pro- and anti-inflammatory functions.
(E–G) Concentration of free FAs (E) and lipid mediators (F and G) in lesions over time. See also Figure S3. n0dpi = n3dpi = n7dpi = n14dpi = 5 samples. Levels of specialized pro-resolving mediators (SPMs) like resolvins, lipoxins, and protectins were around the detection threshold and are therefore not depicted.
Data are represented as mean ± SD. One-way ANOVA with Dunnett’s multiple comparison test and Kruskal-Wallis test with Dunn’s multiple comparison test were performed for parametric and nonparametric data, respectively. ∗p < 0.05, ∗∗p < 0.01, ∗∗∗p < 0.001, and ∗∗∗∗p < 0.0001. Asterisks illustrate significant results compared to 0 dpi. Asterisks with an additional horizontal bar illustrate significant results between corresponding time points
Lipoxygenases modulate phagocyte density after demyelinating injury
Having observed the release of PUFAs and their oxygenated products in demyelinating lesions, we next investigated whether lipid mediators modulate innate inflammation and its resolution, as assessed by the abundance of phagocytic cells. Lipoxygenases are dioxygenases that catalyze the formation of corresponding hydroperoxides from PUFAs to form biologically active oxygenated products (Ackermann et al., 2017; Haeggström and Funk, 2011; Kuhn et al., 2015). Among several isoforms, ALOX5 and ALOX15 are especially important, as they transform AA into pro-inflammatory leukotrienes (ALOX5 dependent) and AA, EPA, and DHA into various anti-inflammatory SPMs (e.g., lipoxins [AA derived], E-series and D-series resolvins [EPA and DHA derived, respectively], and maresins and protectins [DHA derived]) (Figure 2D; Serhan and Petasis, 2011; Serhan et al., 2015). Because ALOX15 plays an important role in the formation of SPMs, we treated mice with baicalein (Baic), an antagonist of ALOX15 and other 12/15-LOXs. Lysolecithin was injected into the CC of treated and control mice, and lesions were analyzed at 14 dpi. We found a higher density of IBA1+ phagocytes in Baic-treated mice. Surprisingly, inhibition of pro-inflammatory cyclooxygenase-1 by aspirin (ASA) similarly led to increased inflammation (Figures 3A–3C). To validate our results, we next used a global knockout (KO) of ALOX15 to analyze lesion recovery. The density of IBA1+ phagocytes was higher in ALOX15-deficient mice compared to control (Figures 3D and 3H). In addition, KO mice showed an increase of phagocyte-associated myelin debris and increased crystal formation (Figures 3F, 3I, and 3J), which is associated with dysfunctional cholesterol clearance, persisting inflammation, and impaired remyelination (Bosch-Queralt et al., 2021; Cantuti-Castelvetri et al., 2018). In accordance, the percentage of CC1+OLIG2+ mature oligodendrocytes was slightly reduced in ALOX15-deficient mice, while the total densities of OLIG2+ oligodendrocyte lineage cells were equal (Figures 3G, 3K, and S3C).
Figure 3.

Reduction of pro- and anti-inflammatory lipid mediators by inhibition of cyclooxygenase-1 and lipoxygenases leads to impaired resolution of inflammation
(A) Schematic drawing as a guidance for the images. Lesions were induced in the CC dorsal of the lateral ventricle (LV). Coronal sections were processed for imaging. The black rectangle illustrates areas magnified in (B)–(G).
(B) Representative images of coronal sections of 12-month-old C57BL/6J mice (left) on standard chow (control) or (middle) additionally orally treated with pharmacological inhibitors of cyclooxygenase-1 (ASA) or (right) ALOX15 (Baic) at 14 dpi. Demyelination (loss of fluoromyelin, green), IBA1+ phagocytic infiltrate (cyan).
(C) Density of phagocytic cells in old mice at 14 dpi treated with ASA or Baic. One-way ANOVA with Dunnett’s multiple comparisons test, nCO = 8, nASA = 6, nBaic = 6, pASA = 0.0041, pBaicalein = 0.041.
(D and H) Representative images (D) of lesions of wild-type (WT) (left) and ALOX15 KO mice (right) at 14 dpi. Analysis of phagocyte density (H), unpaired t test, nWT = 9, nALOX15 = 5, p = 0.0423.
(E and L) Representative images (E) of WT (left) and ALOX5 KO mice (right) at 14 dpi. Analysis of phagocyte density (L) at 4 dpi (peak of inflammation) and 14 dpi. Two-way ANOVA, nWT_4dpi = 7, nALOX5_4dpi = 7, nWT_14dpi = 8, nALOX5_14dpi = 7, ptime < 0.0001, pmouseline < 0.0001, Sidak’s multiple comparisons test p2wpi = 0.0014.
(F and I) Representative images (F) of (cholesterol) crystals (white) in WT and ALOX15 KO mice. Analysis of crystal abundance (I), unpaired t test, nWT = 9, nALOX15 = 9, p = 0.0237.
(G and K) Representative images (G) of mature CC1+OLIG2 + oligodendrocytes (arrow) and of OLIG2 + oligodendrocytes (arrowhead) at 14 dpi. Percentage of CC1+OLIG2+ oligodendrocytes (K), unpaired t test, nWT = 9, nALOX15 = 9, p = 0.018. See also Figure S3.
(J) Correlation analysis of fluoromyelin and IBA1 signal in WT and ALOX15 KO mice. Unpaired t test, nWT = 9, nALOX15 = 5, p = 0.0192.
Data are represented as mean ± SD. ∗p < 0.05, ∗∗p < 0.01. Scale bar: 100 μm (B, D, and E) or 50 μm (F and G).
Next, we analyzed the function of ALOX5, which is the rate-limiting enzyme for the biosynthesis of leukotrienes, a family of pro-inflammatory lipid mediators derived from AA. The density of IBA1+ phagocytes was higher in ALOX5-deficient as compared to control mice in lesions at 14 dpi (Figures 3E and 3L). To determine whether ALOX5-deficient mice exhibit delayed infiltration of phagocytes in early lesions or have an increased abundance of microglia/macrophages at peak of inflammation, we analyzed lesions at 4 dpi, but we observed similar densities of IBA1+ phagocytes, suggesting that the resolution of inflammation was impaired. Thus, an inhibition of anti-inflammatory lipid mediator production (e.g., ALOX15-dependent SPMs) and of pro-inflammatory eicosanoids (e.g., ALOX5-dependent leukotrienes and cyclooxygenase-dependent prostaglandins) leads to persistent phagocyte density.
Omega-3 FAs act as modulators of phagocyte infiltration after demyelinating injury
Pro-inflammatory eicosanoids are produced from n-6 PUFAs as AA, whereas anti-inflammatory SPMs are generated from n-3 and n-6 PUFAs (Ackermann et al., 2017; Basil and Levy, 2016; Dennis and Norris, 2015; Serhan and Petasis, 2011). We therefore asked whether increasing the ratio of n-3 to n-6 PUFAs might skew the immune response toward resolution of the phagocytic infiltrate. Because the blood-brain barrier is still immature in the early developing brain, we fed pregnant female mice diets of varied PUFA composition (see Table S3 for diet composition) from the time of conception until weaning. Offspring were kept on diets, and lysolecithin was injected to induce lesions at 6 weeks of age. Interestingly, lesions of mice that had been fed a diet containing high n-6/n-3 PUFA composition (diet containing 5% safflower oil, n-6/n-3 ratio = 44) showed an increased density of IBA1+ phagocytes at 14 dpi (Figures 4A and 4C). To confirm that the increased load of phagocytic cells is due to the increased n-6/n-3 ratio and not to other differences between diets, we performed lysolecithin injections in fat-1 transgenic mice. Fat-1 mice express a desaturase that converts n-6 FAs to n-3 FAs, thereby reducing the n-6/n-3 ratio (Kang et al., 2004; Siegert et al., 2017). Indeed, fat-1 mice challenged with n-6-enriched diet show a reduced IBA1+ phagocytic infiltrate and an increased number of mature oligodendrocytes in 14 dpi lesions compared to control mice receiving the same diet (Figures 4B, 4D, 4E, S3D, and S3E). Thus, we asked whether providing n-3 FAs such as DHA might provide a strategy to enhance lesion recovery in aged mice after demyelinating injury. Because the blood-brain barrier impairs diffusion of free DHA, we used lysophosphatidylcholine (LPC)-bound DHA (DHA-LPC), which is actively transported into the brain by major facilitator superfamily domain-containing 2a (Mfsd2a) causing a more pronounced increase in cerebral DHA levels (Fitzner et al., 2020; Nguyen et al., 2014; Sugasini et al., 2017; Yalagala et al., 2019). We intraperitoneally administered corn oil (vehicle), corn oil + DHA, or corn oil + DHA-LPC for 2 weeks to aged mice before inducing CC demyelination. While the volumes of demyelination and phagocyte infiltration were equal at the peak of inflammation (4 dpi; Figures S3F and S3G), we found a reduction of both within the DHA-LPC-treated group during the recovery phase (14 dpi; Figures 4F–4H). In addition, DHA-LPC, but not DHA, reduced the deposition of cholesterol crystals (Figures 4I and 4K). Furthermore, DHA and DHA-LPC increased the percentage of CC1+OLIG2+ mature oligodendrocytes, which was more pronounced in DHA-LPC-treated mice, while the overall number of OLIG2+ lineage cells remained similar (Figures 4J, 4L, and S3H). Hence, DHA-LPC supplementation fosters resolution of the phagocytic infiltrate and remyelination.
Figure 4.

Brain-targeted DHA supplementation fosters resolution of inflammation and lesion recovery
(A and C) Representative images (A) and quantification (C) of phagocytic density of lesions at 14 dpi of C57BL/6J mice on diets with different PUFA composition. Increased intake of n-6 FAs (diet 2, containing safflower oil) causes increased inflammation. One-way ANOVA with Tukey’s multiple comparison test, nBeef = 6, nSafflower = 7, nFish = 7, pANOVA = 0.0263, pSaffldietVsBeefdiet = 0.0219. See Table S3 for diet composition.
(B and D) Representative images (B) and quantification (D) of inflammation in lesions of WT (B, left panel) and fat-1 transgenic mice (B, right panel) on diet 2 (high in n-6 PUFAs) at 14 dpi. Fat-1 mice express a desaturase converting n-6 FAs to n-3 FAs. Unpaired t test, nWT = 5, nfat-1 = 7, p = 0.0316. See also Figure S3.
(E) Percentage of mature CC1+OLIG2+ oligodendrocytes in lesions of WT and fat-1 transgenic mice. Welch’s t test, nWT = 5, nfat-1 = 6, p = 0.0010.
(F–H) Representative images (F) and quantification of lesion volume (G) and IBA1+ phagocytic infiltrate (H) at 14 dpi of 12-month-old C57BL/6J mice intraperitoneally injected with DHA-LPC (F, right panel) or vehicle (F, left panel, control). Kruskal-Wallis test with Dunn’s multiple comparison test, nCON = 6, nDHA = 7, nDHA-LPC = 8, p = 0.0438, pDHA-LPC versus con. = 0.0306. One-way ANOVA with Dunnett’s multiple comparison test nCON = 6, nDHA = 8, nDHA-LPC = 9, pANOVA = 0.0216, pDHA-LPC versus con. = 0.0124, respectively. See also Figure S3.
(I and K) Representative images (I) and quantification (K) of (cholesterol) crystal deposition in lesions of 12-month-old C57BL/6J mice intraperitoneally injected with DHA, DHA-LPC, or vehicle (control). One-way ANOVA with Dunnett’s multiple comparison test, nCON = 6, nDHA = 7, nDHA-LPC = 8, pANOVA = 0.0160, pDHA-LPC versus con. = 0.0120.
(J and L) Representative images (J) of mature CC1+OLIG2+ oligodendrocytes (arrow) and of OLIG2+ oligodendrocytes (arrowhead) at 14 dpi in aged C57BL/6J mice injected with DHA, DHA-LPC, or vehicle. Percentage of mature CC1+OLIG2+ oligodendrocytes (L), one-way ANOVA with Dunnett’s multiple comparison test nCON = 6, nDHA = 7, nDHA-LPC = 8, pANOVA = 0.0054, pCO versus DHA = 0.0221, pCO versus DHA-LPC = 0.0035. See also Figure S3.
Data are represented as mean ± SD. ∗p < 0.05, ∗∗p < 0.01. Scale bar: 100 μm (A, B, and F) or 50 μm (I and J).
Discussion
Resolution of the acute inflammatory response that occurs after injury is crucial for tissue repair and for return to host tissue homeostasis (Buckley et al., 2014; Dennis and Norris, 2015). Ideally, the inflammatory innate response is self-limiting, and the phagocytic infiltrate declines over time. With increasing age or obesity, however, the response can become maladaptive and impede remyelination (Bosch-Queralt et al., 2021; Cantuti-Castelvetri et al., 2018; Chiurchiù et al., 2018). Using a systems biology approach combining proteomics and lipidomics, we characterized lipid pathways and lipid mediators that are upregulated in demyelinating lesions. By focusing on lesions of young mice, we identified bioactive lipids in the resolution phase of acute inflammation. We observed a striking induction of n-6 and n-3 PUFAs. Analyzing fat-1 transgenic mice, which convert n-6 to n-3 FAs, we found improved phagocyte resolution and enhanced generation of mature oligodendrocytes. One possible explanation might be direct modulation of microglial phagocytosis by PUFA ratios and ALOX15, as recently demonstrated in neurodevelopment (Madore et al., 2020). FAs can be supplemented by dietary intervention. However, only limited amounts of dietary lipids reach the brain (Fitzner et al., 2020; Lacombe et al., 2018; Layé et al., 2018). Thus, we exploited the function of the Mfsd2a receptor to shuttle LPC-coupled lipids into the brain (Sugasini et al., 2017; Wong and Silver, 2020; Yalagala et al., 2019). Using this approach to enhance lipid delivery into the CNS, we found that LPC-DHA promoted resolution of the phagocytic infiltrate and enhanced regeneration in aged mice. DHA serves as a substrate for the biosynthesis of anti-inflammatory and pro-resolving mediators such as protectins, resolvins, and maresins, which are produced in low picogram levels, making their detection a challenging task. Using liquid-chromatography-tandem-mass-spectrometry-based lipidomics, we were able to identify some lipid mediators, but a full characterization was not possible. Thus, future work is required to determine which of these bioactive lipids are responsible for inflammation resolution from demyelinating lesions. Another limitation of our study is the global nature of pharmacological, genetic, and dietary interventions, which do not allow an inference about systemic or local and direct or indirect mechanisms of the observed effects. Furthermore, some of the observed proteomic and lipidomic alterations after lysolecithin injection are possibly not specific to demyelination but are a general effect of the cerebral injections.
The importance of lipids, specifically of sterols, and nuclear lipid receptors including liver X receptor (LXR) and retinoid X receptor (RXR) for resolution of inflammation, oligodendrocyte formation, and remyelination has previously been established (Camargo et al., 2017; Cantuti-Castelvetri et al., 2018; Huang et al., 2011; Meffre et al., 2015). Recently, sterol synthesis in myelin-phagocytosing microglia/macrophages was identified as an important contributor to the regenerative response after demyelinating injury (Berghoff et al., 2021). Microglia/macrophages synthesize desmosterol, the immediate cholesterol precursor, which activates LXR signaling to resolve inflammation, thereby creating a permissive environment for oligodendrocyte differentiation. In accordance with this, biosynthesis of terpenoids, which are the building blocks of sterols, was one of the enriched pathways in our proteomic analysis. In addition, we find an enrichment of FA metabolism and of lipid catabolic processes in the phase of remyelination. Apart from cytokines, FAs and their bioactive metabolites are well-known signaling molecules mediating pro- and anti-inflammatory responses of myeloid cells. However, their relevance for microglia is considerably less characterized (Basil and Levy, 2016; Buckley et al., 2014; Dennis and Norris, 2015; Lacombe et al., 2018; Layé et al., 2018; Serhan, 2014). Specifically, the role of PUFAs and their bioactive mediators for cerebral inflammation in the context of demyelination and remyelination has received only a little attention (Bogie et al., 2020a; Chen et al., 2014b; Marusic et al., 2005; Palumbo et al., 2011; Takahashi et al., 2013; Torkildsen et al., 2009). In accordance with previous studies, we find that inhibition of classical pro-inflammatory eicosanoids impairs resolution of inflammation, which could be explained by impaired activation of microglia and insufficient clearance of myelin debris, which are prerequisites for remyelination (Chen et al., 2014b; Cunha et al., 2020; Kotter et al., 2005, 2006; Lampron et al., 2015). Of note, we observed an impaired reduction of the n-6/n-3 ratio in late lesions of aged mice, which might contribute to the limited regenerative capacity in these mice, as DHA-LPC supplementation fosters regeneration. Higher lipid mediator levels have also been detected in patients with active MS compared to inactive MS (Kooij et al., 2020; Prüss et al., 2013). Whether these are a mere consequence of increased inflammation or an insufficient attempt to foster resolution of inflammation remains elusive. FA supplementation has been investigated in trials for atherosclerosis and coronary heart disease with varying outcomes. Furthermore, its role in cerebral inflammation and remyelination is not fully understood (AlAmmar et al., 2021; Bogie et al., 2020b; Chen et al., 2014a, 2014b; Marusic et al., 2005; Palumbo et al., 2011; Preisner et al., 2015; Siegert et al., 2017; Takahashi et al., 2013; Torkildsen et al., 2009). For example, short-chain FAs are shown to ameliorate experimental autoimmune encephalomyelitis (EAE) and reduce axonal damage, while saturated long-chain FAs exacerbate disease via modulation of the adaptive immune system (Haghikia et al., 2015). Our data, together with two previous studies in EAE (Adkins et al., 2019) and the cuprizone model of general demyelination (Chen et al., 2014b), point to a beneficial role of DHA in experimental models of demyelination. As shown here, covalent binding of n3-PUFAs, such as DHA to LPC, could be a strategy to promote its uptake and function in the CNS. Since cellular lipid composition can potentially be modulated by diets and existing pharmaceuticals, insight into the function in demyelinated lesions may provide novel therapeutic strategies.
STAR★Methods
Key resources table
| REAGENT or RESOURCE | SOURCE | IDENTIFIER |
|---|---|---|
| Antibodies | ||
| anti-APC-CC1 mouse | Sigma Aldrich | Cat#OP80; RRID: AB_2057371 |
| anti-IBA1 rabbit | WAKO | Cat#019-19741; RRID: AB_839504 |
| anti-OLIG2 rabbit | Sigma Aldrich | Cat#AB9610; RRID: AB_570666 |
| Goat anti-rabbit IgG (H+L), secondary antibody, Alexa Fluor 488 | Thermofisher Scientific | Cat#A11008; RRID: AB_143165 |
| Goat anti-mouse IgG (H+L), secondary antibody, Alexa Fluor 555 | Thermofisher Scientific | Cat#A21422; RRID: AB_141822 |
| Donkey anti-rabbit IgG (H+L), secondary antibody, Alexa Fluor 647 | Thermofisher Scientific | Cat#A31573; RRID: AB_2536183 |
| Chemicals, peptides, and recombinant proteins | ||
| 1-Docosahexaenoyl-2-hydroxy-sn-glycero-3-phosphocholine (DHA-LPC) | Avanti Polar Lipids, USA | Cat#790713 |
| Docosahexaenoic Acid (DHA) | Cayman Chemical | Cat#Cay90310 |
| Deposited data | ||
| Proteomic and lipidomic data | This Manuscript | PRIDE: PXD024891 (see also Tables S1 and S2) |
| Experimental models: Organisms/strains | ||
| Mouse: C57BL/6J | The Jackson Laboratory | JAX: 000664 |
| Mouse: B6.129S2-Alox15tm1Fun/J | The Jackson Laboratory | JAX: 002778 |
| Mouse: B6.129S2-Alox5tm1Fun/J | The Jackson Laboratory | JAX: 004155 |
| Mouse: C57BL/6-Tg(CAG-fat-1)1Jxk/J | The Jackson Laboratory | JAX: 020097 |
| Software and algorithms | ||
| GraphPad Prism 7 | GraphPad Software | https://www.graphpad.com/ |
| ImageJ NIH | ImageJ | https://imagej.nih.gov/ij/ |
| Adobe Illustrator CS5 | Adobe Inc. | https://www.adobe.com/products/illustrator.html |
| Code for calculating the lesion volume | Cantuti-Castelvetri et al., 2018 | https://github.com/lenkavaculciakova/lesion_volume |
Resource availability
Lead contact
Further information and requests for resources and reagents should be directed to and will be fulfilled by the Lead Contact, Mikael Simons (mikael.simons@dzne.de).
Materials availability
This study did not generate new unique reagents.
Experimental model and subject details
Mice
Mice experiments were performed according to the German animal welfare law and local regulations for animal experimentation (Regierung von Oberbayern). The animals (male and female) were housed in 12h light/dark cycles at the animal facility of German Center for Neurodegenerative Diseases (DZNE), Munich.
C57BL/6J mice were purchased from Jackson and Janvier Laboratories and used for stereotactic injections at an age of 6-8 weeks, if not stated otherwise. Old C57BL/6J mice were 12 months of age at the time of injection. ALOX5−/−, ALOX15−/−, and fat-1 transgenic mice were purchased from Jackson Laboratory and 7-14 weeks old at time of injection.
Littermates of the same sex and age were randomly assigned to experimental groups. In three experiments the diet was changed or supplemented: 1) C57BL/6J mice received standard chow diet (control) or additional oral treatment with pharmacological inhibitors (aspirin, baicalein). 2) C57BL/6J and fat-1 transgenic mice were on diets with different PUFA composition (beef tallow, safflower oil, fish oil). 3) C57BL/6J received daily i.p. injections of DHA-LPC or DHA.
Method details
Stereotactic lysolecithin injections
Animals were anesthetized by intraperitoneal (i.p.) injection of medetomidine/ midazolam/ fentanyl (0.5/ 5.0/ 0.05 mg/kg body weight), their head fur was cut, an incision was made, and the scull positioned into a stereotactic injection apparatus. Trepanation holes were drilled at the injection coordinates (from bregma) and 1 μL of 1% lysolecithin (Sigma-Aldrich, L4129) with a trace of Monastral blue (Sigma-Aldrich, 274011-50G) was injected at a rate of 100-200 nl/minute. One-two minutes after the lysolecithin injection, the capillary was slowly retracted. The skin was sutured, and sedation antagonized by subcutaneous (s.c.) injection of atipamezole/ flumazenil/ naloxone (2.5/ 0.5/ 1.2 mg/kg body weight). Buprenorphine (0.5 mg/kg body weight) was administered s.c. for analgesia. The animals’ welfare was monitored alertly after surgery.
Different coordinates (all from bregma) were used for injecting the corpus callosum depending on further analysis: For subsequent immunohistochemical analysis bilateral injections were made at X = ±0.1 mm (lateral), Y = −1.0 mm (posterior) and Z = −1.4 mm (ventral). For lipidomics analysis of lipid mediators a second bilateral lesion was set at X = ± 0.58 mm, Y = −1.22 mm and Z = −1.44. To obtain complete demyelination of the corpus callosum for proteomics and lipidomics analysis a third bilateral injection was added at X = ± 1.0 mm, Y = 1.1 mm and Z = −2.3 mm.
Diets and supplements
In three experiments the diet was modified: 1) For pharmacological treatment aspirin and baicalein were added to standard rodent chow. Aspirin was dissolved in water at a concentration of 0.857 mg/ml water. Assuming a daily water intake of 3.5 ml/d, the target concentration was set at 100 mg aspirin/ kg BW. Baicalein was grinded and mixed with the standard chow at a concentration of 1.8 mg/g. Assuming a daily food intake of 5 mg/d, the target concentration was set at 300 mg/kg BW. Animals were treated with aspirin and baicalein for 14 days after lysolecithin injection. In all groups, the food intake was ad libidum and the standard chow diet powdered.
2) Diets with different sources of fatty acids (beef tallow, safflower oil, fish oil, see Table S3 for composition) were purchased from sniff, Germany and sterilized by radiation, and only altered from standard rodent chow in the source of fatty acids. Pregnant mice were fed from conception until weaning, their descendants were kept on diets until injection. Transgenic fat-1 mouse and the control group were four weeks on safflower diet before injection.
3) DHA-LPC (25 mg/ml, 1-Docosahexaenoyl-2-hydroxy-sn-glycero-3-phosphocholine, 790713, Avanti Polar Lipids, USA) was prepared by evaporating its solvent chloroform under nitrogen stream and subsequent solubilization in 1ml of EtOH. DHA-LPC and DHA (Cay90310, Biomol GmbH) were dissolved in corn oil and stored at −80°C. The supplement was warmed to room temperature, mixed, and daily injected intraperitoneally (150 μl/animal, equivalent to 1.77 μmol of DHA-LPC or DHA) for 14 days into 12-month-old mice before intracranial lysolecithin injections were performed. I.p. injections were continued daily until mice were sacrificed for further analysis.
Proteomics and lipidomics
For dissection of fresh corpus callosum, C57BL/6J mice were i.p. anesthetized with 10% ketamine/ 2% xylazine and transcardially perfused with cold PBS using a peristaltic pump (Peri-Star PRO, World Precision Instruments). For lipidomics analysis of lipid mediators the animals were directly decapitated, their brains isolated and the hemispheres positioned on a sample holder coated with 15% gelatin in PBS. With a vibratome 250 μm thick sections were cut at a speed of 1 mm/s, the lesioned or healthy corpus callosum was dissected from connected tissue under a stereoscope, the samples were immediately frozen on dry ice with all lesioned tissue pooled per brain and stored at −80° until shipment and/or further analysis. To avoid degradation of the fresh tissue the hemispheres were kept in cool PBS and the described steps were performed quickly.
Proteomics
Corpus callosum dissections of C57BL/6J mice were lysed in 300 μL STET lysis buffer (1% (v/v) Triton X-100, 150 mM NaCl, 2 mM EDTA, 50 mM Tris-HCl pH 7.5) with a Precellys Evolution homogenizer (Bertin, Germany) using 0.5 mL soft tissue homogenization kit CK14 applying two cycles of 30 s with a speed of 6500rpm. After 15 min incubation on ice, samples were centrifuged at 16,000 × g for 15 min to remove undissolved material and cell debris. The supernatant was transferred to a fresh protein lobind tube (Eppendorf, Germany). The protein concentration of the lysates was estimated using the Pierce 660 nm assay (ThermoFisher Scientific, US). A protein amount of 20 μg per sample was subjected to tryptic digestion. First, 100 mM MgCl2 was added to a final concentration of 10 mM and DNA was digested with 25 units Benzonase (Sigma Aldrich, US) for 30 min at 37°C. Proteins were reduced at 37°C for 30 min with 15 mM dithiothreitol (DTT) followed by cysteine alkylation with 60 mM iodoacetamide (IAA) for 30 min at 20°C. Excess of IAA was removed by adding DTT. Detergent removal and subsequent digestion with 0.25 μg LysC and 0.25 μg trypsin (Promega, Germany) was performed using the single-pot, solid-phase-enhanced sample preparation as previously described (Hughes et al., 2019).
Proteolytic peptides were dried by vacuum centrifugation and dissolved in 20 μl 0.1% (v/v) formic acid. 350 ng of peptides were separated on a nanoElute nanoHPLC system (Bruker, Germany) using a 5 mm trapping column (Thermo Scientific, US) and an in-house packed C18 analytical column (30 cm × 75 μm ID, ReproSil-Pur 120 C18-AQ, 1.9 μm, Dr. Maisch GmbH). Peptides were separated with a binary gradient of water and acetonitrile (B) containing 0.1% formic acid at flow rate of 300 nL/min (0 min, 2% B; 5 min, 5% B; 92 min, 24% B; 112 min, 35% B; 121 min, 60% B) and a column temperature of 50°C.
The nanoHPLC was online coupled to a TimsTOF pro mass spectrometer (Bruker, Germany) with a CaptiveSpray ion source (Bruker, Germany). A standard Data Dependent Acquisition Parallel Accumulation–Serial Fragmentation (DDA-PASEF) method with a cycle time of 1.1 s was used for spectrum acquisition (Meier et al., 2018). Briefly, ion accumulation and separation using Trapped Ion Mobility Spectrometry (TIMS) was set to a ramp time of 100 ms. One scan cycle included one TIMS full MS scan and 10 PASEF peptide fragmentation scans. The m/z scan range was set to 100-1700 for both, MS and MS/MS scans.
Lipid extraction for mass spectrometry lipidomics
One μL of homogenized and diluted brain tissue of C57BL/6J mice was analyzed using Shotgun lipidomics platform by Lipotype GmbH (Dresden, Germany), as described previously (Sampaio et al., 2011; Surma et al., 2015). Lipids were extracted using a two-step chloroform/methanol procedure (Ejsing et al., 2009). Samples were spiked with internal lipid standard mixture containing: cardiolipin 14:0/14:0/14:0/14:0 (CL), ceramide 18:1;2/17:0 (Cer), diacylglycerol 17:0/17:0 (DAG), hexosylceramide 18:1;2/12:0 (HexCer), lyso-phosphatidate 17:0 (LPA), lyso-phosphatidylcholine 12:0 (LPC), lyso-phosphatidylethanolamine 17:1 (LPE), lyso-phosphatidylglycerol 17:1 (LPG), lyso-phosphatidylinositol 17:1 (LPI), lyso-phosphatidylserine 17:1 (LPS), phosphatidate 17:0/17:0 (PA), phosphatidylcholine 17:0/17:0 (PC), phosphatidylethanolamine 17:0/17:0 (PE), phosphatidylglycerol 17:0/17:0 (PG), phosphatidylinositol 16:0/16:0 (PI), phosphatidylserine 17:0/17:0 (PS), cholesterol ester 20:0 (CE), sphingomyelin 18:1;2/12:0;0 (SM), sulfatide d18:1;2/12:0;0 (Sulf), triacylglycerol 17:0/17:0/17:0 (TAG) and cholesterol D6 (Chol). After extraction, the organic phase was transferred to an infusion plate and dried in a speed vacuum concentrator. 1st step dry extract was re-suspended in 7.5 mM ammonium acetate in chloroform/methanol/propanol (1:2:4, V:V:V) and 2nd step dry extract in 33% ethanol solution of methylamine in chloroform/methanol (0.003:5:1; V:V:V). All liquid handling steps were performed using Hamilton Robotics STARlet robotic platform with the Anti Droplet Control feature for organic solvents pipetting.
Samples were analyzed by direct infusion on a QExactive mass spectrometer (Thermo Scientific) equipped with a TriVersa NanoMate ion source (Advion Biosciences). Samples were analyzed in both positive and negative ion modes with a resolution of Rm/z = 200 = 280000 for MS and Rm/z = 200 = 17500 for MSMS experiments, in a single acquisition. MSMS was triggered by an inclusion list encompassing corresponding MS mass ranges scanned in 1 Da increments (Surma et al., 2015). Both MS and MSMS data were combined to monitor CE, DAG and TAG ions as ammonium adducts; PC, PC O-, as acetate adducts; and CL, PA, PE, PE O-, PG, PI and PS as deprotonated anions. MS only was used to monitor LPA, LPE, LPE O-, LPI and LPS as deprotonated anions; Cer, HexCer, SM, LPC and LPC O- as acetate adducts and cholesterol as ammonium adduct of an acetylated derivative (Liebisch et al., 2006).
UPLC-MS-MS analysis of PUFAs and lipid mediators
The samples of C57BL/6J mice were homogenized in 1 mL ice-cold methanol (Fisher Chemical, Schwerte, Germany; 10653963) containing 10 μL of deuterium-labeled lipid mediator standard as internal reference to facilitate quantification and sample recovery. Deuterated standards include 200 nM d8-5S-hydroxyeicosatetraenoic acid (HETE) (Cayman Chemical, Ann Arbor, MI, USA; 334230), d4-leukotriene B4 (Cayman Chemical; 320110), d5-lipoxin A4 (Cayman Chemical; 24936), d5-resolvin D2 (Cayman Chemical; 11184), d4-prostaglandin E2 (Cayman Chemical; 10007273) and 10 μM d8-arachidonic acid (Cayman Chemical; 390010). In brief, samples were kept at −20°C for 60 min to allow protein precipitation. After centrifugation (1200 g, 4°C, 10 min) 8 mL acidified H2O was added (final pH = 3.5) and samples were subjected to solid-phase extraction. Solid-phase cartridges (Sep-Pak Vac 6cc 500 mg/ 6 mL C18; Waters, Milford, MA) were equilibrated with 6 mL methanol and 2 mL H2O before samples were loaded onto columns. After washing with 6 mL H2O and additional 6 mL n-hexane, lipid mediators were eluted with 6 mL methyl formate. Finally, the samples were brought to dryness using an evaporation system (TurboVap LV, Biotage, Uppsala, Sweden) and resuspended in 150 μL methanol-water (50/50, v/v) for UPLC-MS-MS automated injections. Lipid mediator profiling was analyzed with an Acquity UPLC system (Waters, Milford, MA, USA) and a QTRAP 5500 Mass Spectrometer (ABSciex, Darmstadt, Germany) equipped with a Turbo V Source and electrospray ionization. Lipid mediators were eluted using an ACQUITY UPLC BEH C18 column (1.7 μm, 2.1 × 100 mm; Waters, Eschborn, Germany) at 50°C with a flow rate of 0.3 ml/min and a mobile phase consisting of methanol-water-acetic acid of 42:58:0.01 (v/v/v) that was ramped to 86:14:0.01 (v/v/v) over 12.5 min and then to 98:2:0.01 (v/v/v) for 3 min (Werner et al., 2019). The QTrap 5500 was operated in negative ionization mode using scheduled multiple reaction monitoring (MRM) coupled with information-dependent acquisition. The scheduled MRM window was 60 s, optimized lipid mediator parameters (CE, EP, DP, CXP) were applied and the curtain gas pressure was set to 35 psi. The retention time and at least six diagnostic ions for each lipid mediator were confirmed by means of an external standard (Cayman Chemical/Biomol GmbH (Hamburg, Germany). Additionally, the limit of detection for each targeted lipid mediator was determined (Werner et al., 2019) .
Immunohistochemistry
Animals were i.p. anesthetized with 10% ketamine/2% xylazine and transcardially perfused with freshly prepared and cold PBS and 4% PFA in PBS using a peristaltic pump. The isolated brain was post-fixed in 4% PFA in PBS overnight at 4°C and cryoprotected in 30% sucrose in PBS for three nights at 4°C. Tissue was embedded in Tissue Tek O.C.T. on dry ice and kept at −80°C until they were cut into coronary sections with a thickness of 16-20 μm using a cryostat (CryoStar NX70, Thermo Scientific). Sections were distributed in a serial manner on Super Frost slides, air-dried and kept at −20°C.
All steps of the immunohistochemical staining were performed with 1xPBS at room temperature unless stated otherwise. Slides were warmed at 37°C for 10 min and washed three times for 10 min in PBS (in the following: 3x10’). For the IHC of cytoplasmatic antigens, the tissue was permeabilized with 0.3% Triton X-100 in PBS for 10 min, washed 3x10’ and circled with a hydrophobic marker. Slides were incubated with blocking solution (2.5% bovine serum albumin, 2.5% fish gelatin and 2.5% fetal calf serum in PBS) for one hour or additionally together with Fab fragments (1/100 in BS, 715-007-003, Jackson ImmunoResearch) for two hours if the antibodies used were produced in mice. Following a 3 × 10 min’ wash, slides were incubated with primary antibodies in staining solution (10% blocking solution in PBS) overnight at 4°C in a humified chamber. After a 3 x10 min’ wash, slides were incubated with secondary antibodies in staining solution for two hours and washed 3 × 10 min’. All samples were stained with DAPI (1:1000 in PBS, D1306, Thermo Scientific) for 10 min, some additionally with Fluromyelin (1:300 in PBS, F34651 Invitrogen) for 15 min in total. After a last 3 × 10’ wash slides were once dipped into distilled water, mounted with Mowiol and air-dried overnight before microscopy. Some antibodies (OLIG2, CC1 (=APC)) required heat-induced antigen retrieval in Sodium citrate buffer (10mM sodium citrate, 0.05% Tween 20, ph 6.0) before blocking. Therefore, the citrate buffer was warmed up in a water bath to 80°C, the slides were incubated for 20 min, washed 3 × 10’ and then cooled and air-dried for 30 min. The staining solution was modified to allow better antibody attachment by using 0.1% Triton in 10% BS in PBS. All other steps were performed as stated above.
The following primary antibodies were used: anti-IBA1 rabbit (1:1000, Cat. No. 019-19741, Wako), anti-APC-CC1 mouse (1:100, Cat. No. OP80, Sigma), anti-OLIG2 rabbit (1:250, Cat. No. AB9610, Sigma). Secondary antibodies: Alexa Fluor 488 anti-rabbit (1:500, Cat. No. A11008, Thermofisher Scientific), Alexa Fluor 555 anti-mouse (1:500, Cat. No. A21422, Thermofisher Scientific), Alexa Fluor 647 anti-rabbit (1:1000, Cat. No. A31573, Thermofisher Scientific).
Quantification and statistical analysis
Analysis of proteomics data
Raw data was analyzed using the software package Fragpipe (version 13.0) including MSFragger (version 3.0), Philosopher (version 3.2.9), Crystal-C, and Ionquant for protein label-free quantification (Chang et al., 2020; Kong et al., 2017; Teo et al., 2021; da Veiga Leprevost et al., 2020; Yu et al., 2020). Data was searched against a forward reversed concatenated database of Mus musculus from UniProt supplemented with common contaminants (download date: 2020-09-25, 34316 protein sequences, 50% decoy). Acetylation of protein N-termini, methionine oxidation and pyro-glutamate formation were set as variable modifications. Carbamidomethylation of cysteines was set as fixed modification. Trypsin was defined as protease and one missed cleavage was allowed. Peptide and protein false discovery rates (FDR) were set to 1%. Match between runs was activated with a retention time window of 1 min and an ion mobility window of 1/k0 = 0.05.
Data analysis was performed using the software Perseus (version 1.6.14.0) (Tyanova et al., 2016). The LFQ intensities were log2 transformed and a one-way ANOVA test was applied to evaluate significant differences between the four different groups (day 0, 3, 7, and 14). Afterward, individual group comparisons were performed using the two sided Student’s Ttest. At least 3 quantification values per group were required for relative protein quantification. Additionally, a permutation-based FDR correction (p = 0.05, s0 = 0.1) was used to correct for multiple hypotheses (Tusher et al., 2001).
Time series clustering and GO analysis
To identify protein groups of similar time-dependent abundance profiles, we performed a time-series clustering. All proteins (n = 727) with a p value < 0.05 according to the two-sided Student′s t test and an absolute log2 fold change larger than ± 0.5 in any individual group comparison were selected (each time point was compared separately with all prior time points, e.g., 7 dpi with 3 dpi or 7 dpi with 0 dpi). First, a pairwise distance matrix for the log2 LFQ intensities of the 727 significantly altered proteins was computed using a Euclidean distance metric as implemented in sklearn.metrics.pairwise_distances (https://scikit-learn.org/; scikit-learn version 23.2) (Pedregosa et al., 2011). Next, hierarchical clustering was performed on the distance matrix using the agglomerative clustering algorithm with complete linkage as implemented in sklearn.cluster resulting in 4 clusters. The number of clusters was optimized for a range between 4 and 11 clusters using the silhouette score (Rousseeuw, 1987) as implemented in sklearn.metrics.cluster. Additionally, a principal component analysis was computed for the pairwise distance matrix of the 727 significantly altered proteins, where the associated cluster of each protein is highlighted.
In order to determine the cluster-specific enrichment of brain cell types, we compared proteins of each cluster with proteins identified by an in-depth proteomics analysis of the mouse brain to be enriched in astrocytes, microglia, neurons, or oligodendrocytes (Sharma et al., 2015). The thresholds for protein enrichment were defined as follows: the log2 fold change for only one cell type in comparison to the other three has to be larger than 2 with a p value less than 0.05 calculated by Students t test. The proportion of these cell type-specific enriched proteins is provided for each cluster.
Additionally, an enrichment analysis for each cluster was performed for gene ontology (GO) terms as well as for diseases and pathways from the KEGG database (Kanehisa et al., 2021). We downloaded the official Gene Ontology Annotation (GOA) database (https://www.ebi.ac.uk/GOA/downloads, released 2020.10.09) provided by the European Molecular Biology Laboratory (Huntley et al., 2015). A gene enrichment analysis of GO terms was performed individually for each cluster using the GOATOOLS Python library (Klopfenstein et al., 2018), where the target gene lists consisted of all significantly altered proteins associated with at least one GO term (total n = 725). As background list, all proteins which were quantified in at least three samples per group being associated with at least one GO term were chosen (n = 4593). Calculation of the fold enrichment (i.e., a measure of the magnitude of the enrichment) was implemented in Python as described by the DAVID gene enrichment tool (Huang et al., 2009). We programmatically retrieved data from the KEGG database and mapped KEGG identifiers to their murine UniProt accession number via the REST-API of the BioServices Python package (Cokelaer et al., 2013). A fold enrichment analysis for KEGG pathways and KEGG disease was performed as described for GO terms. For each KEGG pathway, the list of proteins was extended by all proteins of its KEGG reaction modules to complete the protein to pathway associations.
Analysis of PUFAs and lipid mediators data
Quantification was achieved by calibration curves for each lipid mediator. Linear calibration curves were obtained for each lipid mediator and gave R2 values of 0.998 or higher (for fatty acids 0.95 or higher). Additionally, the limit of detection for each targeted LM was determined.
Analysis of lipidomics data
Data were analyzed with R version 4.0.3 (R Core Team, 2020) using tidyverse packages version 1.3.0 (Wickham et al., 2019). We standardized lipid amounts to the total lipid amount (molar fraction [mol%]). Data post-processing and normalization were performed using an in-house developed data management system. Only lipid identifications with a signal-to-noise ratio > 5, and a signal intensity 5-fold higher than in corresponding blank samples were considered for further data analysis.
For principal component analysis (PCA) we calculated the sum of all lipid (sub-)species within a lipid class within the following lipid classes: CE, CL, DAG, LPA, LPC, LPC O-, LPE, LPE O-, LPG, LPI, LPS, PA, PC, PC O-, PE, PE O-, PG, PI, PS, TAG. Missing values were imputed with the caret::preProcess() function using the median impute method (Kuhn, 2008). The PCA was calculated with the pcaMethods::pca() function (Stacklies et al., 2007) using singular value decomposition and all values were centered and scaled to unit variance.
Lipid species and subspecies are annotated according to their molecular composition as described previously and lipid identifiers are provided (Aimo et al., 2015) (Table S3).
Microscopy and imaging
All images were acquired using confocal microscopy either with a Leica SP5 confocal (20 × 0.75 NA air) or the Zeiss LSM 900 (20 × 0.8 NA air), except for CC1 OLIG2 stained sections in the DHA-LPC experiment, which were acquired using an epifluorescence microscope (DMI6000B, Leica Microsystems). Cholesterol crystals were detected by measuring the intensity of reflected light using the confocal microscope.
Image analysis
To calculate the demyelination and IBA1+ volume, the free-hand tool from the ImageJ NIH software was used to measure the demyelinated area shown by negative Fluoromyelin staining respectively the area of clustered IBA1+ cells in consecutive sections. Using the known distances between the sections, the lesion volume could be calculated according to the truncated cone model using IPython 2.7 in an automated manner (Cantuti-Castelvetri et al., 2018). The code can be found here: https://github.com/lenkavaculciakova/lesion_volume. Cell counting of CC1+ and OLIG2+ cells was performed manually using the Cell Counter plug-in in Fiji. IBA1+ cell density was counted semi-automated using Fiji and CellProfiler. In brief, the IBA1-channel of each image was thresholded manually and simultaneously for all groups of every experiment to obtain equal thresholds as assessed by inactivated cortical microglia distant from injection sides. DAPI channel was thresholded automatically and images were imported to CellProfiler for automated cell-counting using a self-build pipeline applied to all images.
Statistical analysis
Statistics were performed using GraphPad Prism7 (GraphPad Software.) or R and are specified in each figure legend. N corresponds in histological analysis to the number of analyzed lesions (i.e., 1-2 per animal) and in -omics analysis to the number of brains. All data were tested for normality. Two-tailed Student’s t test, one-way ANOVA with Dunnett’s multiple comparisons test, Kruskal-Wallis test with Dunn’s multiple comparisons test and two-way ANOVA with Sidak’s multiple comparisons test were used as appropriate to each experiment. A p value of < 0.05 was considered significant, the level of significance is indicated as follows: ∗ = p < 0.05, ∗∗ = p < 0.01, ∗∗∗ = p < 0.001, and ∗∗∗∗ = p < 0.0001; n.s. indicates no significance. All data are presented as mean ± SD, unless stated otherwise in the figure legends.
Acknowledgments
We thank Dr. Frits Kamp for his help with DHA-LPC preparation and Anna Berghofer for excellent technical assistance. The work was supported by grants from the German Research Foundation (ID 408885537- TRR 274, TRR128, SyNergy Excellence Cluster [EXC 2145, Projekt ID390857198], SFB 1278/1 PolyTarget-316213987 [to O.W.], and SFB 1127/2 ChemBioSys-239748522 [O.W.]), the Human Frontier Science Program (HFSP), the ERC (Consolidator Grant to M.S.), the Else Kröner Fresenius Foundation, and the BMBF through the projects CLINSPECT-M and JPND PMG-AD.
Author contributions
H.P. and M.S. conceived the project and designed experiments. H.P., V.T., A.B., S.B., S.A.M., P.M.J., L.C.-C., and M.B.-Q. carried out experiments. H.P., A.B., V.T., S.B., S.A.M., P.M.J., M.J.G., C.K., L.C.-C., M.B.-Q, I.L., S.F.L., O.W., and M.S. analyzed the data or supervised data acquisition. H.P., A.B., S.B., S.A.M., P.M.J., and M.J.G. visualized the data. H.P. and M.S. wrote the manuscript.
Declaration of interests
C.K. is a shareholder of Lipotype GmbH. M.J.G. is an employee of Lipotype GmbH. The authors declare no competing interests.
Published: October 26, 2021
Footnotes
Supplemental information can be found online at https://doi.org/10.1016/j.celrep.2021.109898.
Contributor Information
Horst Penkert, Email: h.penkert@tum.de.
Mikael Simons, Email: mikael.simons@dzne.de.
Supplemental information
Data and code availability
-
•
Proteomic and lipidomic data have been deposited to the ProteomeXchange Consortium via the PRIDE (Perez-Riverol et al., 2019) partner repository with the dataset identifier PRIDE: PXD024891 (see also Tables S1 and S2, respectively).
-
•
The code used for calculating lesion volumes is publicly available under the following https://doi.org/10.5281/zenodo.5536991; https://zenodo.org/record/5536991.
-
•
Any other data or information to analyze the data reported are available from the corresponding author upon reasonable request.
References
- Ackermann J.A., Hofheinz K., Zaiss M.M., Krönke G. The double-edged role of 12/15-lipoxygenase during inflammation and immunity. Biochim. Biophys. Acta Mol. Cell Biol. Lipids. 2017;1862:371–381. doi: 10.1016/j.bbalip.2016.07.014. [DOI] [PubMed] [Google Scholar]
- Adkins Y., Soulika A.M., Mackey B., Kelley D.S. Docosahexaenoic acid (22:6n-3) Ameliorated the Onset and Severity of Experimental Autoimmune Encephalomyelitis in Mice. Lipids. 2019;54:13–23. doi: 10.1002/lipd.12130. [DOI] [PubMed] [Google Scholar]
- Aimo L., Liechti R., Hyka-Nouspikel N., Niknejad A., Gleizes A., Götz L., Kuznetsov D., David F.P.A., van der Goot F.G., Riezman H. The SwissLipids knowledgebase for lipid biology. Bioinformatics. 2015;31:2860–2866. doi: 10.1093/bioinformatics/btv285. [DOI] [PMC free article] [PubMed] [Google Scholar]
- AlAmmar W.A., Albeesh F.H., Ibrahim L.M., Algindan Y.Y., Yamani L.Z., Khattab R.Y. Effect of omega-3 fatty acids and fish oil supplementation on multiple sclerosis: a systematic review. Nutr. Neurosci. 2021;24:569–579. doi: 10.1080/1028415X.2019.1659560. [DOI] [PubMed] [Google Scholar]
- Basil M.C., Levy B.D. Specialized pro-resolving mediators: endogenous regulators of infection and inflammation. Nat. Rev. Immunol. 2016;16:51–67. doi: 10.1038/nri.2015.4. [DOI] [PMC free article] [PubMed] [Google Scholar]
- Berghoff S.A., Spieth L., Sun T., Hosang L., Schlaphoff L., Depp C., Düking T., Winchenbach J., Neuber J., Ewers D. Microglia facilitate repair of demyelinated lesions via post-squalene sterol synthesis. Nat. Neurosci. 2021;24:47–60. doi: 10.1038/s41593-020-00757-6. [DOI] [PMC free article] [PubMed] [Google Scholar]
- Blakemore W.F., Franklin R.J.M. Remyelination in experimental models of toxin-induced demyelination. Curr. Top. Microbiol. Immunol. 2008;318:193–212. doi: 10.1007/978-3-540-73677-6_8. [DOI] [PubMed] [Google Scholar]
- Bogie J.F.J., Grajchen E., Wouters E., Corrales A.G., Dierckx T., Vanherle S., Mailleux J., Gervois P., Wolfs E., Dehairs J. Stearoyl-CoA desaturase-1 impairs the reparative properties of macrophages and microglia in the brain. J. Exp. Med. 2020;217:e20191660. doi: 10.1084/jem.20191660. [DOI] [PMC free article] [PubMed] [Google Scholar]
- Bogie J.F.J., Haidar M., Kooij G., Hendriks J.J.A. Fatty acid metabolism in the progression and resolution of CNS disorders. Adv. Drug Deliv. Rev. 2020;159:198–213. doi: 10.1016/j.addr.2020.01.004. [DOI] [PubMed] [Google Scholar]
- Bosch-Queralt M., Cantuti-Castelvetri L., Damkou A., Schifferer M., Schlepckow K., Alexopoulos I., Lütjohann D., Klose C., Vaculčiaková L., Masuda T. Diet-dependent regulation of TGFβ impairs reparative innate immune responses after demyelination. Nat. Metab. 2021;3:211–227. doi: 10.1038/s42255-021-00341-7. [DOI] [PMC free article] [PubMed] [Google Scholar]
- Buckley C.D., Gilroy D.W., Serhan C.N. Proresolving lipid mediators and mechanisms in the resolution of acute inflammation. Immunity. 2014;40:315–327. doi: 10.1016/j.immuni.2014.02.009. [DOI] [PMC free article] [PubMed] [Google Scholar]
- Camargo N., Goudriaan A., van Deijk A.F., Otte W.M., Brouwers J.F., Lodder H., Gutmann D.H., Nave K.-A., Dijkhuizen R.M., Mansvelder H.D. Oligodendroglial myelination requires astrocyte-derived lipids. PLoS Biol. 2017;15:e1002605. doi: 10.1371/journal.pbio.1002605. [DOI] [PMC free article] [PubMed] [Google Scholar]
- Cantuti-Castelvetri L., Fitzner D., Bosch-Queralt M., Weil M.-T., Su M., Sen P., Ruhwedel T., Mitkovski M., Trendelenburg G., Lütjohann D. Defective cholesterol clearance limits remyelination in the aged central nervous system. Science. 2018;359:684–688. doi: 10.1126/science.aan4183. [DOI] [PubMed] [Google Scholar]
- Chang H.-Y., Kong A.T., da Veiga Leprevost F., Avtonomov D.M., Haynes S.E., Nesvizhskii A.I. Crystal-C: A Computational Tool for Refinement of Open Search Results. J. Proteome Res. 2020;19:2511–2515. doi: 10.1021/acs.jproteome.0c00119. [DOI] [PMC free article] [PubMed] [Google Scholar]
- Chen J., Zuo S., Wang J., Huang J., Zhang X., Liu Y., Zhang Y., Zhao J., Han J., Xiong L. Aspirin promotes oligodendrocyte precursor cell proliferation and differentiation after white matter lesion. Front. Aging Neurosci. 2014;6:7. doi: 10.3389/fnagi.2014.00007. [DOI] [PMC free article] [PubMed] [Google Scholar]
- Chen S., Zhang H., Pu H., Wang G., Li W., Leak R.K., Chen J., Liou A.K., Hu X. n-3 PUFA supplementation benefits microglial responses to myelin pathology. Sci. Rep. 2014;4:7458. doi: 10.1038/srep07458. [DOI] [PMC free article] [PubMed] [Google Scholar]
- Chiurchiù V., Leuti A., Maccarrone M. Bioactive Lipids and Chronic Inflammation: Managing the Fire Within. Front. Immunol. 2018;9:38. doi: 10.3389/fimmu.2018.00038. [DOI] [PMC free article] [PubMed] [Google Scholar]
- Cokelaer T., Pultz D., Harder L.M., Serra-Musach J., Saez-Rodriguez J. BioServices: a common Python package to access biological Web Services programmatically. Bioinformatics. 2013;29:3241–3242. doi: 10.1093/bioinformatics/btt547. [DOI] [PMC free article] [PubMed] [Google Scholar]
- Cunha M.I., Su M., Cantuti-Castelvetri L., Müller S.A., Schifferer M., Djannatian M., Alexopoulos I., van der Meer F., Winkler A., van Ham T.J. Pro-inflammatory activation following demyelination is required for myelin clearance and oligodendrogenesis. J. Exp. Med. 2020;217:e20191390. doi: 10.1084/jem.20191390. [DOI] [PMC free article] [PubMed] [Google Scholar]
- da Veiga Leprevost F., Haynes S.E., Avtonomov D.M., Chang H.-Y., Shanmugam A.K., Mellacheruvu D., Kong A.T., Nesvizhskii A.I. Philosopher: a versatile toolkit for shotgun proteomics data analysis. Nat. Methods. 2020;17:869–870. doi: 10.1038/s41592-020-0912-y. [DOI] [PMC free article] [PubMed] [Google Scholar]
- Dennis E.A., Norris P.C. Eicosanoid storm in infection and inflammation. Nat. Rev. Immunol. 2015;15:511–523. doi: 10.1038/nri3859. [DOI] [PMC free article] [PubMed] [Google Scholar]
- Domingues H.S., Portugal C.C., Socodato R., Relvas J.B. Oligodendrocyte, Astrocyte, and Microglia Crosstalk in Myelin Development, Damage, and Repair. Front. Cell Dev. Biol. 2016;4:71. doi: 10.3389/fcell.2016.00071. [DOI] [PMC free article] [PubMed] [Google Scholar]
- Dong Y., D’Mello C., Pinsky W., Lozinski B.M., Kaushik D.K., Ghorbani S., Moezzi D., Brown D., Melo F.C., Zandee S. Oxidized phosphatidylcholines found in multiple sclerosis lesions mediate neurodegeneration and are neutralized by microglia. Nat. Neurosci. 2021;24:489–503. doi: 10.1038/s41593-021-00801-z. [DOI] [PubMed] [Google Scholar]
- Ejsing C.S., Sampaio J.L., Surendranath V., Duchoslav E., Ekroos K., Klemm R.W., Simons K., Shevchenko A. Global analysis of the yeast lipidome by quantitative shotgun mass spectrometry. Proc. Natl. Acad. Sci. USA. 2009;106:2136–2141. doi: 10.1073/pnas.0811700106. [DOI] [PMC free article] [PubMed] [Google Scholar]
- Fitzner D., Bader J.M., Penkert H., Bergner C.G., Su M., Weil M.-T., Surma M.A., Mann M., Klose C., Simons M. Cell-Type- and Brain-Region-Resolved Mouse Brain Lipidome. Cell Rep. 2020;32:108132. doi: 10.1016/j.celrep.2020.108132. [DOI] [PubMed] [Google Scholar]
- Franklin R.J.M., Ffrench-Constant C. Remyelination in the CNS: from biology to therapy. Nat. Rev. Neurosci. 2008;9:839–855. doi: 10.1038/nrn2480. [DOI] [PubMed] [Google Scholar]
- Franklin R.J.M., Ffrench-Constant C. Regenerating CNS myelin - from mechanisms to experimental medicines. Nat. Rev. Neurosci. 2017;18:753–769. doi: 10.1038/nrn.2017.136. [DOI] [PubMed] [Google Scholar]
- Franklin R.J.M., Ffrench-Constant C., Edgar J.M., Smith K.J. Neuroprotection and repair in multiple sclerosis. Nat. Rev. Neurol. 2012;8:624–634. doi: 10.1038/nrneurol.2012.200. [DOI] [PubMed] [Google Scholar]
- Glukhova A., Hinkovska-Galcheva V., Kelly R., Abe A., Shayman J.A., Tesmer J.J.G. Structure and function of lysosomal phospholipase A2 and lecithin:cholesterol acyltransferase. Nat. Commun. 2015;6:6250. doi: 10.1038/ncomms7250. [DOI] [PMC free article] [PubMed] [Google Scholar]
- Gouna G., Klose C., Bosch-Queralt M., Liu L., Gokce O., Schifferer M., Cantuti-Castelvetri L., Simons M. TREM2-dependent lipid droplet biogenesis in phagocytes is required for remyelination. J. Exp. Med. 2021;218:e20210227. doi: 10.1084/jem.20210227. [DOI] [PMC free article] [PubMed] [Google Scholar]
- Haeggström J.Z., Funk C.D. Lipoxygenase and leukotriene pathways: biochemistry, biology, and roles in disease. Chem. Rev. 2011;111:5866–5898. doi: 10.1021/cr200246d. [DOI] [PubMed] [Google Scholar]
- Haghikia A., Jörg S., Duscha A., Berg J., Manzel A., Waschbisch A., Hammer A., Lee D.-H., May C., Wilck N. Dietary Fatty Acids Directly Impact Central Nervous System Autoimmunity via the Small Intestine. Immunity. 2015;43:817–829. doi: 10.1016/j.immuni.2015.09.007. [DOI] [PubMed] [Google Scholar]
- Hiraoka M., Abe A., Shayman J.A. Cloning and characterization of a lysosomal phospholipase A2, 1-O-acylceramide synthase. J. Biol. Chem. 2002;277:10090–10099. doi: 10.1074/jbc.M111977200. [DOI] [PubMed] [Google Scholar]
- Huang J.K., Jarjour A.A., Nait Oumesmar B., Kerninon C., Williams A., Krezel W., Kagechika H., Bauer J., Zhao C., Baron-Van Evercooren A. Retinoid X receptor gamma signaling accelerates CNS remyelination. Nat. Neurosci. 2011;14:45–53. doi: 10.1038/nn.2702. [DOI] [PMC free article] [PubMed] [Google Scholar]
- Huang W., Sherman B.T., Lempicki R.A. Systematic and integrative analysis of large gene lists using DAVID bioinformatics resources. Nat. Protoc. 2009;4:44–57. doi: 10.1038/nprot.2008.211. [DOI] [PubMed] [Google Scholar]
- Hughes C.S., Moggridge S., Müller T., Sorensen P.H., Morin G.B., Krijgsveld J. Single-pot, solid-phase-enhanced sample preparation for proteomics experiments. Nat. Protoc. 2019;14:68–85. doi: 10.1038/s41596-018-0082-x. [DOI] [PubMed] [Google Scholar]
- Huntley R.P., Sawford T., Mutowo-Meullenet P., Shypitsyna A., Bonilla C., Martin M.J., O’Donovan C. The GOA database: gene Ontology annotation updates for 2015. Nucleic Acids Res. 2015;43:D1057–D1063. doi: 10.1093/nar/gku1113. [DOI] [PMC free article] [PubMed] [Google Scholar]
- Jordan P.M., Gerstmeier J., Pace S., Bilancia R., Rao Z., Börner F., Miek L., Gutiérrez-Gutiérrez Ó., Arakandy V., Rossi A. Staphylococcus aureus-Derived α-Hemolysin Evokes Generation of Specialized Pro-resolving Mediators Promoting Inflammation Resolution. Cell Rep. 2020;33:108247. doi: 10.1016/j.celrep.2020.108247. [DOI] [PMC free article] [PubMed] [Google Scholar]
- Kanehisa M., Furumichi M., Sato Y., Ishiguro-Watanabe M., Tanabe M. KEGG: integrating viruses and cellular organisms. Nucleic Acids Res. 2021;49:D545–D551. doi: 10.1093/nar/gkaa970. [DOI] [PMC free article] [PubMed] [Google Scholar]
- Kang J.X., Wang J., Wu L., Kang Z.B. Transgenic mice: fat-1 mice convert n-6 to n-3 fatty acids. Nature. 2004;427:504. doi: 10.1038/427504a. [DOI] [PubMed] [Google Scholar]
- Klopfenstein D.V., Zhang L., Pedersen B.S., Ramírez F., Warwick Vesztrocy A., Naldi A., Mungall C.J., Yunes J.M., Botvinnik O., Weigel M. GOATOOLS: A Python library for Gene Ontology analyses. Sci. Rep. 2018;8:10872. doi: 10.1038/s41598-018-28948-z. [DOI] [PMC free article] [PubMed] [Google Scholar]
- Kong A.T., Leprevost F.V., Avtonomov D.M., Mellacheruvu D., Nesvizhskii A.I. MSFragger: ultrafast and comprehensive peptide identification in mass spectrometry-based proteomics. Nat. Methods. 2017;14:513–520. doi: 10.1038/nmeth.4256. [DOI] [PMC free article] [PubMed] [Google Scholar]
- Kooij G., Troletti C.D., Leuti A., Norris P.C., Riley I., Albanese M., Ruggieri S., Libreros S., van der Pol S.M.A., van Het Hof B. Specialized pro-resolving lipid mediators are differentially altered in peripheral blood of patients with multiple sclerosis and attenuate monocyte and blood-brain barrier dysfunction. Haematologica. 2020;105:2056–2070. doi: 10.3324/haematol.2019.219519. [DOI] [PMC free article] [PubMed] [Google Scholar]
- Kotter M.R., Zhao C., van Rooijen N., Franklin R.J.M. Macrophage-depletion induced impairment of experimental CNS remyelination is associated with a reduced oligodendrocyte progenitor cell response and altered growth factor expression. Neurobiol. Dis. 2005;18:166–175. doi: 10.1016/j.nbd.2004.09.019. [DOI] [PubMed] [Google Scholar]
- Kotter M.R., Li W.-W., Zhao C., Franklin R.J.M. Myelin impairs CNS remyelination by inhibiting oligodendrocyte precursor cell differentiation. J. Neurosci. 2006;26:328–332. doi: 10.1523/JNEUROSCI.2615-05.2006. [DOI] [PMC free article] [PubMed] [Google Scholar]
- Kuhlmann T., Miron V., Cui Q., Wegner C., Antel J., Brück W. Differentiation block of oligodendroglial progenitor cells as a cause for remyelination failure in chronic multiple sclerosis. Brain. 2008;131:1749–1758. doi: 10.1093/brain/awn096. [DOI] [PubMed] [Google Scholar]
- Kuhn M. Building Predictive Models in R Using the caret Package. J. Stat. Softw. 2008:28. [Google Scholar]
- Kuhn H., Banthiya S., van Leyen K. Mammalian lipoxygenases and their biological relevance. Biochim. Biophys. Acta. 2015;1851:308–330. doi: 10.1016/j.bbalip.2014.10.002. [DOI] [PMC free article] [PubMed] [Google Scholar]
- Lacombe R.J.S., Chouinard-Watkins R., Bazinet R.P. Brain docosahexaenoic acid uptake and metabolism. Mol. Aspects Med. 2018;64:109–134. doi: 10.1016/j.mam.2017.12.004. [DOI] [PubMed] [Google Scholar]
- Lampron A., Larochelle A., Laflamme N., Préfontaine P., Plante M.-M., Sánchez M.G., Yong V.W., Stys P.K., Tremblay M.-È., Rivest S. Inefficient clearance of myelin debris by microglia impairs remyelinating processes. J. Exp. Med. 2015;212:481–495. doi: 10.1084/jem.20141656. [DOI] [PMC free article] [PubMed] [Google Scholar]
- Layé S., Nadjar A., Joffre C., Bazinet R.P. Anti-Inflammatory Effects of Omega-3 Fatty Acids in the Brain: Physiological Mechanisms and Relevance to Pharmacology. Pharmacol. Rev. 2018;70:12–38. doi: 10.1124/pr.117.014092. [DOI] [PubMed] [Google Scholar]
- Liebisch G., Binder M., Schifferer R., Langmann T., Schulz B., Schmitz G. High throughput quantification of cholesterol and cholesteryl ester by electrospray ionization tandem mass spectrometry (ESI-MS/MS) Biochim. Biophys. Acta. 2006;1761:121–128. doi: 10.1016/j.bbalip.2005.12.007. [DOI] [PubMed] [Google Scholar]
- Lloyd A.F., Miron V.E. The pro-remyelination properties of microglia in the central nervous system. Nat. Rev. Neurol. 2019;15:447–458. doi: 10.1038/s41582-019-0184-2. [DOI] [PubMed] [Google Scholar]
- Lubetzki C., Zalc B., Williams A., Stadelmann C., Stankoff B. Remyelination in multiple sclerosis: from basic science to clinical translation. Lancet Neurol. 2020;19:678–688. doi: 10.1016/S1474-4422(20)30140-X. [DOI] [PubMed] [Google Scholar]
- Madore C., Leyrolle Q., Morel L., Rossitto M., Greenhalgh A.D., Delpech J.C., Martinat M., Bosch-Bouju C., Bourel J., Rani B. Essential omega-3 fatty acids tune microglial phagocytosis of synaptic elements in the mouse developing brain. Nat. Commun. 2020;11:6133. doi: 10.1038/s41467-020-19861-z. [DOI] [PMC free article] [PubMed] [Google Scholar]
- Marusic S., Leach M.W., Pelker J.W., Azoitei M.L., Uozumi N., Cui J., Shen M.W.H., DeClercq C.M., Miyashiro J.S., Carito B.A. Cytosolic phospholipase A2 α-deficient mice are resistant to experimental autoimmune encephalomyelitis. J. Exp. Med. 2005;202:841–851. doi: 10.1084/jem.20050665. [DOI] [PMC free article] [PubMed] [Google Scholar]
- McMurran C.E., Jones C.A., Fitzgerald D.C., Franklin R.J.M. CNS Remyelination and the Innate Immune System. Front. Cell Dev. Biol. 2016;4:38. doi: 10.3389/fcell.2016.00038. [DOI] [PMC free article] [PubMed] [Google Scholar]
- Meffre D., Shackleford G., Hichor M., Gorgievski V., Tzavara E.T., Trousson A., Ghoumari A.M., Deboux C., Nait Oumesmar B., Liere P. Liver X receptors alpha and beta promote myelination and remyelination in the cerebellum. Proc. Natl. Acad. Sci. USA. 2015;112:7587–7592. doi: 10.1073/pnas.1424951112. [DOI] [PMC free article] [PubMed] [Google Scholar]
- Meier F., Brunner A.-D., Koch S., Koch H., Lubeck M., Krause M., Goedecke N., Decker J., Kosinski T., Park M.A. Online Parallel Accumulation-Serial Fragmentation (PASEF) with a Novel Trapped Ion Mobility Mass Spectrometer. Mol. Cell. Proteomics. 2018;17:2534–2545. doi: 10.1074/mcp.TIR118.000900. [DOI] [PMC free article] [PubMed] [Google Scholar]
- Miron V.E., Boyd A., Zhao J.W., Yuen T.J., Ruckh J.M., Shadrach J.L., van Wijngaarden P., Wagers A.J., Williams A., Franklin R.J.M., Ffrench-Constant C. M2 microglia and macrophages drive oligodendrocyte differentiation during CNS remyelination. Nat. Neurosci. 2013;16:1211–1218. doi: 10.1038/nn.3469. [DOI] [PMC free article] [PubMed] [Google Scholar]
- Molina-Gonzalez I., Miron V.E. Astrocytes in myelination and remyelination. Neurosci. Lett. 2019;713:134532. doi: 10.1016/j.neulet.2019.134532. [DOI] [PubMed] [Google Scholar]
- Murphy N.A., Franklin R.J.M. Recruitment of endogenous CNS stem cells for regeneration in demyelinating disease. Prog. Brain Res. 2017;231:135–163. doi: 10.1016/bs.pbr.2016.12.013. [DOI] [PubMed] [Google Scholar]
- Nguyen L.N., Ma D., Shui G., Wong P., Cazenave-Gassiot A., Zhang X., Wenk M.R., Goh E.L.K., Silver D.L. Mfsd2a is a transporter for the essential omega-3 fatty acid docosahexaenoic acid. Nature. 2014;509:503–506. doi: 10.1038/nature13241. [DOI] [PubMed] [Google Scholar]
- Palumbo S., Toscano C.D., Parente L., Weigert R., Bosetti F. Time-dependent changes in the brain arachidonic acid cascade during cuprizone-induced demyelination and remyelination. Prostaglandins Leukot. Essent. Fatty Acids. 2011;85:29–35. doi: 10.1016/j.plefa.2011.04.001. [DOI] [PMC free article] [PubMed] [Google Scholar]
- Patrikios P., Stadelmann C., Kutzelnigg A., Rauschka H., Schmidbauer M., Laursen H., Sorensen P.S., Bru W. Remyelination is extensive in a subset of multiple sclerosis patients. Brain. 2006;129:3165–3172. doi: 10.1093/brain/awl217. [DOI] [PubMed] [Google Scholar]
- Pedregosa F., Varoquaux G., Gramfort A., Michel V., Thirion B., Grisel O., Blondel M., Prettenhofer P., Weiss R., Dubourg V. Scikit-learn: Machine learning in Python. J. Mach. Learn. Res. 2011;12:2825–2830. [Google Scholar]
- Perez-Riverol Y., Csordas A., Bai J., Bernal-Llinares M., Hewapathirana S., Kundu D.J., Inuganti A., Griss J., Mayer G., Eisenacher M. The PRIDE database and related tools and resources in 2019: improving support for quantification data. Nucleic Acids Res. 2019;47:D442–D450. doi: 10.1093/nar/gky1106. [DOI] [PMC free article] [PubMed] [Google Scholar]
- Plemel J.R., Liu W.Q., Yong V.W. Remyelination therapies: a new direction and challenge in multiple sclerosis. Nat. Rev. Drug Discov. 2017;16:617–634. doi: 10.1038/nrd.2017.115. [DOI] [PubMed] [Google Scholar]
- Preisner A., Albrecht S., Cui Q.L., Hucke S., Ghelman J., Hartmann C., Taketo M.M., Antel J., Klotz L., Kuhlmann T. Non-steroidal anti-inflammatory drug indometacin enhances endogenous remyelination. Acta Neuropathol. 2015;130:247–261. doi: 10.1007/s00401-015-1426-z. [DOI] [PubMed] [Google Scholar]
- Prüss H., Rosche B., Sullivan A.B., Brommer B., Wengert O., Gronert K., Schwab J.M. Proresolution lipid mediators in multiple sclerosis - differential, disease severity-dependent synthesis - a clinical pilot trial. PLoS ONE. 2013;8:e55859. doi: 10.1371/journal.pone.0055859. [DOI] [PMC free article] [PubMed] [Google Scholar]
- R Core Team . 2020. R: A Language and Environment for Statistical Computing (R Foundation) [Google Scholar]
- Rawji K.S., Gonzalez Martinez G.A., Sharma A., Franklin R.J.M. The Role of Astrocytes in Remyelination. Trends Neurosci. 2020;43:596–607. doi: 10.1016/j.tins.2020.05.006. [DOI] [PubMed] [Google Scholar]
- Rousseeuw P.J. Silhouettes: a graphical aid to the interpretation and validation of cluster analysis. J. Comput. Appl. Math. 1987;20:53–65. [Google Scholar]
- Sampaio J.L., Gerl M.J., Klose C., Ejsing C.S., Beug H., Simons K., Shevchenko A. Membrane lipidome of an epithelial cell line. Proc. Natl. Acad. Sci. USA. 2011;108:1903–1907. doi: 10.1073/pnas.1019267108. [DOI] [PMC free article] [PubMed] [Google Scholar]
- Serhan C.N. Pro-resolving lipid mediators are leads for resolution physiology. Nature. 2014;510:92–101. doi: 10.1038/nature13479. [DOI] [PMC free article] [PubMed] [Google Scholar]
- Serhan C.N., Petasis N.A. Resolvins and protectins in inflammation resolution. Chem. Rev. 2011;111:5922–5943. doi: 10.1021/cr100396c. [DOI] [PMC free article] [PubMed] [Google Scholar]
- Serhan C.N., Dalli J., Colas R.A., Winkler J.W., Chiang N. Protectins and maresins: New pro-resolving families of mediators in acute inflammation and resolution bioactive metabolome. Biochim. Biophys. Acta. 2015;1851:397–413. doi: 10.1016/j.bbalip.2014.08.006. [DOI] [PMC free article] [PubMed] [Google Scholar]
- Sharma K., Schmitt S., Bergner C.G., Tyanova S., Kannaiyan N., Manrique-Hoyos N., Kongi K., Cantuti L., Hanisch U.-K., Philips M.-A. Cell type- and brain region-resolved mouse brain proteome. Nat. Neurosci. 2015;18:1819–1831. doi: 10.1038/nn.4160. [DOI] [PMC free article] [PubMed] [Google Scholar]
- Shen K., Reichelt M., Kyauk R.V., Ngu H., Shen Y.-A.A., Foreman O., Modrusan Z., Friedman B.A., Sheng M., Yuen T.J. Multiple sclerosis risk gene Mertk is required for microglial activation and subsequent remyelination. Cell Rep. 2021;34:108835. doi: 10.1016/j.celrep.2021.108835. [DOI] [PubMed] [Google Scholar]
- Siegert E., Paul F., Rothe M., Weylandt K.H. The effect of omega-3 fatty acids on central nervous system remyelination in fat-1 mice. BMC Neurosci. 2017;18:19. doi: 10.1186/s12868-016-0312-5. [DOI] [PMC free article] [PubMed] [Google Scholar]
- Stacklies W., Redestig H., Scholz M., Walther D., Selbig J. pcaMethods--a bioconductor package providing PCA methods for incomplete data. Bioinformatics. 2007;23:1164–1167. doi: 10.1093/bioinformatics/btm069. [DOI] [PubMed] [Google Scholar]
- Stangel M., Kuhlmann T., Matthews P.M., Kilpatrick T.J. Achievements and obstacles of remyelinating therapies in multiple sclerosis. Nat. Rev. Neurol. 2017;13:742–754. doi: 10.1038/nrneurol.2017.139. [DOI] [PubMed] [Google Scholar]
- Sugasini D., Thomas R., Yalagala P.C.R., Tai L.M., Subbaiah P.V. Dietary docosahexaenoic acid (DHA) as lysophosphatidylcholine, but not as free acid, enriches brain DHA and improves memory in adult mice. Sci. Rep. 2017;7:11263. doi: 10.1038/s41598-017-11766-0. [DOI] [PMC free article] [PubMed] [Google Scholar]
- Surma M.A., Herzog R., Vasilj A., Klose C., Christinat N., Morin-Rivron D., Simons K., Masoodi M., Sampaio J.L. An automated shotgun lipidomics platform for high throughput, comprehensive, and quantitative analysis of blood plasma intact lipids. Eur. J. Lipid Sci. Technol. 2015;117:1540–1549. doi: 10.1002/ejlt.201500145. [DOI] [PMC free article] [PubMed] [Google Scholar]
- Takahashi C., Muramatsu R., Fujimura H., Mochizuki H., Yamashita T. Prostacyclin promotes oligodendrocyte precursor recruitment and remyelination after spinal cord demyelination. Cell Death Dis. 2013;4:e795–e799. doi: 10.1038/cddis.2013.335. [DOI] [PMC free article] [PubMed] [Google Scholar]
- Teo G.C., Polasky D.A., Yu F., Nesvizhskii A.I. Fast Deisotoping Algorithm and Its Implementation in the MSFragger Search Engine. J. Proteome Res. 2021;20:498–505. doi: 10.1021/acs.jproteome.0c00544. [DOI] [PMC free article] [PubMed] [Google Scholar]
- Torkildsen Ø., Brunborg L.A., Thorsen F., Mørk S.J., Stangel M., Myhr K.M., Bø L. Effects of dietary intervention on MRI activity, de- and remyelination in the cuprizone model for demyelination. Exp. Neurol. 2009;215:160–166. doi: 10.1016/j.expneurol.2008.09.026. [DOI] [PubMed] [Google Scholar]
- Tusher V.G., Tibshirani R., Chu G. Significance analysis of microarrays applied to the ionizing radiation response. Proc. Natl. Acad. Sci. USA. 2001;98:5116–5121. doi: 10.1073/pnas.091062498. [DOI] [PMC free article] [PubMed] [Google Scholar]
- Tyanova S., Temu T., Sinitcyn P., Carlson A., Hein M.Y., Geiger T., Mann M., Cox J. The Perseus computational platform for comprehensive analysis of (prote)omics data. Nat. Methods. 2016;13:731–740. doi: 10.1038/nmeth.3901. [DOI] [PubMed] [Google Scholar]
- Werner M., Jordan P.M., Romp E., Czapka A., Rao Z., Kretzer C., Koeberle A., Garscha U., Pace S., Claesson H.-E. Targeting biosynthetic networks of the proinflammatory and proresolving lipid metabolome. FASEB J. 2019;33:6140–6153. doi: 10.1096/fj.201802509R. [DOI] [PMC free article] [PubMed] [Google Scholar]
- Wickham H., Averick M., Bryan J., Chang W., McGowan L., François R., Grolemund G., Hayes A., Henry L., Hester J. Welcome to the Tidyverse. J. Open Source Softw. 2019;4:1686. [Google Scholar]
- Wong B.H., Silver D.L. Mfsd2a: A Physiologically Important Lysolipid Transporter in the Brain and Eye. Adv. Exp. Med. Biol. 2020;1276:223–234. doi: 10.1007/978-981-15-6082-8_14. [DOI] [PubMed] [Google Scholar]
- Yalagala P.C.R., Sugasini D., Dasarathi S., Pahan K., Subbaiah P.V. Dietary lysophosphatidylcholine-EPA enriches both EPA and DHA in the brain: potential treatment for depression. J. Lipid Res. 2019;60:566–578. doi: 10.1194/jlr.M090464. [DOI] [PMC free article] [PubMed] [Google Scholar]
- Yu F., Haynes S.E., Teo G.C., Avtonomov D.M., Polasky D.A., Nesvizhskii A.I. Fast Quantitative Analysis of timsTOF PASEF Data with MSFragger and IonQuant. Mol. Cell. Proteomics. 2020;19:1575–1585. doi: 10.1074/mcp.TIR120.002048. [DOI] [PMC free article] [PubMed] [Google Scholar]
Associated Data
This section collects any data citations, data availability statements, or supplementary materials included in this article.
Supplementary Materials
Data Availability Statement
-
•
Proteomic and lipidomic data have been deposited to the ProteomeXchange Consortium via the PRIDE (Perez-Riverol et al., 2019) partner repository with the dataset identifier PRIDE: PXD024891 (see also Tables S1 and S2, respectively).
-
•
The code used for calculating lesion volumes is publicly available under the following https://doi.org/10.5281/zenodo.5536991; https://zenodo.org/record/5536991.
-
•
Any other data or information to analyze the data reported are available from the corresponding author upon reasonable request.