


Keywords: cellular energy distribution, mitochondria, mitochondrial networks, mitochondrial reticulum, oxidative phosphorylation
Abstract
The design of the energy metabolism system in striated muscle remains a major area of investigation. Here, we review our current understanding and emerging hypotheses regarding the metabolic support of muscle contraction. Maintenance of ATP free energy, so called energy homeostasis, via mitochondrial oxidative phosphorylation is critical to sustained contractile activity, and this major design criterion is the focus of this review. Cell volume invested in mitochondria reduces the space available for generating contractile force, and this spatial balance between mitochondria acontractile elements to meet the varying sustained power demands across muscle types is another important design criterion. This is accomplished with remarkably similar mass-specific mitochondrial protein composition across muscle types, implying that it is the organization of mitochondria within the muscle cell that is critical to supporting sustained muscle function. Beyond the production of ATP, ubiquitous distribution of ATPases throughout the muscle requires rapid distribution of potential energy across these large cells. Distribution of potential energy has long been thought to occur primarily through facilitated metabolite diffusion, but recent analysis has questioned the importance of this process under normal physiological conditions. Recent structural and functional studies have supported the hypothesis that the mitochondrial reticulum provides a rapid energy distribution system via the conduction of the mitochondrial membrane potential to maintain metabolic homeostasis during contractile activity. We extensively review this aspect of the energy metabolism design contrasting it with metabolite diffusion models and how mitochondrial structure can play a role in the delivery of energy in the striated muscle.
CLINICAL HIGHLIGHTS
The design of the energy metabolism system has major implications for striated muscle function in health and disease. The ability of the muscle to maintain its available energy during alterations in workload is critical for normal function.
The inability to maintain adequate energy supply for muscle contraction has been implicated in several pathologies including heart failure, age-related dysfunction, arrythmias, muscle atrophy, ragged fiber disease, metabolic syndrome, and a host of other chronic and systemic diseases.
Beyond the content and composition of mitochondria in tissue, the structure of mitochondria into interconnected reticulum networks is proposed to be critical in the distribution of energy across the muscle cell. The role of mitochondrial structure in the metabolic design of muscle is now recognized as a critical element in the balance of energy with work in this tissue. However, the role of mitochondrial structure in different disease states has not been extensively evaluated and could be a contributing factor to many energy-related chronic and acute clinical conditions.
1. INTRODUCTION
The purpose of this review is to update the information and hypotheses regarding the mechanisms of distributing energy converted by intermediary metabolism across the mammalian cardiac and skeletal muscle cell to support muscle contraction. To understand the design of energy conversion and distribution in the muscle cell, the entire process needs to be evaluated as it pertains to its physiological function. This includes the vascular supply of basic substrates, carbon sources and oxygen, the cellular energy conversion process, primarily glycolysis and oxidative phosphorylation (OxPhos), and finally the structural and biochemical methods to control and distribute the potential energy across the cell generated by the energy conversion processes. The energetics and physiological regulation of the different elements of muscle energy conversion have been a topic of many prior articles in Physiological Reviews illustrating the continuing interest in this basic physiological process. Some titles include the following: Ventricular Energetics by Suga (1), Energetics of Muscular Contraction by Mommaerts (2), Regulation of Increased Blood Flow (Hyperemia) to Muscles During Exercise: A Hierarchy of Competing Physiological Needs by Joyner and Casey (3), Myocardial Fatty Acid Metabolism in Health and Disease by Lopaschuk et al. (4), Muscle KATP Channels: Recent Insights to Energy Sensing and Myoprotection by Flagg et al. (5), Myocardial Substrate Metabolism in the Normal and Failing Heart by Stanley and Lopaschuk (6), Coronary Physiology by Feigl (7), and Myoglobin-Facilitated Oxygen Diffusion: Role of Myoglobin in Oxygen Entry into Muscle by Wittenberg (8).
With such a broad scope, we have attempted to focus our attention on the performance of the muscle approaching maximum workloads under normal physiological conditions. Maximum work load is a major design criterion of the muscle in that it must be able to support maximum workload output in terms of blood flow, intermediary metabolism, and mechanics. Weibel and coworkers (9–11) have also put forward the concept of symmorphosis where all the elements associated with a given physiological performance are tuned to just meet the maximum work output requirements of the tissue with little or no excess. Simply put, symmorphosis proposes that biology optimizes its use of space and protein to accomplish the task at hand without a large, potentially wasteful, excess protein for “reserve” or as part of the regulatory system. This design concept has been called “enough but not too much” by Diamond (12), who also pointed out the importance of optimizing space in biological systems. Although details of this hypothesis have been challenged (14, 15), this concept provides a theoretical framework to focus on the structural and biochemical design of heart and skeletal muscle function approaching maximum workload conditions.
What are the maximum workload conditions for heart and skeletal muscle? For the heart, the question is rather straightforward since the heart works primarily in a sustainable manner providing constant workload over a long period of time supported, in the steady state, by coronary blood flow and OxPhos. Thus we consider the maximum work of the heart to be the maximum sustainable cardiac output under physiological conditions.
The skeletal muscle is much more complex as it has at least two types of maximum power requirements as well as many different muscle types. The two conditions we will be considering are peak nonsustainable power, where metabolic recovery capacity may be more important than the sustainable rate of energy conversion, while the other is maximal sustained power, commonly called critical power (16–18), where the energy conversion of intermediary metabolism can support muscle contractile power for a sustained period of time. Of these two measures, critical power is similar to the maximum sustainable cardiac output for the heart. With the remarkable variety of skeletal muscle fiber types, we will be seeking common elements consistent across most muscle fiber types.
The energy conversion design of the heart and skeletal muscle will be discussed separately. Due to the very different design constraints on skeletal muscle and heart, we will focus any comparisons between heart and skeletal muscle to the maximum sustained power conditions. Skeletal muscle will be evaluated simply as fast-twitch, glycolytic and slow twitch, oxidative fiber types, with specific qualifications so as to not overly simplify the true spectrum of skeletal muscle fiber types where contractile and metabolic phenotypes may diverge. Additionally, for specific elements in the energy distribution system such as myoglobin, creatine kinase, and the mitochondrial reticulum, the historical and theoretical understanding of these systems will be covered when they are introduced. A more detailed summary of the overall muscle designs will be provided in sect. 4 of the review. Finally, while it is well appreciated that deficits in energy conversion capacity within the striated muscle cell have been implicated in many pathologies, the focus of this review will be on the energy metabolism design of the healthy striated muscle cell. Reviews on the role of muscle energy metabolism in heart failure (19–21), metabolic syndrome (22–24), aging (25, 26), arrhythmias (27, 28), and atrophy (29, 30) can be found elsewhere.
2. METABOLIC HOMEOSTASIS IN STRIATED MUSCLE
The muscle is a remarkable machine, converting chemical potential energy into contractile work. It does this in a rather efficient manner in human skeletal muscle running at ∼20% total efficiency (31); for review see Ref. 32. The muscle performs work primarily using the energy conversion processes of cytosolic glycolysis and mitochondrial OxPhos, which are precisely controlled to match the energetic needs of the muscle. It is now well established that the primary energy intermediate in this process is ATP, as initially taught to us by Lohmann [see historical review published just before his death in 1978 (33)], supporting both muscle contraction as well as ion transport. Early on in working out the energy sources for muscle contraction, it was appreciated that the concentration of ATP, though clearly the potential energy intermediate between carbon substrates and work, is remarkably constant within the cell despite changes in ATP hydrolysis. Hill in his “Challenge to Biochemists” in 1950 (34) was puzzled with the role of ATP from data in intact muscle: “It may very well be the case, and none will be happier than I to be quit of revolutions, that the breakdown of ATP really is responsible for contraction or relaxation: but in fact there is no direct evidence that it is. Indeed, no change in the ATP has ever been found in living muscle except in extreme exhaustion, verging on rigor. This is explained by supposing that as soon as ATP is broken down into ADP and phosphate it is promptly restored”…….“If this happens after each stimulus, then the smallness of the changes involved and their quickness make it extremely difficult to gain any direct evidence on the subject.” At the time, Hill was focused on the Lohmann reaction (creatine kinase), discussed below. However, it took the inhibition of both creatine kinase and metabolism to demonstrate a change in ATP with muscular work from the Davies laboratory a decade later (35, 36) resolving this challenge. Thus the homeostasis of ATP can be maintained by the creatine kinase reaction or metabolism, which was subsequently demonstrated in the creatine kinase knockout mouse models as discussed further below. This phenomenon of a near constant ATP in skeletal muscle with physiological workloads was also observed in the heart for decades using conventional freeze clamp extraction assays (37–39). However, it was unclear what was happening to the phosphorylation potential since both the ADP and phosphate (Pi) were difficult to assay using these extraction techniques (40–42). The advent of 31P-NMR to noninvasively measure intact tissue phosphate metabolites (43) together with the use of enzyme equilibrium measures to estimate the chemical activity of ADP (44), allowed the extensive study of the effect of workload on phosphate metabolites using noninvasive physical methods. Approaching maximum respiratory rates, the entire pool lifetime of ADP is only 40–170 ms, while ATP is 2–10 s and mitochondrial NADH is 70–250 ms, making the freeze-clamp approach challenging in active tissues (45). In both heart and skeletal muscle, the original observation that the concentration of ATP was extremely well maintained has been well replicated in the literature. In most skeletal muscle types, a modest decrease in phosphocreatine (PCr) and increase in Pi is accompanied with an increase in work resulting in a concomitant increase in the calculated ADP and decrease in free energy for ATP hydrolysis while the ATP concentration ([ATP]) remains near constant below exhaustion levels of contraction (31, 46, 47). Although the creatine kinase reaction can transiently maintain ATP using PCr for a few seconds (48), the support of muscle [ATP] for sustained striated muscle work must come from metabolically generated ATP synthesis. Thus the regeneration of ATP via intermediary metabolism, as originally shown by Davies laboratory (35, 36), is critical for maintaining ATP constant within the cell. It is important to point out that with exhaustive exercise, decreases in [ATP] have been reported in some human subjects (32–34) associated with decreases in muscle oxygen content (49) consistent with compromised metabolism due to hypoxia during sustained intense exercise.
In the heart, metabolic homeostasis occurs over a wide range of physiological workloads. Focusing on in vivo cardiac studies, with physiological increases in workload, not only is ATP held constant but PCr and Pi are also unchanged, at the sensitivity of 31P-NMR, until near maximum experimental workloads are achieved across mammalian species (50–55). These studies have also been reproduced in healthy human volunteers (56, 57).
The ability of the heart, and to a lesser extent the skeletal muscle, to maintain metabolic homeostasis during increases in work is now a well-established phenomenon (58–60). The small alterations observed in even highly aerobic fibers when compared with the heart might be related to the large dynamic range of skeletal muscle energy demands compared with heart. However, the mechanism by which metabolic homeostasis is maintained in all muscle cells is still unknown. The classical model of a simple feedback of ADP and Pi to drive oxidative respiration and glycolysis (61–63) does not seem to be adequate to drive these processes without severe alterations in the kinetics of ATP and Pi utilization (for examples, see Refs. 64, 65) or compartmentation of substrates (see example Ref. 66). Other proposals suggest that there are parallel activation schemes where muscle contractile activity and metabolism are activated in parallel potentially via intracellular calcium (67–71). However, the dominance of calcium as a parallel regulator of OxPhos has been challenged by the survival and modest effect of removing the putative mitochondrial calcium transporter (MCU) in heart and skeletal muscle in the mouse (72–74), although MCU knockout mice are not born at the expected Mendelian ratios and some have indeed reported significant metabolic effects in the MCU knockout mouse (75, 76). However, the fact that a mouse whose heart operates near its maximum capacity at rest survives the removal of MCU, as well as creatine kinase and myoglobin discussed below, with modest changes in metabolic regulation suggests that the signaling network that supports muscle metabolic homeostasis is complex and likely does not depend on only one or two factors but an ensemble of signaling processes to maintain this critical process (77–79). It is clear that to accomplish this task a coordinated modulation of blood flow, substrate entry, substrate oxidation, and the entire OxPhos cascade needs to be activated to accomplish this rather remarkable bioengineering task. Fell and Thomas (77) and Korzeniewski (80–82) have presented theoretical models supporting this notion that the modulation of ATP production needs to occur over most of the steps in the reaction network. No single signaling mechanism like Ca2+ (69), AMPK (83), or even local metabolite (Pi, ADP, etc.) feedback (84) can likely coordinate these processes alone. Likely an integrated signaling network is responsible that we are just beginning to understand and will not be the focus of this review. Intrinsic to this process is the distribution of potential energy through the cell, which will be discussed further below.
The observed metabolic homeostasis first discussed by Hill (34) also has consequences with regard to the distribution of free energy in the muscle cell. That is, the kinetics of metabolically converted free energy distribution needs to match, or exceed, the rate of muscle cell ATP hydrolysis/synthesis and be done in such a way that the concentration of ATP does not change significantly. The complication here is that changes in metabolite diffusion rates require proportional changes in concentration gradients, although small diffusion distances, facilitated diffusion, and specialized gradient barriers could explain some of this phenomenon. However, the fact that large changes in ATP, ADP, and Pi flux occur in striated muscle without significant alterations in the concentration of these metabolites brings into question the role of metabolite diffusion in the regulation of overall energy conversion rates. Much of this review will focus on hypotheses involving a mitochondrial reticulum to distribute free energy in the form of the mitochondrial membrane potential that rapidly conducts through the muscle cell via a regulated mitochondrial reticulum thereby avoiding significant metabolite diffusion requirements.
3. METABOLIC SUPPORT DESIGN OF THE MUSCLE CELL
The heart needs to function, in the steady state, over a wide range of workloads and associated metabolic rates. This steady-state work is almost exclusively supported by the energy conversion occurring in OxPhos as illustrated by the small energy conversion capacity of glycolysis in the heart (85, 86). With this limitation, the maximum rate of ATP production by OxPhos should be matched to the maximum need for energy conversion in support of sustained myocardial contraction (i.e., myofibril activity) and control (i.e., ion transport) as well as basal maintenance of the myocyte [up to 30% of resting heart metabolism (87)]. Supporting this notion, the heart maximum rate of mitochondrial OxPhos, estimated from cytochrome oxidase (COX) content, essentially matches the maximum rate of respiration determined in the exercising animal (88, 89). These observations suggests that the design of the heart permits the delivery of substrates, oxygen and carbon metabolites, to not be rate limiting for OxPhos at maximum rates with little reserve capacity of OxPhos. These observations are consistent with the concept of symmorphosis (9–11) discussed above.
In contrast to cardiac muscle, which is designed to maintain energy homeostasis across nearly the entire range of contractile demands in the constantly beating heart, the design of the intermittently contracting mammalian skeletal muscle places greater emphasis on maximal contractile power at the expense of reducing oxidative energy metabolism. Consistently, whereas oxygen delivery is largely nonlimiting under physiological conditions in the heart due to high capillarization, relatively smaller cell sizes, and stable po2 gradients as discussed above, lower capillary densities and larger cell sizes in skeletal muscle fibers contribute to larger and more dynamic oxygen gradients from the capillary to the mitochondrion (90–95). As a result, the likelihood for oxygen delivery limitations is much greater in skeletal muscle cells and even more so in glycolytic compared with oxidative muscle fibers. Indeed, endurance exercise training in both rodents and humans has been reported to result in a twofold increase in skeletal muscle mitochondrial content, yet only ∼15% change in maximal oxygen uptake (96, 97). These data suggest that while mitochondrial content correlates well with performance on submaximal endurance tests (96, 98), mitochondrial content does not appear to be a major limitation to maximal oxygen uptake by the skeletal muscle cell (99, 100). The exact contributions of specific limiting factors to maximal oxygen uptake remain hotly debated, however (101–106). It is important to note that critical power, or the maximal sustainable skeletal muscle work rate mentioned above, generally occurs at ∼70–80% of the rate of maximal oxygen uptake in humans and thus may not face the same oxygen supply limitations. The primary components of the oxygen delivery system interacting directly with the muscle fiber, capillaries, and myoglobin will be discussed below. Recent in-depth reviews of oxygen delivery pathways upstream from the capillaries can be found elsewhere (3, 90, 107–109).
3.1. Major Muscle Cell Energy Conversion Processes
To understand the distribution of potential energy across the muscle, the sources of energy conversion to ATP need to be evaluated along with the topology of these sites in the cell. The primary sources of ATP during muscle contraction are creatine kinase, glycolysis, and OxPhos (FIGURE 1). Glycolysis and OxPhos provide the large majority of ATP during contractions lasting beyond a few seconds and will be the major focus of this section. However, discussion of creatine kinase will be included below as part of the facilitated diffusion section.
FIGURE 1.

Major adenosine triphosphate (ATP) production and utilization processes in striated muscle. Muscle contraction and maintenance of ion gradients across membranes are the major ATP utilizing work processes in striated muscle cells. Metabolic homeostasis is maintained by ATP production through the creatine kinase, glycolysis, and oxidative phosphorylation energy conversion processes. PCr, phosphocreatine; Cr, creatine; ADP, adenosine diphosphate; HK, hexokinase; PGI, phosphoglucose isomerase; PFK, phosphofructokinase; ALDO, aldolase; GAPDH, glyceraldehyde 3-phosphate dehydrogenase; TPI, triose phosphate isomerase; PGK, phosphoglycerate kinase; PGM, phosphoglycerate mutase; ENO, enolase; PK, pyruvate kinase; LDH, lactate dehydrogenase; G6P, glucose 6-phosphate; F6P, fructose 6-phosphate; F1,6BP, fructose 1,6-bisphosphate; GA3P, glyceraldehyde 3-phosphate; DHAP, dihdroxyacetone phosphate; 1,3BPG, 1,3-bisphosphoglycerate; 3PG, 3-phosphoglycerate; 2PG, 2-phosphoglycerate; PEP, phosphoenolpyruvate; β-Ox, fatty acid β-oxidation; TCA, tricarboxylic; CI, complex I (NADH dehydrogenase); Q, ubiqinone; CIII, complex III (ubiquinol-cytochrome c reductase); c, cytochrome c; CIV, complex IV (cytochrome oxidase); CV, complex V (ATP synthase); ANT, adenine nucleotide translocase.
With regard to the enzymes involved in the major energy conversion processes, it is reasonable to assume that protein content of an enzyme is a reflection of its relative maximum velocity based on the simplified Michaelis-Menten kinetics, where Vmax is assumed to be proportional to the concentration of the enzyme as Vmax∼kcat[E], where kcat is the enzyme rate constant that can depend on many parameters including pH, ions, allosteric interactions, and posttranslational modifications. However, with all of these modulators being equal, the enzyme concentration can be used to estimate the “potential” Vmax of the system (110–112). This is important for this review to understand the relative capacity of the different muscles to produce ATP together with the localization within the cell. The maximum velocity of enzymes, especially putative rate-limiting enzymes, has been used in the past to estimate the maximum ATP production of glycolysis [glyceraldehyde-3-phosphate dehydrogenase (113, 114), phosphofructokinase (115), and enolase (112)]. Some models have suggested other glycolytic enzymes could be rate limiting (114); however, at this stage, the essentially irreversible phosphofructokinase remains the primary candidate as a rate limiting step (116–118). While estimates of OxPhos have been made from enzymes of the citric acid cycle [oxoglutarate dehydrogenase (113)] or the electron transport chain [cytochrome oxidase (89, 119)], there does not appear to be a single rate limiting enzyme for OxPhos. Instead, control of flux through the OxPhos process is shared among nearly all of the enzymes (68, 120–122). It is important to note that the use of enzyme concentrations to estimate Vmax assumes that the kcat is the same for different tissues at maximumly stimulated workloads, but this is often complicated by different tissue isoforms with different kinetic properties as well as the artificial environment an enzyme is exposed to for in vitro studies (123). Even so, the value of this type of data has been well appreciated in the literature as numerous studies on the protein composition or enzyme activities of muscle tissues have been created (111, 124–135).
A challenge in the field has been to rely on the more difficult determination of absolute protein content rather than the relatively easy enzymatic activity of tissue extracts. Given the dependence of enzyme activity on the assay conditions and purification conditions (136), we have selected to use protein content measured with quantitative antibody or, preferably, physical measures such as mass spectrometry or optical spectroscopy to characterize the flux capacity of different muscle systems. Despite the extensive work on the protein content of muscle, a relational quantitative study of protein content in the three muscle types we are considering in this review, heart, slow-twitch, and fast-twitch muscles from a single species, is not in the literature. To help our analysis to assimilate data from many different sources, we created a relational database of the proteins of the rabbit heart, soleus (98% slow-twitch), and gracilis [99% fast-twitch (137)] muscles using standard contemporary mass spectrometry labeling techniques. While we only focus on the creatine kinase, glycolytic, and OxPhos enzymes here, although the other detected proteins will be provided in Supplemental Table S1 (see https://doi.org/10.6084/m9.figshare.14109524.v1). We selected rabbit since it provided adequate sample for analysis, is one of the most extensively characterized muscle systems in the literature, and contains highly homogenous fast- and slow-twitch muscles (gracilis and soleus, respectively). In this comparison, we found over 3,000 proteins across the different tissue types using mass spectrometry (data presented in Supplemental Table S1). Again, we focus on the protein programming of these muscle cells for the metabolic energy conversion systems including putative facilitated diffusion systems such as creatine kinase. This analysis will use the extensive prior literature data together with the relational database in the rabbit to illustrate the protein programming associated with the overall energy conversion in striated muscle cells.
3.1.1. Glycolysis.
Glycolysis is an important energy source both in the form of ATP as well as for providing pyruvate for OxPhos. The relative database created for this review can be converted into a quantitative analysis of glycolysis using the baseline concentrations of glycolytic enzymes provided by Maughan et al. (125) of the free cytosolic proteins in the fast-twitch psoas muscle of the rabbit. This analysis is presented in TABLE 1. It has been noted by Maughan et al. (125), and others (111), that their values are considerably higher than prior work using primarily enzyme activities in extracts (138). We have selected to use Maughan et al. (125) for these analysis as they are the only quantitative physical measure of the glycolytic enzymes of the rabbit currently available.
Table 1.
Concentrations of glycolytic enzymes in rabbit muscles
| Glycolytic Enzyme | Soleus, µmol/L cell volume | Gracilis,* µmol/L cell volume | Heart, µmol/L cell volume |
|---|---|---|---|
| Glycogen Phosphorylase | 8 | 43 | 5.6 |
| Phosphoglucose isomerase | 5 | 29 | 9 |
| Phosphofructose kinase | 5 | 35 | 8 |
| Aldolase | 8 | 54 | 6 |
| Triose-phosphate isomerase | 20 | 82 | 13 |
| Glyceraldehyde-3-phosphate dehydrogenase | 16 | 74 | 10 |
| Phosphoglycerate kinase | 30 | 131 | 20 |
| Phosphoglycerate mutase | 16 | 69 | 12 |
| Beta enolase | 15 | 108 | 12 |
| Pyruvate kinase | 11 | 78 | 7 |
| Lactate dehydrogenase† | 25 | 76 | 40 |
Gracilis data equated to rabbit psoas data from Ref. 125. †Lactate dehydrogenase concentrations are based on the sum of both the A and B isoforms.
Summing the mass of these proteins by grams of protein per liter cell, we find that the gracilis muscle has over 60 g of protein per liter cell devoted to glycolysis while the soleus and heart muscle have only 9 and 10 g/l, respectively. Using a protein density of 1.37 g/ml (139), this corresponds to ∼9% of the gracilis muscle cell volume is devoted to glycolytic enzymes while only 1–2% of the cell volume of the soleus and heart. Note that the remaining space is primarily consumed by myofilaments and mitochondria as discussed below, as well as sarcoplasmic reticulum (SR). These rather large differences reflect the known heavy dependence of the gracilis, a glycolytic fast twitch muscle, on the production of ATP from glycolysis when compared with soleus or heart muscle.
What is the maximum ATP conversion rates of glycolysis in these muscles? It is tempting to take the concentration of phosphofructokinase and its specific activity to arrive at a maximum velocity for glycolysis. However, this approach in the past has grossly overestimated the physiological fluxes observed. For example, Newshome and Crabtree (113) estimated from phosphofructokinase activity the maximum ATP production rate in the rat heart at 60 µmol ATP/min/g (corrected for temperature to 37°C). However, Kobayashi and Neely (85) found only ∼5 µmol ATP/min/g wt in rat heart while in the rabbit heart maximum glycolytic ATP production rate is ∼6 µmol ATP/min/g wt (140) [both calculations assume a wet/dry weight of 5.9 (141)] Similarly, the maximum glycolytic ATP production rates estimated from PFK activity in male and female human tibialis anterior muscle [∼180 and 140 µmol ATP/min/g wt, respectively (142)] exceed the measured maximal glycolytic rates in male and female human tibialis anterior muscles [∼60 and 30 µmol ATP/min/g wt, respectively (143)] by severalfold. Thus there is either significant reserve capacity in these enzymes under some conditions (115) or the extract assays do not reflect the true activities of these cytosolic enzymes (113, 115). This is likely even more important for many of the OxPhos enzymes that reside in a membrane with a very complex reaction environment including a membrane potential etc. As a result, we will consider the proteomics data to provide relative Vmax capacities, but they cannot, at this time, be used to estimate absolute fluxes.
3.1.2. Oxidative phosphorylation.
The mitochondrial protein content of the heart is clearly much higher than the other muscle tissues. Summing all of the mitochondrial proteins, we find that for the 304 highest abundance mitochondrial proteins, the ratio of mitochondrial proteins compared with heart was 36 ± 2 and 4 ± 0.1 for heart/gracilis and heart/soleus, respectfully. Due to the remarkable consistency in the ratios across tissues for these mitochondrial enzymes, the protein content for OxPhos has been simplified down to the levels of COX, the only irreversible step in the entire cascade from NADH to the terminal reduction of oxygen to water. Thus the content of COX serves as a good estimate of the OxPhos capacity of a system. We used the quantitative data on COX content in the rabbit heart from Phillips et al. (89) at 35 µmol/L cell volume and from Glancy and Balaban (144) at 12.2 and 1.9 µmol/L cell volume for the rabbit soleus and gracilis, respectively (TABLE 2). For reference, the relative COX abundance in each muscle type can also be calculated using our relational proteome database (Supplemental Table S1). Assessing the 14 COX subunits detected in each tissue yields a 21.7 ± 0.1- and 4.4 ± 0.0-fold greater COX concentration in the heart compared with the gracilis and soleus, respectively.
Table 2.
Concentrations of cytochrome c oxidase in striated rabbit muscle
| Protein | Soleus,† µmol/L cell volume | Gracilis,† µmol/L cell volume | Heart*, µmol/L cell volume |
|---|---|---|---|
| COX | 12.2 | 1.9 | 35 |
These data support the notion that the heart has the largest capacity for OxPhos when compared with the other striated muscle systems. Note that most of the enzymes associated with OxPhos are upregulated in the heart and soleus suggesting that the entire network cascade is required to provide more ATP from OxPhos. Moreover, it appears that all of the enzymes within mitochondria seem to be in proportion across the different muscle types as illustrated in FIGURE 2, A–C, for the top 152 abundant mitochondrial proteins, normalized to total tissue protein. The ratio of mitochondrial protein content is remarkably consistent with very few exceptions. The average ratio of mitochondrial protein expression was 0.3 + 0.01 for soleus/heart, 0.1 + 0.02 for gracilis/heart, and 4.8 + 0.2 for soleus/gracilis. The gracilis/heart data are plotted as heart/gracilis to condense the ratio axis. The tabulated data for these plots are presented in Supplemental Table S2 (see https://doi.org/10.6084/m9.figshare.14109521.v1). The similarities in mitochondrial protein composition among striated muscles as shown here for the rabbit has also been observed in the pig with nearly identical protein expression profiles as assessed by two-dimensional (2-D) differential in gel electrophoresis (89, 144). Moreover, while endurance exercise training results in an increase in skeletal muscle mitochondrial content, the OxPhos protein content per mitochondrion remains relatively unchanged in both rats and humans (96, 97). In sum, these data are consistent with the notion that, with the possible exception of fuel preference (137, 144), the protein programming per mitochondrial volume is nearly constant across mammalian striated muscle, implying that content and structure are the primary methods of adapting to different maximum OxPhos velocity requirements in different muscle types. Possibly, the protein composition for ATP production is maximized per mitochondrion, and all that is left is modulation of content and location to regulate cellular ATP production capacity.
FIGURE 2.

Mitochondrial protein composition is remarkably similar across striated muscle types. Ratio of mitochondrial protein contents normalized to total protein content between tissues from whole muscle mass spectroscopy data. One-hundred fifty-two of the highest abundant proteins are plotted with labels applied to the proteins with large increases beyond the mean. All proteins are identified along with tabulated data in Supplemental Table S1. A: soleus muscle vs. heart. B: soleus vs. gracilis. C: heart vs. gracilis.
3.1.3. Specific power of energy conversion processes in muscle.
As muscle is a moving organic system, the specific power, or weight efficiency, of the energy conversion process used is important as moving the “weight” of the energy conversion system becomes one of the workloads of the muscle. Thus the higher the specific power of the energy conversion system, the more efficient the muscle can be in performing work. For example, the high specific power of the internal combustion engine, in comparison with the steam engine, made airplane flight possible (145). Using the data in the rabbit heart, we can total the glycolysis enzymes for ATP production to be ∼10 mg/gr wet weight (extrapolated from Ref. 125) and our relational proteomic data (Supplemental Table S1) that can support a realized rate of 5 µmol ATP/min/g heart resulting in 0.5 mmol ATP/min/g glycolytic enzymes. How does this compare with the weight/volume efficiency of OxPhos? The maximum rate of ATP production by OxPhos per gram of mitochondria (including associated water) can be estimated from the cytochrome oxidase (COX) content and maximum activity in intact heart mitochondria of ∼700 nmol O2/nmol COX/min (88, 146) or assuming 5.6 ATP/O2 then ∼4 µmol ATP/nmol Cox/min, which correlates with maximum in vivo rates of canines (88). In heart mitochondria, there are ∼1 nmol COX/mg protein (89) resulting in 4 µmol ATP/min/mg mitochondria protein. The mitochondria require an intact compartmentalized structure to function, in contrast to glycolysis; thus, to get the wet weight of mitochondria, the mass of mitochondrial lipid, water, and solutes must be accounted for. Mitochondrial protein makes up 25% of the total mass of mitochondria (147), so 1 mg protein is equivalent to 4 mg of mitochondrial wet weight. This results in 1 µmol ATP/min/mg wet weight or 1 mmol ATP/min/g compared with 0.5 mmol ATP/min/g in glycolysis calculated above. Assuming a free energy of hydrolysis (ΔGATP) of –64 kJ/mol of ATP, these values correspond to a specific power (kW/kg) of 1.1 and 0.5 for aerobic respiration and glycolysis in the heart, respectfully. The specific powers of skeletal muscle glycolysis (3.8 kW/kg) and aerobic respiration (1.7 kW/kg) are of similar magnitude (skeletal muscle calculations),1 although glycolysis appears to have greater specific power than OxPhos in the skeletal muscle. For reference the specific power of a V8 internal combustion engine is ∼0.65 kW/kg or close to the specific power of glycolysis in the heart. The weight efficiency of OxPhos and glycolysis are clearly very close within a factor of 3 taking into account the potential errors in this type of calculation including ignoring the water space associated with glycolysis.
Therefore, why pick localized mitochondrial OxPhos over the more distributed glycolysis or vice versa? The selection of energy source is much more complex than the simple specific power of the enzyme system. The complete oxidation of glucose to CO2 makes more efficient use of the entry of glucose and does not result in the generation of a high potential metabolic end product, lactate, that needs to be regenerated into glucose in the liver and kidney at a deficit to the net energy balance of the animal. That is, if the muscles only used glycolysis and lactate was converted back to glucose in liver and kidney for subsequent reuse, the body actually losses 4 ATP for each glucose oxidized (148) which is not sustainable. Thus lactate must be excreted, which is a huge loss of potential energy, or used as reducing equivalents in other regions of the body for OxPhos. This later constraint is likely a reason that the heart prefers plasma lactate for oxidation over almost all other substrates when present in high concentration in the blood (149, 150). Another reason may well reside in the structural requirements of glycolysis versus OxPhos. Glycolysis is believed to be partially compartmentalized but is clearly in the freely soluble cytosolic fraction permitting tight packing within the myofilaments. Also, being free in the cytosol reduces the impact of internal shear forces of the muscle that the mitochondria could be susceptible to as complex organelles. As the muscle reduces longitudinal length and thickens upon contraction, shear on the highly compliant mitochondria is potentially generated in both the short and long axis. One compensatory mechanism is to place mitochondria where internal shear is minimized such as the I-band, Z-disk, or subsarcolemmal regions of the cell. Another is to have the mitochondria move with the myofilaments in both dimensions by being directly attached to the myofilaments, thus shortening and thickening with each contraction. Evidence is available that cardiac mitochondria do remain attached to the sarcomere, shortening and thickening with each contraction and retaining their relationship with the sarcomere (151). The connection to the sarcomere may be through the intermediate fibers of desmin together with plectin (152). The impact of this reshaping of the mitochondria on each contraction has not been extensively explored. Overall, the mitochondria require dedicated space that is difficult to locate within the muscle without the sacrificing cross-sectional area of the contractile apparatus needed to maximize power, and specific placement of mitochondria may result in exposure to shear forces as mentioned above. Finally, OxPhos resulting from fatty acid fuel sources, as is most common in the heart (153, 154), also requires displacement of myofibrils or other cellular structures to make room for lipid droplets, which are often tightly coupled to mitochondria. This aspect of the topology of the energy conversion systems will be discussed further in section 3.2.3.
3.2. Energy Distribution Processes of the Muscle Cell
In addition to the content and composition of the energy conversion processes as discussed above, the energetic design of a cell must also take into account the distribution of the inputs, intermediates, and outputs involved in the energy conversion processes (155). Thus, in the relatively large and densely packed muscle cell, the distances between the participating structures as well as the processes regulating the movement of metabolites and ions between them play a particularly important role in determining the energetic support capacity of the cell. To limit the scope of this section of the review, we will focus on the delivery of oxygen from the capillary to mitochondria, the distribution of electrical potential energy within mitochondria, and the delivery of ATP from mitochondria to cellular ATPases. Thorough discussion of substrate metabolism in muscle cells can be found elsewhere (4, 6, 156–158).
3.2.1. Capillary structure and blood flow.
One of the primary requirements to support OxPhos is to provide oxygen. To support the supply of oxygen, the heart is highly vascular with a remarkable density of capillaries between 2,500 and 4,500 capillaries/mm2 (159–164), which are nearly evenly spaced every 12 to 22 μm (162, 164–166) consistent with the average diameter of a heart cell (163). These densities suggest that each heart cell is in contact with one or more supporting capillaries. This is consistent with the three-dimensional electron microscopy studies (167, 168) revealing a capillary associated region within most cardiac myocytes. Adjacent to these capillaries is a slightly higher density of mitochondria (159) within the paravascular pool (167), although not as well developed as in the skeletal muscle (169). Thus the capillary network is well designed to deliver blood and associated oxygen and substrates to essentially every cell in the heart wall.
To support the high level of OxPhos, the coronary blood flow is relatively high and linearly balanced with the workload (170) maintaining a low venous po2 (∼18 Torr) over much of the workload range (171). The mechanism of how coronary flow is precisely matched to oxygen demand remains a major question in cardiac physiology and likely relies on multiple and redundant mechanisms across varying spatial scales for this absolutely critical function in the heart and the body (7, 171–173). The net result is a highly dynamic system providing an appropriate amount of oxygen, maintaining a near constant venous po2, and meeting the oxygen delivery needs of the heart through a dense feeding capillary network.
The capacity of capillaries to deliver oxygen to skeletal muscles has been of great interest (174–178) since August Krogh’s Nobel Prize winning work (179) on the regulation of oxygen diffusion in muscles roughly a century ago. Capillary density can vary greatly in skeletal muscles from ∼250 to 1,500/mm2 of muscle volume with oxidative muscles containing up to twice the number of capillaries per unit volume and ∼33% higher capillary to muscle fiber ratio (∼2.0 vs. 1.5) (175, 177, 178, 180, 181). While capillary-to-fiber ratio and capillary density have been commonly measured on 2-D images for decades and often, but not always, correlate well with muscle oxidative capacity (174–178, 180, 182–184), how the capillary interacts with the muscle fiber also plays a major role in the diffusion capacity between these structures. Indeed, measures that incorporate the geometry of capillary-fiber interactions, either in 2-D or 3-D, have become more prevalent and better correlate with mitochondrial content across both oxidative and glycolytic muscle types across a variety of conditions (175, 176, 185–192). Thus the overall structural capacity for oxygen delivery from capillaries to within the skeletal muscle fiber is dependent on 1) the number of capillaries in proximity to the cell, 2) the direct surface area contact between capillaries and the muscle fiber, and 3) the cross-sectional area of the cell. As mentioned above, more oxidative muscles are smaller, have greater capillary densities, and have greater capillary surface area contact than more glycolytic muscles. However, most muscles, particularly in humans, are comprised of heterogeneous groups of both oxidative and glycolytic muscle fibers with the relative proportion of each determining the overall metabolic phenotype of the whole muscle (182, 193). This heterogeneity results in adjacent oxidative and glycolytic muscle fibers each with different demands for oxygen delivery along their shared borders, and often, oxidative fibers can be surrounded by several glycolytic fibers. The incongruous demand for oxygen to oxidative fibers adjacent to glycolytic fibers may be met by placing capillaries in grooves in the sarcolemma of the more oxidative cell (194). Embedding capillaries atop only one of the two adjacent fibers allows the capillary surface area contact to be increased to one but not the other fiber (FIGURE 3, A–D) and thus offers another level of control when designing the structural capacity for oxygen delivery to the muscle cell within heterogeneous tissues. Much remains to be discovered regarding these capillary grooves such as how and when they form during muscle development as well as more precise information on their contribution to oxygen delivery capacity to muscle cells. It is clear, however, that these grooves in the sarcolemma are true physical structures and not just the result of capillary compression of the cell membrane, as sarcolemmal grooves remain visible in isolated live muscle fibers even after removal of the adjacent capillaries (FIGURE 3C). How or whether the composition of the sarcolemma is altered in this region has yet to be determined, although we speculate that receptors or transporters, which interact with substrates carried in the blood may be upregulated in sarcolemmal grooves relative to the rest of the membrane to increase the efficiency of intercellular signaling and/or transport processes.
FIGURE 3.
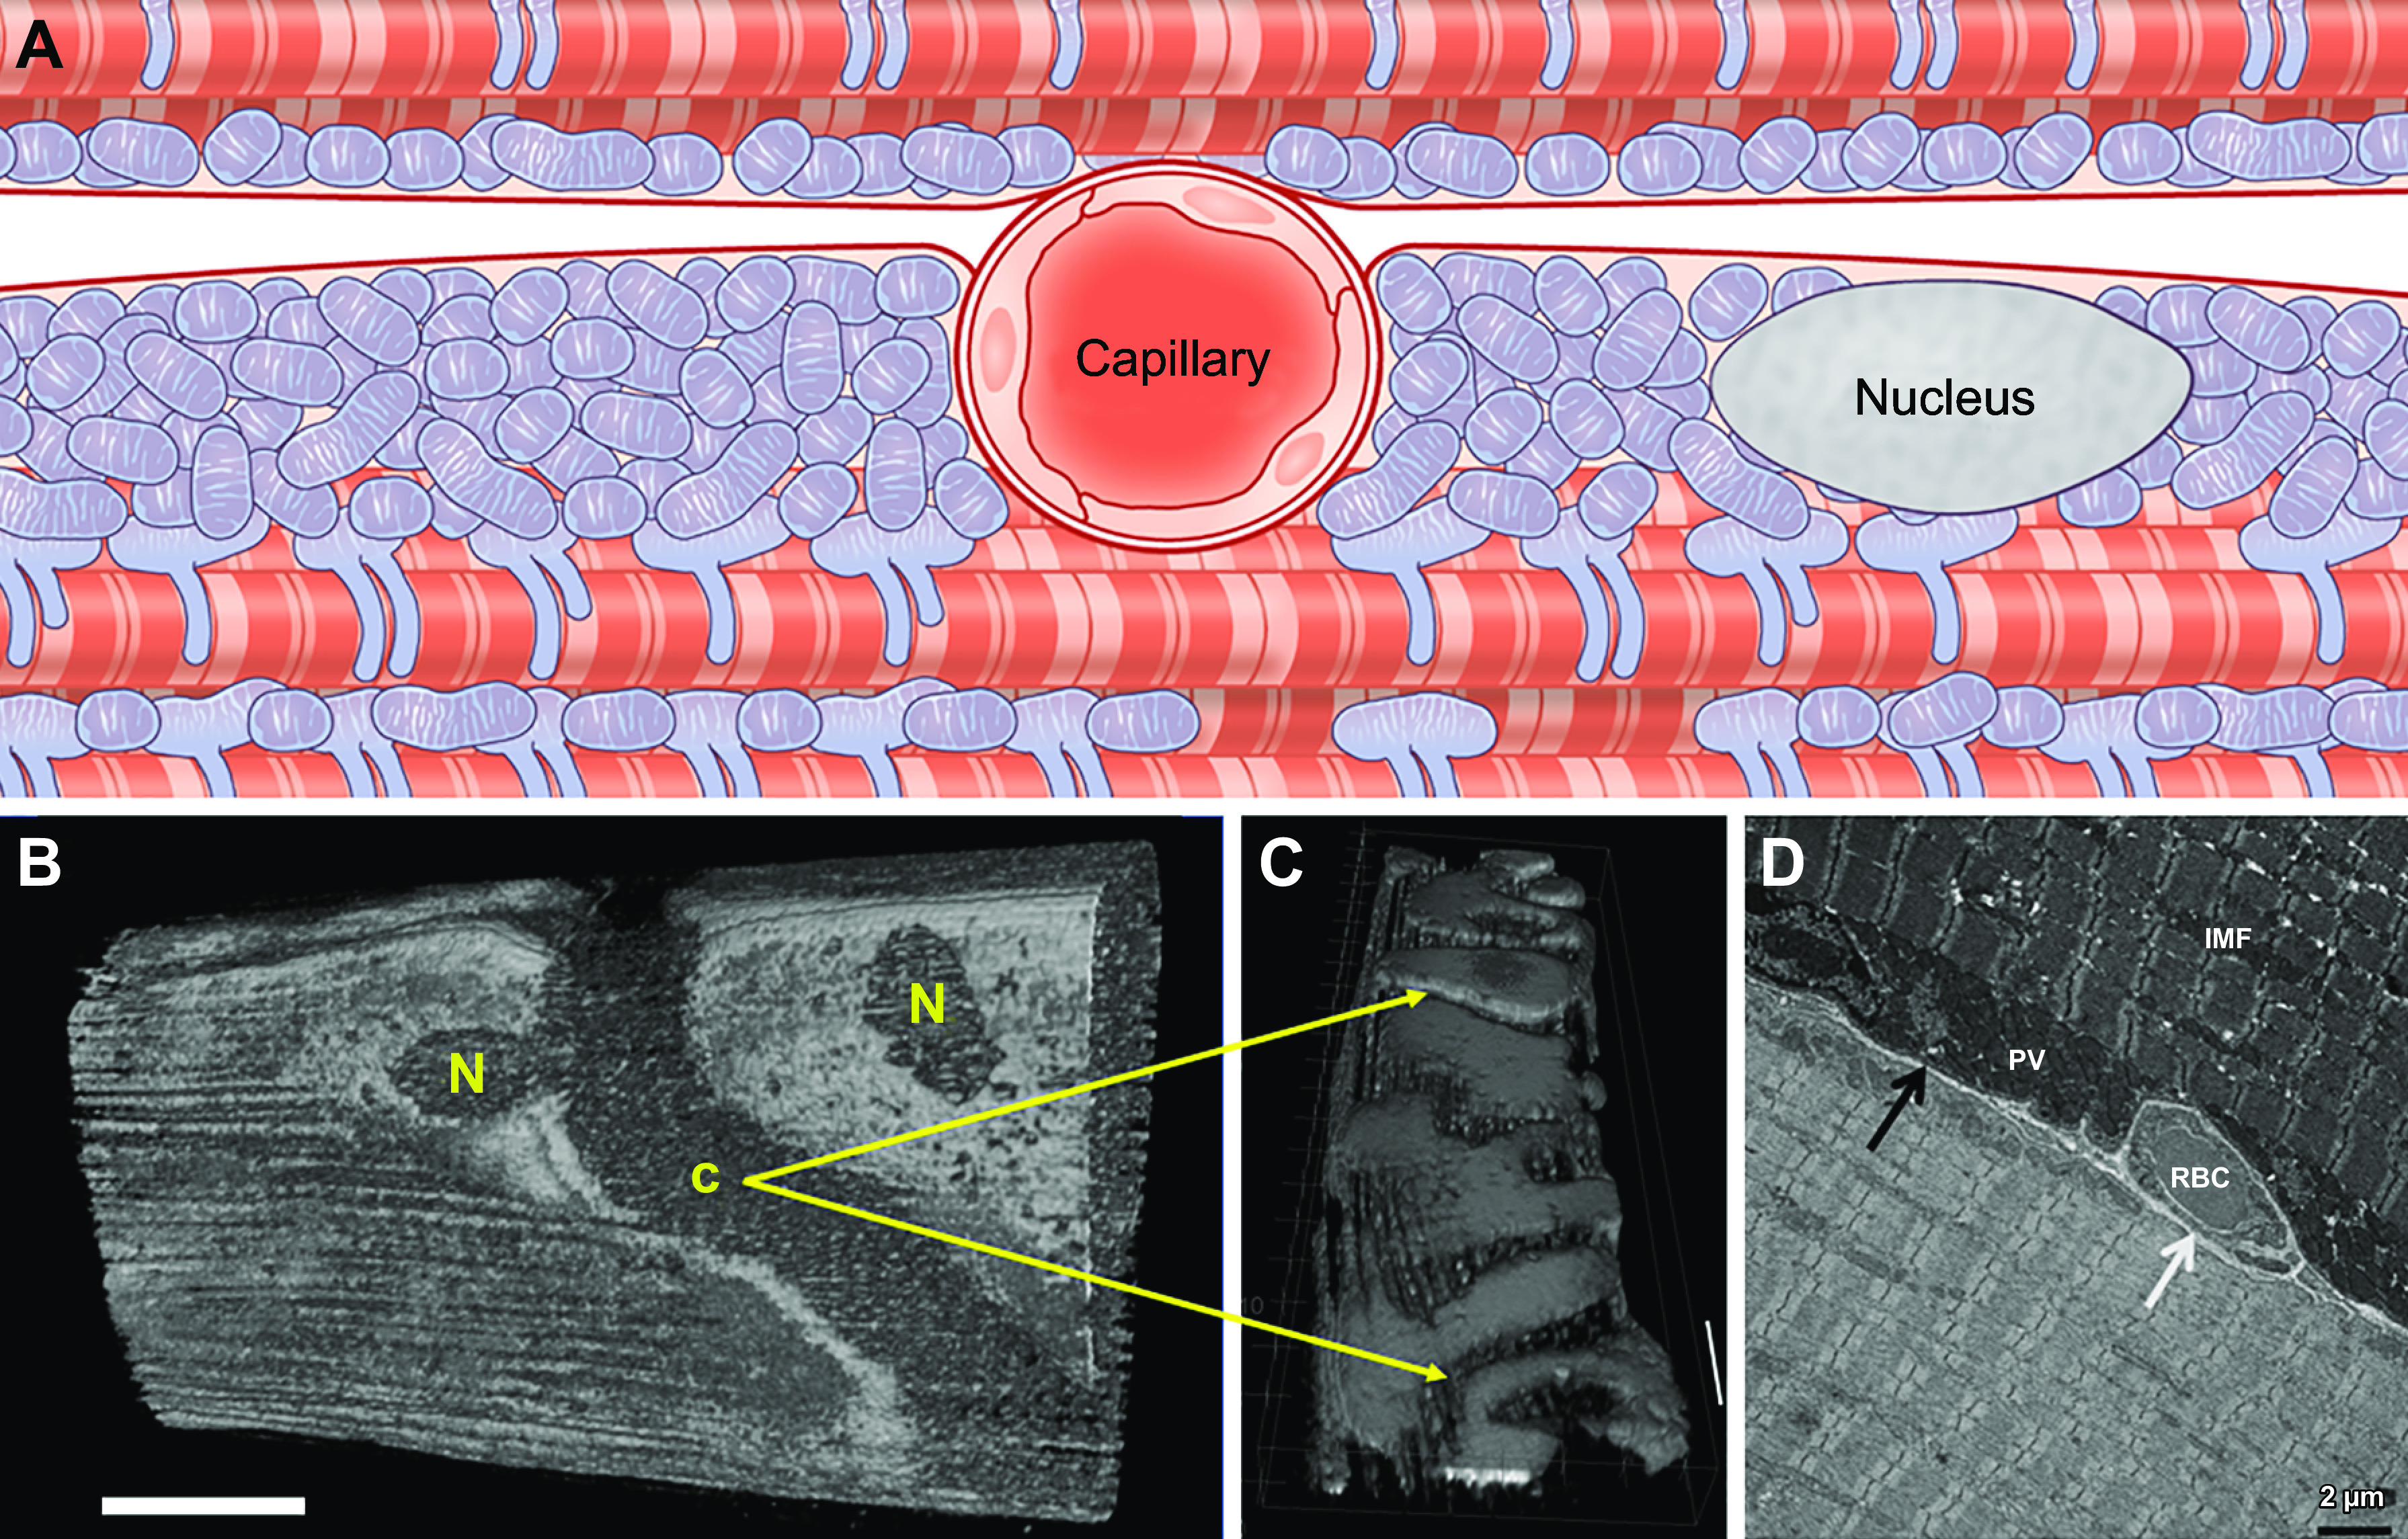
Capillary embedding within sarcolemmal grooves provides additional control over oxygen delivery capacity to specific muscle cells. A: schematic figure of a capillary located between a glycolytic (top) and oxidative (bottom) muscle fiber. Mitochondria and nuclei locate laterally to the capillary sitting in a sarcolemmal groove and increasing surface area contact with the oxidative fiber. Adapted from Ref. 194. B: 3-dimensional (3-D) rendering of mitochondrial structure in an intact Tibialis anterior muscle cell showing voids where capillary grooves (C) and nuclei (N) are located. Adapted from Ref. 169. C: 3-D rendering of mitochondrial structure in an isolated, live soleus muscle fiber. Grooves in the sarcolemma remain even after removal of capillaries through collagenase digestion. Adapted from Ref. 169. D: transmission electron microscopy image of a capillary (white arrow; IMF, intermyofibrillar; PV, paravascular) embedded in a sarcolemmal groove in the upper but not lower muscle fiber. RBC, red blood cells. Adapted from Ref. 194.
Similar to the dynamic nature of skeletal muscle contraction, the rate of blood flow can increase more than an order of magnitude from rest to exercise (195) and occurs fast enough that oxygen delivery to the muscle does not appear limiting at the onset of exercise in healthy populations (195–198). Despite the large, rapid increase in oxygen delivery at the onset of exercise, the increased contractile rate of the muscle cells during even moderate exercise results in a fall in the mean po2 in both the capillaries (∼35 to 24 Torr) and interstitial space between capillaries and muscle fibers (∼16 to 7 Torr) (90, 92). Together with the similar magnitude fall reported for intramuscular po2 from ∼10–15 Torr at rest to 2–5 Torr at exercise intensities ranging from moderate to severe (91, 199–201), it has been suggested that exercise does not alter the oxygen pressure gradient from the capillary to mitochondria as previously thought (90, 202). Instead, the diffusion constant for oxygen (do2), analogous to its conductance, appears to increase severalfold to account for the increased oxygen flux (90, 202), although the precise mechanisms behind this change remain to be resolved. What is clear is that blood flow to the skeletal muscle is tightly regulated through several related and likely overlapping mechanisms, which provide precise control over oxygen delivery across the wide range of skeletal muscle contractile demands.
3.2.2. Cytosolic facilitated diffusion processes.
Due to the metabolic rates and distinct compartmentation of the ATP-utilizing and -producing machinery in muscle, as well as the observed metabolic homeostasis limiting large metabolite gradients, it has often been suggested that simple metabolite diffusion is inadequate to support this highly active structure (203). The two major cytosolic facilitated diffusion systems that have been the focus of extraordinary effort are creatine kinase for ATP and ADP (204–208) and myoglobin for oxygen (8, 209–212). These two mechanisms will be discussed below as they represent the classical view of energy distribution in the muscle cell.
3.2.2.1 myoglobin.
In addition to the dense capillary network with only 20 or so micrometers separating each capillary run, the heart also contains myoglobin that can serve as a parallel facilitated diffusion pathway for oxygen (8). Although myoglobin in diving animals is believed to provide an oxygen reserve for diving (213), the low concentration in land animals would only support OxPhos for seconds during a hypoxic event (214, 215). Thus a role as an oxygen reserve in most nondiving mammals is believed to be very small. However, the relatively high concentration of myoglobin relative to oxygen suggested it might play a role in facilitated diffusion. The demonstration of facilitated oxygen diffusion by an oxygen binding protein was first described for hemoglobin and/or myoglobin by several investigators early in the 1960s (209–212) with an early suggestive abstract by Wittenberg (209). This was then developed into a detailed model of myoglobin facilitated diffusion within muscle in a classic paper in Physiological Reviews (8). The concept of myoglobin facilitated diffusion is basically that myoglobin can provide a parallel diffusion pathway for oxygen through the gradients in oxy- and deoxymyoglobin. Myoglobin facilitated diffusion depends on several factors: first, myoglobin affinity for oxygen is intermediate between the relatively low nonlinear affinity of hemoglobin and high-affinity cytochrome oxidase, thus facilitating the transfer from low- to high-affinity sites reflected in hemoglobin/myoglobin and myoglobin/cytochrome oxidase transfers of oxygen. Second, myoglobin is relatively small and is nearly freely diffusible in the cytosol (216, 217). Third, depending on the tissue (218), myoglobin is in sufficient concentration, significantly higher than molecular oxygen, to provide a viable diffusion driven oxygen transfer mechanism. However, based on the concentration and diffusion coefficient measured by two independent physical measures, fluorescence (216, 219) or NMR (220), the contribution of myoglobin diffusion to oxygen transport has been suggested to be <10% even under extreme conditions (203, 219, 220). One of the key aspects of the facilitated diffusion mechanism with myoglobin is that gradients in oxy-and deoxymyoglobin, as well as oxygen, need to exist for this passive facilitated pathway to contribute to oxygen distribution in the muscle cell. We will address this key measure, in vivo, below.
The normal venous po2 of the heart, depending on the impact of arterial-venous shunting (221), can represent an upper limit for the end capillary po2, which would put the oxygen tension well above the consensus affinity for cytochrome oxidase under most conditions (7). Indeed, taking the structure of the capillary system and assuming very simple Krogh type diffusion models (222, 223), it has been predicted that within the heart cell, the oxygen tension should greatly exceed the COX P50 for oxygen with a capillary to muscle cell gradient of only 1 or 2 Torr. However, several lines of evidence suggest that the tissue po2 may be much lower than the capillary geometry, venous po2, and models would imply. The initial evidence was with small oxygen-sensitive electrodes plunged into the tissue and recording the distribution of oxygen tensions over a large number of insertions (224). These results provided evidence that a significant fraction of the tissue was well below the po2 of the venous blood. The interpretation of these results ranged from selective barriers to oxygen at the capillaries (222, 225), capillary perfusion heterogeneity (226), and various measures in isolated perfused hearts with questionable extrapolation to in vivo conditions (227). Numerous studies have shown that the saline-perfused mammalian heart with this low-oxygen content but high flow rate, is hypoxic under most experimental conditions using a variety of techniques (228, 229). Since this review is focused on the in vivo condition, the saline perfused mammalian heart will not be considered further here.
Two independent studies in 1999 using noninvasive NMR (230) or optical spectroscopy (223) measures in the heart of the average myoglobin oxygenation, in vivo, detected little or no deoxymyoglobin under normal physiological conditions even approaching maximum workloads. With ischemia or low flow conditions, deoxymyoglobin was easily detected (223, 230). These independent studies supported two important conclusions: 1) that the average oxygen tension in the heart in vivo exceeded the oxygen P50 of myoglobin, consistent with earlier model predictions; and 2) that myoglobin facilitated diffusion of oxygen does not participate in oxygen distribution in heart muscle under normal conditions since no deoxymyoglobin was detected for a driving a diffusion gradient for oxy-myoglobin. These data suggest that the earlier invasive microelectrode studies were not reflecting the true average tissue oxygen tension while the saline perfused hearts were intrinsically oxygen deprived (224, 228, 229). However, under conditions where the capillary po2 drops, deoxymyoglobin is formed consistent with a potential role for myoglobin facilitated diffusion under these conditions. These observations are consistent with several models that suggested myoglobin facilitated diffusion would only occur under severe anoxic conditions (216, 231). These data also suggest that the heart was designed to supply all the oxygen the mitochondria need to support near maximal work without being oxygen limited.
More recently, genetic knockout experiments have demonstrated that the presence of myoglobin is not necessary for near normal function in the mouse (232, 233). This is particularly surprising in the mouse that operates within a factor of two of its maximum cardiac output while at rest suggesting it is operating near its maximum demand for oxygen nearly all the time (234). The degree of molecular adaptation to myoglobin knockout seems to be controversial with modifications ranging from changes in capillary density (233) and nitric oxide handling (235) to no change in capillary structure and protein expression in heart and skeletal muscle (194). Thus, if any modifications occurred in the myoglobin knockout mouse, they are likely small.
Based on these different lines of evidence, the role of myoglobin in the normal distribution of oxygen in the heart is believed to be minimal. Again, even at maximum workloads, there is little evidence that myoglobin plays a critical role in the delivery of oxygen across the heart (223, 230) even under hypertrophic heart conditions (236). These results coupled with new experiments on other roles of myoglobin have led to other hypotheses for the large investment in myoglobin protein in the mammalian heart (237) and oxidative muscle with the most prevalent being the metabolism of free radicals or nitric oxide (237–239). These new roles for the high concentration of myoglobin in the heart and skeletal muscle are currently an active area of research.
The fact that deoxymyoglobin has not been detected in the working heart in vivo suggests that the vascular-cellular geometry, together with the highly regulated coronary flow results in an oxygen tension in the cell that far exceeds the consensus affinity for oxygen for OxPhos. Thus it is our conclusion that oxygen is not rate limiting for energy conversion under most physiological conditions in the heart. This suggests that the extensive capillary network and regulation of blood flow is capable of keeping the cellular oxygen content well above the P50 of myoglobin and cytochrome oxidase under most conditions using pure oxygen diffusion mechanisms. A specialized system to support molecular oxygen delivery beyond the extensive capillary system does not seem to be necessary in the heart.
The putative oxygen facilitated diffusion system through myoglobin discussed above for the heart is also present to some degree in skeletal muscle fibers (240). Oxidative fibers contain large concentrations of myoglobin, albeit less than in the heart, capable of maintaining a viable diffusion driven oxygen transfer mechanism whereas glycolytic fibers are generally considered to have insufficient myoglobin for facilitated diffusion to contribute significantly (240). Unlike the cardiac tissue, deoxygenated myoglobin can begin to be detected in humans by NMR during exercise at ∼50% of maximal oxygen uptake (moderate exercise) (91, 201) implying oxy/deoxymyoglobin gradients may be present within the skeletal muscle cell. However, increasing the intensity of exercise in these NMR studies all the way up to 100% of maximal oxygen uptake either under normoxia or hypoxia did not lead to further deoxygenation of myoglobin. Although a similar NMR study did find progressive deoxygenation of myoglobin with exercise intensity (200), both groups reported ∼50% myoglobin deoxygenation during exercise at maximal oxygen uptake resulting in a calculated intracellular po2 of ∼3 Torr similar to the values obtained using biochemical methods (94). Even with the lower intracellular po2 compared with cardiac cells, the po2 values in skeletal muscle cells appear to remain above the threshold, which would begin to limit oxygen consumption by mitochondria (P50 <1 Torr) (93, 241–243). Indeed, in vivo spectroscopic measurements resolving myoglobin and hemoglobin individually in mouse skeletal muscle revealed that oxygen consumption was not limited by oxygen availability across the physiological range of intracellular po2 values (93) supporting the conclusion that oxygen does not play a regulatory role in skeletal muscle respiration under physiological conditions. Together with the lack of effect of myoglobin knockout on exercise capacity in mice (232), these data suggest that myoglobin does not play a significant role in oxygen distribution in skeletal muscle cells under normal conditions. However, further investigations into the myoglobin knockout mice have revealed an important role of myoglobin in nitric oxide signaling (244, 245), which supports the hypothesis that myoglobin may act as a protective shield for mitochondrial respiration by scavenging nitric oxide, a known inhibitor of cytochrome oxidase (246, 247).
In summary, current evidence suggests that the oxygen concentration gradients driving oxygen delivery through the striated muscle cell do not result in oxygen concentrations that become rate limiting for OxPhos under submaximal conditions in the heart or skeletal muscle. It should be stressed that a near maximum workloads, difficult to replicate in the laboratory (54), myoglobin-facilitated diffusion may contribute to oxygen delivery as direct measures of myoglobin oxygenation under conditions of maximum exercise-induced cardiac output, in vivo, have not been attained in contrast to contracting skeletal muscle (91, 200, 201).
3.2.2.2. creatine kinase.
Creatine phosphate (PCr) was one of the first “high energy” phosphate metabolites found in muscle (248, 249), and its breakdown with muscle contraction (248) and ability to support muscle action in the absence of glycolysis (250) supported the early notion that PCr could actually be the high energy molecule supporting muscle contraction. However, it quickly became apparent that PCr had these functional properties due its rapid exchange of high energy phosphate bonds with ADP creating the primary source of muscle contraction, ATP, through the reversible Lohman (251) reaction catalyzed by creatine kinase:
MgADP + PCr + H+ MgATP + Cr (Keq = 100: 1 mM Mg2, pH 7.0) (252)
This reaction is believed to be operating near equilibrium in heart and skeletal muscle based primarily on two independent measures: 1) The concentrations of reactants and cofactors (i.e., PCr, ATP, H+, Cr, and Mg2+) appear to be poised near the creatine kinase equilibrium (44, 253, 254); and 2) the unidirectional flux through this “dead end” (i.e., Cr and PCr are not rapidly used for any other reaction) measured using 31P-magnetization transfer methods, far exceeds the calculated ATP turnover rate (255–258). Thus ATP, ADP, Cr, and PCr are believed to be at near equilibrium concentrations in mammalian muscles under most experimental conditions. Additionally, creatine kinase is one of the most abundant proteins in the cytosol, although its concentration varies according to muscle fiber type (TABLE 3). With the high concentrations of creatine kinase, Cr, and PCr coupled with this rapid exchange process, it quickly became clear that the PCr pool could serve as a short term spatial and temporal “buffer” for ATP when ATP production could not keep up with ATP utilization (260). With [PCr] only exceeding [ATP] by twofold in heart (261) and fourfold in muscle (262), this buffer capacity is quite small considering that the turnover of ATP at high workload is only a few seconds in heart (263). Thus, for short temporal mis-matches in ATP production and utilization, the rapid creatine kinase reaction could maintain ATP (264) even with the net production of Pi reducing the free energy of ATP hydrolysis (265, 266).
Table 3.
Concentrations of creatine kinase in striated rabbit muscle. Values are µmol/L cell volume
| Protein | Soleus,* µmol/L cell volume | Gracilis,† µmol/L cell volume | Heart,† µmol/L cell volume |
|---|---|---|---|
| Creatine kinase | 10.4 | 20.6 | 7.0 |
*Rabbit soleus value from Illg and Pette (259). †Rabbit heart and gracilis calculated from relational proteome database using the abundance ratios of the sum of cytosolic creatine kinase isoforms.
Once the buffering power of PCr was realized to be minimal, another more sustained impact of creatine kinase on maintaining the spatial distribution of free energy in ATP was proposed by Bessman and coworkers in a series of papers (204–208) describing the creatine kinase shuttle where the topology of the creatine kinase enzyme at the mitochondria and the myofibrils facilitated the conversion of ATP + Cr to PCr + ADP at the mitochondria and PCr + ADP to ATP + Cr at the myofibrils. Due to the aforementioned higher concentrations of PCr when compared with ATP, and especially Cr when compared with ADP, this resulted in a potential for facilitated diffusion through the cytosol (267). That is, PCr facilitated the diffusion of the high energy phosphate bond from ATP created at the mitochondria to the myofibrils while the diffusion of the low energy substrate ADP, in micromolar concentrations, was greatly enhanced by the mM concentration of Cr. This proposal suggested that the creatine kinase reaction is not just a short-term buffer for high-energy metabolites but also plays a role in the distribution of the potential energy and reaction intermediates required for energy conversion in the muscle cell. The creatine kinase shuttle has been a major focus in muscle energetics since the Bessman proposal and has been the topic of numerous reviews (204, 263, 267–273), although many have questioned the extent of cytosolic energy distribution dependent on this shuttle, especially in the heart, for various quantitative and experimental considerations (203, 267, 271, 274–277).
Numerous investigators have repeated the classical work of Jacobus and Lehninger (278) demonstrating that isolated muscle mitochondria will preferentially generate PCr when given ADP, Pi, and creatine at reasonable physiological concentrations (279). This is a fundamental element of the creatine kinase shuttle that ATP is converted to PCr at the mitochondria and both the ATP and PCr are available for diffusion through the cytosol in a parallel path. There is a muscle creatine kinase isoform in the mitochondrial intermembrane space to perform this task (280, 281). At the myofibrils, the creatine kinase converts the ADP generated by the contractile and ion transport ATPase to Cr. Due to the equilibrium of the creatine kinase reaction, most of the ADP will be rapidly transferred into Cr providing a potentially large gradient in Cr from the ATPase sites to the mitochondria to be used in the mitochondrial creatine kinase reaction. Although this is an attractive theory, and simply based on facilitated diffusion arguments (267) should supplement the distribution of energy across the muscle cell, several observations bring the net importance of this process into question. In the heart, over large variations in workload in vivo, there were little or no changes in PCr concentration ([PCr]) or by mass balance arguments Cr concentration ([Cr]), until near maximum cardiac workloads were attained (50, 282–288). No changes were also observed transiently with work jumps (282). Diffusion, or a metabolite shuttle, relies on changes in the concentration gradients of the metabolites to change the rate of flux. Since [Cr] and [PCr] do not change significantly over physiological workload in heart, in vivo, this suggests that alterations in these facilitated diffusion pathways are not playing a dynamic role in matching the rate of ATP production with ATP utilization as first predicted by Hill (34). A more likely hypothesis is that the energy distribution system of the cell greatly exceeds the energy requirements throughout the cell below Vmax without requiring significant changes in steady state concentrations of any metabolite. However, as maximum workloads are approached, numerous systems become limiting from blood flow to energy conversion (9–11).
Another line of in vivo evidence against a baseline role for the creatine kinase shuttle mechanism of energy distribution has been the evaluation of different types of creatine kinase (289–295) or creatine (274) knockouts in mice. The mouse provides an excellent model for evaluating energy distribution in the heart due to its remarkably high baseline metabolic rate (89, 234) setting energy demands near maximum even at rest. Creatine kinase knockout studies have revealed very modest changes in the performance or protein programming of these animals suggesting a potentially secondary role of creatine kinase shuttle in supporting energy distribution in the mammalian striated muscle system. This conclusion is strongly supported by the recent review from the Dr. Weiss laboratory that concluded: “…….31P MRS studies in CK-deficient hearts suggest that CK does not play an obligate intracellular transport role in the normal mouse heart and that its presence is not critical for baseline contractile function in normal hearts.” (275). We agree with this conclusion based on theoretical concerns and the experimental results including biophysical measures and genetic knockout experiments.
3.2.3. An alternative to metabolite facilitated diffusion: the muscle mitochondrial reticulum.
As discussed above, the concept that facilitated diffusion of metabolites or oxygen supporting normal muscle function has been challenged over the last several decades based on theoretical ground, genetic modifications and the observation of a metabolic homeostasis of the metabolites involved. Another possible mechanism to rapidly distribute energy across the cell from OxPhos is the mitochondrial reticulum with its high conductance only requiring small gradients in potential energy throughout the cell (169, 296). Thus the actual structure of the mitochondrial network may provide an additional mechanism for intracellular distribution of potential energy within the muscle cell. The following sections will address our current understanding of muscle mitochondrial network structure and several remaining questions surrounding how the mitochondrial reticulum may contribute to and regulate cellular energy distribution in striated muscle.
3.2.3.1. initial observations of muscle mitochondrial structures.
Mitochondria in striated muscle were first visualized roughly 180 years ago by Schwann (297) and Henle (298) who each described them as “granules” located between the myofibrils as well as near the nuclei (FIGURE 4A) of skeletal muscle cells. The description of these interstitial granules was extended by Kolliker (305, 306) who found that they varied across different species and muscle types in addition to demonstrating their capacity for swelling under different osmotic conditions and speculating a relationship with metabolism. Knoll (307) provided perhaps the most detailed descriptions of interstitial granules within cardiac muscle cells around this time, demonstrating the alignment of many granules between the myofibrils in a variety of species. In 1890, the terms “bioblast” and “sarcosome” were coined by Altmann (308) and Retzius (309), respectively, to describe what are now known as mitochondria in the muscle, with Altmann considering the bioblast to have metabolic and genetic autonomy within the cell. The term mitochondria was coined by Benda in 1898 (310) to describe both the thread-like and granular nature he observed for these organelles, and soon after mitochondria, bioblasts, and sarcosomes were all confirmed to be the same as the granules initially described by Schwann (311, 312). However, the term sarcosome persisted into the 1960s (313–315) and was sometimes described as a separate structure from mitochondria (316). It is also interesting to note that many investigators in this era believed that mitochondria could transform directly into myofibrils, although this was largely attributable to nonspecificity of the staining techniques used at the time (317). Overall, the early studies up through 1920 found that mitochondria in striated muscles were generally located around the nuclei, between the myofibrils along the anisotropic (A)-bands, and/or at the end of each sarcomere in the isotropic (I)-band region of the muscle fiber with A-band mitochondria being the predominant type in oxidative and cardiac muscle and I-band mitochondria more abundant in glycolytic muscle types.
FIGURE 4.

A visual history of muscle mitochondrial reticulum structure. A: interstitial granules within a muscle cell imaged through a light microscope in 1839 (297). B: cross-sectional 2-dimensional image of the mitochondrial reticulum in rat diaphragm oxidative muscle imaged by transmission electron microscopy (TEM) in 1966 (322). C: 3-dimensional (3-D) rendering of the rat diaphragm oxidative muscle mitochondrial reticulum imaged by serial section TEM in 1978 (299). D: scanning electron microscopy (SEM) image of the rat hindlimb oxidative muscle mitochondrial reticulum from 1985 (300). CN, thin mitochondrial column; IM, I-band limited mitochondria; Z, Z-disk. E: high-voltage TEM projection image of rat hindlimb muscle mitochondrial reticulum in 1986 (301). F: 3-D rendering of horse muscle mitochondrial reticulum imaged by serial section TEM in 1988 (302). G: 3-D rendering of the oxidative mouse muscle mitochondrial reticulum imaged by focused ion beam (FIB)-SEM in 2015 (169). H: 3-D renderings of the mitochondrial reticulum in glycolytic (left), oxidative (middle), and cardiac (right) mouse muscles imaged by FIB-SEM in 2018 (303). IFM, intrafibillar mitochondria; PVM, paravascular mitrochondria. I: 3-D rendering of the human oxidative muscle mitochondrial reticulum imaged by FIB-SEM in 2019 (304).
3.2.3.2. origins of the muscle mitochondrial reticulum.
Though little attention was paid to muscle mitochondrial structure in the 1920s, 30s, and 40s, the advent of histochemical staining (318, 319) and electron microscopy (320) together with new methods to isolate mitochondria for functional testing (315, 321) brought muscle mitochondria back into focus in the 1950s. Andersson-Cedergren (322) provided the first look at muscle mitochondrial structure in 3-D in 1959 by using serial section electron microscopy. However, she focused primarily on the motor end plate region of a mouse intercostal skeletal muscle where mitochondria appeared as individual, globular shapes. The initial notion of a mitochondrial reticulum, or network, in skeletal muscle was reported by Bubenzer in 1966 (323) where he showed using 2-D transmission electron microscopy (TEM) that the thin (likely oxidative) fibers of the rat diaphragm contained mitochondrial grids around the sarcomeric I-bands (FIGURE 4B), which were connected through longitudinal mitochondrial tubules along the A-band to form what he proposed was a 3-D mitochondrial framework. Furthermore, Bubenzer showed a fiber type dependence of the mitochondrial network structure as the thicker (likely more glycolytic) fibers of the diaphragm contained smaller grids of mitochondria around the I-bands with fewer connecting mitochondrial tubules along the A-bands. It was around this time that Skulachev first proposed the hypothesis that energy could be transported throughout the cell along mitochondrial membranes in the form of the mitochondrial membrane potential (324). The idea of mitochondria as electric power transmitting cables was suggested to be of particular importance in large cells with “giant” mitochondria, which could cover distances on the scale of cell sizes. In mammalian systems, the muscle fiber was considered likely to contain the proposed electrically coupled mitochondrial energy distribution system due to the large diameter of muscle fibers, the very high-energy demands to be met, and the presence of what appeared in 2-D images to be highly connected networks linking the round mitochondria near the sarcolemma to the more grid-like mitochondrial profiles in the intrafibrillar space (325).
To confirm that mitochondria formed three dimensional networks in rat diaphragm muscle as suggested by the 2-D images of Bubenzer, Skulachev’s group (299) stitched serial section electron microscopy images together in 1978 to provide the first 3-D look at intrafibrillar muscle mitochondrial structure. Indeed, in this seminal work, they confirmed Bubenzer’s suggestions of highly connected mitochondrial networks in the rat thin diaphragm fibers and also showed that these networks could span across the entire cross-sectional diameter of the cell. Moreover, they found that the mitochondrial reticulum of the rat diaphragm contained many intermitochondrial junctions between the inner and outer mitochondrial membranes of adjacent mitochondrial profiles and suggested that electrical conductivity may propagate across these structures analogous to gap junctions. It was further suggested that these junctions may act as regulatory sites of conductivity within the network and may prevent spreading of de-energization throughout the network in response to localized damage. However, the tools to test these many of the newly generated hypotheses were lacking at the time in addition to scarce technology available to visualize the 3-D mitochondrial structures. In fact, all mitochondrial structures were transposed on to dental wax models and photographed to make the 3-D figures for that paper (FIGURE 4C) which, in several cases, made it difficult to fully appreciate the connectivity and complex shapes within the mitochondrial reticulum. Soon thereafter, Skulachev’s group (326) used a similar serial section approach to report that all of the mitochondria within cardiomyocytes were connected through intermitochondrial junctions into a singular mitochondrial reticulum again suggesting that this would allow for cell-wide transmission of electrical potential energy. Furthermore, they demonstrated that mitochondria often appeared physically coupled across the cell membranes at gap junction sites between cardiomyocytes further speculating that the putative intracellular power transmission system could extend across cells through these regions. Many of Skulachev’s original hypotheses regarding the distribution of energy through mitochondrial networks would eventually be tested further once the appropriate technology was developed and will be discussed further below.
Several years later, Ogata and Yamasaki (300) took a different approach to visualize muscle mitochondria in 3-D by using scanning electron microscopy (SEM) on samples from rat hindlimb red, white, and intermediate muscle fibers where the contractile apparatus had been chemically dissolved away after fixation (FIGURE 4D). While this SEM approach did not allow for quantification of 3-D mitochondrial structures, the striking images clearly showed the fiber type dependency of mitochondrial network connectivity in mammalian hindlimb muscles. Mitochondrial tubules in the intrafibrillar regions were connected across both the parallel and perpendicular axes in the red (oxidative) muscle and were limited to primarily the perpendicular axis in the white (glycolytic) muscle whereas in the intermediate muscle characteristics fell in between as the name would imply. The specific distribution and content of mitochondria in the striated muscle cell was also recognized as a potential source of different muscle disorders, specifically in ragged red fiber disease (327). The fiber type dependency of mitochondrial reticulum structure was additionally supported using high-voltage electron microscopy to create projection images of thick (∼0.5 µm) muscle sections (328, 329) allowing for quantitative analyses of surface area and volume in these pseudo-3-D images (301, 330) (FIGURE 4E). Using this technique, the Brooks laboratory (301, 330) also demonstrated that rat hindlimb muscle mitochondrial networks were responsive to environmental conditions as elevated metabolic activity through endurance exercise training resulted in a large increase in the size of the mitochondrial reticulum. Conversely, Kayar et al. (302) in the Weibel laboratory used serial section electron microscopy in 1988 (FIGURE 4F) to show that while the subsarcolemmal and intrafibrillar mitochondria were directly connected in horse hindlimb muscle, they did not find evidence of a highly connected mitochondrial reticulum throughout the entire cell. These authors pointed out that caution should be taken in modeling oxygen utilization given this structure and “……we need more information, particularly including a quantitative estimate of mitochondrial connectivity, before it is possible to construct a comprehensive model for cellular level aerobic respiration.” We completely agree with these concerns raised in 1988. This latter study, as well as the dearth of available 3-D visualization tools and the prevalence of 2-D images of circular mitochondrial cross sections all likely contributed to the lack of wide acceptance of a highly physically connected muscle mitochondrial reticulum around this time.
3.2.3.3. recent investigations into the muscle mitochondrial reticulum.
There were relatively few studies examining muscle mitochondrial network structure during the 1990s and the early 2000s (331). However, the emergence of mitochondria as sometimes dynamic organelles (332, 333), the adaptation of fluorescent proteins to tag and track specific cellular molecules (334, 335), and the commercial availability of confocal and multiphoton light microscopes all converged to bring a new wave of interest into mitochondrial structure in all cell types, including muscle (336–339). In 2010, both mitochondrial fission (division) (340) and mitochondrial fusion (341) were shown to regulate individual mitochondrial morphology as well contribute to maintaining normal skeletal muscle contractile function using transgenic mouse approaches. Subsequently, fission and fusion proteins were also found to be essential for maintaining mitochondrial morphology, respiratory capacity, and contractile function in the heart (342, 343). Yet, it still remained unclear exactly how dynamic mitochondria actually were in striated muscles due to the physical constraints set in place by the surrounding contractile apparatus. Application of transgenic photoactivatable fluorophores to mouse muscle mitochondria by several groups soon followed (344–349) and allowed for demonstration of matrix content exchange by dynamic mitochondria in live cardiac and skeletal muscle fibers. However, the rates of mitochondrial fission and fusion reported in striated muscle in vivo were orders of magnitude slower than previously shown in other cell types in culture often requiring up to 30 min to detect any dynamic changes in mitochondrial morphology (345, 346). For example, the rate of mitochondrial fusion in adult rat muscle fibers was shown to be more than 10-fold slower than in rat myotubes while the rate of mitochondrial fission in the adult fibers was an additional 3-fold slower than the rate of fusion (344). Indeed, the expression levels of mitochondrial dynamics proteins involved in fission, fusion, and motility are all downregulated in mature muscles relative to cultured myotubes as well as neonatal muscle in the mouse (133, 135). Overall, the studies of mitochondrial dynamics in healthy, mature striated muscle to date reveal a structurally stable network with the impact of mitochondrial fission and fusion on muscle function likely due to the importance of mitochondrial dynamics as a chronic or developmental process, rather than acute, adaptation toward maintaining mitochondrial quality control in muscle (350–355). However, dysfunctional mitochondrial dynamics processes may play a critical role in pathological states such as with mtDNA deletions, mitochondrial myopathies, and aging among others (346, 356–358).
The morphological differences between mitochondria interspersed between the myofibrils and mitochondria in the subsarcolemmal regions near capillaries and nuclei have been discussed since the earliest studies on muscle mitochondrial “granules” (297, 298). However, there has recently been renewed focus on the connectivity of mitochondria between these two regions of a muscle fiber. Picard and colleagues (359) used SEM to show qualitative differences between subsarcolemmal and intermyofibrillar mitochondrial structures as well as performed a rigorous quantitative analysis of 2-D TEM images reiterating the physical connectivity between the two mitochondrial populations as described by earlier studies (301, 323). This group also reiterated the need to separately analyze the vastly different mitochondrial structural appearances between longitudinal and transversely cut 2-D sections and showed that interactions between mitochondria increase after a 3-h exercise bout without a change in expression of fusion proteins (360). The following year, the Prats group (361) used light microscopy image deconvolution to demonstrate the fiber type dependency of the 3-D human muscle mitochondrial network in agreement with a previous SEM study (331). Furthermore, they used focused ion beam-scanning electron microscopy (FIB-SEM) to visualize the direct continuity of individual mitochondria from the subsarcolemmal to the intermyofibrillar space. Thus human muscle mitochondria (361) had similar morphological characteristics and connectivity to previously published rodent muscle data using scanning block face scanning electron microscopy, although the mitochondrial data was not discussed in the earlier study which focused on the neuromuscular junction (see Video S1 from Ref. 362).
Around this same time, we found that the large pools of many mitochondria located near the cell periphery were always associated with capillaries that embedded into persistent grooves (FIGURE 3) in the sarcolemma of the mouse muscle fiber by using 3-D multiphoton microscopy on live mice (194). Accordingly, we chose to describe these large pools as paravascular mitochondria rather than subsarcolemmal mitochondria due to the more descriptive nature of the term as well as the fact that there are many mitochondria that are located just under the sarcolemma but not within a large pool of mitochondria and instead are in direct contact with the myofibrils appearing to be structurally the same as intermyofibrillar mitochondria. The large paravascular pools of mitochondria appeared to taper and get smaller in diameter when moving away from the capillaries and often stretched as far as 50 µm from the nearest vessel (194). Thus there was a significant fraction of mitochondria located near the cell periphery that were as far away from a capillary as the mitochondria in the middle of the interior of the muscle fiber arguing against the notion that mitochondria are placed near the sarcolemma primarily for oxygen diffusion reasons. As a result, we hypothesized that mitochondria were functionally coupled throughout these large pools with the energetic advantage of being near the capillary shared across the entire pool through conduction of the mitochondrial membrane potential similar to Skulachev’s proposal nearly 45 yr earlier (324). Indeed, we followed a similar path to Skulachev by next performing 3-D electron microscopy studies to assess muscle mitochondrial connectivity but with the benefit of several decades of technological advances. Structurally, we also found a highly connected mitochondrial reticulum comprised of many mitochondria aligned both parallel to the muscle fiber between the myofibrils and perpendicular to the muscle fiber surrounding the I-bands (169) (FIGURE 4G). Moreover, roughly one-fifth of the paravascular mitochondria were directly connected to the interior of the cell through projections into the intermyofibrillar space, and nearly all mitochondria in both regions of the cell were connected to adjacent mitochondria through intermitochondrial junctions. While this work confirmed the structural connectivity of the muscle mitochondrial reticulum, it remained unknown whether physically connected skeletal muscle mitochondria were indeed functionally connected. Skulachev’s group (363) had reported in 1988 that damaging a single mitochondrion in cultured neonatal cardiomyocytes could lead to depolarization of the membrane potential of adjacent mitochondria within a physically connected cluster; however, it was unclear how these in vitro results would translate to mature muscle fibers within an animal.
To test the functional connectivity of the mitochondrial reticulum in adult muscle fibers, we utilized a photoactivatable, mitochondrial specific depolarizing agent, MitoPhotoDNP, which had been developed a few years earlier (364). MitoPhotoDNP is named after its three constitutive parts: 1) a lipophilic cation, triphenylphosphonium, which ensures the probe concentrates in the cell according to voltage and, thus, into the mitochondria; 2) a mitochondrial depolarizing agent, 2-4-dinitrophenol (DNP), which is inactive when linked to MitoPhotoDNP; and 3) a nitrobenzyl photocleavable linker, which cages the active DNP until exposed to ultraviolet (UV) light. Combining MitoPhotoDNP with a fluorescent mitochondrial membrane potential marker, tetramethyl rhodamine methyl ester (TMRM), allowed for spatially controlled depolarization and simultaneous assessment of the mitochondrial membrane potential in freshly isolated adult mouse soleus fibers (169). Exposing only the interior of the muscle fiber to low level UV light resulted in depolarization of not only the mitochondria in the interior but also uniform depolarization of the mitochondria near the cell periphery. The depolarization of the mitochondrial membrane potential in the UV irradiated and adjacent regions occurred as fast as we could image the muscle fibers (∼300 ms) implying that mitochondria within the two regions were functionally connected through electrical conduction. These results (169) suggested that the physically connected mitochondrial reticulum in skeletal muscle was capable of rapid distribution of electrical energy through conduction of the mitochondrial membrane potential just as Skulachev (324) had hypothesized five decades earlier. A follow-up study using a similar approach in cardiomyocytes yielded comparable results showing that mitochondria in the paravascular, paranuclear, and intrafibrillar regions were all connected through intermitochondrial junctions and that these networks also appeared capable of rapid distribution of the mitochondrial membrane potential (167).
Electrical connectivity of mitochondrial networks offers significant advantages for cellular energy distribution compared with simple or facilitated metabolite diffusion, particularly regarding speed (365). However, just as with man-made networks like the electrical power grid or internet, connectivity also creates vulnerability [e.g., lightning strikes, hackers, viruses, etc.), Skulachev proposed in 2004 (333)] that a mitochondrial thread-grain transition, i.e., mitochondrial fission, provided a mechanism to reduce the spread of dysfunction throughout a connected mitochondrial reticulum. However, the mitochondrial structural transitions that were shown in cell culture in that study took 45 min to 8 h to complete. For cells with high-energy turnover such as skeletal and cardiac muscle, significant dysfunction for that length of time could be devastating. We investigated the protection mechanisms within the mitochondrial reticulum of heart and skeletal muscle cell by using MitoPhotoDNP to create dysfunction (depolarization) in the center of the cell, but instead of looking at the immediate (within 1 s) response to assess electrical connectivity as we had previously (169), we focused on the secondary events occurring in response to persistent dysfunction (167). Within 5–10 s after the initial shared depolarization of the membrane potential between the irradiated and adjacent regions of the mitochondrial reticulum, the two regions became electrically distinct. The irradiated region continued toward full depolarization while the adjacent region of the mitochondrial reticulum quickly recovered its membrane potential to baseline levels. Thus, in addition to suggesting that the initial shared depolarization was not simply the result of diffusion of DNP or TMRM, these results demonstrated that the muscle mitochondrial reticulum has a reactive protection mechanism that is similar to a circuit breaker or fuse in an electrical circuit (FIGURE 5, A–F). After sharing the brunt of the initial dysfunction throughout the network (FIGURE 4E), the damaged region is quickly separated allowing the undamaged portion to return to supporting cellular energy demands (FIGURE 5F). The rapid nature of the electrical separation mechanism may explain why localized microflow of mitochondrial uncoupler, FCCP, did not previously reveal connectivity of mitochondrial networks when imaged at 5- to 7-s intervals (366). Despite occurring much faster than the thread-grain transition shown by earlier by Skulachev (333), we also hypothesized that the physical mechanism for the rapid electrical separation of the mitochondrial network occurred through mitochondrial fission. Because depolarization resulted in the loss of TMRM signal, we were unable to observe the physical response of mitochondria in the damaged region in our original experiments. Thus we combined the use of MitoPhotoDNP with the transgenic photoswitchable mitochondrial fluorophore MitoDendra2 (347), to perform an experiment where photoactivation not only depolarizes mitochondria but also changes their fluorescence from green to red allowing separate structural tracking of the depolarized and nondepolarized mitochondria. Depolarization of mitochondria in the interior of the cell resulted in a physical separation of damaged mitochondria from the healthy portion of the network and a morphological change from elongated to more spherical mitochondria starting after ∼30 s (167) (FIGURE 5, B and C). However, the use of fission inhibitors, mdivi-1 (367) and dynasore (368), did not prevent the physical separation and condensation of damaged mitochondria. Closer inspection of the remodeling of the damaged mitochondria revealed that there were actually fewer and larger mitochondria upon completion of the restructuring, which is the opposite of mitochondrial fission. Due to the 2-D nature of the images, we were unable to determine whether mitochondria were merging (fusion) or simply condensation or retraction of irregular, elongated structures was occurring. Since mitochondria do not have significant levels of structural proteins or macromolecules, the shape of mitochondria is likely dictated by the cell cytoskeleton molding the mitochondria into the complex shapes observed (167). We speculated that these “tether points” could be released on damaged mitochondria resulting in the formation of their intrinsic spherical shape and also removing them from the reticulum network (167).
FIGURE 5.

Muscle mitochondrial network protection system. A: schematic of the putative electrical and physical disconnection processes upon localized damage to the muscle mitochondrial reticulum. B and C: 3-dimensional renderings of the connected (green) and disconnected (red) regions of the muscle mitochondrial reticulum upon localized depolarization in a MitoDendra2 mouse muscle fiber and cardiomyocyte, respectively. D: raw membrane potential voltage image from a mouse soleus muscle fiber before depolarization. E: post/preratiometric image of mitochondrial membrane potential voltage immediately after localized depolarization in the middle of cell from D. Dark signal indicates decreased voltage. F: post/preratiometric image of mitochondrial membrane potential voltage 55 s after localized uncoupling showing continued depolarization in the irradiated region and repolarization back to baseline in the adjacent regions. All images adapted from Ref. 167).
Subsequently, a fission-independent mitochondrial shape transition has been described in other cell types (369). This calcium- and Miro1-dependent mitochondrial shape transition is likely similar to that observed upon regional depolarization within the muscle mitochondrial reticulum, and thus, the Miro-Trak-kinesin complex, which can link to microtubules may provide a mechanistic basis for mitochondrial retraction. Other proteins that have been implicated in the association of mitochondria with the myofibril structures include desmin (intermediate fibers) and plectin (370–372), but the dynamic regulation of this process is unknown. Accordingly, the response to localized damage within the mitochondrial reticulum occurs in two sequential steps. Because mitochondrial fission does not seem to be the physical mechanism for either step, it appears likely that modulation of the intermitochondrial junctions is occurring where first, the junction is functionally closed, and second, the adjacent mitochondria physically separate. The ability to quickly open and close intermitochondrial junctions would provide protection against transient local dysfunction without the cost of physically remodeling the network. Indeed, transient depolarization and repolarization of individual or groups of mitochondria in muscle cells have been widely shown (373–375). Moreover, O’Rourke and others (376–381) have reported that synchronized, cell-wide oscillations in membrane potential and other energetic intermediates can occur in cardiomyocytes along with regions of heterogeneous membrane potential. These perturbations in membrane potential have been found to increase in likelihood during periods of oxidative stress such as hypoxia (381), nutrient deprivation (380), or diabetes (370). This propensity of mitochondrial networks to depolarize in a synchronized manner has been termed mitochondrial criticality and is often tested by monitoring the response of adjacent mitochondria to localized laser-induced depolarization. However, despite the similar design to the MitoPhotoDNP experiments described above, the cell-wide oscillations in membrane potential in these experiments generally occur after a delay and in a wave-like manner attributed to diffusion of reactive oxygen species or calcium (370, 376–380). While it is possible that exposure of cells to MitoPhotoDNP increases the criticality so much that the delay in depolarization is no longer measurable at the speed of confocal microscopy, it may be more likely that the at least order of magnitude faster response to localized depolarization by MitoPhotoDNP may be assessing a different phenomenon than that observed after photodamaging mitochondria. Implementation of faster imaging strategies such as structured illumination microscopy (382) for future MitoPhotoDNP experiments may resolve some of these issues. Notwithstanding the technical differences in methodology, both approaches demonstrate that clusters of many adjacent mitochondria can respond synchronously to localized perturbations and that the connectivity among functionally coupled mitochondria can be dynamic in nature dependent on cellular conditions (167, 379). However, further investigation is warranted to elucidate the precise molecular and physical mechanisms by which acute mitochondrial network connectivity is regulated in striated muscles.
Recently, development of improved analytical platforms has allowed for more rigorous quantitative comparisons of high resolution, 3-D muscle mitochondrial structures among different cell types in both humans and mice (303, 304, 383) as Weibel had called for 30 yr earlier (302). Bleck et al. (303) adapted the connectomics approach used for assessing neuronal connections (384) to develop an analytical framework geared toward high-throughput assessment of the 3-D interactions among mitochondria and other organelles within the cell. This subcellular connectomics approach was validated by assessing mitochondria in adult mouse glycolytic, oxidative, and cardiac muscle fibers (FIGURE 4H) and showed that mitochondrial structure appears to be tailored to support cellular goals at the network, individual mitochondrial, and mitochondrial interaction levels. Furthermore, quantitative assessment of organelle interactions suggested mitochondria can be specialized for different purposes even within the same network as mitochondria connected to lipid droplets were structured to better facilitate energy distribution throughout the cell whereas nonlipid droplet mitochondria had higher surface area-to-volume ratios and more interactions with the SR suggesting an increased capacity for calcium cycling. Picard’s group (383) assessed muscle mitochondrial structures from human patients and found that people with mitochondrial DNA diseases exhibit morphological changes in mitochondria compared with controls. They also reported that human muscle mitochondrial structures are largely different than those found in rodent muscles as the human muscle were not very connected and had many thin mitochondrial nanotunnels. However, they did not control for fiber type differences, which greatly affect mitochondrial network and individual mitochondrial structures (303), and stress associated with the biopsy procedure (385, 386) could explain the prevalence of nanotunnels (387). Indeed, the Subramaniam laboratory, in collaboration with Ferrucci’s group, recently reported human muscle mitochondrial structures (388) (FIGURE 4I), which were very similar to the mouse muscle mitochondrial structures previously visualized by the same FIB-SEM system (169) as well as the rat diaphragm structures from 40 yr earlier (299). In the study by Caffrey et al. (388), the muscles were fixed immediately after a carefully vetted biopsy procedure to ensure maintenance of normal muscle structure. In fact, mitochondrial nanotunnels, a marker of cell stress (387), were seldom observed and two types of mitochondrial networks were shown, which appear to represent oxidative and glycolytic muscle types. Thus muscle mitochondrial networks in humans and rodents appear remarkably similar in well-preserved specimens when controlled for fiber type differences. It is possible, however, that muscles with highly specialized functional demands due to anatomical location (e.g., extraocular) or in specific mammalian species may arrive at slightly different optimal mitochondrial configurations, although this remains to be tested.
It is also important to note that the classical use of isolated mitochondria from striated muscle generally creates 0.8- to 1-μm spheres of mitochondria that do not correlate with the complex structures observed in 3-D living cell superresolution optical studies or fixed electron microscopy outlined above. This again is consistent with the lack of structural proteins in the mitochondria, that they revert to simple spheres consistent with the hydrophobic effect, and the notion that the complex mitochondrial shapes in the intact cell are the result of interactions with the cellular cytoskeleton. The small, spherical isolated mitochondria imply that what is being studied in isolated mitochondria are fragments of the large structures. Thus they were likely once open to the isolation medium and then resealed to generated the “tight” membrane structures. However, it is likely that the fidelity of isolated mitochondria to the intact mitochondria is low and extrapolations to the complex intact system are difficult. As the composition of mitochondrial regions within the muscle cell may also be different, concerns arise with regard to the selection of regions by the isolation process. Since mitochondrial isolation always yields a just a fraction of total mitochondria, it begs the question as to whether all of the cytoskeleton-linked regions are retained similarly by the “bulk” tissue isolation procedures. In other words, do different regions contribute differentially to the isolation? While isolated mitochondria may be useful for first principles of function, their relevance to the function and control of mitochondria in the intact muscle cell is limited.
3.2.3.4. comparison of metabolite diffusion and mitochondrial reticulum conduction.
Can the capacity of the mitochondrial reticulum to electrically distribute potential energy be estimated relative to metabolite diffusion? TABLE 4 presents estimates of the driving forces for diffusion or mitochondrial conduction for a 10% gradient of metabolites or voltage. The 10% value was selected as this is likely the measurement threshold for biochemical assays in intact cells. The ATP flux associated with these 10% gradients was calculated assuming 1 ATP per ATP, ADP, Pi, PCr, or Cr arriving from metabolite diffusion while the equivalent charge associated with 4H+ was required to generate 1 ATP. Excellent data on the diffusion coefficients for most of the metabolites involved in energy metabolism is readily available, and the 3-D structure of the mitochondrial and cytosolic volume permits normalization of the space available for diffusion or mitochondrial conduction. Data on passive conductance of membrane structures on the scale of mitochondria are provided from early neuroscience studies. The transfer accessible cross section per cell was estimated by measuring the mitochondrial volume for mitochondrial cross section while all of the nonmitochondrial volume was assumed available for metabolite diffusion.
Table 4.
The driving forces for diffusion and conduction within striated muscle cells
| Metabolite | Concentration,a mmol/L Cell Water) | Effective Diffusion Coefficient,c µm2/s (37°C) | Transfer Accessible Cross Section, per cell µm2 | 10% Driving Force Flux, ATP mM/s | Estimated Maximum Oxidative Capacity, ATP mM/s |
|---|---|---|---|---|---|
| Heart | |||||
| ATP | 9 | 510 (389) | 380f | 1.21 | 16.6 |
| PCr | 18 | 640 (389) | 274 | 4.20 | |
| ADP | 0.010 | 510 | 380 | .0013 | |
| Cr | 5 | 640d | 274 | 1.17 | |
| Pi | 0.7 | 860e | 380 | 0.16 | |
| Mito Ret (K+Cl–)b | 280 mM 180 mV |
2,470b [93 µ2/s/mV]b |
106 | 652 [1,105]j,k |
|
| Slow-twitch muscle | |||||
| ATP | 5 (262) | 510 | 706g | 0.36 | 1.3 |
| PCr | 16 | 640 | 600 | 1.70 | |
| ADP | 0.011 | 510 | 706 | 0.0008 | |
| Cr | 7 | 640 | 600 | 0.75 | |
| Pi | 6 | 860 | 706 | 0.73 | |
| Mito Ret | 280 mM 180 mV |
2,470 [93 µ2/s/mV]b |
106 | 652 [1,105] |
|
| Fast-twitch Muscle | |||||
| ATP | 8 (262) | 510 | 7,854h | 0.05 | 0.2 |
| PCr | 32 | 640 | 7,697 | 0.27 | |
| ADP | 0.008 | 510 | 7,854 | 0.00005 | |
| Cr | 7 | 640 | 7,697 | 0.06 | |
| Pi | 0.8 | 860 | 7,854 | 0.009 | |
| Mito Ret | 280 mM 180 mV |
2470 [93 µ2/s/mV]b |
157 | 440 [746] |
|
Estimated using the following conversions for the in vivo heart summarized by Aliev et al (390) depending on the reporting parameters: 214 g dry mass/kg wet weight, 2.7 mL cell water/g dry mass. bIt is assumed that the major conductance of the mitochondrial reticulum is due to K+-Cl−; this likely represents an underestimate of the total conductance. The K+ conductance, using the data from Hodgkin and Keynes (391) for K+ diffusion and mobility corrected for temperature from 18° to 37° C (1.9 × D18= D37) (392). It is assumed that Cl− has a similar conductivity to K+ (392). J = –D(ΔC/Δx) J = –Cu(ΔC/Δx); u, mobility; C, concentration. cDiffusion coefficients (D) were corrected for temperature using the following relationship determined in solution 1.6 × D25 = D37 (389). dAssuming same as PCr (267). eAssuming 90% of free water diffusion (389). fCytosolic volume participating in process. ATP, ADP, and Pi assumed to be in rapid exchange with mitochondrial volume due to transporters. PCr and Cr diffusion assumed to be limited to cytosolic space. Mitochondrial reticulum is the mitochondrial volume assuming the mitochondria are coupled electrically. Mouse heart data used for this calculation: heart cell diameter is 22 µm with cross-sectional area of 380 µm2, 28% mitochondrial volume so diffusional surface area for cytosol metabolites is 274 µm2 while the mitochondrial conductive cross section is 106 µm2. gAssumed slow twitch fiber has diameter of 30 µm with 15% mito content. hAssumed fast twitch fiber has diameter of 100 µm with 2% mito content. iThe flux driven by a 10% gradient in metabolites/potential well within most physiological measures. jCalculated using 18 mV driving force (10% of the assumed 180 mV mitochondrial membrane potential). kCharge (H+) to ATP ratio estimated as 4:1. lBased on specific power calculations above. Fast- and slow-twitch rates derived from human tibialis anterior maximal OxPhos flux (393) assuming 75% slow-twitch and 25% fast-twitch fiber type composition (394–396).
These estimates suggest that the conductive pathway in the mitochondrion far exceeds the capacity of any metabolite diffusion pathway, suggesting that the conductive pathway, simply based on these physical constraints, would dominate the energy distribution process. The mitochondrial conductive pathway scales with mitochondrial content increasing from gracilis to soleus to the heart cell. It is important to note that the calculated high flux through the mitochondrial reticulum with very small driving forces implies that the mitochondrial reticulum can explain the ability of the tissue to effectively maintain its potential energy in the face of large changes in energy demand in the cytosol. It is also important to note that membrane potential “communication” through the reticulum is reciprocal permitting the regions utilizing the membrane potential to generate a modest ΔΨm decrease throughout the network. Indeed, if the membrane potential generating systems in complex I, III, and IV were sufficiently sensitive to ΔΨm, on the order of the flux dependence on the ΔΨm estimated above, then this retrograde signal could also increase the generation of ΔΨm providing the rapid feedback mechanism to generate a metabolic homeostasis with modest changes in free energy as observed in vivo. The evaluation of the impact of ΔΨm alone on complex I, III, IV, as well as V needs to be quantitatively evaluated, preferably in intact systems to evaluate this signaling hypothesis.
3.2.3.5. distribution of oxidative phosphorylation complexes within the mitochondrial reticulum.
Within the mitochondrial reticulum, especially in skeletal muscle, the paravascular mitochondrial regions are close to the oxygen delivery system yet physically separated from the myosin ATPase activity deep in the muscle cell. While the mitochondrial segments deep in the muscle are closely associated with the ATPase rich regions of the cells, Glancy et al. (169) showed that the distribution of the OxPhos complexes is different in these two regions in oxidative skeletal muscle. In the paravascular regions, the OxPhos complexes that generate membrane potential are in relatively higher abundance than in the intrafibrillar regions while the membrane potential utilizing and ATP producing complex V is in relatively higher abundance in the intrafibrillar regions. An example of this is shown in FIGURE 6A where direct immunohistochemistry shows the relative upregulation of complex IV in the periphery of the cells and complex V in the intrafibrillar region. This distribution of OxPhos complexes is then overlayed on a super-resolution microscopy TMRM image of a mouse soleus fiber (FIGURE 6B) illustrating the tendency for the generation of membrane potential to be in the periphery of the cell with the utilization of membrane potential enzymatically favored in the intrafibrillar region of the cell. This distribution is consistent with the model that ADP and ATP do not have to diffuse all the way to the paravascular mitochondria to utilize this potential energy for OxPhos (FIGURE 7). The potential energy is generated peripherally and delivered deep in the muscle via the reticulum network for ATP generation. In contrast, the heart cell with minimal paravascular pools, and much smaller cells, does not reveal a regionally specific distribution of OxPhos complexes (167) (FIGURE 6C) suggesting a more homogenous generation and utilization of membrane potential in this design.
FIGURE 6.

Distribution of oxidative phosphorylation complexes in striated muscle cells. A: 3-dimensional rendering of an oxidative skeletal muscle cell cross-section immunostained for complexes IV and V and nuclei (blue). Complex IV and V are present throughout the cell, but complex IV is relatively higher in abundance (green) near the periphery and complex V is relatively higher in abundance (red) in the interior. Adapted from Ref. 169. B: overlay of the relative complex IV (green) and V (red) distributions on a super-resolution microscopy rendering of a soleus muscle fiber demonstrating the grid-like physical properties of the mitochondrial reticulum. Adapted from (365). C: complex IV (green, left) and complex V (red, middle) distributions in cardiomyocyte cross sections showing homogenous complex IV/V ratios (right) throughout the heart cell. Adapted from Ref. 167.
FIGURE 7.

Capacity for energy distribution between mitochondria and myofibrils. Top left: 3-dimensional (3-D) rendering of the diffusive energy distribution capacity within the paravascular and intrafibrillar regions of the muscle mitochondrial reticulum. Mitochondria are colored based on the minumum distance to the nearest myofibril. Bottom left: 3-D rendering of the conductive energy distribution capacity within the paravascular and intrafibrillar regions of the muscle mitochondrial reticulum. Mitochondria are colored based on the minimum distance to the nearest myofibril of the closest mitochondria within a connected network. Top right: raw 2-dimensioanl oxidative muscle electron micrograph overlayed with tracings of several paravascular mitochondria. Bottom right: 3-D rendering of the mitochondria from the image above showing the wire-like projections from the paravascular space into the intrafibrillar regions of the muscle cell. All images adapted from Ref. 169.
Using conventional ionic conductances and reticulum scales from TABLE 4, we estimate that the membrane potential gradient from periphery to muscle core could be very small to meet metabolic needs. However, how the ion current is maintained with respect to the classical recycling of protons occurring over these long distances remains unclear. Patel et al. (365) modeled the current flows in an typical I-band mitochondrial geometry in skeletal muscle and found that the low concentration of protons could not carry the required current. Instead, the more dominant cellular cations, Na+ and K+, were most likely carrying the current. They demonstrated that with the current density that osmotic and pH challenges would rapidly develop in these small structures without a system to exchange protons for cations across the inner membrane, a process that was first proposed by Mitchell (397) to minimize the pH gradient contribution to the mitochondrial protonmotive force. These authors proposed the hypothesis presented in FIGURE 8 where the well-known cation:proton exchange mechanism is operating in opposite directions in the paravascular and intrafibrillar regions dissipating both the pH and cation gradients without impacting membrane potential, permitting the constant current down the I-band mitochondria without generating osmotic or pH gradients along its length. Other than the demonstration of high cation:proton exchange in muscle mitochondria, the uncertainty of the proton identity of the cation:proton exchanger in skeletal muscle, and the small predicted gradients in cations and pH of the model have made the experimental testing of this hypothesis difficult.
FIGURE 8.

Proposed hypothesis for current generation along mitochondrial tubules. In the paravascular region of a mitochondrion (at right), protons are pumped out by the electron transport chain and then recycled back across the inner mitochondrial membrane through a high abundance sodium or potassium/proton exchanger. In the interior region of the mitochondrion, protons are brought into the mitochondrion through complex V and sent back out through a sodium or potassium/proton exchanger. Current thus proceeds from the interior to the paravascular regions of the mitochondrion through the high concentration sodium or potassium ions. Adapted from Ref. 365.
3.2.3.6. development of the muscle mitochondrial reticulum.
Although mitochondria in adult muscle fibers are arranged in highly organized, stable configurations, this is not the case in early developmental muscle cells such as myoblasts, myotubes, and neonatal cardiomyocytes where mitochondria are highly dynamic and found throughout the cytosol (344, 348). The transition to mature muscle fibers results in mitochondria being surrounded by the contractile apparatus and slowing mitochondrial dynamics; however, the connected mitochondrial network is not yet formed at this stage (346, 398, 399). Thus the muscle mitochondrial reticulum forms after birth, although how this occurs as well as the importance of mitochondrial network formation to muscle development is not well understood. In 1981, Skulachev (398) found that the mitochondrial network took 2 mo to form in the rat diaphragm starting as many individual, disconnected mitochondria aligned longitudinally between the myofibrils at birth before transitioning to the grid-like network found in oxidative fibers. Unfortunately, there has been little investigation into the development of the muscle mitochondrial reticulum since that time and many questions remain. The diaphragm is a very specialized oxidative muscle required for breathing, and thus, may not develop along a similar time course or pattern to glycolytic or locomotor muscles such as found in the legs. Moreover, development is species specific, so additional studies are needed to better understand a particular species of interest such as mice or humans. Recently, the Kim et al. (135) used a light microscopy approach to show that in mouse glycolytic muscle, mitochondrial network development was complete about three weeks after birth and that the mature, perpendicularly oriented mitochondrial networks were preceded by grid-like networks at 2 wk of age and disconnected, parallel networks at birth. However, it is still unclear how this formation pattern differs from comparable oxidative muscle mitochondrial networks as well as the role of individual mitochondrial shape and location changes during development. Higher resolution studies using 3-D electron microscopy may offer insight in this regard.
In the heart, Gong and colleagues (354) reported that the developmental transition from many tortuous, worm-like mitochondria between myofibrils in the perinatal period to the regular, compact shapes observed in mature cardiomyocytes occurred through a complete turnover of all of the mitochondria in the cell. Blocking mitophagy through transgenic manipulation of PINK1-Mfn2-Parkin interactions was sufficient to prevent this turnover and maintained mitochondrial structure and cardiac metabolism in the perinatal state. Whether this postnatal mitochondrial turnover occurs in skeletal muscle remains to be seen, although mitophagy-related proteins have been shown to be upregulated in the perinatal stage relative to mature glycolytic skeletal muscle (135). Additionally, it is currently not well understood what signals drive the formation of specific mitochondrial networks, which can take very different configurations depending on muscle fiber type (303). Determination of mitochondrial network formation is likely related to the transcription factors involved in defining muscle fiber type (400–404); however, metabolic fiber type can be separated from contractile fiber type (e.g., fast oxidative fibers) suggesting that these decision pathways are intertwined but divergent. Untangling these separate but related pathways would go a long way toward our understanding of how muscles with specific contractile and metabolic capacities are built and how these processes may be altered in disease.
3.2.3.7. maintenance of muscle mitochondrial networks.
Once a mitochondrial network is formed, preservation of the network becomes crucial for proper support of muscle function (340, 341). Proteins and structures are constantly built up and broken down in an effort to maintain healthy mitochondria. Mitochondrial fission and fusion are likely part of this balancing act as discussed above. Other mechanisms involved in the maintenance process are mitochondrial biogenesis to increase mitochondrial content and mitophagy to remove damaged or dysfunctional mitochondria (405). There are multiple fluorescent reporters for mitophagy that have been used to visualize the sparse events present within the mitochondrial reticulum of normal muscle (406, 407) though visualization of increasing mitochondrial content as it happens has been challenging. Moreover, mitochondrial protein half-lives are highly variable within cardiac and skeletal muscle (408, 409) suggesting that the bulk changes in mitochondrial content achieved through biogenesis and mitophagy are not the prevailing mechanisms of mitochondrial turnover under normal conditions in mature muscle. Instead, import of newly synthesized proteins and degradation of individual proteins through proteases or other means appear to be the primary methods for maintaining mitochondrial composition. Whether these maintenance mechanisms vary among regions of the muscle mitochondrial reticulum or between fiber types is currently not well understood, though the use of transgenic fluorophores such as MitoTimer (410–412) may offer some insight when coupled with sufficiently high-resolution imaging techniques.
3.2.3.8. mitochondrial structural support for sites of atp utilization in muscle.
As discussed above, mitochondria in the interior of mature muscle can be found both between the myofibrils with groups of adjacent mitochondria often spanning many sarcomeres in length as well as wrapped perpendicularly around the sarcomeres on each side of the z-disk with the proportion of mitochondria in each location depending on fiber type (169, 299, 303, 323). Both oxidative and glycolytic muscle have many mitochondria wrapped around the I-band in close proximity to the terminal cisternae of the SR as well as the lateral ends of the sarcomere thereby providing tight localized coupling of calcium and high energy phosphates between structures in this region. Conversely, glycolytic muscle fibers have relatively few mitochondria arranged along the length of a sarcomere resulting in longer calcium diffusion distances between mitochondria and the longitudinal SR as well as longer ATP diffusion distances between mitochondria and the myosin ATPases near the center of the sarcomere. This problem is overcome in cardiac and oxidative skeletal muscles by placing more mitochondria longitudinally between the myofibrils thus shortening the local calcium and ATP diffusion distances. However, this increased mitochondrial volume comes at the cost of a lower myofibril cross-sectional area as a longitudinal row of mitochondria was placed in between myofibrils instead of more myofibrils. The additional use of longitudinal mitochondria in oxidative and cardiac muscles also comes at the expense of longitudinal SR, thereby lowering the calcium cycling and, thus, contraction frequency of these muscles (413). As a result, cardiac and oxidative muscles are configured such that contractile power is sacrificed in exchange for a greater ability to sustain contractions whereas glycolytic muscle is built for greater power at the expense of endurance. During periods of adaptation due to altered functional demands, the cross-sectional area of the muscle can increase by adding additional sarcomeres in parallel. The specific mechanisms of how the supporting mitochondrial network senses and responds to this change in increased contractile apparatus remain unknown, although there is likely a relationship to the known regulators of mitochondrial biogenesis (405). Conversely, endurance exercise training can lead to increased longitudinal mitochondrial content without an increase in muscle cross-sectional area, resulting in an effective loss in myofibrillar volume. Again, the mechanisms regulating how the contractile apparatus senses and adapts to changes in mitochondrial volume have yet to be elucidated. However, it is likely that muscle adaptation uses many of the integrated developmental processes that occur during muscle maturation but in a slightly different manner analogous to remodeling a house versus building one from scratch.
Yet, if placing mitochondria longitudinally between the myofibril matrix (414) results in the effective displacement of myofibrils, why does wrapping mitochondria perpendicularly around the ends of each sarcomere not result in the same effect? While the I-band mitochondria are thinner than longitudinally arranged mitochondria (169), the lower displacement effect of the I-band mitochondria may be due to a lower sarcomere cross-sectional area at the I-band and Z-disk compared with the center of the A-band. In addition, the intracellular shear associated with contraction is lowest in the I-band and Z-disk region potentially reducing mechanical damage to the mitochondria. TEM images of muscle (415) as well as light microscopy images of isolated myofibrils (416, 417) both suggest that the sarcomere may be thicker in the middle than at the ends. Being thinner in the I-band region would allow more room for mitochondria as well as SR to wrap around the sarcomere without decreasing the effective myofibril cross-sectional area available to generate force within the cell. Indeed, the junctional SR which wraps perpendicularly near the ends of the sarcomere as part of the triad is well known to have a greater diameter than the longitudinal SR which wraps the sarcomere in a mesh-like fashion (418, 419). By building sarcomeres in a slightly nonlinear fashion where the ends are thinner than the middle, more efficient packing of the myofibrils and the organelles required to support contraction would be permitted. More in-depth analysis of sarcomere 3-D structures, particularly in relation to the proximity of mitochondria and SR, would provide more concrete insight into this idea as well as the related hypothesis that the linear arrangement between actin and myosin is not uniform within a single sarcomere.
3.2.3.9. future directions for the muscle mitochondrial reticulum.
There remain a large number of open questions relating to the connectivity of the muscle mitochondrial reticulum, particularly regarding how the connections are formed and regulated, how they vary within different physiological (e.g., male vs. female) or pathological (e.g., obesity/diabetes) environments, and the functional consequences in live animals. One of the most controversial aspects is the functionality of intermitochondrial junctions. Contact sites between both the inner and outer membranes of adjacent mitochondria appear as electron dense regions on electron micrographs and have been observed for decades (169, 299, 326, 349, 363, 420–422) (FIGURE 9A) although the precise function and molecular makeup of these intermitochondrial junctions are currently unclear. Organelle-organelle contact sites are well known to facilitate the transfer of molecules and signals among many different organelle types (423, 424). However, the existence of functional contact sites between adjacent mitochondria has been questioned partly because molecular transfer would be required across four membranes. However, many types of adjacent bacteria have been known to form connections across their four membranes, e.g., microplasmodesmata (425, 426), so possibly this is a conserved process in these organelles of bacterial origin. Contact sites between mitochondria and endoplasmic reticulum (ER) have been shown to facilitate lipid transfer from the ER membrane to the mitochondrial inner membrane (427) suggesting that the highly permeable outer mitochondrial membrane is not necessarily a barrier to molecular exchange between organelles. Further, calcium cycling is also regulated by ER-mitochondrial contact sites (428) showing that rapid ion uptake into the matrix can occur more expeditiously due to organelle contact sites despite having to cross “extra” membranes. Recently, Picard et al. (420) reported that the cristae of adjacent mitochondria appeared to coordinate their alignment across the majority of, but not all, intermitochondrial junctions suggesting this structural arrangement was consistent with electrical conduction of the mitochondrial membrane potential at these sites. Additionally, we demonstrated that while the distance between the respective outer mitochondrial membranes is generally 8–10 nm at intermitochondrial junctions, there are also an abundance of direct contacts (<1 nm spacing) between outer membranes at these junctions (167), which may be the sites at which exchange occurs (FIGURE 9B). Moreover, Bleck et al. (303) found that despite only ∼6% of over 5,000 mitochondrial 3-D structures analyzed being longer than 5 µm in glycolytic and oxidative muscles, functional connectivity in both fiber types was generally observed across distances of 10 µm or more suggesting that conduction of the membrane potential must be occurring by a mechanism beyond propagation within a single mitochondrion and most likely through intermitochondrial junctions.
FIGURE 9.
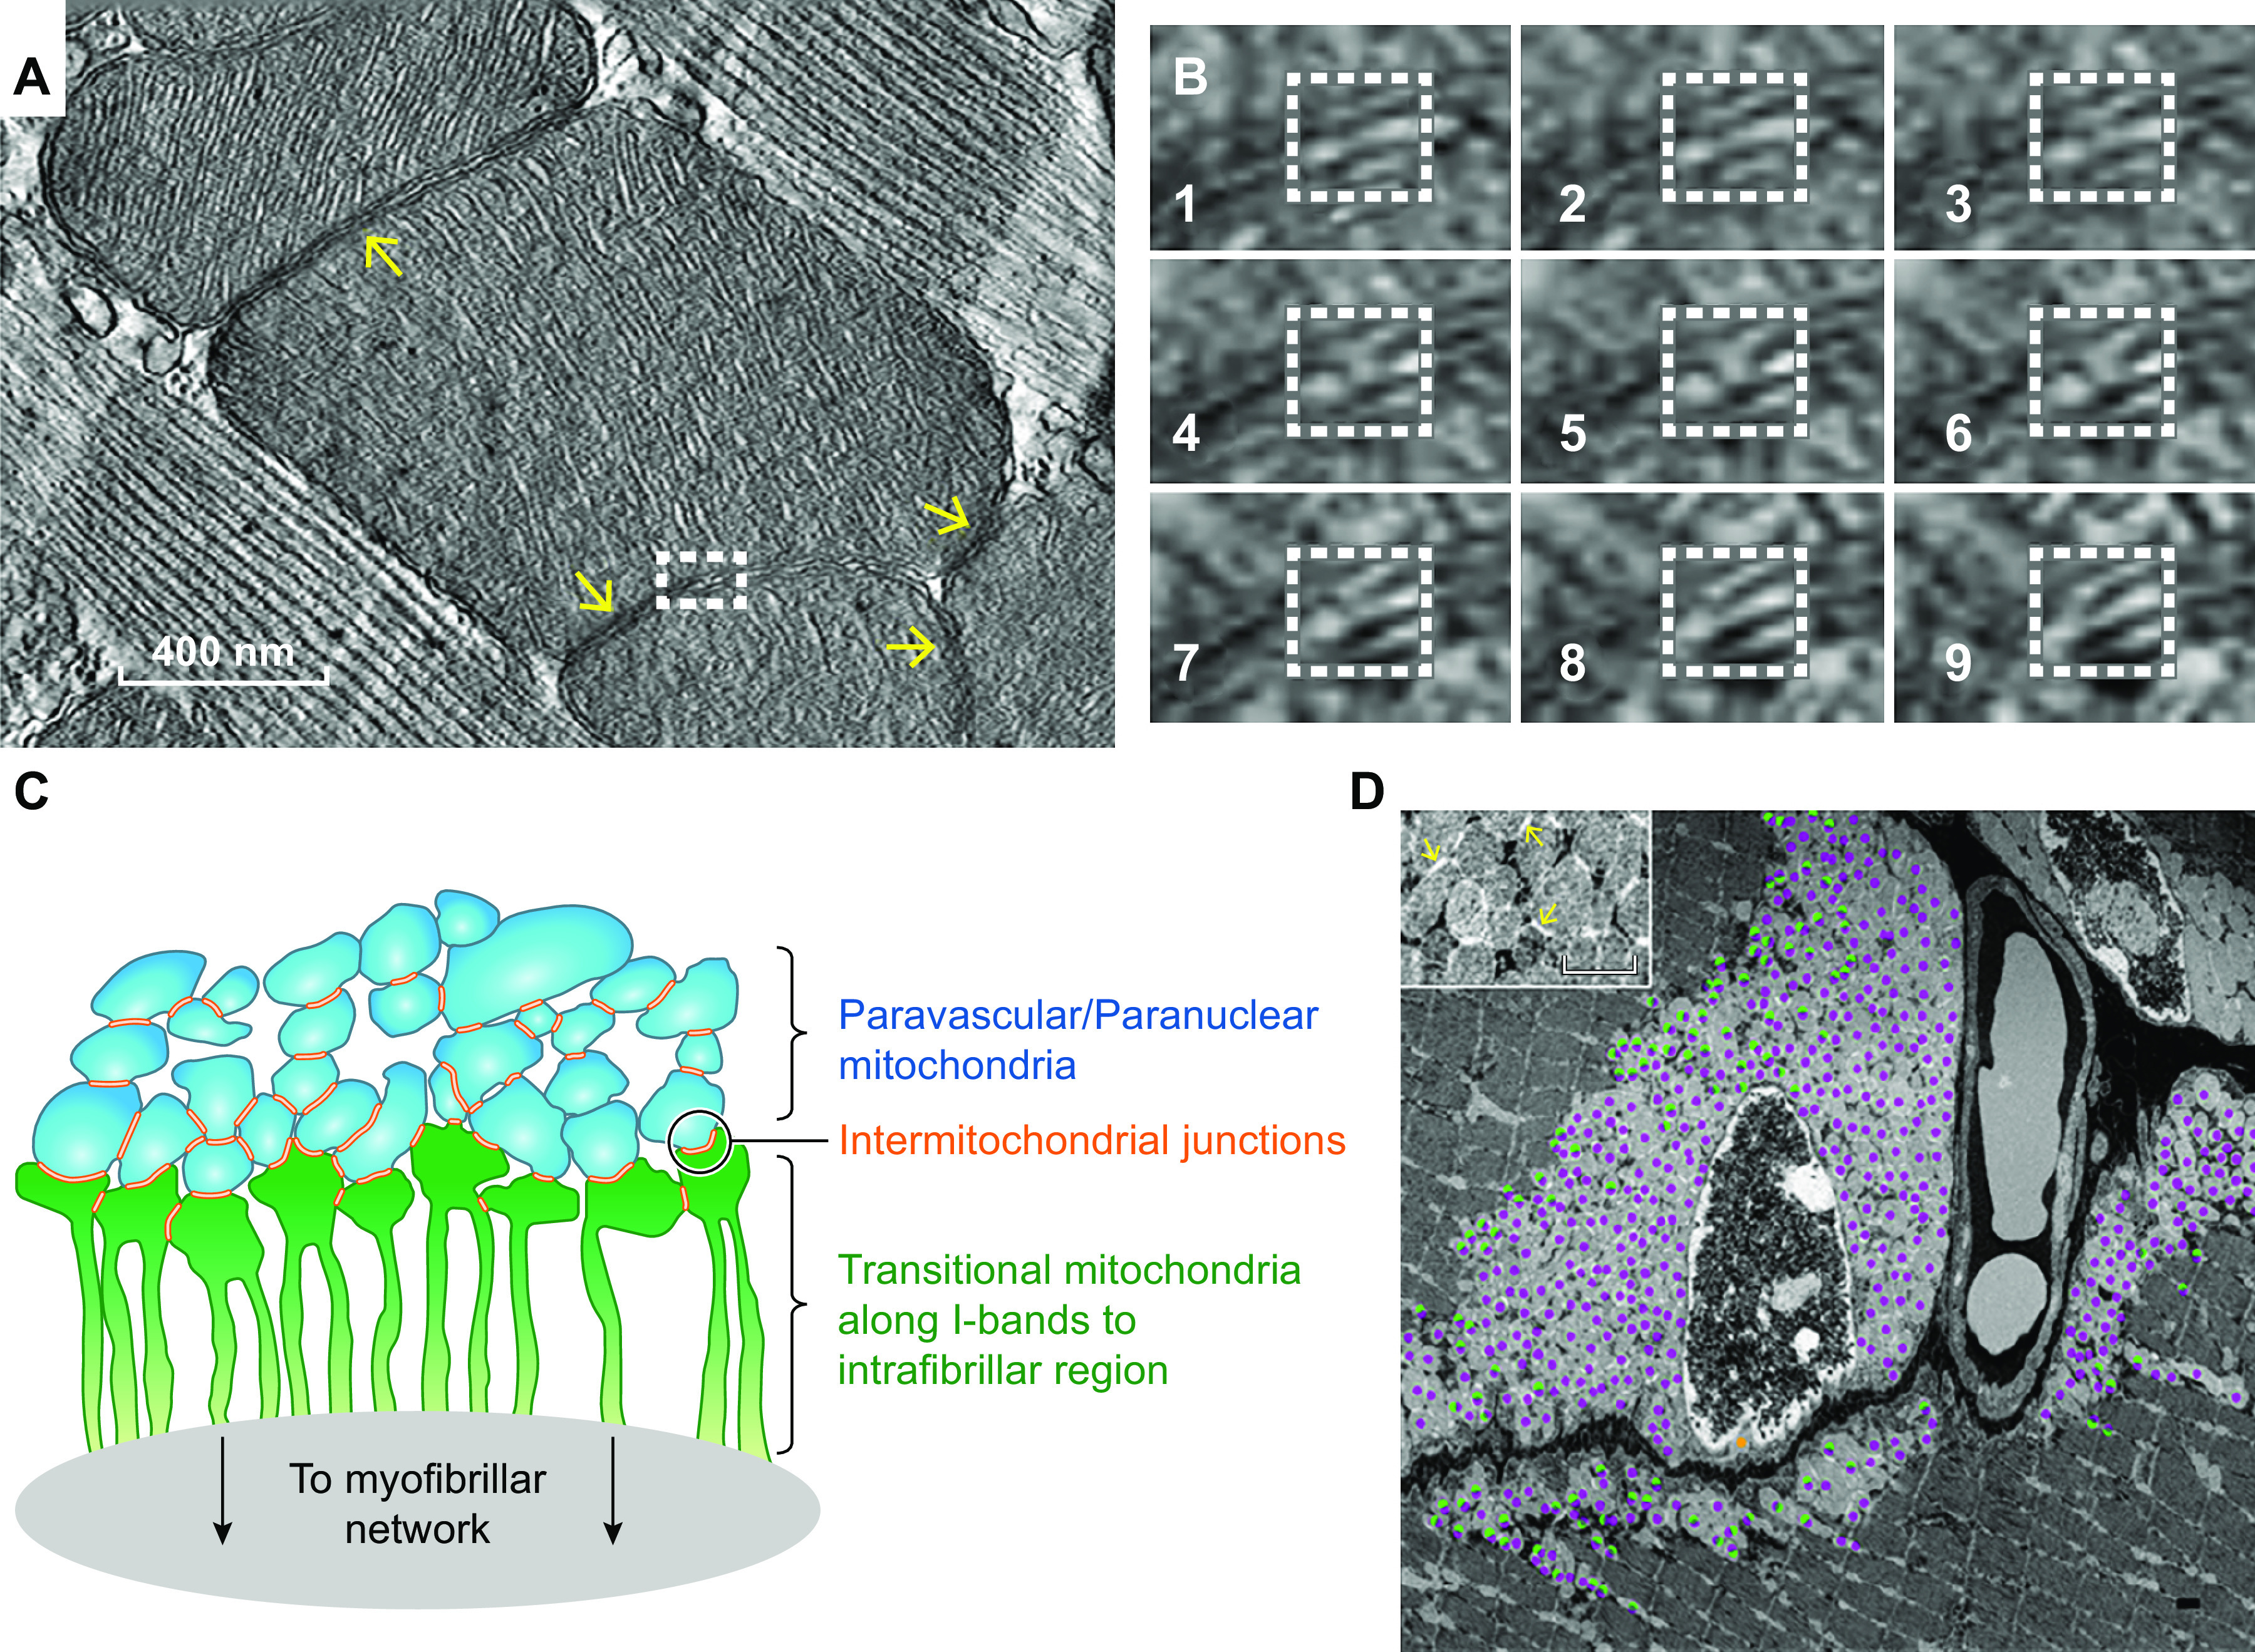
Intermitochondrial junctions couple adjacent mitochondrial structures. A: electron tomogram of a mouse left ventricle showing intermitochondrial junctions (yellow arrows) between adjacent mitochondria. Adapted from Ref. 167. B: sequential images of the electron tomogram series from the boxed region in A showing direct physical contact between adjacent mitochondria within intermitochondrial junctions. Adapted from Ref. 167. C: schematic of the intermitochondrial junction-based coupling of the paravascular mitochondria and transitional mitochondria into the intrafibrillar region of the muscle cell. D: prevalence of paravascular mitochondrial coupling (purple dots) and transitional mitochondria (green) linking the paravascular and intrafibrillar regions of the mitochondrial reticulum. Adapted from Ref. 169.
Considering the specialized case of paravascular and paranuclear mitochondria in striated muscle, we have proposed that the mitochondria membrane potential is coupled within the paranuclear/paravascular pools via intermitochondrial junctions that are then coupled to the I-band mitochondria emanating from these pools. FIGURE 9C presents this schematically with the blue paravascular/paranuclear mitochondria coupled via intermitochondrial junctions and then coupled to transitional mitochondria that emerge from these pools along the I-band as a single, contiguous mitochondrion that runs deep in the muscle. In FIGURE 9D, the prevalence of coupled mitochondria (purple marks) and mitochondria coupled with contiguous matrix into the intrafibrillar region are shown as green/purple marks. The vast majority of paravascular mitochondria are coupled via intermitochondrial junctions while the interface between the paravascular mitochondria pool and intrafibrillar region is lined by transitional mitochondria coupled to both the paravascular and intrafibrillar regions of the muscle cell.
It is important to note that the intermitochondrial junction coupling hypothesis discussed here is based on a strong correlation between structural and functional measurements. However, direct, functional measurements of the conductivity across intermitochondrial junctions have yet to be made. It is clear that greater experimental precision is needed to fully elucidate the role of intermitochondrial junctions in muscular energy distribution and will likely require the physical isolation of these junctions for functional testing and/or technical advances allowing direct measurements of ionic currents with subcellular precision under the microscope. Performing localized depolarization experiments such as with MitoPhotoDNP (167, 169, 303) on muscles under a superresolution microscope with individual mitochondrial resolution may offer more exact knowledge on how mitochondrial membrane potential conduction is occurring within the muscle mitochondrial reticulum as well as offer better insight into the role of intermitochondrial junctions within the power grid protection system (167). Additionally, while there are techniques available to isolate and assess the specific nature of contacts between different organelles, there is currently a lack of methods to probe junctions between the same type of organelle, which presents a great challenge in determining the molecular identity of the putative components associated with intermitochondrial junctions. Proteomic screens of cells under conditions with more or less intermitochondrial junctions may be helpful in narrowing down potential candidates, although the lack of junctions in in vitro muscle cells make high-throughput candidate testing difficult in these models. A better option may be a nonmammalian model such as Drosophila, which has well characterized flight muscles in addition to an array of available transgenic approaches though care must be taken when attempting to translate results back to mammalian systems.
Another controversy surrounding the electrical connectivity of the muscle mitochondrial reticulum is the use of MitoPhotoDNP to cause localized depolarization and all the potential confounding variables that could arise. The use of a photoactivatable uncaging molecule implicitly requires increased light exposure on the cells of interest, and photodamage is a well-known potential side effect that can also cause a redistribution of electrical potential energy (376–380). Simple light exposure controls with and without MitoPhotoDNP suggested that the UV power required to uncage DNP has a negligible effect on muscle fibers (169), but it is possible that addition of MitoPhotoDNP could alter the sensitivity of the cells to photodamage. This possibility has been tested in two ways. First, we purposely induced localized photodamage in muscle fibers by increasing the UV power eightfold, which led to asynchronous, repetitive, transient membrane potential depolarizations (373) only in the damaged region with no apparent depolarization to the adjacent mitochondria (167). Thus the response to photodamage is different than to uncaging MitoPhotoDNP. Second, during the normal photoactivation step in the presence of MitoPhotoDNP, we irradiated two separate regions of the same cell, one with a 355-nm laser that can uncage MitoPhotoDNP, and the other with a 405-nm laser which does not uncage MitoPhotoDNP. Upon photoactivation of muscle fibers from MitoDendra2 mice, the fluorescence of mitochondria in both regions switched from green to red with equal intensity. However, only the mitochondria in the 355-nm exposed region underwent the physical remodeling of the mitochondrial network that occurs after localized depolarization, suggesting that this response was specific to depolarization and not due to photodamage (167).
It is also possible that diffusion of TMRM or uncaged DNP could have resulted in the apparent shared depolarization immediately after photoactivation of MitoPhotoDNP. Diffusion of TMRM toward or away from a region would result in an increase or decrease in fluorescence in that region, respectively. However, in both the irradiated and adjacent regions, the TMRM signal goes down in the mitochondria and up in the cytosol, which cannot be explained by TMRM diffusion (167, 169, 303). Rapid diffusion of the uncaged DNP could depolarize mitochondria in adjacent, nonirradiated regions. However, after the initial shared depolarization, the nonirradiated region repolarizes back to baseline levels suggesting that DNP is not present in this region 5–10 s after depolarization (167). Another possibility is that uncaged DNP diffuses to the adjacent regions and is only concentrated enough to induce depolarization transiently before continuing to diffuse away. To test this possibility, MitoPhotoDNP experiments were performed in cardiac, oxidative, and glycolytic muscle fibers that have parallel, grid-like, and perpendicular oriented mitochondrial networks, respectively (167, 303). In all cell types, irradiation was performed separately along both the perpendicular and longitudinal axes to test the directionality of electrical coupling. For each cell type, the functional connectivity matched the orientation of the physical networks (FIGURE 10). Cardiac fibers had greater connectivity along the parallel axis, glycolytic fibers had greater connectivity along the perpendicular axis, and oxidative fibers had similar connectivity along both axes (167, 303). Diffusion of molecules including oxygen, calcium, ATP, and even photons is well known to occur more expeditiously along the longitudinal axis in muscle fibers (429–432). Thus transient DNP diffusion could only potentially explain the results in the longitudinally aligned mitochondrial networks of cardiac fibers but not in either skeletal muscle fiber type, which suggests that DNP diffusion is likely not a factor in the MitoPhotoDNP experiments. Nonetheless, additional experimental evidence using different methods would greatly add support to the current data on the electrical connectivity of the muscle mitochondrial reticulum. A cell-permeable, photoactivatable ADP molecule would be helpful for creating transient, localized mitochondrial energy demands and in overcoming the many issues associated with mitochondrial uncouplers. Additionally, recent development of optogenetic mitochondrial transgenes that insert a photoactivatable ion channel into the inner mitochondrial membrane (433, 434) may offer an even cleaner approach to induce spatially and temporally controlled depolarization without any issues related to rapid probe diffusion.
FIGURE 10.
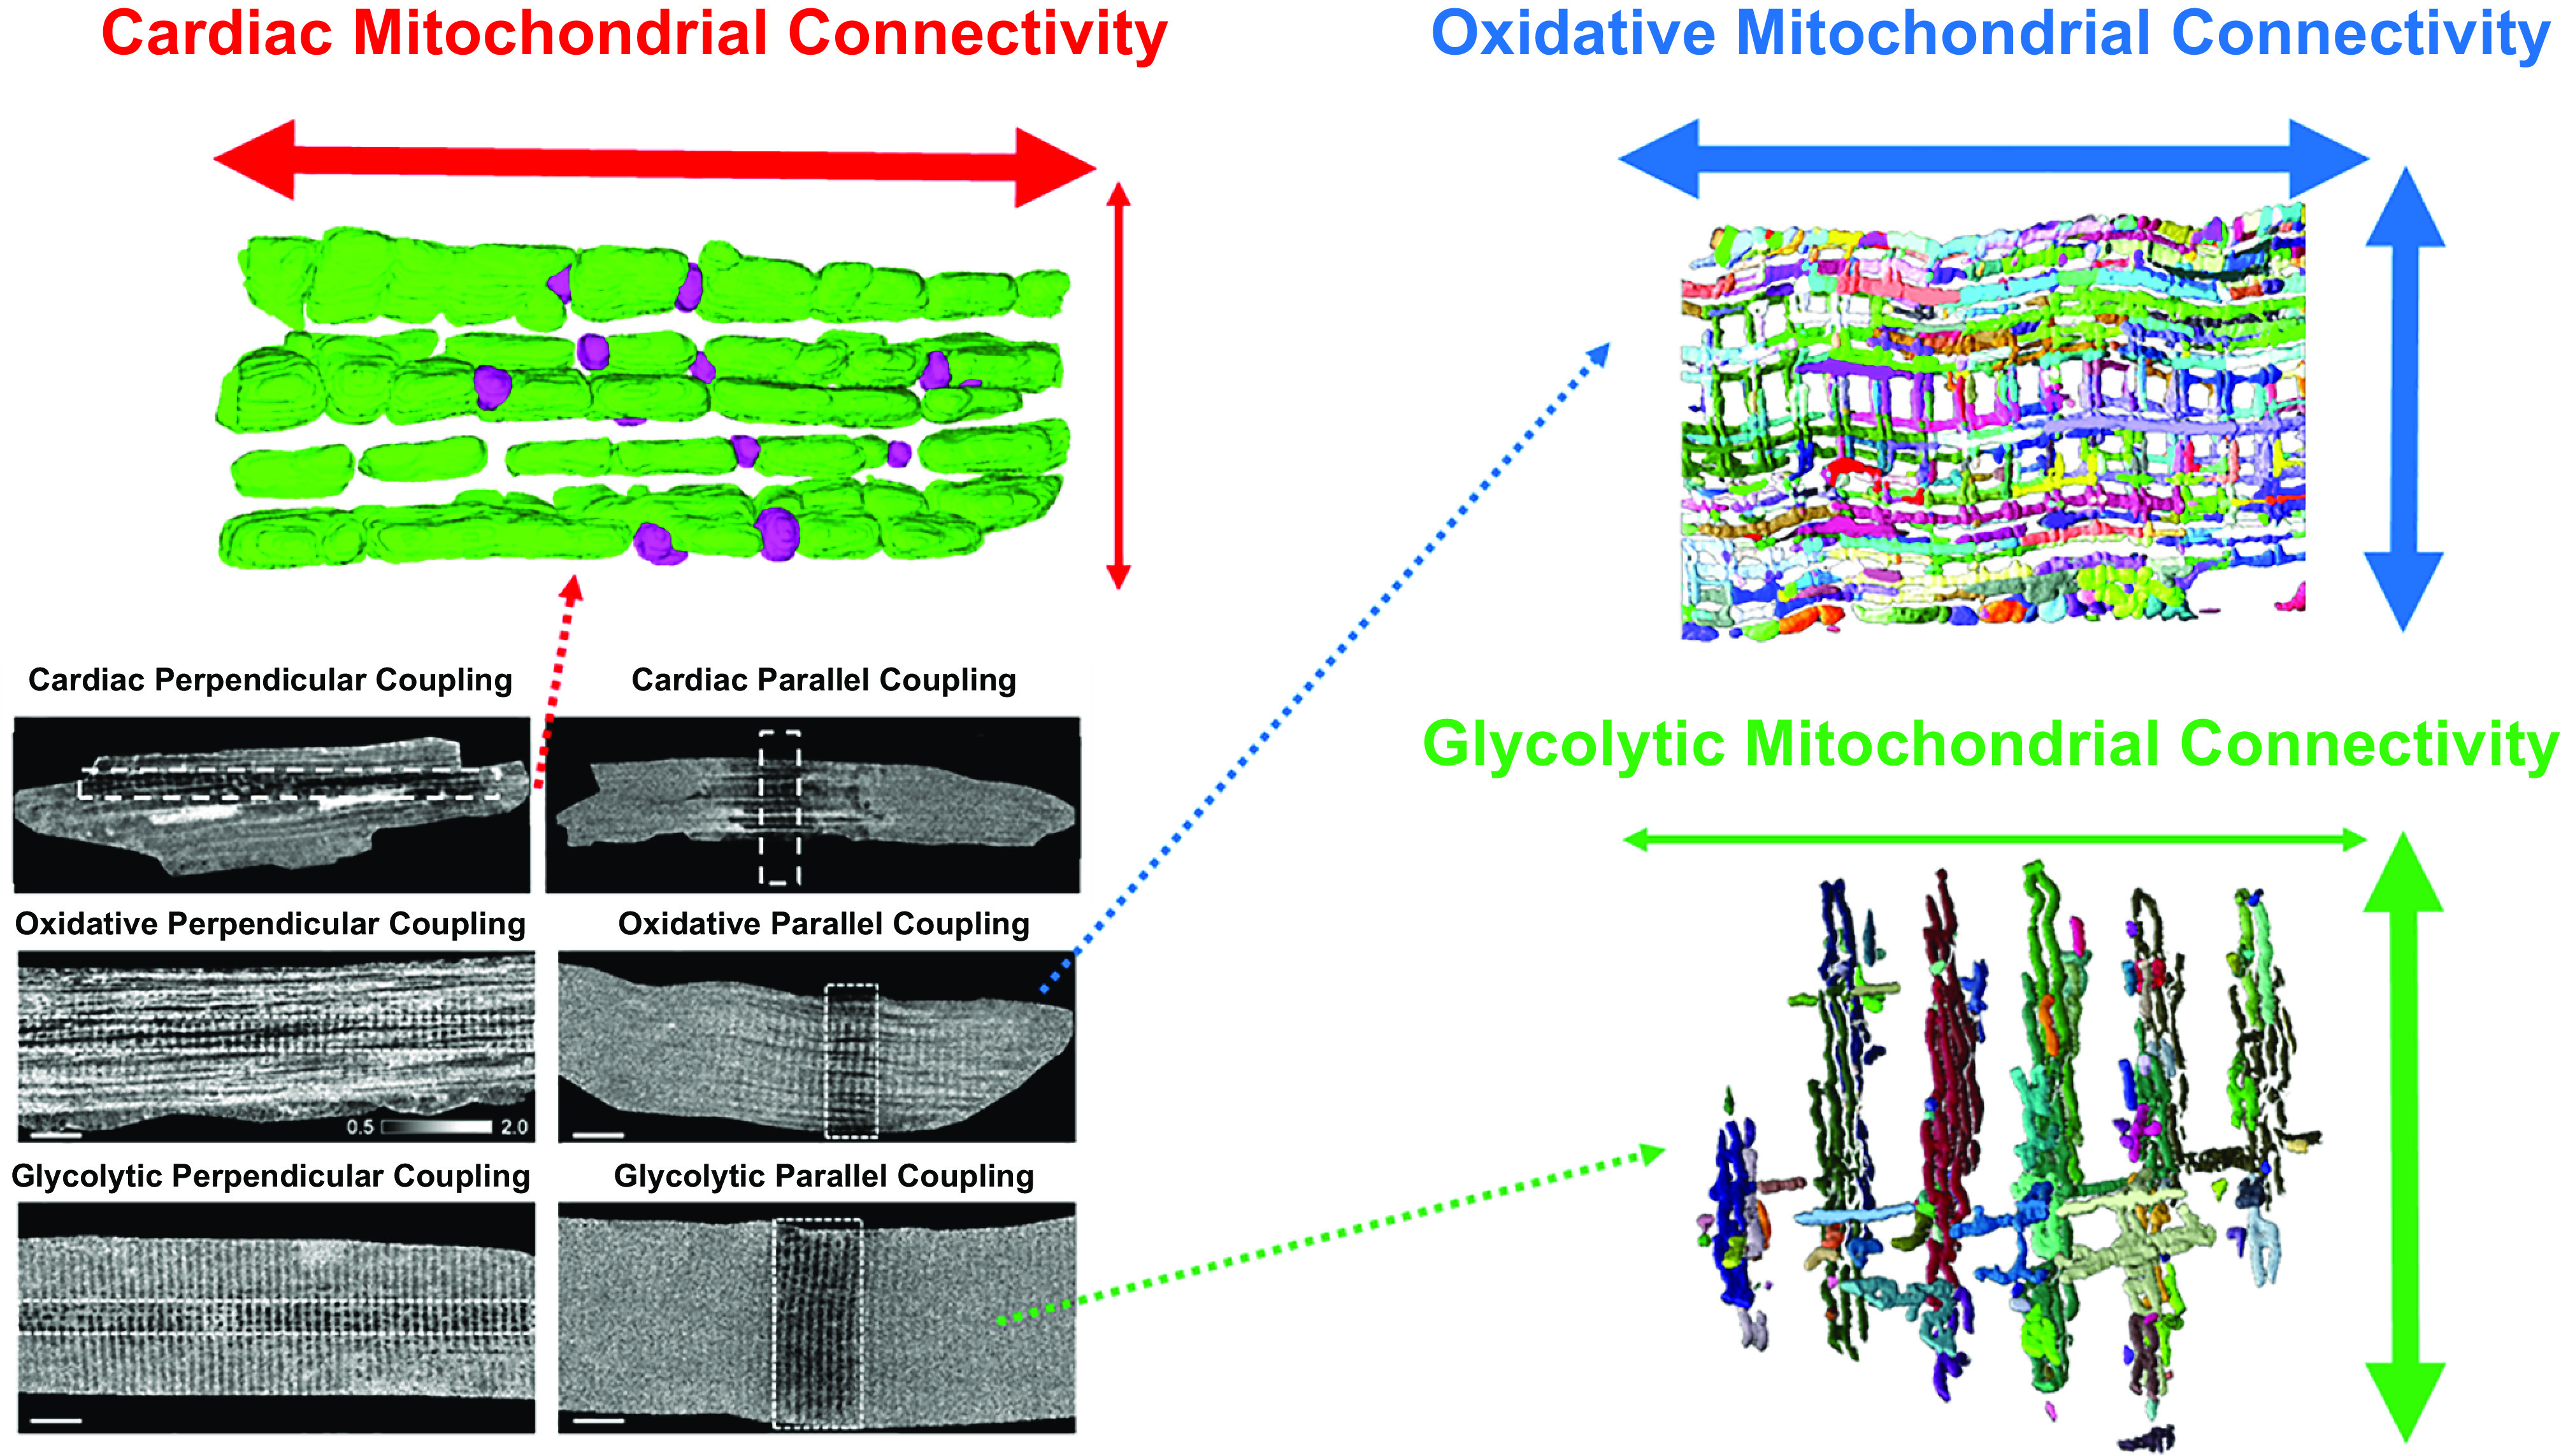
Structural and functional connectivity of striated muscle mitochondrial networks. Top left: structural and functional connectivity of cardiac muscle mitochondrial reticulum is primarily parallel to the axis of contraction. Top right: Structural and functional connectivity of oxidative muscle mitochondrial reticulum occurs both parallel and perpendicular to the axis of contraction. Bottom right: structural and functional connectivity of glycolytic muscle mitochondrial reticulum is primarily perpendicular to the axis of contraction. Bottom left: ratiometric mitochondrial membrane potential voltage maps in response to localized depolarization along each axis in cardiac, oxidative, and glycolytic muscles as in FIGURE 5. Adapted from Refs. 167, 303).
What is the benefit of the speed of electrical conduction of the mitochondrial membrane potential if the upstream (e.g., fuel and NADH) and downstream (e.g., ATP) molecules in the energy conversion pathway still rely on slower movement by diffusion? With regard to carbon substrates, the amount of ATP generated per pyruvate or lactate molecule is roughly 14 ATP/mol assuming complete rotation of the citric acid cycle and minimal proton leak, so the diffusion time could be much slower than ATP itself. Little information on the concentration gradients for carbon substrates within muscle cells is available (435). Additionally, while rapid distribution of a key intermediate in the OxPhos pathway would help maintain homogeneity of the diffusion driving forces throughout the cell, the membrane potential is also a critical driving force for many other mitochondrial processes besides the formation of ATP by ATP synthase. Indeed, the membrane potential is utilized for substrate transport into mitochondria (436), ATP transport out of mitochondria (437, 438), and ion exchange across the inner mitochondrial membrane (439, 440). Specifically, entry of calcium and sodium into mitochondria, both of which have been shown to activate the mitochondrial energy conversion process through different mechanisms (68, 69, 441–443), is dependent on the membrane potential. Consequently, the entire mitochondrial energy conversion process from fuel transportation (436, 444), to substrate dehydrogenases (445), to the electron transport chain (68, 446), to ATP transport out of mitochondria (437, 438) relies either directly or indirectly on utilization of the membrane potential. As such, maintaining a consistent membrane potential in the face of energetic perturbations is critical to mounting a rapid response to meet the new demands. In fact, maintenance of the membrane potential appears to be so critical that cells will run ATP synthase in reverse and hydrolyze ATP to maintain the membrane potential as a protective measure upon the onset of ischemia (447–451). Thus maintenance of the membrane potential by rapid conduction through the mitochondrial reticulum would play a role throughout the energy conversion pathway bringing together the power of the membrane potential generating complexes I, III and IV to provide a much larger benefit than simple activation of the ATP synthase enzyme.
4. SUMMARY OF THE METABOLIC SUPPORT DESIGN OF THE MUSCLE CELL
Force generation by the striated muscle cell is an energetically expensive activity, which requires significant investment of valuable cellular real estate in supporting energy conversion and distribution processes. The demonstration of a metabolic homeostasis, as first described by Hill (34), illustrates the balance between energy conversion and utilization by contraction and contraction control processes. The homeostatic nature of the free energy in the cell is likely to maintain the driving force for contraction as well as generating ion gradients such sarcoplasmic reticulum calcium during increases in work. Energy homeostasis also implies that large changes in metabolite concentration gradients driving metabolite diffusion through the muscle do not occur. How is this balance between energy conversion and work performed? Much of the sustained power of muscles is supported by OxPhos. Despite a nearly 10-fold difference in sustained work demands of different muscles, the protein programming of mitochondria is nearly identical. That is no change in mitochondrial internal design despite large differences in cellular demand. Thus the content and architecture of mitochondria are the major variables for tuning mitochondrial ATP production capacity to match muscle action. Indeed, as seen in this review, the content and structure of mitochondria in different muscle types are variable. In addition to ATP production, energy must be distributed throughout an ATPase rich cytosol. Facilitated diffusion through myoglobin and creatine kinase has long been considered primary energy distribution mechanism in muscle cells. However, the relatively modest functional consequences and adaptations observed with the loss of these systems, together with computational investigations and the observation that most metabolite concentrations are held constant, have brought newfound skepticism concerning the importance of myoglobin and creatine kinase driven facilitated diffusion under normal physiological conditions. Recent experimental support for the hypothesis that electrical energy could be conducted through mitochondrial reticulum networks has now suggested an alternative, and likely much faster, mechanism for cellular energy distribution that can function with minimal free energy or metabolite gradients. Each muscle type has adapted the mitochondrial structure to apparently meet the remarkable energy conversion and distribution challenge in this cellular machine.
The constantly beating heart is a highly aerobic tissue, precisely matching the delivery of oxygen to the OxPhos machinery. However, the actual mechanisms associated with this balance of flow with workload are not understood. With alteration in workload, the heart is capable of maintaining both the free energy of ATP as well as the PCr content implying a matching of ATP production with ATP utilization. Again, the cellular mechanisms that balance ATP production with ATP utilization are also poorly understood. Both of these “homeostatic” processes suggest that the energy transfer systems within the heart cell are extremely efficient in delivering appropriate potential energy across the heart cell, which is essentially a near solid mass of ATPase activity. Facilitated diffusion of metabolites and oxygen was early idea to explain the rapid distribution of potential energy in the cell; however, recent genetic manipulations along with biophysical measures have suggested that these facilitated diffusion processes do not dominate the energy distributions processes in the heart. The stable network structure of mitochondria within the cardiomyocyte may play a larger role in the capacity for cellular energy distribution, although the precise mechanisms that regulate delivery of potential energy throughout the mitochondrial reticulum have yet to be elucidated. Physical coupling of the many adjacent mitochondria linked together across the paravascular, paranuclear, and intrafibrillar regions appears to provide a structural pathway for maintaining energy homeostasis within connected networks. Electrical coupling across the structural intermitochondrial junctions would allow for rapid distribution of the membrane potential, a key regulator of many mitochondrial processes, throughout the cell, although detailed information on how and when electrical conduction may occur remains to be uncovered.
Despite the larger and more intermittent demands for force production in skeletal muscle relative to the heart, oxygen delivery to the OxPhos machinery does not to appear to be limiting across the aerobic scope. While oxygen partial pressures in skeletal muscle do fall with an increase in workload, unlike in the heart, the oxygen gradient from the capillary to the mitochondrion appears to remain stable demonstrating an alternate homeostatic solution. However, the mechanisms of how a muscle contraction-induced increase in oxygen flux occurs in the absence of a change in driving force are still unclear. Again, in contrast to the heart, the structural design of the skeletal muscle prioritizes maximal power over perfect maintenance of energy homeostasis. As a result, the onset of muscle contraction is marked by a slight fall in ATP free energy which is minimized by the fiber-type specific efficiency of the cellular energy distribution system within the skeletal muscle cell. While the protein composition of the OxPhos machinery per mitochondrial volume is similar across the glycolytic to oxidative metabolic spectrum of muscle fibers, the size and configuration of the mitochondrial reticulum are largely dependent on muscle fiber type. Glycolytic muscle fibers have smaller mitochondrial networks comprised largely of thinner mitochondria aligned perpendicularly to the muscle contraction axis likely as a means to minimally displace the contractile apparatus. Oxidative fibers have severalfold larger mitochondrial networks made of thicker mitochondria aligned both parallel and perpendicular to the contractile apparatus demonstrating a design priority for more sustainable force production compared with the glycolytic muscle though not to the degree of the heart. However, the mechanisms that guide design of the cellular energy distribution system across striated muscle types remain to be resolved.
GRANTS
This work was supported by funding from the Division of Intramural Research of the National Heart, Lung, and Blood Institute and the Intramural Research Program of the National Institute of Arthritis and Musculoskeletal and Skin Disease.
DISCLOSURES
No conflicts of interest, financial or otherwise, are declared by the authors.
AUTHOR CONTRIBUTIONS
B.G. and R.S.B. conceived and designed research; B.G. and R.S.B. analyzed data; B.G. and R.S.B. interpreted results of experiments; B.G. and R.S.B. prepared figures; B.G. and R.S.B. drafted manuscript; B.G. and R.S.B. edited and revised manuscript; B.G. and R.S.B. approved final version of manuscript.
Footnotes
Human tibialis anterior maximum glycolytic and OxPhos fluxes: 84 and 60 mmol ATP/min/L cell, respectively (393). Human tibialis anterior is ∼75% slow-twitch, 25% fast-twitch (394–396), so 22 mg glycolysis/g wet weight and 9.6 µmol COX/L cell based on weighted averages of rabbit soleus and gracilis values in Tables 1 and 2. Using ΔGATP and mitochondrial protein to wet weight conversions as for heart above yields skeletal muscle specific powers of 3.8 kW/kg and 1.7 kW/kg for glycolysis and OxPhos, respectively.
REFERENCES
- 1.Suga H. Ventricular energetics. Physiol Rev 70: 247–277, 1990. doi: 10.1152/physrev.1990.70.2.247. [DOI] [PubMed] [Google Scholar]
- 2.Mommaerts WF. Energetics of muscular contraction. Physiol Rev 49: 427–508, 1969. doi: 10.1152/physrev.1969.49.3.427. [DOI] [PubMed] [Google Scholar]
- 3.Joyner MJ, Casey DP. Regulation of increased blood flow (hyperemia) to muscles during exercise: a hierarchy of competing physiological needs. Physiol Rev 95: 549–601, 2015. doi: 10.1152/physrev.00035.2013. [DOI] [PMC free article] [PubMed] [Google Scholar]
- 4.Lopaschuk GD, Ussher JR, Folmes CD, Jaswal JS, Stanley WC. Myocardial fatty acid metabolism in health and disease. Physiol Rev 90: 207–258, 2010. doi: 10.1152/physrev.00015.2009. [DOI] [PubMed] [Google Scholar]
- 5.Flagg TP, Enkvetchakul D, Koster JC, Nichols CG. Muscle KATP channels: recent insights to energy sensing and myoprotection. Physiol Rev 90: 799–829, 2010. doi: 10.1152/physrev.00027.2009. [DOI] [PMC free article] [PubMed] [Google Scholar]
- 6.Stanley WC, Recchia FA, Lopaschuk GD. myocardial substrate metabolism in the normal and failing heart. Physiol Rev 85: 1093–1129, 2005. doi: 10.1152/physrev.00006.2004. [DOI] [PubMed] [Google Scholar]
- 7.Feigl EO. Coronary physiology. Physiol Rev 63: 1–205, 1983. doi: 10.1152/physrev.1983.63.1.1. [DOI] [PubMed] [Google Scholar]
- 8.Wittenberg JB. Myoglobin-faclitiated oxygen diffusion: role of myoglobin in oxygen entry into muscle. Physiol Rev 50: 559–632, 1970. doi: 10.1152/physrev.1970.50.4.559. [DOI] [PubMed] [Google Scholar]
- 9.Weibel ER, Taylor CR, Bolis L. Principles of Animal Design: the Optimization and Symmorphosis Debate. Cambridge; New York, NY: Cambridge University Press, 1998, p. 314. [Google Scholar]
- 10.Weibel ER, Taylor CR, Hoppeler H. The concept of symmorphosis: a testable hypothesis of structure-function relationship. Proc Natl Acad Sci U S A 88: 10357– doi: 10.1073/pnas.88.22.10357. 10361, 1991. [DOI] [PMC free article] [PubMed] [Google Scholar]
- 11.Weibel ER. Symmorphosis: on Form and Function in Shaping Life. Cambridge, MA: Harvard University Press, 2000, p. 263. [Google Scholar]
- 12.Diamond JM. Evolution of biological safety factors: a cost/benefit analysis. In: Principles of Animal Design, edited by Weibel CR, Bolis L.. Cambridge, UK: Cambridge Univerity Press, 1998, p. 21–27.. [Google Scholar]
- 13.Jones AM, Vanhatalo A, Burnley M, Morton RH, Poole DC. Critical power: implications for determination of VO2max and exercise tolerance. Med Sci Sports Exerc 42: 1876–1890, 2010. doi: 10.1249/MSS.0b013e3181d9cf7f. [DOI] [PubMed] [Google Scholar]
- 14.Dudley R, Gans C. A critique of symmorphosis and optimality models in physiology. Physiol Zool 64: 627–637, 1991. doi: 10.1086/physzool.64.3.30158197. [DOI] [Google Scholar]
- 15.Garland T, Huey RB. Testing symmorphosis–does structure match functional requirements. Evolution 41: 1404–1409, 1987. doi: 10.2307/2409105. [DOI] [PubMed] [Google Scholar]
- 16.Monod H, Scherrer J. The work capacity of a synergic muscular group. Ergonomics 8: 329–338, 1965. doi: 10.1080/00140136508930810. [DOI] [Google Scholar]
- 17.Barker T, Poole DC, Noble ML, Barstow TJ. Human critical power-oxygen uptake relationship at different pedalling frequencies. Exp Physiol 91: 621–632, 2006. doi: 10.1113/expphysiol.2005.032789. [DOI] [PubMed] [Google Scholar]
- 18.Poole DC, Burnley MA, Vanhatalo AN, Rossiter HB, Jones AM. Critical power: an important fatigue threshold in exercise physiology. Med Sci Sports Exerc 48: 2320–2334, 2016. doi: 10.1249/MSS.0000000000000939. [DOI] [PMC free article] [PubMed] [Google Scholar]
- 19.Neubauer S. The failing heart–an engine out of fuel. N Engl J Med 356: 1140–1151, 2007. doi: 10.1056/NEJMra063052. [DOI] [PubMed] [Google Scholar]
- 20.Huss JM, Kelly DP. Mitochondrial energy metabolism in heart failure: a question of balance. J Clin Invest 115: 547–555, 2005. doi: 10.1172/JCI24405. [DOI] [PMC free article] [PubMed] [Google Scholar]
- 21.Rosca MG, Hoppel CL. Mitochondrial dysfunction in heart failure. Heart Fail Rev 18: 607–622, 2013. doi: 10.1007/s10741-012-9340-0. [DOI] [PMC free article] [PubMed] [Google Scholar]
- 22.Kim JA, Wei Y, Sowers JR. Role of mitochondrial dysfunction in insulin resistance. Circ Res 102: 401–414, 2008. doi: 10.1161/CIRCRESAHA.107.165472. [DOI] [PMC free article] [PubMed] [Google Scholar]
- 23.Lowell BB, Shulman GI. Mitochondrial dysfunction and type 2 diabetes. Science 307: 384–387, 2005. doi: 10.1126/science.1104343. [DOI] [PubMed] [Google Scholar]
- 24.Mootha VK, Lindgren CM, Eriksson KF, Subramanian A, Sihag S, Lehar J, Puigserver P, Carlsson E, Ridderstråle M, Laurila E, Houstis N, Daly MJ, Patterson N, Mesirov JP, Golub TR, Tamayo P, Spiegelman B, Lander ES, Hirschhorn JN, Altshuler D, Groop LC. PGC-1alpha-responsive genes involved in oxidative phosphorylation are coordinately downregulated in human diabetes. Nat Genet 34: 267–273, 2003. doi: 10.1038/ng1180. [DOI] [PubMed] [Google Scholar]
- 25.Balaban RS, Nemoto S, Finkel T. Mitochondria, oxidants, and aging. Cell 120: 483–495, 2005. doi: 10.1016/j.cell.2005.02.001. [DOI] [PubMed] [Google Scholar]
- 26.Chistiakov DA, Sobenin IA, Revin VV, Orekhov AN, Bobryshev YV. Mitochondrial aging and age-related dysfunction of mitochondria. Biomed Res Int 2014: 238463, 2014. doi: 10.1155/2014/238463. [DOI] [PMC free article] [PubMed] [Google Scholar]
- 27.Brown DA, O'Rourke B. Cardiac mitochondria and arrhythmias. Cardiovasc Res 88: 241–249, 2010. doi: 10.1093/cvr/cvq231. [DOI] [PMC free article] [PubMed] [Google Scholar]
- 28.Yang KC, Bonini MG, Dudley SC Jr.. Mitochondria and arrhythmias. Free Radic Biol Med 71: 351–361, 2014. doi: 10.1016/j.freeradbiomed.2014.03.033. [DOI] [PMC free article] [PubMed] [Google Scholar]
- 29.Ji LL, Yeo D. Mitochondrial dysregulation and muscle disuse atrophy. F1000Res 8: 1621, 2019. doi: 10.12688/f1000research.19139.1. [DOI] [PMC free article] [PubMed] [Google Scholar]
- 30.Hyatt H, Deminice R, Yoshihara T, Powers SK. Mitochondrial dysfunction induces muscle atrophy during prolonged inactivity: a review of the causes and effects. Arch Biochem Biophys 662: 49–60, 2019. doi: 10.1016/j.abb.2018.11.005. [DOI] [PMC free article] [PubMed] [Google Scholar]
- 31.Ryschon TW, Fowler MD, Wysong RE, Anthony A, Balaban RS. Metabolic efficiency of human muscle in vivo: comparison of isometric, concentric and eccentric muscle action. J Appl Physiol 83: 867–874, 1997. doi: 10.1152/jappl.1997.83.3.867. [DOI] [PubMed] [Google Scholar]
- 32.Smith NP, Barclay CJ, Loiselle DS. The efficiency of muscle contraction. Prog Biophys Mol Biol 88: 1–58, 2005. doi: 10.1016/j.pbiomolbio.2003.11.014. [DOI] [PubMed] [Google Scholar]
- 33.Rapoport S. 51 to 49 years ago: Lohmann and ATP. Trends Biochem Sci 3: 163, 1978. doi: 10.1016/S0968-0004(78)90392-4. [DOI] [Google Scholar]
- 34.Hill AV. A challange to biochemists. Biochim Biophys Acta 4: 4–11, 1950. doi: 10.1016/0006-3002(50)90003-5. [DOI] [PubMed] [Google Scholar]
- 35.Cain DF, Davies RE. Breakdown of adenosine triphosphate during a single contraction of working muscle. Biochem Biophys Res Commun 8: 361–366, 1962. doi: 10.1016/0006-291X(62)90008-6. [DOI] [PubMed] [Google Scholar]
- 36.Infante AA, Davies RE. Adenosine triphosphate breakdown during a single isotonic twitch of frog sartorius muscle. Biochem Biophys Res 9: 410–415, 1962. doi: 10.1016/0006-291X(62)90025-6. [DOI] [PubMed] [Google Scholar]
- 37.Wollenberger A. Relation between work and labile phosphate content in the isolated dog heart. Circ Res 5: 175–178, 1957. doi: 10.1161/01.res.5.2.175. [DOI] [PubMed] [Google Scholar]
- 38.Neely JR, Denton RM, England PJ, Randle PJ. The effects of increased heart work on the tricarboxylate cycle and its interactions with glycolysis in the perfused rat heart. Biochem J 128: 147–159, 1972. doi: 10.1042/bj1280147. [DOI] [PMC free article] [PubMed] [Google Scholar]
- 39.Boerth RC, Covell JW, Seagren SC, Pool PE. High -energy phosphate concentrations in dog myocardium during stress. Am J Physiol 216: 1103–1106, 1969. doi: 10.1152/ajplegacy.1969.216.5.1103. [DOI] [PubMed] [Google Scholar]
- 40.Balaban RS. The application of nuclear magnetic resonance to the study of cellular physiology. Am J Physiol Cell Physiol 246: C10–C19, 1984. doi: 10.1152/ajpcell.1984.246.1.C10. [DOI] [PubMed] [Google Scholar]
- 41.Balaban RS. Regulation of oxidative phosphorylation in the mammalian cell. Am J Physiol Cell Physiol 258: C377–C389, 1990. doi: 10.1152/ajpcell.1990.258.3.C377. [DOI] [PubMed] [Google Scholar]
- 42.Meyer RA, Brown TR, Kushmerick MJ. Phosphorus nuclear magnetic resonance of fast- and slow-twitch muscle. Am J Physiol Cell Physiol 248: C279–C287, 1985. doi: 10.1152/ajpcell.1985.248.3.C279. [DOI] [PubMed] [Google Scholar]
- 43.Hoult DI, Busby SJ, Gadian DG, Radda GK, Richards RE, Seeley PJ. Observation of tissue metabolites using 31P nuclear magnetic resonance. Nature 252: 285–287, 1974. doi: 10.1038/252285a0. [DOI] [PubMed] [Google Scholar]
- 44.Veech RL, Lawson JW, Cornell NW, Krebs HA. Cytosolic phosphorylation potential. J Biol Chem 254: 6538–6547, 1979. doi: 10.1016/S0021-9258(18)50401-4. [DOI] [PubMed] [Google Scholar]
- 45.Balaban RS. Perspectives on: SGP symposium on mitochondrial physiology and medicine: metabolic homeostasis of the heart. J Gen Physiol 139: 407–414, 2012. doi: 10.1085/jgp.201210783. [DOI] [PMC free article] [PubMed] [Google Scholar]
- 46.Arnold DL, Matthews PM, Radda GK. metabolic recovery after exercise and the assessment of mitochondrial function in Vivo in human skeletal muscle by means of 31P NMR. Magn Reson Med 1: 307–315, 1984. doi: 10.1002/mrm.1910010303. [DOI] [PubMed] [Google Scholar]
- 47.Chance B, Leigh JS, Clark BJ, Maris J, Kent J, Nioka S, Smith D. Control of oxidative metabolism and oxygen delivery in human skeletal muscle: a steady-state analysis of the work/energy cost transfer function. Proc Natl Acad Sci U S A 82: 8384–8388, 1985. doi: 10.1073/pnas.82.24.8384. [DOI] [PMC free article] [PubMed] [Google Scholar]
- 48.Funk C, Clark A, Connett RJ. How phosphocreatine buffers cyclic changes in ATP demand in working muscle. Adv Exp Med Biol 248: 687–692, 1989. doi: 10.1007/978-1-4684-5643-1_76. [DOI] [PubMed] [Google Scholar]
- 49.Bylund-Fellenius AC, Walker PM, Elander A, Holm S, Holm J, Scherstén T. Energy metabolism in relation to oxygen partial pressure in human skeletal muscle during exercise. Biochem J 200: 247–255, 1981. doi: 10.1042/bj2000247. [DOI] [PMC free article] [PubMed] [Google Scholar]
- 50.Balaban RS, Kantor HL, Katz LA, Briggs RW. Relation between work and phosphate metabolite in the in vivo paced mammalian heart. Science 232: 1121–1123, 1986. doi: 10.1126/science.3704638,10.1126/science.232.4746.112. doi:. [DOI] [PubMed] [Google Scholar]
- 51.Robitaille PM, Merkle H, Lew B, Path G, Hendrich K, Lindstrom P, Garwood M, Bache RJ, Uğurbil K. Transmural high energy phosphate distribution and response to alterations in workload in the normal canine myocardium as studied with spatially localized 31P NMR spectroscopy. Magn Reson Med 16: 91–116, 1990. doi: 10.1002/mrm.1910160110. [DOI] [PubMed] [Google Scholar]
- 52.Zhang J, Duncker DJ, Xu Y, Zhang Y, Path G, Merkle H, Hendrich K, From AH, Bache RJ, Uğurbil K. Transmural bioenergetic responses of normal myocardium to high workstates. Am J Physiol Heart Circ Physiol 268: H1891–H1911, 1995. doi: 10.1152/ajpheart.1995.268.5.H1891. [DOI] [PubMed] [Google Scholar]
- 53.Koretsky AP, Wang S, Murphy-Boesch J, Klein MP, James TL, Weiner MW. 31P NMR spectroscopy of rat organs in situ, using chronically implanted radiofrequency coils. Proc Natl Acad Sci U S A 80: 7491–7495, 1983. doi: 10.1073/pnas.80.24.7491. [DOI] [PMC free article] [PubMed] [Google Scholar]
- 54.Koretsky AP, Williams DS, Ho C. Absence of pH changes during altered work in the in vivo sheep heart: a 31P NMR investigation. Mol Cell Cardiol 22: 543–553, 1990. doi: 10.1016/0022-2828(90)90956-3. [DOI] [PubMed] [Google Scholar]
- 55.Massie BM, Schwartz GG, Garcia J, Wisneski JA, Weiner MW, Owens T. Myocardial metabolism during increased work states in the porcine left ventricle in vivo. Circ Res 74: 64–10, 1994. doi: 10.1161/01.RES.74.1.64. [DOI] [PubMed] [Google Scholar]
- 56.Schaefer S, Schwartz GG, Steinman SK, Meyerhoff DJ, Massie BM, Weiner MW. Metabolic response of the human heart to inotropic stimulation: in vivo phosphorus-31 studies of normal and cardiomyopathic myocardium. Magn Reson Med 25: 260–272, 1992. doi: 10.1002/mrm.1910250205. [DOI] [PubMed] [Google Scholar]
- 57.Weiss RG, Bottomley PA, Hardy CJ, Gerstenblith G. Regional myocardial metabolism of high-energy phosphates during isometric exercise in patients with coronary artery disease. N Engl J Med 323: 1593–1600, 1990. doi: 10.1056/NEJM199012063232304. [DOI] [PubMed] [Google Scholar]
- 58.Hochachka PW, McClelland GB. Cellular metabolic homeostasis during large-scale change in ATP turnover rates in muscles. J Exp Biol 200: 381–386, 1997. doi: 10.1242/jeb.200.2.381. [DOI] [PubMed] [Google Scholar]
- 59.Balaban RS. Maintenance of the metabolic homeostasis of the heart: developing a systems analysis approach. Ann N Y Acad Sci 1080: 140–153, 2006. doi: 10.1196/annals.1380.013. [DOI] [PubMed] [Google Scholar]
- 60.Goodwin GW, Taegtmeyer H. Improved energy homeostasis of the heart in the metabolic state of exercise. Am J Physiol Heart Circ Physiol 279: H1490–H1501, 2000. doi: 10.1152/ajpheart.2000.279.4.H1490. [DOI] [PubMed] [Google Scholar]
- 61.Lardy HA, Wellman H. Oxidative phosphorylations: role of inorganic phosphate as an acceptor systems in control of metabolic rate. J Biol Chem 185: 215–224, 1952. [PubMed] [Google Scholar]
- 62.Chance B, Williams GR. The respiratory chain and oxidative phosphorylation. Adv Enzymol Relat Subj Biochem 17: 65–134, 1956. doi: 10.1002/9780470122624.ch2. [DOI] [PubMed] [Google Scholar]
- 63.Jacobus WE, Moreadith RW, Vandegaer KM. Mitochondrial respiratory control: evidence against the regulation of respiration by extramitochondrial phosphorylation potentials or by ATP/ADP ratios. J Biol Chem 257: 2397–2402, 1982. doi: 10.1016/S0021-9258(18)34936-6. [DOI] [PubMed] [Google Scholar]
- 64.Jeneson JA, Wiseman RW, Westerhoff HV, Kushmerick MJ. The signal transduction function for oxidative phosphorylation is at least second order in ADP. J Biol Chem 271: 27995–27998, 1996. doi: 10.1074/jbc.271.45.27995. [DOI] [PubMed] [Google Scholar]
- 65.Jeneson JA, Schmitz JP, van den Broek NM, van Riel NA, Hilbers PA, Nicolay K, Prompers JJ. Magnitude and control of mitochondrial sensitivity to ADP. Am J Physiol Endocrinol Metab 297: E774–E784, 2009. doi: 10.1152/ajpendo.00370.2009. [DOI] [PMC free article] [PubMed] [Google Scholar]
- 66.Aliev MK, Saks VA. Compartmentalized energy transfer in cardiomyocytes: use of mathematical modeling for analysis of in vivo regulation of respiration. Biophys J 73: 428–445, 1997. doi: 10.1016/S0006-3495(97)78082-2. [DOI] [PMC free article] [PubMed] [Google Scholar]
- 67.Denton RM, McCormack JG. On the role of the calcium transport cycle in heart and other mammalian mitochondria. FEBS Lett 119: 1–8, 1980. doi: 10.1016/0014-5793(80)80986-0. [DOI] [PubMed] [Google Scholar]
- 68.Glancy B, Willis WT, Chess DJ, Balaban RS. Effect of calcium on the oxidative phosphorylation cascade in skeletal muscle mitochondria. Biochemistry 52: 2793–2809, 2013. doi: 10.1021/bi3015983. [DOI] [PMC free article] [PubMed] [Google Scholar]
- 69.Glancy B, Balaban RS. Role of mitochondrial Ca2+ in the regulation of cellular energetics. Biochemistry 51: 2959–2973, 2012. doi: 10.1021/bi2018909. [DOI] [PMC free article] [PubMed] [Google Scholar]
- 70.Wust RC. Kinetic control of oxygen consumption during contractions in self-perfused skeletal muscle. J Physiol 589: 3995–4009, 2011. doi: 10.1113/jphysiol.2010.203422. [DOI] [PMC free article] [PubMed] [Google Scholar]
- 71.Korzeniewski B, Zoladz JA. Factors determining the oxygen consumption rate (VO2) on-kinetics in skeletal muscles. Biochem J 379: 703–710, 2004. doi: 10.1042/bj20031740. doi:. [DOI] [PMC free article] [PubMed] [Google Scholar]
- 72.Pan X, Liu J, Nguyen T, Liu C, Sun J, Teng Y, Fergusson MM, Rovira II, Allen M, Springer DA, Aponte AM, Gucek M, Balaban RS, Murphy E, Finkel T. The physiological role of mitochondrial calcium revealed by mice lacking the mitochondrial calcium uniporter. Nat Cell Biol 15: 1464–1472, 2013. doi: 10.1038/ncb2868. [DOI] [PMC free article] [PubMed] [Google Scholar]
- 73.Holmström KM, Pan X, Liu JC, Menazza S, Liu J, Nguyen TT, Pan H, Parks RJ, Anderson S, Noguchi A, Springer D, Murphy E, Finkel T. Assessment of cardiac function in mice lacking the mitochondrial calcium uniporter. J Mol Cell Cardiol 85: 178–182, 2015. doi: 10.1016/j.yjmcc.2015.05.022. [DOI] [PMC free article] [PubMed] [Google Scholar]
- 74.Liu JC, Syder NC, Ghorashi NS, Willingham TB, Parks RJ, Sun J, Fergusson MM, Liu J, Holmström KM, Menazza S, Springer DA, Liu C, Glancy B, Finkel T, Murphy E. EMRE is essential for mitochondrial calcium uniporter activity in a mouse model. JCI Insight 5: e134063, 2020. doi: 10.1172/jci.insight.134063. [DOI] [PMC free article] [PubMed] [Google Scholar]
- 75.Luongo TS, Lambert JP, Yuan A, Zhang X, Gross P, Song J, Shanmughapriya S, Gao E, Jain M, Houser SR, Koch WJ, Cheung JY, Madesh M, Elrod JW. The mitochondrial calcium uniporter matches energetic supply with cardiac workload during stress and modulates permeability transition. Cell Rep 12: 23–34, 2015. doi: 10.1016/j.celrep.2015.06.017. [DOI] [PMC free article] [PubMed] [Google Scholar]
- 76.Kwong JQ, Lu X, Correll RN, Schwanekamp JA, Vagnozzi RJ, Sargent MA, York AJ, Zhang J, Bers DM, Molkentin JD. The mitochondrial calcium uniporter selectively matches metabolic output to acute contractile stress in the heart. Cell Rep 12: 15–22, 2015. doi: 10.1016/j.celrep.2015.06.002. [DOI] [PMC free article] [PubMed] [Google Scholar]
- 77.Fell DA, Thomas S. Physiological control of metabolic flux: the requirement for multisite modulation. Biochem J 311: 35–39, 1995. doi: 10.1042/bj3110035. [DOI] [PMC free article] [PubMed] [Google Scholar]
- 78.Korzeniewski B. Regulation of oxidative phosphorylation is different in electrically- and cortically-stimulated skeletal muscle. PLoS One 13: e0195620, 2018. doi: 10.1371/journal.pone.0195620. [DOI] [PMC free article] [PubMed] [Google Scholar]
- 79.Jones DP, Shan X, Park Y. Coordinated multisite regulation of cellular-energy metabolism. Annu Rev Nutr 12: 327–343, 1992. doi: 10.1146/annurev.nu.12.070192.001551. [DOI] [PubMed] [Google Scholar]
- 80.Korzeniewski B. Regulation of ATP supply during muscle contraction: theoretical studies. Biochem J 330:1189–95., 1998. doi: 10.1042/bj3301189. [DOI] [PMC free article] [PubMed] [Google Scholar]
- 81.Korzeniewski B. Regulation of ATP supply in mammalian skeletal muscle during resting state–>intensive work transition. Biophys Chem 83: 19–34, 2000. doi: 10.1016/S0301-4622(99)00120-9. [DOI] [PubMed] [Google Scholar]
- 82.Korzeniewski B. Regulation of oxidative phosphorylation through parallel activation. Biophys Chem 129: 93–110, 2007. doi: 10.1016/j.bpc.2007.05.013. [DOI] [PubMed] [Google Scholar]
- 83.Richter EA, Ruderman NB. AMPK and the biochemistry of exercise: implications for human health and disease. Biochem J 418: 261–275, 2009. doi: 10.1042/BJ20082055. [DOI] [PMC free article] [PubMed] [Google Scholar]
- 84.Saks V, Beraud N, Wallimann T. Metabolic compartmentation - a system level property of muscle cells: real problems of diffusion in living cells. Int J Mol Sci 9: 751–767, 2008. doi: 10.3390/ijms9050751. [DOI] [PMC free article] [PubMed] [Google Scholar]
- 85.Kobayashi K, Neely JR. Control of maximum rates of glycolysis in rat cardiac muscle. Circ Res 44: 166–175, 1979. doi: 10.1161/01.RES.44.2.166. doi:. [DOI] [PubMed] [Google Scholar]
- 86.Vary TC, Reibel DK, Neely JR. Control of energy metabolism heart muscle. Annu Rev Physiol 43: 419–430, 1981. doi: 10.1146/annurev.ph.43.030181.002223. [DOI] [PubMed] [Google Scholar]
- 87.Loiselle DS. Cardiac basal and activation metabolism. Basic Res Cardiol 82: 37–50, 1987. doi: 10.1007/978-3-662-11289-2_4. [DOI] [PubMed] [Google Scholar]
- 88.Mootha VK, Arai AE, Balaban RS. Maximum oxidative phosphorylation capacity of the mammalian heart. Am J Physiol Heart Circ Physiol 272: H769–H775, 1997. doi: 10.1152/ajpheart.1997.272.2.H769. [DOI] [PubMed] [Google Scholar]
- 89.Phillips D, Covian R, Aponte AM, Glancy B, Taylor JF, Chess D, Balaban RS. Regulation of oxidative phosphorylation complex activity: effects of tissue-specific metabolic stress within an allometric series and acute changes in workload. Am J Physiol Regul Integr Comp Physiol 302: R1034–48, 2012. doi: 10.1152/ajpregu.00596.2011. [DOI] [PMC free article] [PubMed] [Google Scholar]
- 90.Poole DC. Edward f. adolph distinguished lecture. contemporary model of muscle microcirculation: gateway to function and dysfunction. J Appl Physiol (1985) 127: 1012–1033, 2019. doi: 10.1152/japplphysiol.00013.2019. [DOI] [PMC free article] [PubMed] [Google Scholar]
- 91.Richardson RS, Noyszewski EA, Kendrick KF, Leigh JS, Wagner PD. Myoglobin O2 desaturation during exercise. Evidence of limited O2 transport. J Clin Invest 96: 1916–1926, 1995. doi: 10.1172/JCI118237. [DOI] [PMC free article] [PubMed] [Google Scholar]
- 92.Hirai DM, Craig JC, Colburn TD, Eshima H, Kano Y, Sexton WL, Musch TI, Poole DC. Skeletal muscle microvascular and interstitial from rest to contractions. J Physiol 596: 869–883, 2018. doi: 10.1113/JP275170. [DOI] [PMC free article] [PubMed] [Google Scholar]
- 93.Marcinek DJ, Ciesielski WA, Conley KE, Schenkman KA. Oxygen regulation and limitation to cellular respiration in mouse skeletal muscle in vivo. Am J Physiol Heart Circ Physiol 285: H1900–H1908, 2003. doi: 10.1152/ajpheart.00192.2003. [DOI] [PubMed] [Google Scholar]
- 94.Gayeski T, Honig CR. Intracellular po2 in long axis of individual fibers in working dog gracilis muscle. Am J Physiol Heart Circ Physiol 254: H1179–H1186, 1988. doi: 10.1152/ajpheart.1988.254.6.H1179. [DOI] [PubMed] [Google Scholar]
- 95.Gayeski TE, Connett RJ, Honig CR. Minimum intracellular po2 for maximum cytochrome turnover in red muscle in situ. Am J Physiol Heart Circ Physiol 252: H906–H1015, 1987. doi: 10.1152/ajpheart.1987.252.5.H906. [DOI] [PubMed] [Google Scholar]
- 96.Davies KJ, Packer L, Brooks GA. Biochemical adaptation of mitochondria, muscle, and whole-animal respiration to endurance training. Arch Biochem Biophys 209: 539–554, 1981. doi: 10.1016/0003-9861(81)90312-X. [DOI] [PubMed] [Google Scholar]
- 97.Gollnick PD, Armstrong RB, Saltin B, Saubert CW, Sembrowich WL, Shepherd RE. Effect of training on enzyme activity and fiber composition of human skeletal muscle. J Appl Physiol 34: 107–111, 1973. doi: 10.1152/jappl.1973.34.1.107. [DOI] [PubMed] [Google Scholar]
- 98.Fitts RH, Booth FW, Winder WW, Holloszy JO. Skeletal muscle respiratory capacity, endurance, and glycogen utilization. Am J Physiol 228: 1029–1033, 1975. doi: 10.1152/ajplegacy.1975.228.4.1029. [DOI] [PubMed] [Google Scholar]
- 99.di Prampero PE. Metabolic and circulatory limitations to VO2 max at the whole animal level. J Exp Biol 115: 319–331, 1985. doi: 10.1242/jeb.115.1.319. [DOI] [PubMed] [Google Scholar]
- 100.Wagner PD. New ideas on limitations to VO2max. Exerc Sport Sci Rev 28: 10–14, 2000. [PubMed] [Google Scholar]
- 101.Bassett DR, Jr, Howley ET. Limiting factors for maximum oxygen uptake and determinants of endurance performance. Med Sci Sports Exerc 32: 70–84, 2000. [DOI] [PubMed] [Google Scholar]
- 102.Gabriel BM, Zierath JR. The limits of exercise physiology: from performance to health. Cell Metab 25: 1000–1011, 2017. doi: 10.1016/j.cmet.2017.04.018. [DOI] [PubMed] [Google Scholar]
- 103.Skattebo Ø, Capelli C, Rud B, Auensen M, Calbet JA, Hallén J. Increased oxygen extraction and mitochondrial protein expression after small muscle mass endurance training. Scand J Med Sci Sports 30: 1615–1631, 2020. doi: 10.1111/sms.13707. [DOI] [PubMed] [Google Scholar]
- 104.Boushel R, Gnaiger E, Larsen FJ, Helge JW, González-Alonso J, Ara I, Munch-Andersen T, van Hall G, Søndergaard H, Saltin B, Calbet JA. Maintained peak leg and pulmonary VO2 despite substantial reduction in muscle mitochondrial capacity. Scand J Med Sci Sports 25: 135–143, 2015. doi: 10.1111/sms.12613. [DOI] [PubMed] [Google Scholar]
- 105.Lundby C, Montero D. CrossTalk opposing view: Diffusion limitation of O2 from microvessels into muscle does not contribute to the limitation of VO2 max. J Physiol 593: 3759–3761, 2015. doi: 10.1113/JP270550. [DOI] [PMC free article] [PubMed] [Google Scholar]
- 106.Wagner PD. CrossTalk proposal: diffusion limitation of O2 from microvessels into muscle does contribute to the limitation of VO2 max. J Physiol 593: 3757–3758, 2015. doi: 10.1113/JP270551. [DOI] [PMC free article] [PubMed] [Google Scholar]
- 107.Kusters YH, Barrett EJ. Muscle microvasculature's structural and functional specializations facilitate muscle metabolism. Am J Physiol Endocrinol Metab 310: E379–E387, 2016. doi: 10.1152/ajpendo.00443.2015. [DOI] [PMC free article] [PubMed] [Google Scholar]
- 108.Bagher P, Segal SS. Regulation of blood flow in the microcirculation: role of conducted vasodilation. Acta Physiol (Oxf) 202: 271–284, 2011. doi: 10.1111/j.1748-1716.2010.02244.x. [DOI] [PMC free article] [PubMed] [Google Scholar]
- 109.Socha MJ, Segal SS. Microvascular mechanisms limiting skeletal muscle blood flow with advancing age. J Appl Physiol (1985) 125: 1851–1859, 2018. doi: 10.1152/japplphysiol.00113.2018. [DOI] [PMC free article] [PubMed] [Google Scholar]
- 110.Johnson DT, Harris RA, Blair PV, Balaban RS. Functional consequences of mitochondrial proteome heterogeneity. Am J Physiol Cell Physiol 292: C698–C707, 2007. doi: 10.1152/ajpcell.00109.2006. [DOI] [PubMed] [Google Scholar]
- 111.Wiśniewski JR, Gizak A, Rakus D. Integrating proteomics and enzyme kinetics reveals tissue-specific types of the glycolytic and gluconeogenic pathways. J Proteome Res 14: 3263–3273, 2015. doi: 10.1021/acs.jproteome.5b00276. [DOI] [PubMed] [Google Scholar]
- 112.Bücher T, Sies H. Steady state relaxation of enolase in vitro and metabolic throughput in vivo of red and white rabbit muscles. Eur J Biochem 8: 273–283, 1969. doi: 10.1111/j.1432-1033.1969.tb00524.x. [DOI] [PubMed] [Google Scholar]
- 113.Newsholme EA, Crabtree B. Maximum catalytic activity of some key enzymes in provision of physiologically useful information about metabolic fluxes. J Exp Zool 239: 159–167, 1986. doi: 10.1002/jez.1402390203. [DOI] [PubMed] [Google Scholar]
- 114.Shestov AA, Liu X, Ser Z, Cluntun AA, Hung YP, Huang L, Kim D, Le A, Yellen G, Albeck JG, Locasale JW. Quantitative determinants of aerobic glycolysis identify flux through the enzyme GAPDH as a limiting step. eLife 3: e03342, 2014. doi: 10.7554/eLife.03342. [DOI] [PMC free article] [PubMed] [Google Scholar]
- 115.Suarez RK, Staples JF, Lighton JR, West TG. Relationships between enzymatic flux capacities and metabolic flux rates: nonequilibrium reactions in muscle glycolysis. Proc Natl Acad Sci U S A 94: 7065–7069, 1997. doi: 10.1073/pnas.94.13.7065. [DOI] [PMC free article] [PubMed] [Google Scholar]
- 116.Gibb AA, Epstein PN, Uchida S, Zheng Y, McNally LA, Obal D, Katragadda K, Trainor P, Conklin DJ, Brittian KR, Tseng MT, Wang J, Jones SP, Bhatnagar A, Hill BG. Exercise-induced changes in glucose metabolism promote physiological cardiac growth. Circulation 136: 2144–2157, 2017. doi: 10.1161/CIRCULATIONAHA.117.028274. [DOI] [PMC free article] [PubMed] [Google Scholar]
- 117.Hill BG. A metabocentric view of cardiac remodeling. Curr Opin Physiol 10: 43–48, 2019. doi: 10.1016/j.cophys.2019.04.004. [DOI] [PMC free article] [PubMed] [Google Scholar]
- 118.Nascimben L, Ingwall JS, Lorell BH, Pinz I, Schultz V, Tornheim K, Tian R. Mechanisms for increased glycolysis in the hypertrophied rat heart. Hypertension 44: 662–667, 2004. doi: 10.1161/01.HYP.0000144292.69599.0c. [DOI] [PubMed] [Google Scholar]
- 119.Schwerzmann K, Hoppeler H, Kayar SR, Weibel ER. Oxidative capacity of muscle and mitochondria: correlation of physiological, biochemical, and morphometric characteristics. Proc Natl Acad Sci U S A 86: 1583–1587, 1989. doi: 10.1073/pnas.86.5.1583. [DOI] [PMC free article] [PubMed] [Google Scholar]
- 120.Groen AK, Wanders RJ, Westerhoff HV, van der Meer R, Tager JM. Quantification of the contribution of various steps to the control of mitochondrial respiration. J Biol Chem 257: 2754–2757, 1982. doi: 10.1016/S0021-9258(19)81026-8. [DOI] [PubMed] [Google Scholar]
- 121.Rossignol R, Letellier T, Malgat M, Rocher C, Mazat JP. Tissue variation in the control of oxidative phosphorylation: implication for mitochondrial diseases. Biochem J 347: 45–53, 2000. doi: 10.1042/bj3470045. doi:. [DOI] [PMC free article] [PubMed] [Google Scholar]
- 122.Tager JM, Groen AK, Wanders RJ, Duszynski J, Westerhoff HV, Vervoorn RC. Control of mitochondrial respiration. Biochem Soc Trans 11: 40–43, 1983. doi: 10.1042/bst0110040. [DOI] [PubMed] [Google Scholar]
- 123.Suarez RK. Upper limits to mass-specific metabolic rates. Annu Rev Physiol 58: 583–605, 1996. doi: 10.1146/annurev.ph.58.030196.003055. [DOI] [PubMed] [Google Scholar]
- 124.Albe KR, Butler MH, Wright BE. Cellular concentrations of enzymes and their substrates. J Theor Biol 143: 163–195, 1990. doi: 10.1016/S0022-5193(05)80266-8. [DOI] [PubMed] [Google Scholar]
- 125.Maughan DW, Henkin JA, Vigoreaux JO. Concentrations of glycolytic enzymes and other cytosolic proteins in the diffusible fraction of a vertebrate muscle proteome. Mol Cell Proteomics 4: 1541–1549, 2005. doi: 10.1074/mcp.M500053-MCP200. [DOI] [PubMed] [Google Scholar]
- 126.Scopes RK, Stoter A. Purification of all glycolytic enzymes from one muscle extract. Methods Enzymol 90: 479–490, 1982. doi: 10.1016/s0076-6879(82)90175-6. [DOI] [PubMed] [Google Scholar]
- 127.Peter JB, Barnard RJ, Edgerton VR, Gillespie CA, Stempel KE. Metabolic profiles of three fiber types of skeletal muscle in guinea pigs and rabbits. Biochemistry 11: 2627–2633, 1972. doi: 10.1021/bi00764a013. [DOI] [PubMed] [Google Scholar]
- 128.Golisch G, Pette D, Pichlmaier H. Metabolic differentiation of rabbit skeletal muscle as induced by specific innervation. Eur J Biochem 16: 110–116, 1970. doi: 10.1111/j.1432-1033.1970.tb01060.x. [DOI] [PubMed] [Google Scholar]
- 129.Ardawi MS, Majzoub MF, Masoud IM, Newsholme EA. Enzymic and metabolic adaptations in the gastrocnemius, plantaris and soleus muscles of hypocaloric rats. Biochem J 261: 219–225, 1989. doi: 10.1042/bj2610219. [DOI] [PMC free article] [PubMed] [Google Scholar]
- 130.Lindena J, Sommerfeld U, Höpfel C, Trautschold I. Catalytic enzyme activity concentration in tissues of man, dog, rabbit, guinea pig, rat and mouse. Approach to a quantitative diagnostic enzymology. III. Communication. Clin Chem Lab Med 24: 35, 1986. doi: 10.1515/cclm.1986.24.1.35. [DOI] [PubMed] [Google Scholar]
- 131.Korfage JA, Helmers R, Matignon MD, van Wessel T, Langenbach GE, van Eijden TM. Postnatal development of fiber type composition in rabbit jaw and leg muscles. Cells Tissues Organs 190: 42–52, 2009. doi: 10.1159/000155226. [DOI] [PubMed] [Google Scholar]
- 132.Murakami U, Uchida K. Contents of myofibrillar proteins in cardiac, skeletal, and smooth muscles. J Biochem 98: 187–197, 1985. doi: 10.1093/oxfordjournals.jbchem.a135257. [DOI] [PubMed] [Google Scholar]
- 133.Deshmukh AS, Murgia M, Nagaraj N, Treebak JT, Cox J, Mann M. Deep proteomics of mouse skeletal muscle enables quantitation of protein isoforms, metabolic pathways and transcription factors. Mol Cell Proteomics 14: 841–853, 2015. doi: 10.1074/mcp.M114.044222. [DOI] [PMC free article] [PubMed] [Google Scholar]
- 134.Leberer E, Pette D. Immunochemical quantification of sarcoplasmic reticulum Ca-ATPase, of calsequestrin and of parvalbumin in rabbit skeletal muscles of defined fiber composition. Eur J Biochem 156: 489–496, 1986. doi: 10.1111/j.1432-1033.1986.tb09607.x. [DOI] [PubMed] [Google Scholar]
- 135.Kim Y, Yang DS, Katti P, Glancy B. Protein composition of the muscle mitochondrial reticulum during postnatal development. J Physiol 597: 2707–2727, 2019. doi: 10.1113/JP277579. [DOI] [PMC free article] [PubMed] [Google Scholar]
- 136.Balaban RS. Modeling mitochondrial function. Am J Physiol Cell Physiol 291: C1107–C1103, 2006. doi: 10.1152/ajpcell.00223.2006. [DOI] [PubMed] [Google Scholar]
- 137.Jackman MR, Willis WT. Characteristics of mitochondria isolated from type I and type IIb skeletal muscle. Am J Physiol Cell Physiol 270: C673–C678, 1996. doi: 10.1152/ajpcell.1996.270.2.C673. [DOI] [PubMed] [Google Scholar]
- 138.Pette D, Dolken G. Some aspects of regulation of enzyme levels in muscle energy-supplying metabolism. Adv Enzyme Regul 13: 355–377, 1975. doi: 10.1016/0065-2571(75)90025-4. [DOI] [PubMed] [Google Scholar]
- 139.Fischer H, Polikarpov I, Craievich AF. Average protein density is a molecular-weight-dependent function. Protein Sci 13: 2825–2828, 2004. doi: 10.1110/ps.04688204. [DOI] [PMC free article] [PubMed] [Google Scholar]
- 140.Dietrich DL, Elzinga G. ATP formation and energy demand in anoxic heart muscle of the rabbit. Am J Physiol Heart Circ Physiol 263: H526–H532, 1992. doi: 10.1152/ajpheart.1992.263.2.H526. [DOI] [PubMed] [Google Scholar]
- 141.Kuzmiak-Glancy S, Covian R, Femnou AN, Glancy B, Jaimes R, Wengrowski AM, Garrott K, French SA, Balaban RS, Kay MW. Cardiac performance is limited by oxygen delivery to the mitochondria in the crystalloid-perfused working heart. Am J Physiol Heart Circ Physiol 314: H704–H715, 2018. doi: 10.1152/ajpheart.00321.2017. [DOI] [PMC free article] [PubMed] [Google Scholar]
- 142.Jaworowski A, Porter MM, Holmbäck AM, Downham D, Lexell J. Enzyme activities in the tibialis anterior muscle of young moderately active men and women: relationship with body composition, muscle cross-sectional area and fibre type composition. Acta Physiol Scand 176: 21–25, 2002.doi: 10.1046/j.1365-201X.2002.t01-2-01004.x. [DOI] [PubMed] [Google Scholar]
- 143.Russ DW, Lanza IR, Rothman D, Kent-Braun JA. Sex differences in glycolysis during brief, intense isometric contractions. Muscle Nerve 32: 647–655, 2005. doi: 10.1002/mus.20396. [DOI] [PubMed] [Google Scholar]
- 144.Glancy B, Balaban RS. Protein composition and function of red and white skeletal muscle mitochondria. Am J Physiol Cell Physiol 300: C1280–C1290, 2011. doi: 10.1152/ajpcell.00496.2010. [DOI] [PMC free article] [PubMed] [Google Scholar]
- 145.Olsson U. Aerospace Propulsion from Insects to Spaceflight. Gothenburg, Sweden: Volvo, 2006. [Google Scholar]
- 146.Kooragayala K, Gotoh N, Cogliati T, Nellissery J, Kaden TR, French S, Balaban R, Li W, Covian R, Swaroop A. Quantification of oxygen consumption in retina ex vivo demonstrates limited reserve capacity of photoreceptor mitochondria. Invest Ophthalmol Vis Sci 56: 8428–8436, 2015. doi: 10.1167/iovs.15-17901. [DOI] [PMC free article] [PubMed] [Google Scholar]
- 147.Vinnakota KC, Bassingthwaighte JB. Myocardial density and composition: a basis for calculating intracellular metabolite concentrations. Am J Physiol Heart Circ Physiol 286: H1742–H1749, 2004. doi: 10.1152/ajpheart.00478.2003. [DOI] [PubMed] [Google Scholar]
- 148.Cori CF. The glucose-lactic acid cycle and gluconeogenesis. Curr Top Cell Regul 18: 377–387, 1981. doi: 10.1016/B978-0-12-152818-8.50028-1. [DOI] [PubMed] [Google Scholar]
- 149.Laughlin MR, Taylor JF, Chesnick AS, Balaban RS. Regulation of glycogen metabolism in canine myocardium: effects of insulin and epinephrine in vivo. Am J Physiol Endocrinol Metab 262: E875–83, 1992. doi: 10.1152/ajpendo.1992.262.6.E875. [DOI] [PubMed] [Google Scholar]
- 150.Laughlin MR, Taylor J, Chesnick AS, Balaban RS. Nonglucose substrates increase glycogen synthesis in vivo in dog heart. Am J Physiol Heart Circ Physiol 267: H219–H233, 1994. [DOI] [PubMed] [Google Scholar]
- 151.Nozaki T, Kagaya Y, Ishide N, Kitada S, Miura M, Nawata J, Ohno I, Watanabe J, Shirato K. Interaction between sarcomere and mitochondrial length in normoxic and hypoxic rat ventricular papillary muscles. Cardiovasc Pathol 10: 125–132, 2001. doi: 10.1016/S1054-8807(01)00071-0. [DOI] [PubMed] [Google Scholar]
- 152.Reipert S, Steinböck F, Fischer I, Bittner RE, Zeöld A, Wiche G. Association of mitochondria with plectin and desmin intermediate filaments in striated muscle. Exp Cell Res 252: 479–491, 1999. doi: 10.1006/excr.1999.4626. [DOI] [PubMed] [Google Scholar]
- 153.Gertz EW, Wisneski JA, Stanley WC, Neese RA. Myocardial substrate utilization during exercise in humans. Dual carbon-labeled carbohydrate isotope experiments. J Clin Invest 82: 2017–2025, 1988. doi: 10.1172/JCI113822. [DOI] [PMC free article] [PubMed] [Google Scholar]
- 154.Wisneski JA, Gertz EW, Neese RA, Gruenke LD, Morris DL, Craig JC. Metabolic fate of extracted glucose in normal human myocardium. J Clin Invest 76: 1819–1827, 1985.doi: 10.1172/JCI112174. [DOI] [PMC free article] [PubMed] [Google Scholar]
- 155.Glancy B. Visualizing mitochondrial form and function within the cell. Trends Mol Med 26: 58–70, 2020. doi: 10.1016/j.molmed.2019.09.009. [DOI] [PMC free article] [PubMed] [Google Scholar]
- 156.Glancy B, Kane DA, Kavazis AN, Goodwin ML, Willis WT, Gladden LB. Mitochondrial lactate metabolism: history and implications for exercise and disease. J Physiol 599: 863–888, 2021. doi: 10.1113/JP278930. [DOI] [PMC free article] [PubMed] [Google Scholar]
- 157.Brooks GA, Mercier J. Balance of carbohydrate and lipid utilization during exercise: the “crossover” concept. J Appl Physiol 76: 2253–2261, 1994.doi: 10.1152/jappl.1994.76.6.2253. [DOI] [PubMed] [Google Scholar]
- 158.Brooks GA. Cell–cell and intracellular lactate shuttles. J Physiol 587: 5591–5600, 2009. doi: 10.1113/jphysiol.2009.178350. [DOI] [PMC free article] [PubMed] [Google Scholar]
- 159.Kayar SR, Banchero N. Distribution of mitochondria relative to capillaries in guinea pig myocardium. Adv Exp Med Biol 191: 211–216, 1985. doi: 10.1007/978-1-4684-3291-6_21. [DOI] [PubMed] [Google Scholar]
- 160.Michel JB, Salzmann JL, Ossondo Nlom M, Bruneval P, Barres D, Camilleri JP. Morphometric analysis of collagen network and plasma perfused capillary bed in the myocardium of rats during evolution of cardiac hypertrophy. Basic Res Cardiol 81: 142–154, 1986. doi: 10.1007/BF01907379. [DOI] [PubMed] [Google Scholar]
- 161.Kayar SR, Conley KE, Claassen H, Hoppeler H. Capillarity and mitochondrial distribution in rat myocardium following exercise training. J Exp Biol 120: 189–199, 1986. doi: 10.1242/jeb.120.1.189. [DOI] [PubMed] [Google Scholar]
- 162.Henquell L, Odoroff CL, Honig CR. Intercapillary distance and capillary reserve in hypertrophied rat hearts beating in situ. Circ Res 41: 400–408, 1977. [doi: 10.1161/01.RES.41.3.400. [DOI] [PubMed] [Google Scholar]
- 163.Rakusan K, Hrdina PW, Turek Z, Lakatta EG, Spurgeon HA, Wolford GD. Cell size and capillary supply of the hypertensive rat heart: quantitative study. Basic Res Cardiol 79: 389–395, 1984. doi: 10.1007/BF01908138. [DOI] [PubMed] [Google Scholar]
- 164.Bassingthwaighte JB, Yipintsoi T, Harvey RB. Microvasculature of the dog left ventricular myocardium. Microvasc Res 7: 229–249, 1974. doi: 10.1016/0026-2862(74)90008-9. [DOI] [PMC free article] [PubMed] [Google Scholar]
- 165.Batra S, Rakusan K. Morphometric methods for the evaluation of capillary grouping patterns in rat heart. Adv Exp Med Biol 316: 261–270, 1992. doi: 10.1007/978-1-4615-3404-4_30. [DOI] [PubMed] [Google Scholar]
- 166.Kayar SR, Banchero N. Distribution of capillaries and diffusion distances in guinea pig myocardium. Pflugers Arch 396: 350–352, 1983. doi: 10.1007/BF01063941. [DOI] [PubMed] [Google Scholar]
- 167.Glancy B, Hartnell LM, Combs CA, Femnou A, Sun J, Murphy E, Subramaniam S, Balaban RS. Power grid protection of the muscle mitochondrial reticulum. Cell Rep 19: 487–496, 2017. doi: 10.1016/j.celrep.2017.03.063. [DOI] [PMC free article] [PubMed] [Google Scholar]
- 168.Kim Y, Lindberg E, Bleck CK, Glancy B. Endothelial cell nanotube insertions into cardiac and skeletal myocytes during coordinated tissue development. Cardiovasc Res 116: 260–261, 2020. doi: 10.1093/cvr/cvz285. [DOI] [PMC free article] [PubMed] [Google Scholar]
- 169.Glancy B, Hartnell LM, Malide D, Yu ZX, Combs CA, Connelly PS, Subramaniam S, Balaban RS. Mitochondrial reticulum for cellular energy distribution in muscle. Nature 523: 617–620, 2015. doi: 10.1038/nature14614. [DOI] [PMC free article] [PubMed] [Google Scholar]
- 170.Starling EH, Visscher MB. The regulation of the energy output of the heart. J Physiol 62: 243–261, 1927. doi: 10.1113/jphysiol.1927.sp002355. [DOI] [PMC free article] [PubMed] [Google Scholar]
- 171.Tune JD, Gorman MW, Feigl EO. Matching coronary blood flow to myocardial oxygen consumption. J Appl Physiol (1985) 97: 404–415, 2004. doi: 10.1152/japplphysiol.01345.2003. [DOI] [PubMed] [Google Scholar]
- 172.Duncker DJ, Bache RJ. Regulation of coronary blood flow during exercise. Physiol Rev 88: 1009–1086, 2008. doi: 10.1152/physrev.00045.2006. [DOI] [PubMed] [Google Scholar]
- 173.Westerhof N, Boer C, Lamberts RR, Sipkema P. Cross-talk between cardiac muscle and coronary vasculature. Physiol Rev 86: 1263–1308, 2006. doi: 10.1152/physrev.00029.2005. [DOI] [PubMed] [Google Scholar]
- 174.Hoppeler H, Mathieu O, Weibel ER, Krauer R, Lindstedt SL, Taylor CR. Design of the mammalian respiratory system. VIII. Capillaries in skeletal muscles. Respir Physiol 44: 129–150, 1981. doi: 10.1016/0034-5687(81)90080-3. [DOI] [PubMed] [Google Scholar]
- 175.Poole DC, Mathieu-Costello O. Relationship between fiber capillarization and mitochondrial volume density in control and trained rat soleus and plantaris muscles. Microcirculation 3: 175–186, 1996. doi: 10.3109/10739689609148286. [DOI] [PubMed] [Google Scholar]
- 176.Hepple RT, Mathieu-Costello O. Estimating the size of the capillary-to-fiber interface in skeletal muscle: a comparison of methods. J Appl Physiol 91: 2150–2156, 2001. doi: 10.1152/jappl.2001.91.5.2150. [DOI] [PubMed] [Google Scholar]
- 177.Dawson JM, Hudlicka O. Changes in the microcirculation in slow and fast skeletal muscles with long term limitations of blood supply. Cardiovasc Res 24: 390–395, 1990. doi: 10.1093/cvr/24.5.390. [DOI] [PubMed] [Google Scholar]
- 178.Deveci D, Marshall JM, Egginton S. Relationship between capillary angiogenesis, fiber type, and fiber size in chronic systemic hypoxia. Am J Physiol Heart Circ Physiol 281: H241–H252, 2001. doi: 10.1152/ajpheart.2001.281.1.H241. [DOI] [PubMed] [Google Scholar]
- 179.Krogh A. The Anatomy and Physiology of Capillaries. Yale University. Mrs. Hepsa Ely Silliman Memorial Lectures. New Haven, CT: Yale University Press, 1922, vol xvii, p. 276. [Google Scholar]
- 180.Mathieu-Costello O, Hepple RT. Muscle structural capacity for oxygen flux from capillary to fiber mitochondria. Exerc Sport Sci Rev 30: 80–84, 2002. [doi: 10.1097/00003677-200204000-00007. MC][ [DOI] [PubMed] [Google Scholar]
- 181.Andersen P, Kroese AJ. Capillary supply in soleus and gastrocnemius muscles of man. Pflugers Arch 375: 245–249, 1978. doi: 10.1007/BF00582437. [DOI] [PubMed] [Google Scholar]
- 182.Burkholder TJ, Fingado B, Baron S, Lieber RL. Relationship between muscle fiber types and sizes and muscle architectural properties in the mouse hindlimb. J Morphol 221: 177–190, 1994. doi: 10.1002/jmor.1052210207. [DOI] [PubMed] [Google Scholar]
- 183.Hoppeler H, Hudlicka O, Uhlmann E. Relationship between mitochondria and oxygen consumption in isolated cat muscles. J Physiol 385: 661–675, 1987. doi: 10.1113/jphysiol.1987.sp016513. [DOI] [PMC free article] [PubMed] [Google Scholar]
- 184.Mathieu O, Cruz-Orive LM, Hoppeler H, Weibel ER. Estimating length density and quantifying anisotropy in skeletal muscle capillaries. J Microsc 131: 131–146, 1983. doi: 10.1111/j.1365-2818.1983.tb04240.x. [DOI] [PubMed] [Google Scholar]
- 185.Weibel ER, Bacigalupe LD, Schmitt B, Hoppeler H. Allometric scaling of maximal metabolic rate in mammals: muscle aerobic capacity as determinant factor. Respir Physiol Neurobiol 140: 115–132, 2004. doi: 10.1016/j.resp.2004.01.006. [DOI] [PubMed] [Google Scholar]
- 186.Kubinova L, Janácek J, Ribaric S, Cebasek V, Erzen I. Three-dimensional study of the capillary supply of skeletal muscle fibres using confocal microscopy. J Muscle Res Cell Motil 22: 217–227, 2001. doi: 10.1023/A:1012201314440. [DOI] [PubMed] [Google Scholar]
- 187.Janácek J, Cebasek V, Kubínová L, Ribaric S, Erzen I. 3D visualization and measurement of capillaries supplying metabolically different fiber types in the rat extensor digitorum longus muscle during denervation and reinnervation. J Histochem Cytochem 57: 437–447, 2009. doi: 10.1369/jhc.2008.953018. [DOI] [PMC free article] [PubMed] [Google Scholar]
- 188.Janáček J, Cvetko E, Kubínová L, Travnik L, Eržen I. A novel method for evaluation of capillarity in human skeletal muscles from confocal 3D images. Microvasc Res 81: 231–238, 2011. doi: 10.1016/j.mvr.2010.11.012. [DOI] [PubMed] [Google Scholar]
- 189.Janáček J, Kreft M, Cebašek V, Eržen I. Correcting the axial shrinkage of skeletal muscle thick sections visualized by confocal microscopy. J Microsc 246: 107–112, 2012. doi: 10.1111/j.1365-2818.2011.03594.x. [DOI] [PubMed] [Google Scholar]
- 190.Fujino H, Kondo H, Murakami S, Nagatomo F, Fujita N, Takeda I, Ishihara A, Roy RR. Differences in capillary architecture, hemodynamics, and angiogenic factors in rat slow and fast plantarflexor muscles. Muscle Nerve 45: 242–249, 2012. doi: 10.1002/mus.22267. [DOI] [PubMed] [Google Scholar]
- 191.Murakami S, Fujino H, Takeda I, Momota R, Kumagishi K, Ohtsuka A. Comparison of capillary architecture between slow and fast muscles in rats using a confocal laser scanning microscope. Acta Med Okayama 64: 11–18, 2010. doi: 10.18926/amo/32859. [DOI] [PubMed] [Google Scholar]
- 192.Murakami S, Fujita N, Kondo H, Takeda I, Momota R, Ohtsuka A, Fujino H. Abnormalities in the fiber composition and capillary architecture in the soleus muscle of type 2 diabetic Goto-Kakizaki rats. ScientificWorldJournal 2012: 680189, 2012. [DOI] [PMC free article] [PubMed] [Google Scholar]
- 193.Johnson MA, Polgar J, Weightman D, Appleton D. Data on the distribution of fibre types in thirty-six human muscles. An autopsy study. J Neurol Sci 18: 111–129, 1973. doi: 10.1016/0022-510X(73)90023-3. [DOI] [PubMed] [Google Scholar]
- 194.Glancy B, Hsu LY, Dao L, Bakalar M, French S, Chess DJ, Taylor JL, Picard M, Aponte A, Daniels MP, Esfahani S, Cushman S, Balaban RS. In vivo microscopy reveals extensive embedding of capillaries within the sarcolemma of skeletal muscle fibers. Microcirculation 21: 131–147, 2014. doi: 10.1111/micc.12098. [DOI] [PMC free article] [PubMed] [Google Scholar]
- 195.Bangsbo J, Krustrup P, González-Alonso J, Boushel R, Saltin B. Muscle oxygen kinetics at onset of intense dynamic exercise in humans. Am J Physiol Regul Integr Comp Physiol 279: R899–906, 2000. doi: 10.1152/ajpregu.2000.279.3.R899. [DOI] [PubMed] [Google Scholar]
- 196.Grassi B, Gladden LB, Samaja M, Stary CM, Hogan MC. Faster adjustment of O2 delivery does not affect V̇o2 on-kinetics in isolated in situ canine muscle. J Appl Physiol 85: 1394–1403, 1998. doi: 10.1152/jappl.1998.85.4.1394. [DOI] [PubMed] [Google Scholar]
- 197.Grassi B, Gladden LB, Stary CM, Wagner PD, Hogan MC. Peripheral O2 diffusion does not affect V̇o2 on-kinetics in isolated insitu canine muscle. J Appl Physiol (1985) 85: 1404–1412, 1998. doi: 10.1152/jappl.1998.85.4.1404. [DOI] [PubMed] [Google Scholar]
- 198.Koga S, Okushima D, Poole DC, Rossiter HB, Kondo N, Barstow TJ. Unaltered V̇o2 kinetics despite greater muscle oxygenation during heavy-intensity two-legged knee extension versus cycle exercise in humans. Am J Physiol Regul Integr Comp Physiol 317: R203–R213, 2019. doi: 10.1152/ajpregu.00015.2019. [DOI] [PubMed] [Google Scholar]
- 199.Honig C. Myoglobin and oxygen gradients. In: The Lung Scientific Foundations. New York, CT: Raven, 1991, vol 2, p. 1489–1496. [Google Scholar]
- 200.Molé PA, Chung Y, Tran TK, Sailasuta N, Hurd R, Jue T. Myoglobin desaturation with exercise intensity in human gastrocnemius muscle. Am J Physiol Regul Integr Comp Physiol 277: R173–R180, 1999. doi: 10.1152/ajpregu.1999.277.1.R173. [DOI] [PubMed] [Google Scholar]
- 201.Richardson R, Newcomer S, Noyszewski E. Skeletal muscle intracellular po2 assessed by myoglobin desaturation: response to graded exercise. J Appl Physiol (1985) 91: 2679–2685, 2001. doi: 10.1152/jappl.2001.91.6.2679. [DOI] [PubMed] [Google Scholar]
- 202.Poole DC, Pittman RN, Musch TI, Østergaard L. August Krogh's theory of muscle microvascular control and oxygen delivery: a paradigm shift based on new data. J Physiol 598: 4473–4507, 2020. doi: 10.1113/JP279223. [DOI] [PubMed] [Google Scholar]
- 203.Dasika S, Kinsey ST, Locke B. Facilitated diffusion of myoglobin and creatine kinase and reaction-diffusion constraints of aerobic metabolism under steady‐state conditions in skeletal muscle. Biotechnol Bioeng 109: 545–558, 2012. doi: 10.1002/bit.23329. [DOI] [PMC free article] [PubMed] [Google Scholar]
- 204.Bessman SP, Geiger PJ. Transport of energy in muscle: the phosphorylcreatine shuttle. Science 211: 448–452, 1981. doi: 10.1126/science.6450446. [DOI] [PubMed] [Google Scholar]
- 205.Bessman SP, Fonyo A. The possible role of the mitochondrial bound creatine kinase in regulation of mitochondrial respiration. Biochem Biophys Res Commun 22: 597–602, 1966. doi: 10.1016/0006-291X(66)90317-2. [DOI] [PubMed] [Google Scholar]
- 206.Bessman SP, Carpenter CL. The creatine-creatine phosphate energy shuttle. Annu Rev Biochem 54: 831–862, 1985. doi: 10.1146/annurev.bi.54.070185.004151. [DOI] [PubMed] [Google Scholar]
- 207.Erickson-Viitanen S, Geiger P, Yang WC, Bessman SP. The creatine-creatine phosphate shuttle for energy transport-compartmentation of creatine phosphokinase in muscle. Adv Exp Med Biol 151: doi: 10.1007/978-1-4684-4259-5_17. 115–125, 1982. [DOI] [PubMed] [Google Scholar]
- 208.Savabi F, Geiger PJ, Bessman SP. Myofibrillar end of the creatine phosphate energy shuttle. Am J Physiol Cell Physiol 247: C424–C432, 1984. doi: 10.1152/ajpcell.1984.247.5.C424. [DOI] [PubMed] [Google Scholar]
- 209.Wittenberg JB. Oxygen transport: new function proposed for myoglobin. Biol Bull 117: 402, 1959. [Google Scholar]
- 210.Scholander PF. Oxygen transport through hemoglobin solutions. Science 131: 585–590, 1960. doi: 10.1126/science.131.3400.585. [DOI] [PubMed] [Google Scholar]
- 211.Wittenberg JB. The molecular mechanism of hemoglobin-facilitated oxygen diffusion. J Biol Chem 241: 104–114, 1966. doi: 10.1016/S0021-9258(18)96964-4. [DOI] [PubMed] [Google Scholar]
- 212.Wyman J. Facilitated diffusion and the possible role of myoglobin as a transport mechanism. J Biol Chem 241: 115–121, 1966. doi: 10.1016/S0021-9258(18)96965-6. [DOI] [PubMed] [Google Scholar]
- 213.Mirceta S, Signore AV, Burns JM, Cossins AR, Campbell KL, Berenbrink M. Evolution of mammalian diving capacity traced by myoglobin net surface charge. Science 340: 1234192–1234192, 2013. doi: 10.1126/science.1234192. [DOI] [PubMed] [Google Scholar]
- 214.Endeward V. The rate of the deoxygenation reaction limits myoglobin-and hemoglobin-facilitated O2 diffusion in cells. J Appl Physiol (1985) 112: 1466–1473, 2012. doi: 10.1152/japplphysiol.00835.2011. [DOI] [PubMed] [Google Scholar]
- 215.Endeward V, Gros G, Jürgens KD. Significance of myoglobin as an oxygen store and oxygen transporter in the intermittently perfused human heart: a model study. Cardiovasc Res 87: 22–29, 2010. doi: 10.1093/cvr/cvq036. [DOI] [PubMed] [Google Scholar]
- 216.Jurgens KD, Peters T, Gros G. Diffusivity of myoglobin in intact skeletal muscle cells. Proc Natl Acad Sci U S A 91: 3829–3833, 1994. doi: 10.1073/pnas.91.9.3829. [DOI] [PMC free article] [PubMed] [Google Scholar]
- 217.Wang D, Kreutzer U, Chung Y, Jue T. Myoglobin and hemoglobin rotational diffusion in the cell. Biophys J 73: 2764–2770, 1997. doi: 10.1016/S0006-3495(97)78305-X. [DOI] [PMC free article] [PubMed] [Google Scholar]
- 218.Bailey JR, Driedzic WR. Lack of correlation between cardiac myoglobin concentration and in vitro metmyoglobin reductase activity. J Exp Biol 173: 301–306, 1992. doi: 10.1242/jeb.173.1.301. [DOI] [PubMed] [Google Scholar]
- 219.Papadopoulos S, Endeward V, Revesz-Walker B, Jurgens KD, Gros G. Radial and longitudinal diffusion of myoglobin in single living heart and skeletal muscle cells. Proc Natl Acad Sci U S A 98: 5904–5909, 2001.doi: 10.1073/pnas.101109798. [DOI] [PMC free article] [PubMed] [Google Scholar]
- 220.Lin PC, Kreutzer U, Jue T. Anisotropy and temperature dependence of myoglobin translational diffusion in myocardium: implication for oxygen transport and cellular architecture. Biophys J 92: 2608–2620, 2007. doi: 10.1529/biophysj.106.094458. [DOI] [PMC free article] [PubMed] [Google Scholar]
- 221.van Beek JH, Elzinga G. Diffusional shunting of oxygen in saline-perfused isolated rabbit heart is negligible. Pflugers Arch 410: 263–271, 1987. doi: 10.1007/BF00580275. [DOI] [PubMed] [Google Scholar]
- 222.Rose CP, Goresky CA. Limitations of tracer oxygen uptake in the canine coronary circulation. Circ Res 56: 57–71, 1985. [doi: 10.1161/01.RES.56.1.57. [DOI] [PubMed] [Google Scholar]
- 223.Arai AE, Kasserra CE, Territo PR, Gandjbakhche AH, Balaban RS. Myocardial oxygenation in vivo: optical spectroscopy of cytoplasmic myoglobin and mitochondrial cytochromes. Am J Physiol Heart Circ Physiol 277: H683–H697, 1999. doi: 10.1152/ajpheart.1999.277.2.H683. [DOI] [PubMed] [Google Scholar]
- 224.Whalen W, Nair P, Ganfield R. Measurements of oxygen tension in tissues with a micro oxygen electrode. Microvasc Res 5: 254–262, 1973. doi: 10.1016/0026-2862(73)90035-6. [DOI] [PubMed] [Google Scholar]
- 225.Fletcher JE, Schubert RW. Capillary wall permeability effects in perfused capillary-tissue structures. In: Oxygen Transport to Tissue—VI. New York: Springer. 1984, p. 907–919. [DOI] [PubMed] [Google Scholar]
- 226.King RB, Raymond GM, Bassingthwaighte JB. Modeling blood flow heterogeneity. Ann Biomed Eng 24: 352–372, 1996. doi: 10.1007/BF02660885. [DOI] [PMC free article] [PubMed] [Google Scholar]
- 227.Giles AV, Sun J, Femnou AN, Kuzmiak-Glancy S, Taylor JL, Covian R, Murphy E, Balaban RS. Paradoxical arteriole constriction compromises cytosolic and mitochondrial oxygen delivery in the isolated saline-perfused heart. Am J Physiol Heart Circ Physiol 315: H1791–H1804, 2018. doi: 10.1152/ajpheart.00493.2018. [DOI] [PMC free article] [PubMed] [Google Scholar]
- 228.Chemnitius JM, Burger W, Bing RJ. Crystalloid and perfluorochemical perfusates in an isolated working rabbit heart preparation. Am J Physiol Heart Circ Physiol 249: H285–H292, 1985. doi: 10.1152/ajpheart.1985.249.2.H285. [DOI] [PubMed] [Google Scholar]
- 229.Wengrowski AM, Kuzmiak-Glancy S, Jaimes R, Kay MW. NADH changes during hypoxia, ischemia, and increased work differ between isolated heart preparations. Am J Physiol Heart Circ Physiol 306: H529–H537, 2014. doi: 10.1152/ajpheart.00696.2013. [DOI] [PMC free article] [PubMed] [Google Scholar]
- 230.Zhang J, Murakami Y, Zhang Y, Cho YK, Ye Y, Gong G, Bache RJ, Uğurbil K, From AH. Oxygen delivery does not limit cardiac performance during high work states. Am J Physiol Heart Circ Physiol 277: H50–H57, 1999. doi: 10.1152/ajpheart.1999.277.1.H50. [DOI] [PubMed] [Google Scholar]
- 231.Gardner JD, Schubert RW. Myoglobin function evaluated in working heart tissue. In: Oxygen Transport to Tissue XX. New York: Springer, 1998, p. 509–517. [DOI] [PubMed] [Google Scholar]
- 232.Garry DJ, Ordway GA, Lorenz JN, Radford NB, Chin ER, Grange RW, Bassel-Duby R, Williams RS. Mice without myoglobin. Nature 395: 905–908, 1998. doi: 10.1038/27681. [DOI] [PubMed] [Google Scholar]
- 233.Godecke A, Flogel U, Zanger K, Ding Z, Hirchenhain J, Decking UK, Schrader J. Disruption of myoglobin in mice induces multiple compensatory mechanisms. Proc Natl Acad Sci U S A 96: 10495–10500, 1999. doi: 10.1073/pnas.96.18.10495. [DOI] [PMC free article] [PubMed] [Google Scholar]
- 234.Hoppeler H, Lindstedt SL, Claassen H, Taylor CR, Mathieu O, Weibel ER. Scaling mitochondrial volume in heart to body mass. Respir Physiol 55: 131–137, 1984. doi: 10.1016/0034-5687(84)90018-5. [DOI] [PubMed] [Google Scholar]
- 235.Park JW, Piknova B, Dey S, Noguchi CT, Schechter AN. Compensatory mechanisms in myoglobin deficient mice preserve NO homeostasis. Nitric Oxide 90: 10–14, 2019. doi: 10.1016/j.niox.2019.06.001. [DOI] [PMC free article] [PubMed] [Google Scholar]
- 236.Bache RJ. Myocardial oxygenation at high workstates in hearts with left ventricular hypertrophy. Cardiovasc Res 42: 616–626, 1999. doi: 10.1016/S0008-6363(98)00332-0. [DOI] [PubMed] [Google Scholar]
- 237.Wittenberg JB, Wittenberg BA. Myoglobin function reassessed. J Exp Biol 206: 2011–2020, 2003. doi: 10.1242/jeb.00243. [DOI] [PubMed] [Google Scholar]
- 238.Godecke A, Molojavyi A, Heger J, Flögel U, Ding Z, Jacoby C, Schrader J. Myoglobin protects the heart from inducible nitric-oxide synthase (iNOS)-mediated nitrosative stress. J Biol Chem 278: 21761–21766, 2003. doi: 10.1074/jbc.M302573200. [DOI] [PubMed] [Google Scholar]
- 239.Hendgen-Cotta UB, Kelm M, Rassaf T. Myoglobin functions in the heart. Free Radic Biol Med 73: 252–259, 2014. doi: 10.1016/j.freeradbiomed.2014.05.005. [DOI] [PubMed] [Google Scholar]
- 240.O'Brien PJ, Shen H, McCutcheon LJ, O'Grady M, Byrne PJ, Ferguson HW, Mirsalimi MS, Julian RJ, Sargeant JM, Tremblay RR, Blackwell TE. Rapid, simple and sensitive microassay for skeletal and cardiac muscle myoglobin and hemoglobin: use in various animals indicates functional role of myohemoproteins. Mol Cell Biochem 112: 45–52, 1992. doi: 10.1007/BF00229642. [DOI] [PubMed] [Google Scholar]
- 241.Costa LE, Mendez G, Boveris A. Oxygen dependence of mitochondrial function measured by high-resolution respirometry in long-term hypoxic rats. Am J Physiol Cell Physiol 273: C852–C858, 1997. doi: 10.1152/ajpcell.1997.273.3.C852. [DOI] [PubMed] [Google Scholar]
- 242.Gnaiger E, Méndez G, Hand SC. High phosphorylation efficiency and depression of uncoupled respiration in mitochondria under hypoxia. Proc Natl Acad Sci U S A 97: 11080–11085, 2000. doi: 10.1073/pnas.97.20.11080. [DOI] [PMC free article] [PubMed] [Google Scholar]
- 243.Rumsey WL, Schlosser C, Nuutinen EM, Robiolio M, Wilson DF. Cellular energetics and the oxygen dependence of respiration in cardiac myocytes isolated from adult rat. J Biol Chem 265: 15392–15402, 1990. doi: 10.1016/S0021-9258(18)55409-0. [DOI] [PubMed] [Google Scholar]
- 244.Hendgen-Cotta UB, Merx MW, Shiva S, Schmitz J, Becher S, Klare JP, Steinhoff HJ, Goedecke A, Schrader J, Gladwin MT, Kelm M, Rassaf T. Nitrite reductase activity of myoglobin regulates respiration and cellular viability in myocardial ischemia-reperfusion injury. Proc Natl Acad Sci U S A 105: 10256–10261, 2008. doi: 10.1073/pnas.0801336105. [DOI] [PMC free article] [PubMed] [Google Scholar]
- 245.Brunori M. Nitric oxide moves myoglobin centre stage. Trends Biochem Sci 26: 209–210, 2001. doi: 10.1016/S0968-0004(01)01824-2. [DOI] [PubMed] [Google Scholar]
- 246.Clanton TL. Managing the power grid: how myoglobin can regulate po2 and energy distribution in skeletal muscle. J Appl Physiol (1985) 126: 787–790, 2019. doi: 10.1152/japplphysiol.00614.2018. [DOI] [PubMed] [Google Scholar]
- 247.Lancaster JR. Simulation of the diffusion and reaction of endogenously produced nitric oxide. Proc Natl Acad Sci U S A 91: 8137–8141, 1994. doi: 10.1073/pnas.91.17.8137. [DOI] [PMC free article] [PubMed] [Google Scholar]
- 248.Fiske CH, Subbarow Y. The nature of the “inorganic phosphate” in voluntary muscle. Science 65: 401–403, 1927. doi: 10.1126/science.65.1686.401. [DOI] [PubMed] [Google Scholar]
- 249.Eggleton P, Eggleton GP. The inorganic phosphate and a labile form of organic phosphate in the gastrocnemius of the frog. Biochem J 21: 190–195, 1927. doi: 10.1042/bj0210190. [DOI] [PMC free article] [PubMed] [Google Scholar]
- 250.Lundsgaard E. Examination of muscle contraction without lactic acid formation. Biochemische Zeitschrift 217: 162–177, 1930 [Google Scholar]
- 251.Lohmann K. The enzymatic division of creatine phosphoric acid, together with an article on the chemism of muscle contraction. Biochemische Zeitschrift 271: 264–277, 1934. [Google Scholar]
- 252.Lawson JW, Veech RL. Effects of pH and free Mg++ on the Keq of the creatine kinase reaction and other phosphate hydrolyses and phosphate transfer reactions. J Biol Chem 254: 6528–6537, 1979. doi: 10.1016/S0021-9258(18)50400-2. [DOI] [PubMed] [Google Scholar]
- 253.Clark JF, Kemp GJ, Radda GK. The creatine kinase equilibrium, free [ADP] and myosin ATPase in vascular smooth muscle cross-bridges. J Theor Biol 173: 207–211, 1995. doi: 10.1006/jtbi.1995.0056. [DOI] [PubMed] [Google Scholar]
- 254.Wiseman RW, Kushmerick MJ. Creatine kinase equilibration follows solution thermodynamics in skeletal muscle. 31P NMR studies using creatine analogs. J Biol Chem 270: 12428–12438, 1995. doi: 10.1074/jbc.270.21.12428. [DOI] [PubMed] [Google Scholar]
- 255.Matthews PM, Waterton JC, Matthews PM, Radda GK. The steady state rate of ATP synthesis in the perfused rat heart measured by 31P NMR saturation transfer. Biochim Biophys Acta 714: 265–270, 1982. doi: 10.1016/0304-4165(82)90333-6. [DOI] [PubMed] [Google Scholar]
- 256.Katz LA, Swain JA, Portman MA, Balaban RS. Relation between phosphate metabolites and oxygen consumption of heart in vivo. Am J Physiol Heart Circ Physiol 256: H265–H274, 1989. doi: 10.1152/ajpheart.1989.256.1.H265. [DOI] [PubMed] [Google Scholar]
- 257.Gadian DG, Radda GK, Brown TR, Chance EM, Dawson MJ, Wilkie DR. The activity of creatine kinase in frog skeletal muscle studied by saturation-transfer nuclear magnetic resonance. Biochem J 194: 215–228, 1981. doi: 10.1042/bj1940215. [DOI] [PMC free article] [PubMed] [Google Scholar]
- 258.Hsieh PS, Balaban RS. Saturation and inversion transfer studies of creatine kinase kinetics in rabbit skeletal muscle in vivo. Magn Reson Med 7: 56–64, 1988. doi: 10.1002/mrm.1910070107. [DOI] [PubMed] [Google Scholar]
- 259.Illg D, Pette D. Turnover rates of hexokinase I, phosphofructokinase, pyruvate kinase and creatine kinase in slow-twitch soleus muscle and heart of the rabbit. Eur J Biochem 97: 267–273, 1979. doi: 10.1111/j.1432-1033.1979.tb13111.x. [DOI] [PubMed] [Google Scholar]
- 260.Kushmerick MJ. Patterns in mammalian muscle energetics. J Exp Biol 115: 165–177, 1985. doi: 10.1242/jeb.115.1.165. [DOI] [PubMed] [Google Scholar]
- 261.Gupta A, Chacko VP, Weiss RG. Abnormal energetics and ATP depletion in pressure-overload mouse hearts: in vivo high-energy phosphate concentration measures by noninvasive magnetic resonance. Am J Physiol Heart Circ Physiol 297: H59–H64, 2009. doi: 10.1152/ajpheart.00178.2009. [DOI] [PMC free article] [PubMed] [Google Scholar]
- 262.Kushmerick MJ, Moerland TS, Wiseman RW. Mammalian skeletal muscle fibers distinguished by contents of phosphocreatine, ATP, and Pi. Proc Natl Acad Sci U S A 89: 7521–7525, 1992. doi: 10.1073/pnas.89.16.7521. [DOI] [PMC free article] [PubMed] [Google Scholar]
- 263.Jacobus WE. Respiratory control and the integration of heart high-energy phosphate metabolism by mitochondrial creatine kinase. Annu Rev Physiol 47: 707–725, 1985. doi: 10.1146/annurev.ph.47.030185.003423. [DOI] [PubMed] [Google Scholar]
- 264.Funk C, Clark A, Connett RJ. How phosphocreatine buffers cyclic changes in ATP demand in working muscle. In: Oxygen Transport to Tissue XI, edited by Rakusan K. Boston, MA: Springer, 1989, p. 687–692. [DOI] [PubMed] [Google Scholar]
- 265.Mainwood GW, Rakusan K. A model for intracellular energy transport. Can J Physiol Pharmacol 60: 98–102, 1982. doi: 10.1139/y82-016. [DOI] [PubMed] [Google Scholar]
- 266.Bose S, French S, Evans FJ, Joubert F, Balaban RS. Metabolic network control of oxidative phosphorylation: multiple roles of inorganic phosphate. J Biol Chem 278: 39155–39165, 2003. doi: 10.1074/jbc.M306409200. [DOI] [PubMed] [Google Scholar]
- 267.Meyer RA, Sweeney HL, Kushmerick MJ. A simple analysis of the “phosphocreatine shuttle”. Am J Physiol Cell Physiol 246: C365–C367, 1984. doi: 10.1152/ajpcell.1984.246.5.C365. [DOI] [PubMed] [Google Scholar]
- 268.Wallimann T. Bioenergetics. Dissecting the role of creatine kinase. Curr Biol 4: 42–46, 1994. doi: 10.1016/S0960-9822(00)00008-7. [DOI] [PubMed] [Google Scholar]
- 269.Saks V, Dzeja P, Schlattner U, Vendelin M, Terzic A, Wallimann T. Cardiac system bioenergetics: metabolic basis of the Frank-Starling law. J Physiol 571: 253–273, 2006. doi: 10.1113/jphysiol.2005.101444. [DOI] [PMC free article] [PubMed] [Google Scholar]
- 270.Wallimann T, Wyss M, Brdiczka D, Nicolay K, Eppenberger HM. Intracellular compartmentation, structure and function of creatine kinase isoenzymes in tissues with high and fluctuating energy demands: the ‘phosphocreatine circuit’ for cellular energy homeostasis. Biochem.J 281: 21–40, 1992. doi: 10.1042/bj2810021. [DOI] [PMC free article] [PubMed] [Google Scholar]
- 271.Hettling H, van Beek JH. Analyzing the functional properties of the creatine kinase system with multiscale ‘sloppy’ modeling. PLoS Comput Biol 7: e1002130, 2011. doi: 10.1371/journal.pcbi.1002130. [DOI] [PMC free article] [PubMed] [Google Scholar]
- 272.Saks VA, Rosenshtraukh LV, Smirnov VN, Chazov EI. Role of creatine phosphokinase in cellular function and metabolism. Can J Physiol Pharmacol 56: 691–706, 1978. doi: 10.1139/y78-113. [DOI] [PubMed] [Google Scholar]
- 273.Seraydarian MW, Abbott BC. The role of the creatine-phosphorylcreatine system in muscle. J Mol Cell Cardiol 8: 741–746, 1976. doi: 10.1016/0022-2828(76)90081-X. [DOI] [PubMed] [Google Scholar]
- 274.Lygate CA, Aksentijevic D, Dawson D, ten Hove M, Phillips D, de Bono JP, Medway DJ, Sebag-Montefiore L, Hunyor I, Channon KM, Clarke K, Zervou S, Watkins H, Balaban RS, Neubauer S. Living without creatine: unchanged exercise capacity and response to chronic myocardial infarction in creatine-deficient mice. Circ Res 112: 945–955, 2013. doi: 10.1161/CIRCRESAHA.112.300725. [DOI] [PMC free article] [PubMed] [Google Scholar]
- 275.Akki A, Gupta A, Weiss RG. Magnetic resonance imaging and spectroscopy of the murine cardiovascular system. Am J Physiol Heart Circ Physiol 304: H633–H648, 2013. doi: 10.1152/ajpheart.00771.2011. [DOI] [PMC free article] [PubMed] [Google Scholar]
- 276.McFarland EW, Kushmerick MJ, Moerland TS. Activity of creatine kinase in a contracting mammalian muscle of uniform fiber type. Biophys J 67: 1912–1924, 1994. doi: 10.1016/S0006-3495(94)80674-5. [DOI] [PMC free article] [PubMed] [Google Scholar]
- 277.Meyer RA, Brown TR, Krilowicz BL, Kushmerick MJ. Phosphagen and intracellular pH changes during contraction of creatine-depleted rat muscle. Am J Physiol Cell Physiol 250: C264–C274, 1986. doi: 10.1152/ajpcell.1986.250.2.C264. [DOI] [PubMed] [Google Scholar]
- 278.Jacobus WE, Lehninger AL. Creatine kinase of rat heart mitochondria. Coupling of creatine phosphorylation to electron transport. J Biol Chem 248: 4803–4810, 1973. doi: 10.1016/S0021-9258(19)43737-X. [DOI] [PubMed] [Google Scholar]
- 279.Erickson-Viitanen S, Viitanen P, Geiger PJ, Yang WC, Bessman SP. Compartmentation of mitochondrial creatine phosphokinase. I. Direct demonstration of compartmentation with the use of labeled precursors. J Biol Chem 257: 14395–14404, 1982. doi: 10.1016/S0021-9258(19)45394-5. MC][ [DOI] [PubMed] [Google Scholar]
- 280.Jacobs H, Heldt HW, Klingenberg M. High activity of creatine kinase in mitochondria from muscle and brain and evidence for a separate mitochondrial isoenzyme of creatine kinase. Biochem Biophys Res Commun 16: 516–521, 1964. doi: 10.1016/0006-291X(64)90185-8. [DOI] [PubMed] [Google Scholar]
- 281.Fritz-Wolf K, Schnyder T, Wallimann T, Kabsch W. Structure of mitochondrial creatine kinase. Nature 381: 341–345, 1996. doi: 10.1038/381341a0. [DOI] [PubMed] [Google Scholar]
- 282.Heineman FW, Balaban RS. Phosphorus-31 nuclear magnetic resonance analysis of transient changes of canine myocardial metabolism in vivo. J Clin Invest 85: 843–852, 1990. doi: 10.1172/JCI114511. [DOI] [PMC free article] [PubMed] [Google Scholar]
- 283.Detre JA, Koretsky AP, Williams DS, Ho C. Absence of pH changes during altered work in the IN VIVO sheep heart: a 31P NMR investigation. J Mol Cell Cardiol 22: 543–553, 1990. doi: 10.1016/0022-2828(90)90956-3. [DOI] [PubMed] [Google Scholar]
- 284.Ligeti L, Osbakken MD, Clark BJ, Schnall M, Bolinger L, Subramanian H, Leigh JS, Chance B. Cardiac transfer function relating energy metabolism to workload in different species as studied with 31P NMR. Magn Reson Med 4: 112–119, 1987. doi: 10.1002/mrm.1910040203. [DOI] [PubMed] [Google Scholar]
- 285.Conway MA, Bristow JD, Blackledge MJ, Rajagopalan B, Radda GK. Cardiac metabolism during exercise in healthy volunteers measured by 31P magnetic resonance spectroscopy. Br Heart J 65: 25–30, 1991. doi: 10.1136/hrt.65.1.25. [DOI] [PMC free article] [PubMed] [Google Scholar]
- 286.Katz LA, Swain JA, Portman MA, Balaban RS. Intracellular pH and inorganic phosphate content of the heart in vivo: a 31P NMR study. Am J Physiol Heart Circ 255: H189–H196, 1988. doi: 10.1152/ajpheart.1988.255.1.H189. [DOI] [PubMed] [Google Scholar]
- 287.Hudsmith LE, Tyler DJ, Emmanuel Y, Petersen SE, Francis JM, Watkins H, Clarke K, Robson MD, Neubauer S. (31)P cardiac magnetic resonance spectroscopy during leg exercise at 3 Tesla. Int J Cardiovasc Imaging 25: 819–826, 2009. doi: 10.1007/s10554-009-9492-8. [DOI] [PubMed] [Google Scholar]
- 288.Lamb HJ, Beyerbacht HP, Ouwerkerk R, Doornbos J, Pluim BM, van der Wall EE, de Roos A. Metabolic response of normal human myocardium to high-dose atropine-dobutamine stress studied by 31P-MRS. Circulation 96: 2969–2977, 1997. doi: 10.1161/01.CIR.96.9.2969. [DOI] [PubMed] [Google Scholar]
- 289.Ingwall JS. Creatine kinase knockout mice–what is the phenotype: heart. MAGMA 6: 120–121, 1998. doi: 10.1007/BF02660928. [DOI] [PubMed] [Google Scholar]
- 290.Saupe KW, Spindler M, Tian R, Ingwall JS. Impaired cardiac energetics in mice lacking muscle-specific isoenzymes of creatine kinase. Circ Res 82: 898–907, doi: 10.1161/01.RES.82.8.898. 1998. doi:. [DOI] [PubMed] [Google Scholar]
- 291.Kernec F, Unlü M, Labeikovsky W, Minden JS, Koretsky AP. Changes in the mitochondrial proteome from mouse hearts deficient in creatine kinase. Physiol Genomics 6: 117–128, 2001. doi: 10.1152/physiolgenomics.2001.6.2.117. [DOI] [PubMed] [Google Scholar]
- 292.van Deursen J, Heerschap A, Oerlemans F, Rultenbeek W, Jap P, ter Laak H, Wieringa B. Skeletal muscles of mice deficient in muscle creatine kinase lack burst activity. Cell 74: 621–631, 1993. doi: 10.1016/0092-8674(93)90510-W. [DOI] [PubMed] [Google Scholar]
- 293.Steeghs K, Benders A, Oerlemans F, de Haan A, Heerschap A, Ruitenbeek W, Wieringa B. Altered Ca2+ responses in muscles with combined mitochondrial and cytosolic creatine kinase deficiencies. Cell 89: 93–103, 1997. doi: 10.1016/S0092-8674(00)80186-5. [DOI] [PubMed] [Google Scholar]
- 294.Steeghs K, Oerlemans F, de Haan A, Heerschap A, Verdoodt L, de Bie M, Ruitenbeek W, Benders A, Jost C, van Deursen J, Tullson P, Terjung R, Jap P, Jacob W, Pette D, Wieringa B. Cytoarchitectural and metabolic adaptations in muscles with mitochondrial and cytosolic creatine kinase deficiencies. Mol Cell Biochem 184: 183–194, 1998. doi: 10.1023/A:1006811717709. [DOI] [PubMed] [Google Scholar]
- 295.Steeghs K, Heerschap A, de Haan A, Ruitenbeek W, Oerlemans F, van Deursen J, Perryman B, Pette D, Brückwilder M, Koudijs J, Jap P, Wieringa B. Use of gene targeting for compromising energy homeostasis in neuro-muscular tissues: the role of sarcomeric mitochondrial creatine kinase. J Neurosci Methods 71: 29–41, 1997. doi: 10.1016/S0165-0270(96)00124-0. [DOI] [PubMed] [Google Scholar]
- 296.Skulachev VP. Power transmission along biological membranes. J Membr Biol 114: 97–112, 1990. doi: 10.1007/BF01869092. [DOI] [PubMed] [Google Scholar]
- 297.Schwann T. Mikroskopische Untersuchungen uber die Uebereinstimmung in der Struktur und dem Wachsthum der Thiere und Pflanzen. Berlin, Germany: Verlag der Sander'schen Buchhandlung (GE Reimer), 1839. [Google Scholar]
- 298.Henle J. Allgemeine Anatomie: Lehre von den Mischungs-und Formbestandtheilen des Menschlichen Körpers. Berlin, Germany: Verlag von Leopold Voss, 1841, vol 6. [Google Scholar]
- 299.Bakeeva LE, Chentsov YS, Skulachev VP. Mitochondrial framework (reticulum mitochondriale) in rat diaphragm muscle. Biochim Biophys Acta 501: 349–369, 1978.doi: 10.1016/0005-2728(78)90104-4. [DOI] [PubMed] [Google Scholar]
- 300.Ogata T, Yamasaki Y. Scanning electron-microscopic studies on the three-dimensional structure of mitochondria in the mammalian red, white and intermediate muscle fibers. Cell Tissue Res 241: 251–256, 1985. doi: 10.1007/BF00217168. [DOI] [PubMed] [Google Scholar]
- 301.Kirkwood SP, Munn EA, Brooks GA. Mitochondrial reticulum in limb skeletal muscle. Am J Physiol Cell Physiol 251: C395–C402, 1986. doi: 10.1152/ajpcell.1986.251.3.C395. [DOI] [PubMed] [Google Scholar]
- 302.Kayar SR, Hoppeler H, Mermod L, Weibel ER. Mitochondrial size and shape in equine skeletal muscle: a three-dimensional reconstruction study. Anat Rec 222: 333–339, 1988. doi: 10.1002/ar.1092220405. [DOI] [PubMed] [Google Scholar]
- 303.Bleck CK, Kim Y, Willingham TB, Glancy B. Subcellular connectomic analyses of energy networks in striated muscle. Nat Commun 9: 5111, 2018. doi: 10.1038/s41467-018-07676-y. [DOI] [PMC free article] [PubMed] [Google Scholar]
- 304.Caffrey BJ, Maltsev AV, Gonzalez-Freire M, Hartnell LM, Ferrucci L, Subramaniam S. Semi-automated 3D segmentation of human skeletal muscle using focused ion beam-scanning electron microscopic images. J Struct Biol 207: 1–11, 2019. doi: 10.1016/j.jsb.2019.03.008. [DOI] [PMC free article] [PubMed] [Google Scholar]
- 305.Kölliker A. Einige Bemerkungen über die Endigungen der Hautnerven und den Bau der Muskeln. Zeitschr Wissensch Zool 8: 311–325, 1857. [Google Scholar]
- 306.Kölliker A. Handbuch der Gewebelehre des Menschen. Leipzig, Gemany: Engelmann, 1889. [Google Scholar]
- 307.Knoll P. Uber protoplasmaarme und protoplasmareiche Muskulatur. In: Denkschriften der Kaiserlichen Akademie der Wissenschaften, 1891, p. 633–700. [Google Scholar]
- 308.Altmann R. Die elementarorganismen und ihre Beziehungen zu den Zeller. Lupzig, Germany: Veit Lupzig, 1890. [Google Scholar]
- 309.Retzius G. Biologischen Untersuchungen. Stockholm: Neue Folge, 1890, vol 1. [Google Scholar]
- 310.Benda C. Ueber die spermatogenese der vertebraten und höherer evertebraten, II. Theil: Die histiogenese der spermien. Arch Anat Physiol 73: 393–398, 1898. [Google Scholar]
- 311.Bullard HH. On the interstitial granules and fat droplets of striated muscle. Am J Anat 14: 1–46, 1912. doi: 10.1002/aja.1000140102. [DOI] [Google Scholar]
- 312.Regaud C, Favre M. Granulations interstitielles et mitochondries des fibres musculaires striées. Compt Rend 148: 661–664, 1909. [Google Scholar]
- 313.Chance B, Sacktor B. Respiratory metabolism of insect flight muscle. II. Kinetics of respiratory enzymes in flight muscle sarcosomes. Arch Biochem Biophys 76: 509–531, 1958. doi: 10.1016/0003-9861(58)90176-0. [DOI] [PubMed] [Google Scholar]
- 314.Van den Bergh S, Slater E. The respiratory activity and permeability of housefly sarcosomes. Biochem J 82: 362–371, 1962. doi: 10.1042/bj0820362. [DOI] [PMC free article] [PubMed] [Google Scholar]
- 315.Cleland K, Slater E. The sarcosomes of heart muscle: their isolation, structure, and behaviour under various conditions. J Cell Sci s3-94: 329–346, 1953.doi: 10.1242/jcs.s3-94.27.329. [DOI] [Google Scholar]
- 316.Kitiyakara A, Harman JW. The cytological distribution in pigeon skeletal muscle of enzymes acting on phosphorylated nucleotides. J Exp Med 97: 553–572, 1953. doi: 10.1084/jem.97.4.553. [DOI] [PMC free article] [PubMed] [Google Scholar]
- 317.Cowdry E. The mitochondrial constituents of protoplasm. In: Contribution to Embryology. Washington, DC: The Carnegie Institution of Washington, 1918, no. 25, p. 160. [Google Scholar]
- 318.Wachstein M, Meisel E. The distribution of histochemically demonstrable succinic dehydrogenase and of mitochondria in tongue and skeletal muscles. J Biophys Biochem Cytol 1: 483–488, 1955. doi: 10.1083/jcb.1.6.483. [DOI] [PMC free article] [PubMed] [Google Scholar]
- 319.Bourne G, Malaty H. The effect of adrenalectomy, cortisone and other steroid hormones on the histochemical reaction for succinic dehydrogenase. J Physiol 122: 178–187, 1953. doi: 10.1113/jphysiol.1953.sp004989. [DOI] [PMC free article] [PubMed] [Google Scholar]
- 320.Palade GE. The fine structure of mitochondria. Anat Rec 114: 427–451, 1952. doi: 10.1002/ar.1091140304. [DOI] [PubMed] [Google Scholar]
- 321.Chappell JB, Perry SV. The respiratory and adenosinetriphosphatase activities of skeletal-muscle mitochondria. Biochem J 55: 586–595, 1953. doi: 10.1042/bj0550586. [DOI] [PMC free article] [PubMed] [Google Scholar]
- 322.Andersson-Cedergren E. Ultrastructure of motor end plate and sarcoplasmic components of mouse skeletal muscle fiber as revealed by three-dimensional reconstructions from serial sections. J Ultrastruct Res 2: 5–191, 1959. doi: 10.1016/S0889-1605(59)80002-1. [DOI] [Google Scholar]
- 323.Bubenzer HJ. Die Dunnen und Die Dicken Muskelfasern des Zwerchfells der Ratte. ZZellforsch 69: 520–550, 1966. doi: 10.1007/BF00406300. [DOI] [PubMed] [Google Scholar]
- 324.Skulachev VP. Energy Accumulation in the Cell. Moscow: Nauka Press, 1969. [Google Scholar]
- 325.Skulachev VP. Transmembrane electrochemical H+-potential as a convertible energy source for the living cell. FEBS Lett 74: 1–9, 1977. doi: 10.1016/0014-5793(77)80739-4. [DOI] [PubMed] [Google Scholar]
- 326.Bakeeva LE, Chentsov YuS, Skulachev VP. Intermitochondrial contacts in myocardiocytes. J Mol Cell Cardiol 15: 413–420, 1983. doi: 10.1016/0022-2828(83)90261-4. [DOI] [PubMed] [Google Scholar]
- 327.Black JT, Judge D, Demers L, Gordon S. Ragged-red fibers: a biochemical and morphological study. J Neurol Sci 26: 479–488, 1975. doi: 10.1016/0022-510X(75)90048-9. [DOI] [PubMed] [Google Scholar]
- 328.Segretain D, Rambourg A, Clermont Y. Three dimensional arrangement of mitochondria and endoplasmic reticulum in the heart muscle fiber of the rat. Anat Rec 200: 139–151, 1981. doi: 10.1002/ar.1092000204. [DOI] [PubMed] [Google Scholar]
- 329.Rambourg A, Clermont Y, Hermo L. Three-dimensional structure of the Golgi apparatus. Methods Cell Biol 23: 155–166, 1981. doi: 10.1016/S0091-679X(08)61497-1. [DOI] [PubMed] [Google Scholar]
- 330.Kirkwood SP, Packer L, Brooks GA. Effects of endurance training on a mitochondrial reticulum in limb skeletal muscle. Arch Biochem Biophys 255: 80–88, 1987. doi: 10.1016/0003-9861(87)90296-7. [DOI] [PubMed] [Google Scholar]
- 331.Ogata T, Yamasaki Y. Ultra-high-resolution scanning electron microscopy of mitochondria and sarcoplasmic reticulum arrangement in human red, white, and intermediate muscle fibers. Anat Rec 248: 214–223, 1997. doi:. [DOI] [PubMed] [Google Scholar]
- 332.Nunnari J, Marshall WF, Straight A, Murray A, Sedat JW, Walter P, Chernyak BV, Domnina LV, Minin AA, Pletjushkina OY, Saprunova VB, Skulachev IV, Tsyplenkova VG, Vasiliev JM, Yaguzhinsky LS, Zorov DB. Mitochondrial transmission during mating in Saccharomyces cerevisiae is determined by mitochondrial fusion and fission and the intramitochondrial segregation of mitochondrial DNA. Mol Biol Cell 8: 1233–1242, 1997. doi: 10.1091/mbc.8.7.1233. [DOI] [PMC free article] [PubMed] [Google Scholar]
- 333.Skulachev VP, Bakeeva LE, Chernyak BV, Domnina LV, Minin AA, Pletjushkina OY, Saprunova VB, Skulachev IV, Tsyplenkova VG, Vasiliev JM, Yaguzhinsky LS, Zorov DB.. Thread-grain transition of mitochondrial reticulum as a step of mitoptosis and apoptosis. Mol Cell Biochem 256-257: 341–58., 2004. doi: 10.1023/B:MCBI.0000009880.94044.49. [DOI] [PubMed] [Google Scholar]
- 334.Patterson GH, Lippincott-Schwartz J.. A photoactivatable GFP for selective photolabeling of proteins and cells. Science 297: 1873–1877, 2002. doi: 10.1126/science.1074952. [DOI] [PubMed] [Google Scholar]
- 335.Miyawaki A, Llopis J, Heim R, McCaffery JM, Adams JA, Ikura M, Tsien RY. Fluorescent indicators for Ca2+ based on green fluorescent proteins and calmodulin. Nature 388: 882–887, 1997. doi: 10.1038/42264. [DOI] [PubMed] [Google Scholar]
- 336.Vielhaber S, Winkler K, Kirches E, Kunz D, Büchner M, Feistner H, Elger CE, Ludolph AC, Riepe MW, Kunz WS. Visualization of defective mitochondrial function in skeletal muscle fibers of patients with sporadic amyotrophic lateral sclerosis. J Neurol Sci 169: 133–139, 1999. doi: 10.1016/s0022-510x(99)00236-1. [DOI] [PubMed] [Google Scholar]
- 337.Rothstein EC, Carroll S, Combs CA, Jobsis PD, Balaban RS. Skeletal muscle NAD(P)H two-photon fluorescence microscopy in vivo: topology and optical inner filters. Biophys J 88: 2165–2176, 2005.doi: 10.1529/biophysj.104.053165. [DOI] [PMC free article] [PubMed] [Google Scholar]
- 338.Rothstein EC, Nauman M, Chesnick S, Balaban RS. Multi-photon excitation microscopy in intact animals. J Microsc 222: 58–64, 2006. doi: 10.1111/j.1365-2818.2006.01570.x. [DOI] [PMC free article] [PubMed] [Google Scholar]
- 339.Vendelin M, Béraud N, Guerrero K, Andrienko T, Kuznetsov AV, Olivares J, Kay L, Saks VA. Mitochondrial regular arrangement in muscle cells: a “crystal-like” pattern. Am J Physiol Cell Physiol Cell Physiol 288: C757–C767, 2005. doi: 10.1152/ajpcell.00281.2004. [DOI] [PubMed] [Google Scholar]
- 340.Chen H, Vermulst M, Wang YE, Chomyn A, Prolla TA, McCaffery JM, Kay L, Saks VA. Mitochondrial fusion is required for mtDNA stability in skeletal muscle and tolerance of mtDNA mutations. Cell, 2010. 141: 280–289 doi: 10.1016/j.cell.2010.02.026. [DOI] [PMC free article] [PubMed] [Google Scholar]
- 341.Romanello V, Guadagnin E, Gomes L, Roder I, Sandri C, Petersen Y, Milan G, Masiero E, Del Piccolo P, Foretz M, Scorrano L, Rudolf R, Sandri M. Mitochondrial fission and remodelling contributes to muscle atrophy. EMBO J 29: 1774–1785, 2010. doi: 10.1038/emboj.2010.60. [DOI] [PMC free article] [PubMed] [Google Scholar]
- 342.Chen Y, Liu Y, Dorn GW. Mitochondrial fusion is essential for organelle function and cardiac homeostasis. Circ Res 109: 1327–1331, 2011. doi: 10.1161/CIRCRESAHA.111.258723. [DOI] [PMC free article] [PubMed] [Google Scholar]
- 343.Song M, Mihara K, Chen Y, Scorrano L, Dorn GW. Mitochondrial fission and fusion factors reciprocally orchestrate mitophagic culling in mouse hearts and cultured fibroblasts. Cell Metab 21: 273–286, 2015.doi: 10.1016/j.cmet.2014.12.011. [DOI] [PMC free article] [PubMed] [Google Scholar]
- 344.Eisner V, Lenaers G, Hajnoczky G. Mitochondrial fusion is frequent in skeletal muscle and supports excitation-contraction coupling. J Cell Biol 205: 179–195, 2014. doi: 10.1083/jcb.201312066. [DOI] [PMC free article] [PubMed] [Google Scholar]
- 345.Liu R, Jin P, Yu L, Wang Y, Han L, Shi T, Li X. Impaired mitochondrial dynamics and bioenergetics in diabetic skeletal muscle. PLoS One 9: e92810, 2014. doi: 10.1371/journal.pone.0092810. [DOI] [PMC free article] [PubMed] [Google Scholar]
- 346.Mishra P, Varuzhanyan G, Pham AH, Chan DC. Mitochondrial dynamics is a distinguishing feature of skeletal muscle fiber types and regulates organellar compartmentalization. Cell Metab 22: 1033–1044, 2015. doi: 10.1016/j.cmet.2015.09.027. [DOI] [PMC free article] [PubMed] [Google Scholar]
- 347.Pham AH, McCaffery JM, Chan DC. Mouse lines with photo-activatable mitochondria to study mitochondrial dynamics. Genesis 50: 833–843, 2012. doi: 10.1002/dvg.22050. [DOI] [PMC free article] [PubMed] [Google Scholar]
- 348.Eisner V, Cupo RR, Gao E, Csordás G, Slovinsky WS, Paillard M, Cheng L, Ibetti J, Chen SR, Chuprun JK, Hoek JB, Koch WJ, Hajnóczky G. Mitochondrial fusion dynamics is robust in the heart and depends on calcium oscillations and contractile activity. Proc Natl Acad Sci U S A 114: E859–E868, 2017. doi: 10.1073/pnas.1617288114. [DOI] [PMC free article] [PubMed] [Google Scholar]
- 349.Huang X, Sun L, Ji S, Zhao T, Zhang W, Xu J, Zhang J, Wang Y, Wang X, Franzini-Armstrong C, Zheng M, Cheng H. Kissing and nanotunneling mediate intermitochondrial communication in the heart. Proc Natl Acad Sci U S A 110: 2846–2851, 2013. doi: 10.1073/pnas.1300741110. [DOI] [PMC free article] [PubMed] [Google Scholar]
- 350.Romanello V, Sandri M. Mitochondrial quality control and muscle mass maintenance. Front Physiol 6: 422, 2015. doi: 10.3389/fphys.2015.00422. [DOI] [PMC free article] [PubMed] [Google Scholar]
- 351.Romanello V, Scalabrin M, Albiero M, Blaauw B, Scorrano L, Sandri M. Inhibition of the fission machinery mitigates OPA1 impairment in adult skeletal muscles. Cells 8: 597, 2019. doi: 10.3390/cells8060597. [DOI] [PMC free article] [PubMed] [Google Scholar]
- 352.Favaro G, Romanello V, Varanita T, Andrea Desbats M, Morbidoni V, Tezze C, Albiero M, Canato M, Gherardi G, De Stefani D, Mammucari C, Blaauw B, Boncompagni S, Protasi F, Reggiani C, Scorrano L, Salviati L, Sandri M. DRP1-mediated mitochondrial shape controls calcium homeostasis and muscle mass. Nat Commun 10: 1–17, 2019. doi: 10.1038/s41467-019-10226-9. [DOI] [PMC free article] [PubMed] [Google Scholar]
- 353.Dorn GW. Evolving concepts of mitochondrial dynamics. Annu Rev Physiol 81: 1–17, 2019. doi: 10.1146/annurev-physiol-020518-114358. [DOI] [PubMed] [Google Scholar]
- 354.Gong G, Song M, Csordas G, Kelly DP, Matkovich SJ, Dorn GW. Parkin-mediated mitophagy directs perinatal cardiac metabolic maturation in mice. Science 350: aad2459, 2015. doi: 10.1126/science.aad2459. [DOI] [PMC free article] [PubMed] [Google Scholar]
- 355.Song M, Franco A, Fleischer JA, Zhang L, Dorn GW. Abrogating mitochondrial dynamics in mouse hearts accelerates mitochondrial senescence. Cell Metab 26: 872–883, 2017. doi: 10.1016/j.cmet.2017.09.023. [DOI] [PMC free article] [PubMed] [Google Scholar]
- 356.Luo G, Yi J, Ma C, Xiao Y, Yi F, Yu T, Zhou J. Defective mitochondrial dynamics is an early event in skeletal muscle of an amyotrophic lateral sclerosis mouse model. PLoS One 8: e82112, 2013. doi: 10.1371/journal.pone.0082112. [DOI] [PMC free article] [PubMed] [Google Scholar]
- 357.Vincent AE, Ng YS, White K, Davey T, Mannella C, Falkous G, Feeney C, Schaefer AM, McFarland R, Gorman GS, Taylor RW, Turnbull DM, Picard M. The spectrum of mitochondrial ultrastructural defects in mitochondrial myopathy. Sci Rep 6: 30610, 2016. doi: 10.1038/srep30610. [DOI] [PMC free article] [PubMed] [Google Scholar]
- 358.Vincent AE, Rosa HS, Pabis K, Lawless C, Chen C, Grünewald A, Rygiel KA, Rocha MC, Reeve AK, Falkous G, Perissi V, White K, Davey T, Petrof BJ, Sayer AA, Cooper C, Deehan D, Taylor RW, Turnbull DM, Picard M. Subcellular origin of mitochondrial DNA deletions in human skeletal muscle. Ann Neurol 84: 289–301, 2018. doi: 10.1002/ana.25288. [DOI] [PMC free article] [PubMed] [Google Scholar]
- 359.Picard M, White K, Turnbull DM. Mitochondrial morphology, topology, and membrane interactions in skeletal muscle: a quantitative three-dimensional electron microscopy study. J Appl Physiol 114: 161–171, 2013. doi: 10.1152/japplphysiol.01096.2012. [DOI] [PMC free article] [PubMed] [Google Scholar]
- 360.Picard M, Gentil BJ, McManus MJ, White K, St. Louis K, Gartside SE, Wallace DC, Turnbull DM. Acute exercise remodels mitochondrial membrane interactions in mouse skeletal muscle. J Appl Physiol (1985) 115: 1562–1571, 2013. doi: 10.1152/japplphysiol.00819.2013. [DOI] [PMC free article] [PubMed] [Google Scholar]
- 361.Dahl R, Larsen S, Dohlmann TL, Qvortrup K, Helge JW, Dela F, Prats C. Three dimensional reconstruction of the human skeletal muscle mitochondrial network as a tool to assess mitochondrial content and structural organization. Acta Physiol (Oxf) 213: 145–155, 2015. doi: 10.1111/apha.12289. [DOI] [PubMed] [Google Scholar]
- 362.Denk W, Horstmann H. Serial block-face scanning electron microscopy to reconstruct three-dimensional tissue nanostructure. PLoS Biol 2: e329, 2004. doi: 10.1371/journal.pbio.0020329. [DOI] [PMC free article] [PubMed] [Google Scholar]
- 363.Amchenkova AA, Bakeeva LE, Chentsov YS, Skulachev VP, Zorov DB. Coupling membranes as energy-transmitting cables. I. Filamentous mitochondria in fibroblasts and mitochondrial clusters in cardiomyocytes. J Cell Biol 107: 481–495, 1988. doi: 10.1083/jcb.107.2.481. [DOI] [PMC free article] [PubMed] [Google Scholar]
- 364.Chalmers S, Caldwell ST, Quin C, Prime TA, James AM, Cairns AG, Murphy MP, McCarron JG, Hartley RC. Selective uncoupling of individual mitochondria within a cell using a mitochondria-targeted photoactivated protonophore. J Am Chem Soc 134: 758–761, 2012. doi: 10.1021/ja2077922. [DOI] [PMC free article] [PubMed] [Google Scholar]
- 365.Patel KD, Glancy B, Balaban RS. The electrochemical transmission in I-Band segments of the mitochondrial reticulum. Biochim Biophys Acta 1857: 1284–1289, 2016. doi: 10.1016/j.bbabio.2016.02.014. [DOI] [PMC free article] [PubMed] [Google Scholar]
- 366.Bruton J, Jeffries GD, Westerblad H. Usage of a localised microflow device to show that mitochondrial networks are not extensive in skeletal muscle fibres. PLoS One 9: e108601, 2014. doi: 10.1371/journal.pone.0108601. [DOI] [PMC free article] [PubMed] [Google Scholar]
- 367.Cassidy-Stone A, Chipuk JE, Ingerman E, Song C, Yoo C, Kuwana T, Kurth MJ, Shaw JT, Hinshaw JE, Green DR, Nunnari J. Chemical inhibition of the mitochondrial division dynamin reveals its role in Bax/Bak-dependent mitochondrial outer membrane permeabilization. Dev Cell 14: 193–204, 2008. doi: 10.1016/j.devcel.2007.11.019. [DOI] [PMC free article] [PubMed] [Google Scholar]
- 368.Macia E, Ehrlich M, Massol R, Boucrot E, Brunner C, Kirchhausen T. Dynasore, a cell-permeable inhibitor of dynamin. Dev Cell 10: 839–850, 2006. doi: 10.1016/j.devcel.2006.04.002. [DOI] [PubMed] [Google Scholar]
- 369.Nemani N, Carvalho E, Tomar D, Dong Z, Ketschek A, Breves SL, et al. MIRO-1 determines mitochondrial shape transition upon GPCR activation and Ca(2+) stress. Cell Rep 23: 1005–1019, 2018. doi: 10.1016/j.celrep.2018.03.098. [DOI] [PMC free article] [PubMed] [Google Scholar]
- 370.Vetter L, Cortassa S, O'Rourke B, Armoundas AA, Bedja D, Jende JM, Bendszus M, Paolocci N, Sollot SJ, Aon MA, Kurz FT. Diabetes increases the vulnerability of the cardiac mitochondrial network to criticality. Front Physiol 11: 175, 2020. doi: 10.3389/fpls.2020.00175,10.3389/fphys.2020.00175. [DOI] [PMC free article] [PubMed] [Google Scholar]
- 371.Dayal AA, Medvedeva NV, Nekrasova TM, Duhalin SD, Surin AK, Minin AA. Desmin interacts directly with mitochondria. Int J Mol Sci 21: 8122, 2020. doi: 10.3390/ijms21218122. [DOI] [PMC free article] [PubMed] [Google Scholar]
- 372.Schröder R, Kunz WS, Rouan F, Pfendner E, Tolksdorf K, Kappes-Horn K, Altenschmidt-Mehring M, Knoblich R, van der Ven PF, Reimann J, Fürst DO, Blümcke I, Vielhaber S, Zillikens D, Eming S, Klockgether T, Uitto J, Wiche G, Rolfs A. Disorganization of the desmin cytoskeleton and mitochondrial dysfunction in plectin-related epidermolysis bullosa simplex with muscular dystrophy. J Neuropathol Exp Neurol 61: 520–530, 2002. doi: 10.1093/jnen/61.6.520. [DOI] [PubMed] [Google Scholar]
- 373.Duchen MR, Leyssens A, Crompton M. Transient mitochondrial depolarizations reflect focal sarcoplasmic reticular calcium release in single rat cardiomyocytes. J Cell Biol 142: 975–988, 1998. doi: 10.1083/jcb.142.4.975. [DOI] [PMC free article] [PubMed] [Google Scholar]
- 374.Wang W, Fang H, Groom L, Cheng A, Zhang W, Liu J, Wang X, Li K, Han P, Zheng M, Yin J, Wang W, Mattson MP, Kao JP, Lakatta EG, Sheu SS, Ouyang K, Chen J, Dirksen RT, Cheng H. Superoxide flashes in single mitochondria. Cell 134: 279–290, 2008. doi: 10.1016/j.cell.2008.06.017. [DOI] [PMC free article] [PubMed] [Google Scholar]
- 375.Boyman L, Coleman AK, Zhao G, Wescott AP, Joca HC, Greiser BM, Karbowski M, Ward CW, Lederer WJ. Dynamics of the mitochondrial permeability transition pore: Transient and permanent opening events. Arch Biochem Biophys 666: 31–39, 2019. doi: 10.1016/j.abb.2019.03.016. [DOI] [PMC free article] [PubMed] [Google Scholar]
- 376.Aon MA, Cortassa S, Marbán E, O'Rourke B. Synchronized whole cell oscillations in mitochondrial metabolism triggered by a local release of reactive oxygen species in cardiac myocytes. J Biol Chem 278: 44735–44744, 2003. doi: 10.1074/jbc.M302673200. [DOI] [PubMed] [Google Scholar]
- 377.Aon MA, Cortassa S, O'Rourke B. Percolation and criticality in a mitochondrial network. Proc Natl Acad Sci U S A 101: 4447–4452, 2004. doi: 10.1073/pnas.0307156101. [DOI] [PMC free article] [PubMed] [Google Scholar]
- 378.Aon MA, Cortassa S, O'Rourke B. The fundamental organization of cardiac mitochondria as a network of coupled oscillators. Biophys J 91: 4317–4327, 2006. doi: 10.1529/biophysj.106.087817. [DOI] [PMC free article] [PubMed] [Google Scholar]
- 379.Kurz FT, Aon MA, O'Rourke B, Armoundas AA. Spatio-temporal oscillations of individual mitochondria in cardiac myocytes reveal modulation of synchronized mitochondrial clusters. Proc Natl Acad Sci U S A 107: 14315–14320, 2010. doi: 10.1073/pnas.1007562107. [DOI] [PMC free article] [PubMed] [Google Scholar]
- 380.Romashko DN, Marban E, O'Rourke B. Subcellular metabolic transients and mitochondrial redox waves in heart cells. Proc Natl Acad Sci U S A 95: 1618–1623, 1998. doi: 10.1073/pnas.95.4.1618. [DOI] [PMC free article] [PubMed] [Google Scholar]
- 381.Juhaszova M, Zorov DB, Kim SH, Pepe S, Fu Q, Fishbein KW, Ziman BD, Wang S, Ytrehus K, Antos CL, Olson EN, Sollott SJ. Glycogen synthase kinase-3beta mediates convergence of protection signaling to inhibit the mitochondrial permeability transition pore. J Clin Invest 113: 1535–1549, 2004. doi: 10.1172/JCI19906. [DOI] [PMC free article] [PubMed] [Google Scholar]
- 382.Wu Y, Shroff H. Faster, sharper, and deeper: structured illumination microscopy for biological imaging. Nat Meth 15: 1011–1019, 2018. doi: 10.1038/s41592-018-0211-z. [DOI] [PubMed] [Google Scholar]
- 383.Vincent AE, White K, Davey T, Philips J, Ogden RT, Lawless C, Warren C, Hall MG, Ng YS, Falkous G, Holden T, Deehan D, Taylor RW, Turnbull DM, Picard M. Quantitative 3D mapping of the human skeletal muscle mitochondrial network. Cell Rep 26: 996–1009, 2019.. doi: 10.1016/j.celrep.2019.01.010. [DOI] [PMC free article] [PubMed] [Google Scholar]
- 384.Schroter M, Paulsen O, Bullmore ET. Micro-connectomics: probing the organization of neuronal networks at the cellular scale. Nat Rev Neurosci 18: 131–146, 2017. doi: 10.1038/nrn.2016.182. [DOI] [PubMed] [Google Scholar]
- 385.Roth SM, Martel GF, Rogers MA. Muscle biopsy and muscle fiber hypercontraction: a brief review. Eur J Appl Physiol 83: 239–245, 2000. doi: 10.1007/s004210000287. [DOI] [PubMed] [Google Scholar]
- 386.Roth SM, Rogers MA. Interpretation of muscle damage from fixed tissue obtained by needle biopsy. Am J Physiol Endocrinol Metab 278: E754–E756, 2000. doi: 10.1152/ajpendo.2000.278.4.E754. [DOI] [PubMed] [Google Scholar]
- 387.Vincent AE, Turnbull DM, Eisner V, Hajnóczky G, Picard M. Mitochondrial nanotunnels. Trends Cell Biol 27: 787–799, 2017. doi: 10.1016/j.tcb.2017.08.009. [DOI] [PMC free article] [PubMed] [Google Scholar]
- 388.Caffrey BJ, Maltsev AV, Gonzalez-Freire M, Hartnell LM, Ferrucci L, Subramaniam S. Semi-automated 3D segmentation of human skeletal muscle using focused ion beam-scanning electron microscopic images. J Struct Biol 207: 1–11, 2019. doi: 10.1016/j.jsb.2019.03.008. [DOI] [PMC free article] [PubMed] [Google Scholar]
- 389.de Graaf RA, van Kranenburg A, Nicolay K. In vivo 31P-NMR diffusion spectroscopy of ATP and phosphocreatine in rat skeletal muscle. Biophys J 78: 1657–1664, 2000. doi: 10.1016/S0006-3495(00)76717-8. [DOI] [PMC free article] [PubMed] [Google Scholar]
- 390.Aliev MK. Water content and its intracellular distribution in intact and saline perfused rat hearts revisited. Cardiovasc Res 53: 48–58, 2002. doi: 10.1016/S0008-6363(01)00474-6. [DOI] [PubMed] [Google Scholar]
- 391.Hodgkin AL, Keynes RD. The mobility and diffusion coefficient of potassium in giant axons from Sepia. J Physiol 119: 513–528, 1953. doi: 10.1113/jphysiol.1953.sp004863. [DOI] [PMC free article] [PubMed] [Google Scholar]
- 392.Longsworth LG. Temperature dependence of diffusion in aqueous solutions. J Phys Chem 58: 770–773, 1954. doi: 10.1021/j150519a017. [DOI] [Google Scholar]
- 393.Lanza IR, Larsen RG, Kent-Braun JA. Effects of old age on human skeletal muscle energetics during fatiguing contractions with and without blood flow. J Physiol 583: 1093–1105, 2007. doi: 10.1113/jphysiol.2007.138362. [DOI] [PMC free article] [PubMed] [Google Scholar]
- 394.Dahmane R, Djordjevič S, Šimunič B, Valenčič V. Spatial fiber type distribution in normal human muscle: histochemical and tensiomyographical evaluation. J Biomech 38: 2451–2459, 2005. doi: 10.1016/j.jbiomech.2004.10.020. [DOI] [PubMed] [Google Scholar]
- 395.Larsen HK, Friden J, Wretling ML. Distribution of fibre sizes in human skeletal muscle. An enzyme histochemical study in m tibialis anterior. Acta Physiol Scand 123: 171–177, 1985. doi: 10.1111/j.1748-1716.1985.tb07574.x. [DOI] [PubMed] [Google Scholar]
- 396.Henriksson-Larsén KB, Lexell J, Sjöström M. Distribution of different fibre types in human skeletal muscles. I. Method for the preparation and analysis of cross-sections of whole tibialis anterior. Histochem J 15: 167–178, 1983. doi: 10.1007/BF01042285. [DOI] [PubMed] [Google Scholar]
- 397.Mitchell P. Coupling of phosphorylation to electron and hydrogen transfer by a chemi-osmotic type of mechanism. Nature 191: 144–148, 1961. doi: 10.1038/191144a0. [DOI] [PubMed] [Google Scholar]
- 398.Bakeeva LE, Chentsov YS, Skulachev VP. Ontogenesis of mitochondrial reticulum in rat diaphragm muscle. Eur J Cell Biol 25: 175–181, 1981. [PubMed] [Google Scholar]
- 399.Boncompagni S. Mitochondria are linked to calcium stores in striated muscle by developmentally regulated tethering structures. Mol Biol Cell 20: 1058–1067, 2009. doi: 10.1091/mbc.e08-07-0783. [DOI] [PMC free article] [PubMed] [Google Scholar]
- 400.Baar K, Wende AR, Jones TE, Marison M, Nolte LA, Chen M, Kelly DP, Holloszy JO. Adaptations of skeletal muscle to exercise: rapid increase in the transcriptional coactivator PGC-1. FASEB J 16: 1879–1886, 2002. doi: 10.1096/fj.02-0367com. [DOI] [PubMed] [Google Scholar]
- 401.Huss JM, Torra IP, Staels B, Giguère V, Kelly DP. Estrogen-related receptor α directs peroxisome proliferator-activated receptor α signaling in the transcriptional control of energy metabolism in cardiac and skeletal muscle. Mol Cell Biol 24: 9079–9091, 2004. doi: 10.1128/MCB.24.20.9079-9091.2004. [DOI] [PMC free article] [PubMed] [Google Scholar]
- 402.Lehman JJ, Barger PM, Kovacs A, Saffitz JE, Medeiros DM, Kelly DP. Peroxisome proliferator-activated receptor gamma coactivator-1 promotes cardiac mitochondrial biogenesis. J Clin Invest 106: 847–856, 2000. doi: 10.1172/JCI10268. [DOI] [PMC free article] [PubMed] [Google Scholar]
- 403.Vega RB, Kelly DP. Cardiac nuclear receptors: architects of mitochondrial structure and function. J Clin Invest 127: 1155–1164, 2017. doi: 10.1172/JCI88888. [DOI] [PMC free article] [PubMed] [Google Scholar]
- 404.Zechner C, Lai L, Zechner JF, Geng T, Yan Z, Rumsey JW, Collia D, Chen Z, Wozniak DF, Leone TC, Kelly DP. Total skeletal muscle PGC-1 deficiency uncouples mitochondrial derangements from fiber type determination and insulin sensitivity. Cell Metab 12: 633–642, 2010. doi: 10.1016/j.cmet.2010.11.008. [DOI] [PMC free article] [PubMed] [Google Scholar]
- 405.Hood DA, Memme JM, Oliveira AN, Triolo M. Maintenance of skeletal muscle mitochondria in health, exercise, and aging. Annu Rev Physiol 81: 19–41, 2019. doi: 10.1146/annurev-physiol-020518-114310. [DOI] [PubMed] [Google Scholar]
- 406.McWilliams TG, Prescott AR, Allen GF, Tamjar J, Munson MJ, Thomson C, Muqit MM, Ganley IG. mito-QC illuminates mitophagy and mitochondrial architecture in vivo. J Cell Biol 214: 333–345, 2016. doi: 10.1083/jcb.201603039. [DOI] [PMC free article] [PubMed] [Google Scholar]
- 407.Sun N, Yun J, Liu J, Malide D, Liu C, Rovira II, Holmström KM, Fergusson MM, Yoo YH, Combs CA, Finkel T. Measuring in vivo mitophagy. Mol Cell 60: 685–696, 2015. doi: 10.1016/j.molcel.2015.10.009. [DOI] [PMC free article] [PubMed] [Google Scholar]
- 408.Karunadharma PP, Basisty N, Chiao YA, Dai DF, Drake R, Levy N, Gorokhova S, Krahn M. Respiratory chain protein turnover rates in mice are highly heterogeneous but strikingly conserved across tissues, ages, and treatments. FASEB J 29: 3582–3592, 2015. doi: 10.1096/fj.15-272666. [DOI] [PMC free article] [PubMed] [Google Scholar]
- 409.Kim TY, Wang D, Kim AK, Lau E, Lin AJ, Liem DA, Zhang J, Zong NC, Lam MP, Ping P. Metabolic labeling reveals proteome dynamics of mouse mitochondria. Mol Cell Proteomics 11: 1586–1594, 2012. doi: 10.1074/mcp.M112.021162. [DOI] [PMC free article] [PubMed] [Google Scholar]
- 410.Hernandez G, Thornton C, Stotland A, Lui D, Sin J, Ramil J, Magee N, Andres A, Quarato G, Carreira RS, Sayen MR, Wolkowicz R, Gottlieb RA. MitoTimer: a novel tool for monitoring mitochondrial turnover. Autophagy 9: 1852–1861, 2013. doi: 10.4161/auto.26501. [DOI] [PMC free article] [PubMed] [Google Scholar]
- 411.Laker RC, Xu P, Ryall KA, Sujkowski A, Kenwood BM, Chain KH, Zhang M, Royal MA, Hoehn KL, Driscoll M, Adler PN, Wessells RJ, Saucerman JJ, Yan Z. A novel MitoTimer reporter gene for mitochondrial content, structure, stress, and damage in vivo. J Biol Chem 289: 12005–12015, 2014. doi: 10.1074/jbc.M113.530527. [DOI] [PMC free article] [PubMed] [Google Scholar]
- 412.Wilson RJ, Drake JC, Cui D, Zhang M, Perry HM, Kashatus JA, Kusminski CM, Scherer PE, Kashatus DF, Okusa MD, Yan Z. Conditional MitoTimer reporter mice for assessment of mitochondrial structure, oxidative stress, and mitophagy. Mitochondrion 44: 20–26, 2019. doi: 10.1016/j.mito.2017.12.008. [DOI] [PMC free article] [PubMed] [Google Scholar]
- 413.Lindstedt SL, McGlothlin T, Percy E, Pifer J. Task-specific design of skeletal muscle: balancing muscle structural composition. Comp Biochem Physiol B Biochem Mol Biol 120: 35–40, 1998. doi: 10.1016/S0305-0491(98)00021-2. [DOI] [PubMed] [Google Scholar]
- 414.Willingham TB, Kim Y, Lindberg E, Bleck CK, Glancy B. The unified myofibrillar matrix for force generation in muscle. Nat Commun 11: 3722, 2020. doi: 10.1038/s41467-020-17579-6. [DOI] [PMC free article] [PubMed] [Google Scholar]
- 415.Goldspink G. Alterations in myofibril size and structure during growth, exercise, and changes in environmental temperature. In: Handbook of Physiology. Bethesda, MD: American Physiological Society, sect 10, p. 539–554, 1983. doi: 10.1002/cphy.cp100118. [DOI] [Google Scholar]
- 416.Bartoo ML, Popov VI, Fearn LA, Pollack GH. Active tension generation in isolated skeletal myofibrils. J Muscle Res Cell Motil 14: 498–510, 1993. doi: 10.1007/BF00297212. [DOI] [PubMed] [Google Scholar]
- 417.de Souza Leite F, Minozzo FC, Altman D, Rassier DE. Microfluidic perfusion shows intersarcomere dynamics within single skeletal muscle myofibrils. Proc Natl Acad Sci U S A 114: 8794–8799, 2017. doi: 10.1073/pnas.1700615114. [DOI] [PMC free article] [PubMed] [Google Scholar]
- 418.Eisenberg BR, Kuda AM. Stereological analysis of mammalian skeletal muscle. II. White vastus muscle of the adult guinea pig. J Ultrastruct Res 51: 176–187, 1975. doi: 10.1016/S0022-5320(75)80146-8. [DOI] [PubMed] [Google Scholar]
- 419.Eisenberg BR, Kuda AM, Peter JB. Stereological analysis of mammalian skeletal muscle. I. Soleus muscle of the adult guinea pig. J Cell Biol 60: 732–754, 1974. doi: 10.1083/jcb.60.3.732. [DOI] [PMC free article] [PubMed] [Google Scholar]
- 420.Picard M, McManus MJ, Csordás G, Várnai P, Dorn GW 2nd, Williams D, Hajnóczky GW. Trans-mitochondrial coordination of cristae at regulated membrane junctions. Nat Commun 6: 6259, 2015. doi: 10.1038/ncomms7259. [DOI] [PMC free article] [PubMed] [Google Scholar]
- 421.Duvert M, Mazat JP, Barets AL. Intermitochondrial junctions in the heart of the frog, Rana esculenta. A thin-section and freeze-fracture study. Cell Tissue Res 241: 129–137, 1985. doi: 10.1007/BF00214634. [DOI] [PubMed] [Google Scholar]
- 422.Lavorato M, Iyer VR, Dewight W, Cupo RR, Debattisti V, Gomez L, De la Fuente S, Zhao YT, Valdivia HH, Hajnóczky G, Franzini-Armstrong C. Increased mitochondrial nanotunneling activity, induced by calcium imbalance, affects intermitochondrial matrix exchanges. Proc Natl Acad Sci U S A 114: E849–E858, 2017. doi: 10.1073/pnas.1617788113. [DOI] [PMC free article] [PubMed] [Google Scholar]
- 423.Phillips MJ, Voeltz GK. Structure and function of ER membrane contact sites with other organelles. Nat Rev Mol Cell Biol 17: 69–82, 2016. doi: 10.1038/nrm.2015.8. [DOI] [PMC free article] [PubMed] [Google Scholar]
- 424.Glancy B, Kim Y, Katti P, Willingham TB. The functional impact of mitochondrial structure across subcellular scales. Front Physiol 11: 1462, 2020. doi: 10.3389/fphys.2020.541040. [DOI] [PMC free article] [PubMed] [Google Scholar]
- 425.Giddings TH, Staehelin LA. Plasma membrane architecture of Anabaena cylindrica: occurrence of microplasmodesmata and changes associated with heterocyst development and the cell cycle. Eur J Cell Biol 16: 235–249, 1978. [Google Scholar]
- 426.Mullineaux CW, Mariscal V, Nenninger A, Khanum H, Herrero A, Flores E, Adams DG. Mechanism of intercellular molecular exchange in heterocyst‐forming cyanobacteria. EMBO J 27: 1299–1308, 2008. doi: 10.1038/emboj.2008.66. [DOI] [PMC free article] [PubMed] [Google Scholar]
- 427.Kornmann B, Osman C, Walter P. The conserved GTPase Gem1 regulates endoplasmic reticulum-mitochondria connections. Proc Natl Acad Sci U S A 108: 14151–14156, 2011. doi: 10.1073/pnas.1111314108. [DOI] [PMC free article] [PubMed] [Google Scholar]
- 428.Szabadkai G, Bianchi K, Várnai P, De Stefani D, Wieckowski MR, Cavagna D, Nagy AI, Balla T, Rizzuto R. Chaperone-mediated coupling of endoplasmic reticulum and mitochondrial Ca2+ channels. J Cell Biol 175: 901–911, 2006. doi: 10.1083/jcb.200608073. [DOI] [PMC free article] [PubMed] [Google Scholar]
- 429.Homer LD, Shelton JB, Dorsey CH, Williams TJ. Anisotropic diffusion of oxygen in slices of rat muscle. Am J Physiol Regul Integr Comp Physiol 246: R107–R113, 1984. doi: 10.1152/ajpregu.1984.246.1.R107. [DOI] [PubMed] [Google Scholar]
- 430.Binzoni T, Courvoisier C, Giust R, Tribillon G, Gharbi T, Hebden JC, Leung TS, Roux J, Delpy DT. Anisotropic photon migration in human skeletal muscle. Phys Med Biol 51: N79–90, 2006. doi: 10.1088/0031-9155/51/5/N01. [DOI] [PubMed] [Google Scholar]
- 431.Engel J, Fechner M, Sowerby AJ, Finch SA, Stier A. Anisotropic propagation of Ca2+ waves in isolated cardiomyocytes. Biophys J 66: 1756–1762, 1994. doi: 10.1016/S0006-3495(94)80997-X. [DOI] [PMC free article] [PubMed] [Google Scholar]
- 432.Vendelin M, Birkedal R. Anisotropic diffusion of fluorescently labeled ATP in rat cardiomyocytes determined by raster image correlation spectroscopy. Am J Physiol Cell Physiol 295: C1302–C1315, 2008. doi: 10.1152/ajpcell.00313.2008. [DOI] [PMC free article] [PubMed] [Google Scholar]
- 433.Tkatch T, Greotti E, Baranauskas G, Pendin D, Roy S, Nita LI, Wettmarshausen J, Prigge M, Yizhar O, Shirihai OS, Fishman D, Hershfinkel M, Fleidervish IA, Perocchi F, Pozzan T, Sekler I. Optogenetic control of mitochondrial metabolism and Ca(2+) signaling by mitochondria-targeted opsins. Proc Natl Acad Sci U S A 114: E5167–E5176, 2017. doi: 10.1073/pnas.1703623114. [DOI] [PMC free article] [PubMed] [Google Scholar]
- 434.Berry BJ, Trewin AJ, Milliken AS, Baldzizhar A, Amitrano AM, Lim Y, Kim M, Wojtovich AP. Optogenetic control of mitochondrial protonmotive force to impact cellular stress resistance. EMBO Rep 21: e49113, 2020. doi: 10.15252/embr.201949113. [DOI] [PMC free article] [PubMed] [Google Scholar]
- 435.LaNoue KF, Schoolwerth AC. Metabolite transport in mitochondria. Ann Rev Biochem 48: 871–922, 1979. doi: 10.1146/annurev.bi.48.070179.004255. [DOI] [PubMed] [Google Scholar]
- 436.LaNoue KF, Meijer AJ, Brouwer A. Evidence for electrogenic aspartate transport in rat liver mitochondria. Arch Biochem Biophys 161: 544–550, 1974. doi: 10.1016/0003-9861(74)90337-3. [DOI] [PubMed] [Google Scholar]
- 437.Laris PC. Evidence for the electrogenic nature of the ATP-ADP exchange system in rat liver mitochondria. Biochim Biophys Acta 459: 110–118, 1977. doi: 10.1016/0005-2728(77)90013-5. [DOI] [PubMed] [Google Scholar]
- 438.Pfaff E, Klingenberg M. Adenine nucleotide translocation of mitochondria: 1. Specificity and control. Eur J Biochem 6: 66–79, 1968. doi: 10.1111/j.1432-1033.1968.tb00420.x. [DOI] [PubMed] [Google Scholar]
- 439.Boyman L, Williams GS, Khananshvili D, Sekler I, Lederer WJ. NCLX: the mitochondrial sodium calcium exchanger. J Mol Cell Cardiol 59: 205–213, 2013. doi: 10.1016/j.yjmcc.2013.03.012. [DOI] [PMC free article] [PubMed] [Google Scholar]
- 440.Kim B, Matsuoka S. Cytoplasmic Na+‐dependent modulation of mitochondrial Ca2+ via electrogenic mitochondrial Na+–Ca2+ exchange. J Physiol 586: 1683–1697, 2008. doi: 10.1113/jphysiol.2007.148726. [DOI] [PMC free article] [PubMed] [Google Scholar]
- 441.Hernansanz-Agustín P, Choya-Foces C, Carregal-Romero S, Ramos E, Oliva T, Villa-Piña T, Moreno L, Izquierdo-Álvarez A, Cabrera-García JD, Cortés A, Lechuga-Vieco AV, Jadiya P, Navarro E, Parada E, Palomino-Antolín A, Tello D, Acín-Pérez R, Rodríguez-Aguilera JC, Navas P, Cogolludo Á, López-Montero I, Martínez-Del-Pozo Á, Egea J, López MG, Elrod JW, Ruíz-Cabello J, Bogdanova A, Enríquez JA, Martínez-Ruiz A. Na+ controls hypoxic signalling by the mitochondrial respiratory chain. Nature 586: 287–291, 2020. doi: 10.1038/s41586-020-2551-y. [DOI] [PMC free article] [PubMed] [Google Scholar]
- 442.Johnston JD, Brand MD. Stimulation of the respiration rate of rat liver mitochondria by sub-micromolar concentrations of extramitochondrial Ca2+. Biochem J 245: 217–222, 1987. doi: 10.1042/bj2450217. [DOI] [PMC free article] [PubMed] [Google Scholar]
- 443.McCormack JG, Halestrap AP, Denton RM. Role of calcium ions in regulation of mammalian intramitochondrial metabolism. Physiol Rev 70: 391–425, 1990. doi: 10.1152/physrev.1990.70.2.391. [DOI] [PubMed] [Google Scholar]
- 444.Satrustegui J, Pardo B, Del Arco A. Mitochondrial transporters as novel targets for intracellular calcium signaling. Physiol Rev 87: 29–67, 2007. doi: 10.1152/physrev.00005.2006. [DOI] [PubMed] [Google Scholar]
- 445.McCormack JG, Denton RM. Role of calcium ions in the regulation of intramitochondrial metabolism. Properties of the Ca2+-sensitive dehydrogenases within intact uncoupled mitochondria from the white and brown adipose tissue of the rat. Biochem J 190: 95–105, 1980. doi: 10.1042/bj1900095. [DOI] [PMC free article] [PubMed] [Google Scholar]
- 446.Murphy AN, Kelleher JK, Fiskum G. Submicromolar Ca2+ regulates phosphorylating respiration by normal rat liver and AS-30D hepatoma mitochondria by different mechanisms. J Biol Chem 265: 10527–10534, 1990. doi: 10.1016/S0021-9258(18)86979-4. [DOI] [PubMed] [Google Scholar]
- 447.Campanella M, Casswell E, Chong S, Farah Z, Wieckowski MR, Abramov AY, Tinker A, Duchen MR. Regulation of mitochondrial structure and function by the F1Fo-ATPase inhibitor protein, IF1. Cell Metab 8: 13–25, 2008. doi: 10.1016/j.cmet.2008.06.001. [DOI] [PubMed] [Google Scholar]
- 448.Chinopoulos C, Gerencser AA, Mandi M, Mathe K, Töröcsik B, Doczi J, Turiak L, Kiss G, Konràd C, Vajda S, Vereczki V, Oh RJ, Adam-Vizi V. Forward operation of adenine nucleotide translocase during F0F1‐ATPase reversal: critical role of matrix substrate‐level phosphorylation. FASEB J 24: 2405–2416, 2010. doi: 10.1096/fj.09-149898. [DOI] [PMC free article] [PubMed] [Google Scholar]
- 449.Power A, Pearson N, Pham T, Cheung C, Phillips A, Hickey A. Uncoupling of oxidative phosphorylation and ATP synthase reversal within the hyperthermic heart. Physiol Rep 2: e12138, 2014. doi: 10.14814/phy2.12138. [DOI] [PMC free article] [PubMed] [Google Scholar]
- 450.Ruiz-Meana M, Garcia-Dorado D, Lane S, Pina P, Inserte J, Mirabet M, Soler-Soler J. Persistence of gap junction communication during myocardial ischemia. Am J Physiol Heart Circ Physiol 280: H2563–H2571, 2001. doi: 10.1152/ajpheart.2001.280.6.H2563. [DOI] [PubMed] [Google Scholar]
- 451.Grover GJ, Atwal KS, Sleph PG, Wang FL, Monshizadegan H, Monticello T, Green DW. Excessive ATP hydrolysis in ischemic myocardium by mitochondrial F1F0-ATPase: effect of selective pharmacological inhibition of mitochondrial ATPase hydrolase activity. Am J Physiol Heart Circ Physiol 287: H1747–H1755, 2004. doi: 10.1152/ajpheart.01019.2003. [DOI] [PubMed] [Google Scholar]