

Abstract
An early step in cellular infection by a membrane-enveloped virus like HIV or influenza is joining (fusion) of the viral and cell membranes. Fusion is catalyzed by a viral protein that typically includes an apolar “fusion peptide” (fp) segment that binds the target membrane prior to fusion. In this study, the effects of non-homologous HIV and influenza fp’s on lipid acyl chain motion are probed with 2H NMR transverse relaxation rates (R2’s) of perdeuterated DMPC membrane. Measurements were made between 35 and 0 °C which brackets the membrane liquid-crystalline-to-gel phase transitions. Samples were made with either HIV “GPfp” at pH 7 or influenza “HAfp” at pH 5 or 7. GPfp induces vesicle fusion at pH 7 and HAfp induces more fusion at pH 5 vs 7. GPfp bound to DMPC adopts intermolecular antiparallel β sheet structure, whereas HAfp is a monomer helical hairpin. The R2’s of the no peptide and HAfp, pH 7 samples increase gradually as temperature is lowered. The R2’s of GPfp and HAfp, pH 5 samples have very different temperature dependence, with ~10× increase in R2CD2 when temperature is reduced from 25 to 20 °C, and smaller but still substantial R2’s at 10 and 0 °C. The large R2’s with GPfp and HAfp, pH 5 are consistent with large-amplitude motions of lipid acyl chains that can aid fusion catalysis by increasing the population of chains near the aqueous phase, which is the chain location for transition states between membrane fusion intermediates.
Keywords: fusion peptide, NMR, relaxation, lipid acyl chains, HIV, influenza, deuteron
Graphical Abstract

Introduction
Many zoonotic pathogens like human immunodeficiency virus (HIV), influenza virus, and coronaviruses are membrane-enveloped viruses. An early step in infection by these viruses is joining (fusion) of the viral and target cell membranes.1-5 Fusion is catalyzed by a viral protein that is specific to each virus family and which typically has a N-terminal receptor-binding subunit (RbSu) and C-terminal fusion subunit (FsSu). The RbSu binds to specific (to the virus) molecules in a target cell membrane, followed by separation of the RbSu from the FsSu, and then catalysis of membrane fusion by the FsSu. The FsSu is typically a monotopic integral membrane protein of the virus with a substantial N-terminal ectodomain (Ed) outside the virus. HIV, influenza, and coronaviruses all have “class I” fusion proteins for which the Ed’s of three FsSu’s form a complex with three RbSu’s.1 After receptor-binding and RbSu separation, there is substantial structural change of much of the three FsSu Ed’s to a thermostable trimer-of-hairpins structure. The N-terminal region of the FsSu Ed is not part of the hairpin and a ~25-residue segment in this region is called the “fusion peptide” (fp) and is thought to bind the target membrane during fusion (Fig. 1A, E).6 The fp segment is typically a conserved sequence with apolar residues and defined structure in detergent and/or membrane, and exhibits mutations that disrupt FsSu-mediated fusion.4,5,7-21 For the HIV glycoprotein (GP) 41 kDa and influenza hemagglutinin (HA) subunit 2 FsSu’s, the consensus fp’s are at the N-termini of the respective FsSu’s, with GPfp and HAfp sequences presented in Fig. 2B.
Figure 1.

Fusion mechanism model. Panels A-D display membrane states during fusion. In the absence of fusion subunit protein, calculations suggest that ~25 kcal/mole energy is required to closely-appose two membranes and that there are ~10 kcal/mole barriers to formation of each of the three subsequent states. The membrane apposition energy may be reduced by the thermostable hairpin structure of the soluble ectodomain of the viral fusion protein subunit in conjunction with the fusion peptide bound to the target membrane and the transmembrane domain in the viral membrane (panel E). Both monomer and trimer forms of the hairpin have been reported and the trimer would have three fusion peptides and three transmembrane domains. The barrier for the apposed membranes → stalk step (A →B) may be reduced by perturbation of the acyl chains of the target membrane lipids near the fusion peptide. Panel F shows a schematic model of one type of perturbation that is suggested by molecular dynamics simulations of membrane with monomer HAfp. These simulations show larger motional amplitudes and higher probability of protrusion, i.e. location of the lipid acyl chain closer to the aqueous phase. The HAfp in panel F is represented as the semi-closed helical hairpin structure located in the outer leaflet of the target cell membrane with some hydrophobic sidechains in the membrane interior and some polar sidechains in the aqueous phase.
Figure 2.

Panel A displays the chemical structure of DMPC-d54 lipid with D ≡ 2H. Panel B displays sequences and structural models of GPfp and HAfp based on data for peptide without the rest of the protein. A few residues are identified in the models. One strand of a GPfp intermolecular antiparallel β sheet is displayed. The sheets have distributions of adjacent strand registries that include the residue 1→16/16→1 and 1→17/17→1 registries. HAfp is a monomeric helical hairpin with populations of closed and semi-closed structures. The closed structure is based on PDB 2KXA.
The present study is an investigation of the effects of GPfp and HAfp on lipid acyl chain motion via measurement of 2H NMR transverse relaxation rates (R2’s) of dimyristoylphosphatidylcholine lipid with perdeuterated acyl chains (DMPC-d54, Fig. 2A). The R2 has the greatest contribution from “slow” motions which have significant spectral density at frequencies <100 kHz.22-26 The R2 depends both on the mean-squared variation of the 2H quadrupolar NMR frequency due to slow motions and the spectral density in the low-frequency regime. The temperature-dependence of R2 is interesting because lowering temperature has countervailing effects of decreasing amplitudes and increasing the spectral density of slow-frequency motions. The samples of this study contain membrane with only DMPC-d54, in part to take advantage of defined but different predominant structures for GPfp and HAfp in this single lipid (Fig. 2B).27 GPfp is an oligomer and adopts intermolecular antiparallel β sheet structure whereas HAfp is a monomer and adopts monomer α helical hairpin structures.12,14,18 The number of GPfp in an oligomer is likely fairly small, e.g. <20.21 Other structures are adopted by GPfp and HAfp when they are bound to environments other than DMPC. For example, GPfp adopts predominant monomer α helical structure in detergent-rich media whereas in membrane with 30 mole% cholesterol, HAfp adopts predominant oligomeric β sheet structure.11,28-30 The use of single-component DMPC-d54 membrane in the present study allows comparison of the effects on lipid of the two non-homologous GPfp and HAfp sequences as well as the different intermolecular β and monomer α structures with the goal of discerning fp effects on membrane that are more universal. There is also evidence that the GPfp and HAfp structures are retained for the fp’s in much larger constructs that include the Ed hairpin.16,17,31-33
Samples with GPfp are prepared at neutral pH which matches the pH of HIV/cell fusion, whereas samples with HAfp are prepared at both pH 5 and pH 7.34-36 Fusion of influenza virus happens within late endosomes for which pH ≈ 5.1 The GPfp with oligomeric β structure induces substantial vesicle fusion at pH 7 whereas HAfp with helical hairpin structure induces higher vesicle fusion at pH 5 vs. 7, which also matches the pH dependence of vesicle fusion by large HA2 constructs that include HAfp.18,20,37,38 Several groups have investigated the basis for why HAfp is more “fusogenic” at pH 5 vs. 7, but there isn’t yet a consensus on the mechanism for the pH difference.18,39-42 It has been shown that HAfp in membrane adopts two variants of helical hairpin structure, closed and semi-closed (Fig. 2B), and there is larger semi-closed fraction at pH 5 vs. 7.15,18
Fig. 1 displays one model of the fusion mechanism that illustrates potential contributions of the fp to fusion. In the absence of FsSu, there is ~25 kcal/mole calculated barrier to the membrane apposition step which precedes fusion (Fig. 1A ,E).2 This barrier could be reduced by fp binding to the target membrane in conjunction with the thermostable hairpin structure of the C-terminal Ed region of the FsSu.20,38,43,44 The barrier could be further lowered by membrane dehydration induced by fp.45 Apposition is followed by “stalk” and then “hemifusion diaphragm” intermediates which are respectively contiguous with the outer and inner leaflets of the two fusing bodies (Fig. 1B, C).2,4,34,46 Small pores are formed and at least one pore expands so that the diaphragm is eliminated and there is a single contiguous membrane and compete mixing of contents of the two bodies (Fig. 1D). In the absence of FsSu, there are ~10 kcal/mole calculated barriers between the apposition → stalk, stalk → hemifusion, and hemifusion → fusion pore structures.2 The barriers exist in part because lipids have to move through transient configurations with energies higher than those of a typical membrane bilayer, e.g. moving a small group of lipids through water to form a new leaflet in a new bilayer. One way the membrane-bound fp could reduce these barriers is by increasing amplitudes of lipid thermal motions with accompanying larger populations of configurations that are closer to those of the transition-state geometries. There are both data that support increased motional amplitudes with fp and data that support decreased amplitudes, so the fp effect on lipid motions remains unresolved.
Experimental support for increased amplitudes includes narrower 2H NMR spectra for DMPC-d54 with vs. without fp.27 Spectra were also obtained over a range of temperatures that spanned the liquid-crystalline and gel phases of the lipid, and relative to without fp, comparable spectral lineshapes and linewidths with fp were obtained at 10-20 °C lower temperature. These effects were observed with HAfp at pH 5 or with GPfp at pH 7 which respectively adopt monomeric helical hairpin or oligomeric β sheet structure (Fig. 2B). By contrast, there were comparable lineshapes and linewidths for no peptide and HAfp at pH 7, where less fusion is induced. The frequency differences between “horns” in the liquid-crystalline spectra are proportional to the order parameters Sn = ⟨(3 cos2θn − 1)/2⟩, with 0 ≤ Sn ≤ 1 where n is the index for a particular acyl chain carbon, θn is the angle between the Cn-2H bond and the NMR magnetic field, and ⟨…⟩ is the average over “fast” motions whose frequencies are >100 kHz.26 At 35 °C and 1:25 peptide:lipid ratio, the order parameters for GPfp and HAfp, pH 5 are respectively ~15 and ~8% narrower/smaller than no peptide and for HAfp, pH 7, ~4% broader/larger. At 1:50 ratio, the magnitudes of the changes are smaller, i.e. the spectra with peptide become more similar to no peptide. Larger-amplitude lipid motions are also observed in several molecular dynamics simulations for membrane with monomer HAfp, with highest amplitudes for lipids close to a HAfp.47-49 There is semi-quantitative agreement between the NMR- and simulation- derived reductions in order parameters for lipid with HAfp, pH 5, and also agreement between NMR- and X-ray ray scattering- derived reductions for lipid with GPfp.27,47-50 For the simulations, the increased motions result in acyl chain protrusion into the aqueous phase and headgroup intrusion into the hydrocarbon interior of the bilayer, i.e. a partial rotation of the lipid molecule that is along the reaction coordinate between topologically-distinct fusion intermediates.4,47-49,51 In the present study, these simulation and other data are used to interpret large differences in experimental 2H NMR R2’s of lipid with vs. without fp, with resulting improved understanding of the fp contribution to membrane fusion.
Materials and Methods
Materials.
GPfp has sequence AVGIGALFLGFLGAAGSTMGARSWKKKKKKG and HAfp has sequence GLFGAIAGFIEGGWTGMIDGWYGGGKKKKG, and the underlined residues are respectively the N-terminal residues of the HIV gp41 and the influenza virus HA2 proteins. The GPfp sequence is from the LAV-1 laboratory strain of HIV and the HAfp sequence is a H1 serotype. The C-terminal, non-underlined residues are non-native. The G and K residues increase aqueous solubility and the W in GPfp is a 280 nm absorption chromophore. Synthesis and purification have been previously described.27 DMPC-d54 lipid was purchased from Avanti Polar Lipids (Alabaster, Al). Buffers were 10 mM HEPES and 5 mM MES adjusted to either pH 5.0, 7.0, or 7.4, and contained 0.01% sodium azide as preservative.
NMR sample preparation.
The sample preparation has been previously described and reliably results in HAfp with helical hairpin and GPfp with β sheet structures.27 Briefly, the “no peptide” lipid film was prepared by dissolving dry DMPC-d54 in chloroform:methanol (9:1), followed by solvent removal with nitrogen gas and overnight vacuum. The film was suspended in water, subjected to multiple freeze/thaw cycles, and extruded through a 100 nm diameter polycarbonate filter to form large unilamellar vesicles (LUVs). The LUV suspension was ultracentrifuged and the pellet was harvested, lyophilized, transferred to a 4 mm diameter NMR rotor, and hydrated with ~20 μL of water. Samples with peptide were typically prepared with 1:25 peptide:DMPC-d54 molar ratio. For HAfp samples, DMPC-d54 LUV’s were prepared in buffer at either pH 5.0 or pH 7.0 and subjected to dropwise addition of a HAfp solution while maintaining pH. The HAfp + LUV suspension was then treated similarly to the no peptide except that hydration was done with buffer that maintained the pH of the sample. Preparation of GPfp and DMPC-d54 began with co-dissolution in 2,2,2-trifluoroethanol:chloroform:1,1,1,3,3,3-hexafluoroisopropanol (2:3:2) followed by solvent removal with by nitrogen gas and overnight vacuum. The peptide + lipid film was treated similarly to the no peptide film except that there wasn’t extrusion and buffer at pH 7.4 was used.
NMR spectroscopy and data analysis.
2H NMR spectra were acquired on a 9.4 T Infinity Plus spectrometer using a probe equipped for 4 mm diameter rotors. Nitrogen gas at defined temperature was flowed around the sample for ~1 h prior to data acquisition and spectra were then obtained with TN2 between 35 and 0 °C, which brackets the ~20 °C and ~10 °C temperatures of the respective Lα→Pβ′ transition and Pβ′→Lβ′ phase transitions of hydrated DMPC-d54, with Lα ≡ liquid-crystalline, Pβ′ ≡ rippled gel, and Lβ′ ≡ gel phase.52 2H NMR spectra were acquired without spinning and with the solid-echo pulse sequence (π/2)x − τa − (π/2)y − τb – acquire. Typical parameters included 61.5 MHz transmitter frequency, 1.6 μs π/2 pulse (calibrated with 2H2O), dwell time = 2 μs, recycle delay = 1 s, and acquisition of a few hundred to a few thousand scans. Data processing included removal of the first 11 points ≡ 22 μs so that the initial time is the peak echo, as well as exponential line broadening, Fourier transformation, phasing, and dc offset correction. For each sample at a particular temperature, data were acquired for an array of τa,k and τb,k values with typical τa,k = 30 μs + (k × Δτ/2), τb,k = 11 μs + (k × Δτ/2), and k = 0, 1, 2, … kmax. The NMR signal decay includes terms with exp(−R2 × τk) dependence where τk = 63 μs + (k × Δτ). The Δτ and kmax values were selected to allow accurate determination of the R2’s.
Each processed spectrum contained a central region that had contributions from the narrower −C2H3 powder pattern and the broader −C2H2 powder patterns, and also outlying regions that only had contributions from the −C2H2 powder patterns (Fig. S1). For each set of spectra of a sample at one temperature, the integrated −C2H3 intensity (ICD3) was typically calculated using the difference between integration over the central spectral region with −C2H3 and −C2H2 contributions and integration over nearby ranges that only contained −C2H2 contributions, i.e. ICD3 = −ν1ʃν1I(ν)dν − ν2ʃν3I(ν)dν + −ν2ʃ−ν3I(ν)dν, with ∣ν1∣ = ∣(ν3 − ν2)∣. Integration over the full −C2H3 spectral width for −ν1ʃν1I(ν)dν was achieved with ν1 ≈ ΔνCD3 where ΔνCD3 is the frequency difference between the prominent innermost “horns” of a spectrum that correspond to the most likely θ = 90° orientation of the −C2H3 group with respect to the NMR field (Figs. 3A and S1).26 The ICD2,inner was calculated by integration over the (ν2 → ν3) + (−ν2 → −ν3) regions and ICD2,outer was calculated by integration over symmetric frequency ranges in the more outlying regions of the spectrum. The specific frequency values for the integration ranges varied with sample and temperature because the spectral lineshapes and linewidths strongly depended on sample and temperature (Fig. S1).
Figure 3.
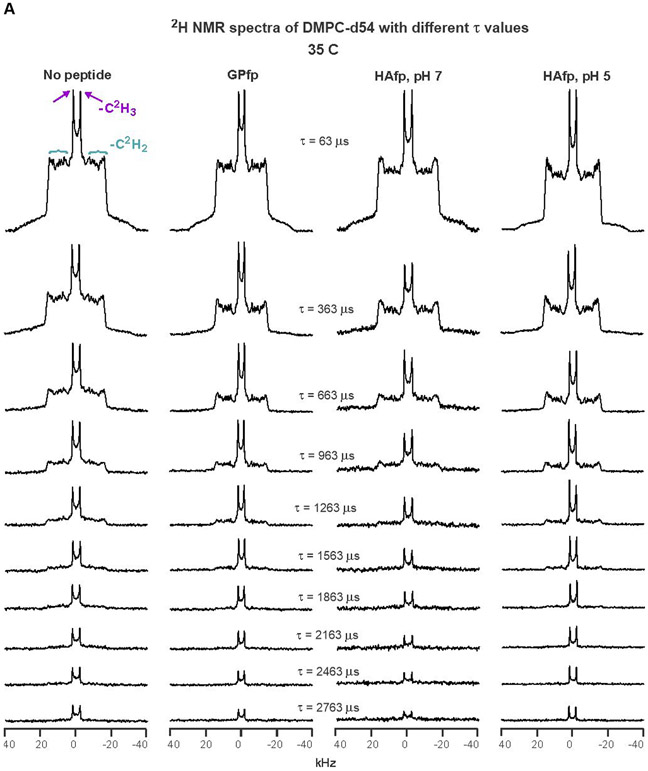
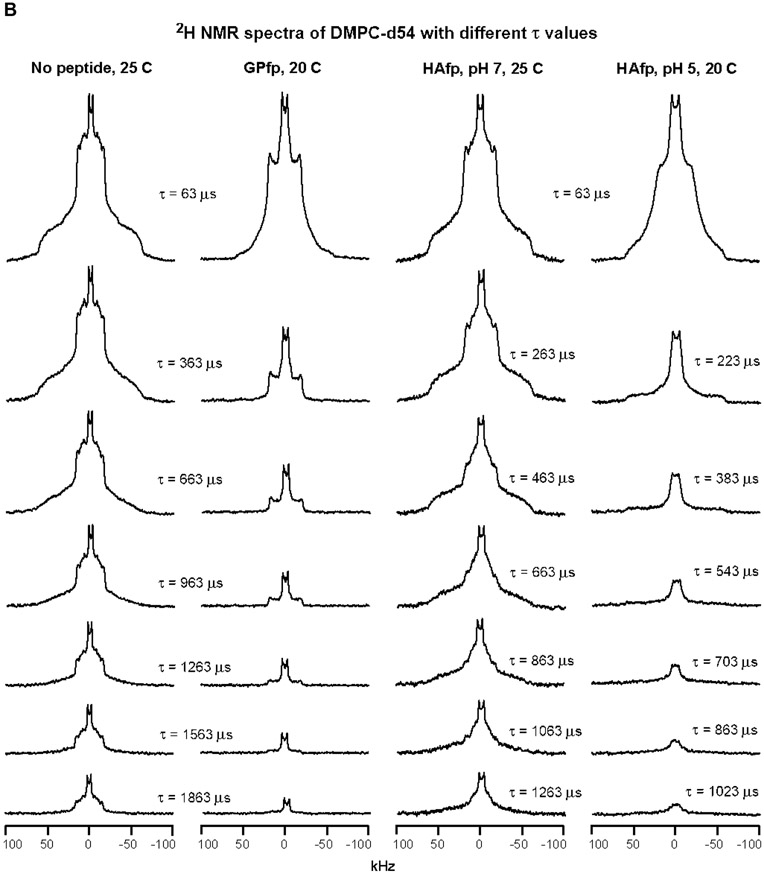
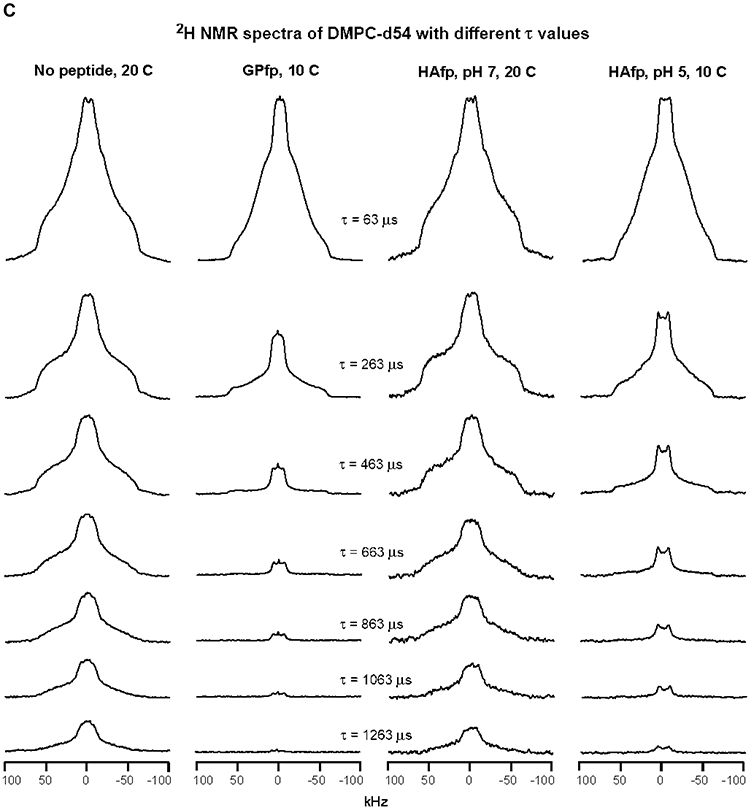
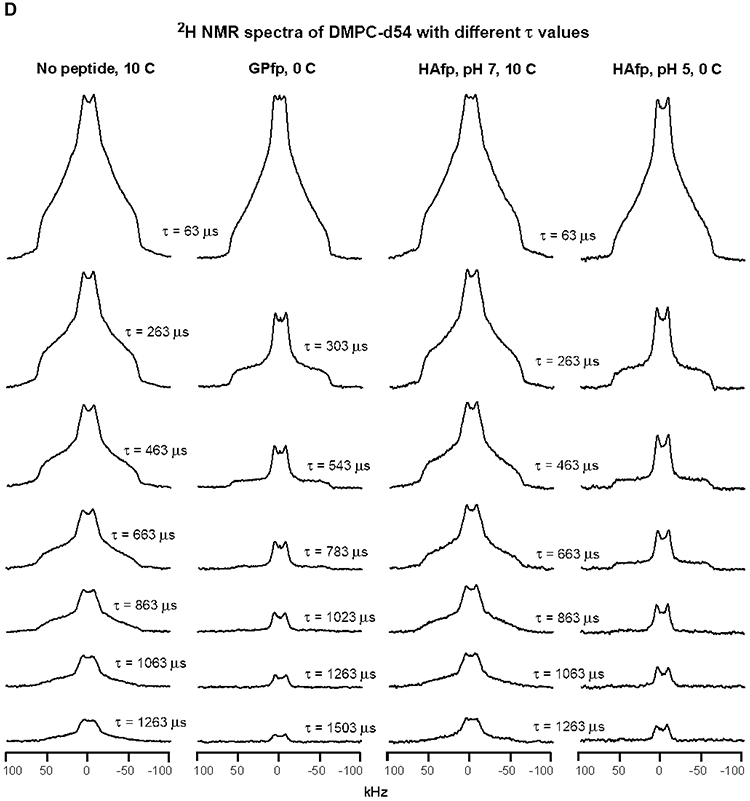
2H NMR spectra of samples with DMPC-d54 at different temperatures and different relaxation times ≡ τ. The pulse sequence is the solid-echo sequence π/2 − τa − π/2 − τb - acquisition so that τ = τa + τb + 22 μs. Each sample contained either DMPC-d54 without peptide (left columns) or DMPC-d54 with peptide and peptide:DMPC-d54 = 1:25 molar ratio (right columns). For each of the A-D panels, the displayed spectra have similar lineshapes for the shortest-time τ = 63 μs spectra. This similarity indicates similar order parameters of the four samples and similar amplitudes of motions with frequencies >100 kHz. For the same column within a panel, each spectrum is the sum of the same number of scans, where 500 is a typical number. For the same column within a panel, each spectrum is processed with the same exponential line broadening, and the typical broadening is 100 Hz for panel A, 500 Hz for panel B, and 1000 Hz for panels C and D. The −C2H3 “horns” and −C2H2 horn regions are identified for the 35 °C no peptide spectrum at shortest τ, where the horns are peaks corresponding to the most probable θ = 90° orientation with respect to the NMR field.
Separate relaxation analyses were done for the ICD2,inner, ICD2,outer, and ICD3 integrated intensities from an array of τk ≡ τ values. For most datasets, the plot of ln[I(τ)] vs. τ fit well to a straight line and R2 ≡ best-fit slope. For the ICD2 datasets of GPfp and HAfp, pH 5 at 20 °C, the ln[I(τ)] plot was non-linear. These data fit well to a sum of two rate processes, i.e. I(τ) = [Af × exp(−R2,f × τ)] + [As × exp(−R2,s × τ)] with f ≡ fast, s ≡ slow, R2,f and R2,s as rates, and Af and As as the ratio of contributions to the signal intensity when τ = 0 with Af + As = 1.
Results
Fig. 3 displays DMPC-d54 spectra as a function of τ for some temperatures and Fig. S1 displays spectra for the shortest τ for all temperatures. The preparation of a sample and the NMR data acquisition for the sample were typically done within the same month-long time period. Fig. 3A displays spectra of the four samples at 35 °C. The DMPC-d54 is in the liquid-crystalline phase, as evidenced by the maximal spectral width <40 kHz and the sharp symmetric pairs of “horns” that correspond to θ = 90° signals from the −C2H3 or specific −Cn2H2 groups along the myristoyl chains, with n = 2, 3, … 13 (headgroup to methyl group). The individual DMPC-d54 molecules are rotating rapidly about the bilayer normal direction and θ approximately corresponds to the angle between the local bilayer normal and the NMR field direction. The most prominent pair of horns with smallest frequency separation Δν are assigned to the −C2H3 group (n=14) and pairs with increasing Δν are assigned to −Cn2H2 with monotonically-decreasing n, with the outermost pair assigned to n = 2→6.27 Overall, there are narrower spectra and smaller order parameters for the GPfp and HAfp, pH 5 vs. no peptide and HAfp, pH 7 samples.
The intensities of the Fig. 3A 35 °C spectra of the four samples exhibit similar decays with increasing τ which supports similar R2 values for all samples. There is also slower decay with increasing τ of the central vs. outer spectral regions that respectively contain −C2H3 + −C2H2 vs. only −C2H2 signals. These visual observations are borne out in the fittings of ln[I(τ)] vs. τ, with similar R2CD3’s of the four samples, similar R2CD2’s of the four samples, and R2CD2/R2CD3 ratios in the 2.7 – 3.0 range (Table 1 and Fig. S1). For a particular sample, the R2CD2’s are similar for integrations in the outer and inner −C2H2 horn regions, where the former is dominated by −C2H2 closer to the headgroup and the latter has significant contributions from −C2H2 close to the methyl group (Fig. S1). The Discussion section provides a more detailed description of the R2’s for the different samples and integration ranges. For HAfp, pH 7, there are similar R2’s determined from NMR data from a different sample with peptide:lipid = 1:50 (Fig. S2). There was higher signal-to-noise for this sample so that R2CD2 was also determined from integration in the outermost region of the spectra that is dominated by θ close to 0°, i.e. local bilayer normal parallel to the NMR field. The R2CD2(0°)/R2CD2(90°) ≈ 1.5 may reflect larger variations in the quadrupolar frequency for 0° vs. 90° for equivalent amplitude acyl chain motion because of the (3 cos2θ − 1) dependence of this frequency.
Table 1.
2H NMR transverse relaxation rates of DMPC-d54 (s−1)a
| Peptide | ||||||||
|---|---|---|---|---|---|---|---|---|
| T (°C) | No peptide | GPfp | HAfp pH 7 | HAfp pH 5 | ||||
| −C2H2 | −C2H3 | −C2H2 | −C2H3 | −C2H2 | −C2H3 | −C2H2 | −C2H3 | |
| 35 | 951(6) | 313(9) | 1147(7) | 392(5) | 1290(15) | 477(13) | 1110(11) | 407(8) |
| 30 | 950(9) | 334(8) | 1096(10) | 407(4) | 1518(35) | 512(34) | 1255(12) | 413(12) |
| 25 | 1078(23) | 316(9) | 1025(20) | 418(4) | 2116(53) | 609(25) | 1864(27) | 516(8) |
| 20 | 1878(33) | 1009(15) |
R2,f = 9480(918) s−1 Af = 0.660(16) R2,s = 1782(59) s−1 As = 0.340(19) |
928(32) | 1935(40) | 1177(29) |
R2,f = 14088(374) s−1 Af = 0.965(17) R2,s = 876(163) s−1 As = 0.035(4) |
2745(92) |
| 10 | 2136(22) | 1194(20) | 7030(127) | 2980(80) | 2068(15) | 1085(26) | 4347(131) | 2505(106) |
| 0 | 2994(64) | 1548(25) | 4078(141) | 1736(68) | 2772(64) | 1710(28) | 4286(118) | 1409(42) |
Samples are DMPC-d54 without peptide or with peptide at peptide:DMPC-d54 = 1:25 molar ratio. A relaxation rate is derived from fitting of integrated intensities (I) vs. relaxation time (τ). For −C2H2, the intensities are sums for symmetric frequency ranges around 0 kHz, with typical values (15 → 25) + (−15 → −25) kHz. For −C2H3, the intensities are the difference between integration over the central spectral region with −C2H3 and −C2H2 contributions and integration over nearby ranges that only contain −C2H2 contributions, with typical integration frequency ranges of (5 → −5) − [(10 → 15) + (−10 → −15)] kHz. The −C2H2 rates are typically for the most intense region of the −C2H2 spectrum that does not overlap with the −C2H3 signals. Figure S1 lists the frequency ranges for each fitting, fittings for other ranges, and displays spectra at smallest τ. For most data, the R2 relaxation rate was determined from fitting of ln(I) = ln(I0) − (R2 × τ) where ln(I0) and R2 are fitting parameters. For the −C2H2 GPfp and HAfp, pH 5 data at 20 C, the fitting was based I = [Af × exp(−R2,f × τ)] + [As × exp(−R2,s × τ)] with f ≡ fast, s ≡ slow, and R2,f, R2,s, Af, and As as fitting parameters with Af + As = 1. Each best-fit parameter is followed by the fitting uncertainty in parentheses.
The trends observed for the 35 °C spectra are also generally observed for the 30 and 25 °C spectra, including R2CD2/R2CD3 ≈ 2.4-3.6 and similar values of R2CD2 for −C2H2 either closer to the headgroup or closer to the methyl group (Table 1 and Fig. S1). At 25 °C, the no peptide and HAfp, pH 7 spectra have a broader background signal that is likely a gel phase, but this signal is subtracted during calculation of I(τ) and the reported R2’s are for the liquid-crystalline phase in the most intense region (~20 → −20 kHz).
Relative to 25 °C, the no peptide and HAfp, pH 7 spectra are broader at 20 °C and consistent with a gel phase for which the acyl chains are much more ordered than the liquid-crystalline phase (Figs. 3B, C and S1). There is additional broadening when the temperature is reduced to 10 and then 0 °C which correlate with increased ordering (Figs. 3D and S1). At 20 °C, the GPfp and HAfp, pH 5 spectra have some of the horn features of the liquid-crystalline phase and their lineshapes and linewidths are intermediate between those of the 25 and 20 °C spectra of no peptide and HAfp, pH 7 (Fig. 3B). At 10 °C, the GPfp and HAfp, pH 5 spectra are broader and no longer have horn features, and at 0 °C are even broader and resemble the no peptide and HAfp, pH 7 spectra at 10 or 20 °C (Fig. 3C, D).
Fig. 3 displays the effect of increasing τ on spectral intensity, and each panel shows comparison between samples with similar spectral lineshapes and linewidths that reflect similar amplitudes of fast-motion of the acyl chains. Fig. 3A displays the 35 °C data, as discussed above, and Fig. 3B displays the 25 °C data for no peptide and HAfp, pH 7, and 20 °C data for GPfp and HAfp, pH 5. Visual comparison is straightforward between the no peptide and GPfp spectra in Fig. 3B because they were acquired with the same array of τ values. There is much more rapid decay of the intensities of the GPfp vs. no peptide spectra. There is even more striking difference between the very rapid decay for HAfp, pH 5 vs. the much slower decay for HAfp, pH 7 (note that the Δτ is smaller for HAfp, pH 5 vs. 7). Fig. 3C displays 20 °C data for no peptide and HAfp, pH 7, and 10 °C data for GPfp and HAfp, pH 5. Direct comparison can be made between all spectra because they were acquired with the same array of τ values. There are similar slower decays of intensities of no peptide and HAfp, pH 7 vs. more rapid decay of HAfp, pH 5 and even faster decay for GPfp. Similar trends are observed in Fig. 3D which displays comparative 10 °C data for no peptide and HAfp, pH 7, and 0 °C data for GPfp and HAfp, pH 5.
Fig. 4A displays fittings of −C2H2 intensities measured from the Fig. 3B spectra. For no peptide and HAfp, pH 7 at 25 °C, plots of ln[ICD2] vs. τ were linear and R2CD2 was the best-fit slope. For GPfp and HAfp, pH 5 at 20 °C, plots of ln[ICD2] vs. τ exhibited more rapid decay and were non-linear, and ICD2 vs. τ was fitted to a sum of fast and slow exponential decays. Fig. 4B displays fittings of ln[ICD2] vs. τ based on the Fig. 3C spectra, which show the more rapid decays and larger R2CD2’s of GPfp and HAfp, pH 5 vs. no peptide and HAfp, pH 7. Fig. 4C displays fittings of ln[ICD3] vs. τ based on the Fig. 3B, C spectra. There are more rapid decays and larger R2CD3’s of GPfp and HAfp, pH 5 vs. no peptide and HAfp, pH 7. The R2CD2 and R2CD3 values are presented numerically with uncertainties in Table 1 and displayed visually as bar plots in Fig. 5A, B. The −C2H2 rates are typically for the most intense region of the −C2H2 spectrum that does not overlap with the −C2H3 signals. Fig. S1 displays spectra at shortest τ as well as all integration regions and R2 values for the four samples. Fig. S2 displays spectra and R2’s from a second HAfp, pH 7 sample with peptide:lipid = 1:50. For a given temperature and functional group, the R2’s of the two samples typically agree within 15%.
Figure 4.


Fittings of 2H NMR spectral intensity (I) vs. relaxation time (τ) to determine R2’s ≡ transverse relaxation rates. Plots and fittings are for: (A) −C2H2 data of no peptide and HAfp, pH 7 at 25 °C and of GPfp and HAfp, pH 5 at 20 °C; (B) −C2H2 data of no peptide and HAfp, pH 7 at 20 °C and of GPfp and HAfp, pH 5 at 10 °C; and (C) −C2H3 data. The data are black squares and are based on integrated intensities from spectra displayed in: (A) Fig. 3B; (B) Fig. 3C; and (C) Fig. 3B and C. The best-fits are displayed in red. The fittings in panels A and B are grouped together because of similar lineshapes and linewidths of the respective Fig. 3B and C spectra. Most data are fitted to ln(I) = ln(I0) − (R2 × τ) where ln(I0) and R2 ≡ transverse relaxation rate are fitting parameters. For the GPfp and HAfp, pH 5 −C2H2 data at 20 C, the fitting is based on I = [Af × exp(−R2,f × τ)] + [As × exp(−R2,s × τ)] where Af, R2,f, As, and R2,s are fitting parameters. Best-fit parameters with uncertainties are also displayed in Table 1, and Fig. S1 has the integration windows that were used to determine the intensities that are fitted.
Figure 5.

Bar plots of temperature-dependent transverse relaxation rates (R2) and differences in rates (ΔR2). Panels A and B display R2’s for −C2H2 and −C2H3, respectively, and panels C and D display ΔR2’s for −C2H2 and −C2H3, respectively, where ΔR2 = R2,peptide − R2,no peptide. The R2’s are for DMPC-d54 without peptide and with peptide:DMPC-d54 molar ratio = 1:25. The R2 values and their uncertainties are numerically presented in Table 1 with additional rate analyses in Figs. S1 and S2. The −C2H2 R2’s are typically for the most intense region of the −C2H2 spectrum that does not overlap with the −C2H3 signals. For −C2H2 of GPfp and HAfp, pH 5 at 20 °C, the R2’s are for the dominant fast components of the bi-exponential decays. At 35, 30, and 25 °C, each ΔR2 is calculated using R2,peptide and R2,no peptide at the given temperature, based on predominant liquid-crystalline phase at these temperatures. At 20, 10, and 0 °C, each ΔR2 for HAfp, pH 7 is also the difference between R2’s at the given temperature, based on a predominant gel phase and on similar spectral lineshapes and linewidths at each temperature (Figs. 3C, D and S1). At 20, 10, and 0 °C, each ΔR2 for GPfp and HAfp, pH 5 is calculated using the R2,no peptide at 25, 20, and 10 °C, respectively. This is based on similar spectral lineshapes and linewidths and therefore similar phases and amplitudes of fast-motions of the peptide and no peptide samples (Fig. 3B, C, and D).
Fig. 5C, D displays bar plots of ΔR2 = R2,peptide − R2,no peptide for the −CD2 and −CD3 groups. The R2,peptide’s are for peptide:lipid = 1:25. At 35, 30, and 25 °C, each ΔR2 is calculated using R2,peptide and R2,no peptide at the given temperature, based on predominant liquid-crystalline phase at these temperatures. At 20, 10, and 0 °C, each ΔR2 for HAfp, pH 7 is also the difference between R2’s at the given temperature, based on predominant gel phase and on similar spectral lineshapes and linewidths at each temperature (Figs. 3 and S1). At 20, 10, and 0 °C, each ΔR2 for GPfp and HAfp, pH 5 is calculated using the R2,no peptide at 25, 20, and 10 °C, respectively. This is based on similar spectral lineshapes and linewidths and therefore similar phases and amplitudes of fast-motions of the peptide and no peptide samples (Fig. 3).
Discussion
1. Summary of experimental results including distinctive temperature dependence of R2 of GPfp and HAfp, pH 5.
The present study reports the 2H NMR transverse relaxation rates of the acyl chains of DMPC-d54 membrane as functions of bound fp and temperature. At 35, 30, and 25 °C, the spectral lineshapes of all samples are consistent with membrane with a predominant liquid-crystalline phase. At 20, 10, and 0 °C, the lineshapes of the no peptide and HAfp, pH 7 are consistent with a gel phase whereas at 20 °C, those of GPfp and HAfp, pH 5 are intermediate between the two phases and have some of the “horn” features of liquid-crystalline spectra, and at 10 and 0 °C resemble the lineshapes of no peptide and HAfp, pH 7 at 20 °C. As shown in Fig. 5C, D, ΔR2 = R2,peptide − R2,no peptide are separated in three groups: (1) for all peptides in liquid-crystalline lipid (35, 30, and 25 °C), the typical ΔR2 > 0 and increases with lower temperature with values up to ~103 Hz for −CD2 and ~3 × 10² Hz for −CD3; (2) for HAfp, pH 7 in a gel phase (20, 10, and 0 °C), ΔR2 ≈ 0; and (3) for GPfp and HAfp, pH 5 at 20, 10, and 0 °C, ΔR2 > 0, and exhibits a large increase and then decrease as temperature is lowered with maximum ΔR2 ≈ 104 Hz for −CD2 and 2 × 10³ Hz for −CD3.
Earlier studies have shown that acyl chain 2H’s of pure DMPC and other lipids exhibit an increase and decrease in R2 in a ~5 °C interval near the liquid-crystalline to rippled-gel phase transition.53,54 This was not observed in our no peptide data, probably because the temperature was changed in larger increments. Earlier studies of deuterated DMPC or other lipid + peptide/protein have typically shown a smaller peak in 2H R2 near the phase-transition temperature.55-57 Examples of the peptide/protein include gramicidin, a bacterial ion channel, and lung surfactant proteins that function to reduce the surface tension at the air-water interface in lung alveoli. By contrast, for the present study, GPfp and HAfp, pH 5 exhibit large R2’s at 20, 10, and 0 °C with highest value typically at 20 or 10 °C (Fig. 5A, B). HAfp, pH 7 shows a small increase in R2 in the 20 to 0 °C range, similar to no peptide. The GPfp sample was prepared at neutral pH at which GPfp has been shown to induce vesicle fusion, whereas HAfp induces greater fusion at pH 5 vs. 7.
2. ΔR2 > 0 in the liquid-crystalline phase is consistent with longer correlation time with peptide.
For the liquid-crystalline phase, the larger 2H R2’s with bound fp correlate with earlier observation at 35 °C of ~2× larger 31P R2 of membrane with bound GPfp.58 The 2H R2 has contributions from the motional spectral densities (J) at 0, ω0, and 2ω0 frequencies, where ω0 is 2π times the 2H NMR Larmor frequency = 61 MHz.22 The J(ω0) and J(2ω0) contributions are small based on previously-reported 2H NMR longitudinal relaxation rates (R1’s) of similar samples at 35 °C.58 The R1’s are ~100× smaller than the respective R2’s and are a reasonable estimate of the J(ω0) and J(2ω0) contributions to R2.22,23 A reasonable estimate of the major J(0) contribution to R2 for a specific type of motion is ΔM2 × τc where ΔM2 is the mean-squared amplitude of the NMR frequency fluctuations associated with the motion and τc ≈ J(0)/2 is the correlation time of the motion, e.g. for angular motion, the typical time to move 1 radian.23,59 This R2 estimate is valid for “fast motion” for which ΔM2 × τc2 << 1. For deuterated lipid acyl chains, the 2H ΔM2 ≈ (4 × 10¹⁰s−2) × (1 − S2) where S is the order parameter for the motion.22 Smaller S correlates with larger-amplitude motion and therefore larger ΔM2, i.e. greater fluctuations in NMR frequency experienced by the 2H nuclei. This ΔM2 estimation is based on large-jump motion and for continuous small jumps, ΔM2 may be smaller for a given order parameter.59 For the temperature range of the present study, the literature values of τc for typical lipid chain motions are <10−6 s so that the fast motion condition is valid.54,60
For the liquid-crystalline phase, acyl chain fluctuations perpendicular to the bilayer normal have the largest τc and are likely the biggest contributor to J(0) and R2.60 For liquid-crystalline DMPC-d54, the typical S ≈ 0.2 for −CD2 groups so that ΔM2 ≈ 4 × 10¹⁰s−2.27 Our typical experimental R2 ≈ 103 Hz in this phase, so the calculated τc ≈ 2 × 10⁻⁸s−1, which matches literature values of τc for chain fluctuations and supports these fluctuations as the dominant motion underlying R2.60 For any fp sample in this phase, the typical ΔR2 > 0 (Fig. 5C, D). Relative to without peptide, there is a literature report of ~3× larger τc with 6 mole% integral membrane peptide that probably reflects peptide-associated disruption of large-amplitude chain motion.54 There is probably similar increase in τc for fp samples and this increase is likely the basis for the ΔR2 > 0. The typically larger ΔR2 for HAfp vs. GPfp may be due to smaller separation between HAfp monomers vs. GPfp oligomers and consequent greater probability of close contact between lipid and peptide. This difference is described more quantitatively by comparison of the typical lipid diffusion distance ≡ dL vs. average separation between peptides ≡ dHAfp or dGPfp. The dL ≈ 60 Å based on dL ≈ (4 × D × τD)½ with lateral diffusion constant D ≈ 108 Å2-s−1 and diffusion time τD ≈ 10−5 s, chosen to be short enough for spectral averaging.61 For a vesicle with ~100 nm diameter, the surface area ≈ 3 × 10⁶ Å2, Nlipid ≈ 6 × 10⁴, and Nfp ≈ 2 × 10³. The dHAfp ≈ 40 Å and dGPfp ≈ 120 Å (based on ~10 GPfp-per-oligomer) so that dL < dHAfp and dL > dGPfp, i.e. more lipids will contact HAfp monomers vs. GPfp oligomers.21 For the HAfp, pH 7 sample at 1:50 ratio, dHAfp ≈ 55 Å so that dL < dHAfp still holds. This correlates with R2’s for the 1:50 sample that are more similar to 1:25 HAfp than 1:25 GPfp (Figs. S1 and S2).
3. ΔR2 ≈ 0 for HAfp, pH 7 in gel phases is consistent with shorter correlation time with peptide.
At 20 °C, the spectral lineshape of DMPC-d54 without peptide is much broader than at higher temperature and is consistent with transition to a Lβ′ rippled-gel phase for which there is higher ordering of the acyl chains and reduced lateral diffusion rate.52 The R220C/R225C is ~2 for −C2H2 and ~3 for −C2H3. There is greater spectral broadening at 10 °C, and only small increase in R2’s, with R210C/R220C of ~1.1. There is further broadening at 0 °C, consistent with the transition to the Lβ phase for which the chains are fully-ordered in a trans conformation. There is also an increase in R2’s, with R20C/R210C ≈ 1.4. The increases in R2 are semi-quantitatively understood by the countervailing changes in ΔM2 and τc. For the gel phases, a typical SCD2 ≈ 0.7 so that ΔM2 ≈ 2 × 10¹⁰s−2, with increases in S and decreases in ΔM2 as temperature is lowered.22 The effect on R2 of ~2× smaller ΔM2 in a gel vs. liquid-crystalline phase is more-than-compensated by increases in τc, including ~5× and ~3× increases with transitions to rippled-gel and gel phases, respectively.60
At 20, 10, and 0 °C, the spectral lineshapes with HAfp, pH 7 are similar to those of no peptide at the same temperature and consistent with gel phases. Interestingly, for HAfp, pH 7, R220C ≈ R225C and ΔR2 ≈ 0 at 20, 10, and 0 °C (Fig. 5). These observations are semi-quantitatively explained if HAfp, pH 7 follows an earlier result for a transmembrane peptide of ~2× smaller τc with vs. without peptide in gel phases that likely reflects peptide disruption of chain ordering.54 This behavior contrasts with the earlier-described ~3× larger τc with peptide in the liquid-crystalline phase.
4. Very large ΔR2 ≈ 104 Hz for GPfp and HAfp, pH 5 at 20 °C is consistent with larger-amplitude motion for lipid closer to vs. further from peptide.
In our view, the most interesting experimental result of our study is the large R2’s for GPfp and HAfp, pH 5 over the 20 - 0 °C range with maximum ΔR2CD2 ≈ 104 Hz at 20 °C and maximum ΔR2CD3 ≈ 2 × 10³ Hz at 20 or 10 °C (Fig. 5 C, D). The large increases and then decreases in R2’s as temperature is lowered through the phase transitions are not explainable with only consideration of monotonic increases in τc as temperature is lowered. We provide a more quantitative interpretation of the R2 behavior based on a model for the large 2H R2’s near the phase separation temperature of lipid mixtures as well as the results of several molecular dynamics simulations. For the mixtures, lateral lipid diffusion between nm-size domains with different acyl chain order parameters is the proposed motion that results in large R2’s in these samples.25,62 The ΔM2 for this motion is approximately the difference in mean-squared NMR frequency fluctuations between the different domains and the τc is the characteristic time for a lipid to diffuse between the domains. The same model is applied to the present study and the “domains” are lipids closer to vs. more distant from the peptide. There is ~6 Å dimension of the peptide-proximal domain which is much smaller than the ~20 – 200 Å dimension of the lipid domains of the earlier study.
Molecular dynamics simulations from multiple groups have shown significantly larger acyl chain motion for lipids close to (<6 Å) to vs. more distant from monomeric HAfp, with −CD2 Scloser ≈ 0.1 vs. Sfurther ≈ 0.2 in the liquid-crystalline phase.47-49 The larger motion results in higher probability of protrusion of acyl chains into the aqueous phase for lipids close to HAfp which may be relevant for reducing barriers between membrane fusion intermediates (Fig. 1F). There is a ΔM2 ≈ (4 × 10¹⁰ s−2) × (S2,further − S2,closer) ≈ 109 s−2 and the diffusion τD ≈ τc ≈ (6 Å)2/4D with D ≈ 108 Å2/s so that τc ≈ 10−7 s, and the calculated ΔR2CD2 ≈ ΔM2 × τc ≈ 102 Hz. This could contribute to the experimental ΔR2CD2 of GPfp and HAfp, pH 5 which are typically in the range of 2-8 × 10² Hz.
We propose that this phenomenon also exists at 20 °C and is the basis for the large ΔR2’s. The lineshapes for GPfp and HAfp, pH 5 are intermediate between those of liquid-crystalline and rippled-gel phases, and we estimate Scloser ≈ 0.2 vs. Sfurther ≈ 0.5 so that ΔM2 ≈ 1010 s−2. The D ≈ 107 Å2/s so that for 6 Å diffusion length, τc ≈ 10−6 s and ΔR2CD2 ≈ 104 Hz, which is in semi-quantitative agreement with the experimental ΔR2’s.61 Because 1/τc < spectral width, there is spectral averaging between the two lipid locations and S values, which is consistent with the observed single lineshapes at 20 °C.
At 10 °C, the experimental ΔR2CD2’s are smaller than at 20 °C but still substantial (up to 5 × 10³ Hz). The lateral diffusion τc are larger at 10 °C, so within the present model, the ΔM2 would have to be smaller at 10 vs. 20 °C. There are similar lineshapes and linewidths of the spectra of the 10 °C peptide and the 20 °C no peptide samples where the latter is in the rippled-gel phase which has larger domains of lipids with more- and less-ordered acyl chains.52 If the 10 °C peptide sample also adopts this phase, these larger domains may diminish the distinction between lipids closer to vs. further from the peptide so that ΔM2 is reduced. At 0 °C, the experimental ΔR2CD2 ≈ 103 Hz which is a continuation of the trend of smaller ΔR2 with temperature reduction in the gel phases.
5. Similar trends and smaller ΔR2 for −CD3 vs. −CD2 support scaling of ΔM2 and the diffusion model.
The ΔR2CD3’s of the peptide samples follow the same trends as the ΔR2CD2’s but with smaller values. The ΔR2CD3’s increase as temperature is lowered in the liquid-crystalline phase with largest ΔR2CD3 ≈ 3 × 10² Hz at 25 °C. For a peptide sample at a given temperature, the typical ΔR2CD3/ΔR2CD2 ≈ 1/3 which matches the no peptide R2CD3/R2CD2 ≈ 1/3 and is a likely consequence of scaling down of the relevant ΔM2 for acyl chain fluctuations for −CD3 by rapid rotation about the symmetry axis. For GPfp and HAfp, pH 5, the −CD3 ΔR2 also exhibit the increase-then-decrease trend as temperature is further lowered and the lipid adopts gel phases. The maximum ΔR2CD3 ≈ 2 × 10³ Hz is ~1/5 the maximum ΔR2CD2. For GPfp, the largest ΔR2 is at 10 vs. 20 °C for −CD3 vs. - CD2. The −CD3 and −CD2 should experience the same lateral diffusion τc, but the −CD3 has much smaller order parameter so that lower temperature may be needed for appreciable difference in (1 − S2) and ΔM2 for lipid closer to vs. further from peptide.
6. Much larger ΔR2 for β sheet GPfp and helical hairpin HAfp, pH 5 correlates with greater hydrophobicity and fusion.
For HAfp, pH 7 at 20, 10, and 0 °C, the ΔR2 ≈ 0 for −CD2 and −CD3 groups, which is very different from GPfp and HAfp, pH 5. HAfp, pH 7 also exhibits spectral lineshapes and order parameters that are comparable to or a little broader/larger than no peptide, whereas GPfp and HAfp, pH 5 exhibit lineshapes and order parameters that are smaller than no peptide and HAfp, pH 7 (Fig. 3). Earlier NMR shows that HAfp is mixture of different helical hairpin structures at pH 5 and 7 (Fig. 2B). At pH 5, NMR data support a greater fraction of more open/”semi-closed” structure that has greater hydrophobic surface area that may be a better solvent for lipid acyl chains and allow greater probability for lipid acyl chain location outside the hydrophobic core of the membrane (Fig. 1F).18 By contrast, at pH 7, HAfp has smaller hydrophobic surface area and the chain motion may be similar for lipids closer to vs. further from HAfp, which is consistent with pH 7 order parameters similar to pure lipid.27 This similarity would result in ΔM2 ≈ 0 for diffusion, like pure lipid, so that ΔR2 ≈ 0.
There is correlation between the small effects on lipid 2H NMR lineshape and R2 of HAfp at pH 7 vs. much larger effects at pH 5 and the difference in the appearance of a vesicle suspension after addition of HAfp at pH 7 vs. 5. The vesicles are ~100 nm diameter and the suspension at either pH 7 or 5 is transparent prior to addition. After HAfp addition at pH 7, the suspension remains transparent. By contrast, addition at pH 5 results in a cloudy/turbid suspension that is the likely result of HAfp-induced vesicle fusion and consequent larger vesicles, with increased light scattering when the vesicle dimension is greater than ~300 nm.63 This observation is consistent with pH dependence of vesicle fusion by fluorescence measurement and with large pH dependence of hemolysis of erythrocytes after addition of HAfp.18,64 Cloudiness/turbidity is also apparent in vesicle suspensions after addition of GPfp and electron micrographs from earlier studies also show larger dimension vesicles after addition of GPfp.38,65,66 There is correlation between the large ΔR2’s for GPfp and HAfp, pH 5 and their fusogenicity that we ascribe to increased protrusion of lipid acyl chains into the aqueous phase. This protrusion matches the chain location for transition states between membrane fusion intermediates (Fig. 1F).
The similar spectral lineshapes of the no peptide and HAfp, pH 7 samples raises the possibility that HAfp doesn’t bind to lipid. However, there are also two lines of evidence that support near-quantitative binding of HAfp at pH 7 for our samples. First, among the peptides, HAfp, pH 7 exhibits the largest ΔR2’s in the liquid-crystalline phase (Fig. 5C, D). Second, A280 < 0.01 in the supernatant after centrifugation of the suspension containing lipid and HAfp. This second observation is independently supported by calculated [HAfpbound]/[HAfpfree] ≈ Keq × [lipid] ≈ 50, based on Keq ≈ 1 × 10⁴ M−1, the previously-reported binding constant of HAfp with lipid at pH 7, and [lipid] ≈ 5 × 10⁻³ M during our sample preparation.64
There is also the possibility that the different lineshapes and ΔR2’s for HAfp, pH 7 vs. 5 are a consequence of different HAfp locations in the membrane, e.g. interfacial vs. deeply-inserted or transmembrane. In our view, the membrane location(s) of HAfp remains an unresolved question. There are experimental data that support both interfacial and deep membrane location, and different molecular dynamics simulations also find different “equilibrium” locations that vary between interfacial and transmembrane.15,44,47,48,67-69 These differences may be a consequence of different initial conditions for HAfp structure and location. To our knowledge, only small changes in membrane location have been observed at pH 5 vs. 7.39,40 We therefore think that the large pH dependence of lipid/HAfp interaction is more likely due to a change in HAfp structural distribution and hydrophobicity, as detailed above.
7. Slow-relaxing fraction at 20 °C may be lipids that don’t contact GPfp.
Other than the −CD2 signals of GPfp and HAfp, pH 5 at 20 °C, the other data are all well-fitted by a single exponential decay and one R2. This likely means that all analyzed nuclei experience the same motions that dominate R2. These motions have the largest τc and appreciable ΔM2 with a contribution to R2 ≈ ΔM2 × τc. As discussed above, for pure lipid, the dominant motion is likely acyl chain fluctuations perpendicular to the bilayer normal. This is also the likely motion for all the peptide samples in liquid-crystalline phase at 35, 30, and 25 °C. There are similar R2’s for no peptide and HAfp, pH 7 in the gel phases at 20, 10, and 0 °C, which supports similar dominant motion for the two samples (Fig. 5A, B). At a given temperature, there are also similar spectral lineshapes for these two samples.
Fitting with a sum of fast (f) and slow (s) exponential decays was done for −CD2 analyses of GPfp and HAfp, pH 5 samples at 20 °C. Fitting parameters were populations Af and As and rates R2,f and R2,s. These R2,f’s had the largest ΔR2 ≈ 104 Hz of all fittings, and as discussed in #4 above, we ascribe the ΔR2 to lipid lateral diffusion between locations closer to vs. further from the peptide, with different order parameters for the two locations.
We first consider the GPfp analysis for which the fast:slow population ratio Af/As ≈ 2 and the R2,s is similar to the R2 of no peptide and HAfp, pH 7 at 20 °C, i.e. ΔR2,s ≈ 0. This suggests that the slow fraction is lipids that don’t contact GPfp. This hypothesis is supported by considering the model from #2 above with a vesicle with ~100 nm diameter, surface area ≈ 3 × 10⁶ Å2, Nlipid ≈ 6 × 10⁴, and NGPfp ≈ 2 × 10³. For GPfp oligomers with ~10 peptides and ~16 residues in β sheet structure, the area-per-oligomer is ~(50 Å)2 and there is ~120 Å average distance between oligomers.14 For lateral diffusion constant D ≈ 107 Å2/s and ~10−5 s diffusion time consistent with spectral averaging, there is ~20 Å diffusion distance by a lipid. There is a difference of ~30 Å between the oligomer separation (~120 Å) and the sum of the oligomer and lipid diffusion dimensions (~90 Å). This difference means there are regions of the vesicle containing lipids that don’t contact GPfp during the diffusion time. Although our ΔR2 model incorporates molecular dynamics results that show smaller order parameters for lipids closer vs. further from peptide, there are similar experimental lineshapes for the fast- and slow-relaxing lipid populations which is consistent with fast-relaxing lipids spending relatively small fractional time next to a GPfp oligomer.
The above model is also applicable to the biexponential decay fitting of the HAfp, pH 5 data at 20 °C and explains the much smaller slow population for HAfp, pH 5 with Af/As ≈ 28. HAfp is monomeric and the peptides are separated by ~40 Å, which is approximately the lipid diffusion dimension. There are negligible regions of the vesicle with lipids that don’t contact HAfp and have the associated R2,s.
Unlike −CD2, the −CD3 data for GPfp at 20 °C are well-fitted by a single exponential decay and the R2CD3 is intermediate between the R2CD3’s at 25 and 20 °C for either no peptide or HAfp, pH 7. As discussed above in #5, the −CD3 and −CD2 should experience the same diffusion τc, but the −CD3 has much smaller order parameter. At 20 °C, there may a fairly small difference in (1 − S2) for −CD3 for lipid closer to vs. further from peptide so that ΔM2CD3 and ΔR2CD3 are smaller which results in similar R2CD3’s for lipids that contact and don’t’ contact GPfp. The −CD3 data for HAfp, pH 5 at 20 °C are also well-fitted by a single exponential decay and the ΔR2CD3 ≈ 2 × 10³ Hz. The lack of a second slower decay for −CD3 is likely due to a combination of small As, smaller difference between R2,f and R2,s and smaller signals for −CD3 vs. −CD2.
At 10 and 0 °C, the GPfp and HAfp, pH 5 −CD2 and −CD3 data are well-fitted as single exponential decays, as evidenced by typical (δR2/R2) ≈ 0.03 where δR2 is the fitting uncertainty. The typical ΔR2 > 0 but is significantly smaller than the ~104 Hz values for −CD2 fitting of GPfp and HAfp, pH 5 data at 20 °C. We note that even for the −CD2 GPfp data at 20 °C with R2,f/R2,s ≈ 5, the Fig. 4A ln(ICD2) vs. time plot is reasonably linear, except for the point at shortest time. If there is a second slower decay in the 10 and 0 °C data, the R2,f/R2,s ratio would be smaller than at 20 °C and non-linearity likely wouldn’t be apparent in the single decay fitting.
8. Lipid ordering with fp with EPR and fluorescence may reflect fp-lipid label interaction.
The interpretation of the large ΔR2 for GPfp and HAfp, pH 5 in terms of large-amplitude acyl chain motions is consistent with smaller average lipid order parameters relative to no peptide and HAfp, pH 7 from 2H NMR spectra, X-ray scattering, and molecular dynamics simulations but not with larger order parameters from EPR and fluorescence spectra.19,27,41,47-50,70,71 These latter experiments share common features including membrane with a small fraction of lipid with an organic ring spin- or fluorescence- label at a particular site, and measurement of the EPR lineshape or fluorescence anisotropy of the label. Increased anisotropy for the label for membrane with fp vs. without fp is considered representative of increased order for all membrane lipids. There may be a specific interaction of fusion peptide with the EPR and fluorescence label which results in ordering of the label. This hypothesis is consistent with the observation that when [fusion peptide] ≈ [spin-labeled lipid], the ordering of the label is already close to its maximal value. By contrast, the simulation, NMR, and X-ray results were based on data that probe all of the lipids in the sample. For most of the above studies, the lipid was in the liquid-crystalline phase and phosphatidylcholine was the major or only lipid headgroup, so the difference in disordering vs. ordering between techniques is likely not due to lipid differences. In addition, the X-ray studies detected disordering with GPfp for a variety of lipid compositions that included a single phosphatidylcholine lipid with or without cholesterol as well a mixture that approximately matches the lipid composition of the plasma membrane of host cells of HIV. In most studies, lipid disordering or ordering was also correlated with fusion by comparison between different peptide:lipid ratios, and/or comparison between wild-type and mutant peptide or between conditions that affect peptide-induced vesicle fusion, e.g. pH 5 vs. 7 for HAfp.
We also note conflicting results between analyses of X-ray vs. neutron scattering data about other effects on membrane by GPfp. For both approaches, the GPfp had significant fraction oligomeric β sheet structure. Analysis of the low-angle X-ray scattering showed ~3 Å thinner membrane width in the presence of GPfp whereas analysis of small-angle neutron scattering showed ~3 Å thicker width.50,72 Analysis of the X-ray data showed typical 5-10 fold reduction in the bending modulus of membrane when GPfp was bound whereas analysis of neutron spin-echo spectra showed typical 1.6 fold increase in the bending modulus.72,73 The X-ray vs. neutron data are respectively consistent with membrane with larger vs. smaller amplitudes of lipid motion. The reasons for these conflicting results are not understood but we note there was some difference in the GPfp sequence used for the X-ray vs. neutron experiments.
9. Detailed fitting gives precise R2CD3, R2CD2,outer, and R2CD2,inner’s, and R2outer > R2inner is consistent with τcouter > τcinner for chain fluctuations.
For the present study, separate fittings are required for the ICD2 and ICD3 intensities because: (1) ICD2 is dominant at shorter times, based on 24 −C2H2 vs. 6 −C2H3; and (2) ICD3 is dominant at longer times, based on R2CD3 < R2CD2 (Fig. 3). The spectral integrations include Icentral from the central region that has both −C2H2 and −C2H3 contributions, and Iouter and Iinner from outlying regions that are only −C2H2 (Fig. S1). Typically, Iouter is weighted towards −C2H2’s closer to the headgroup with larger S, and Iinner is weighted towards −C2H2’s closer to the chain termini with smaller S. Each R2CD3 is well-fitted using Icentral − Iinner, with typical δR2CD3/R2CD3 ≈ 0.02 (Table 1 and Fig. 4C).
The −CD2 R2outer and R2inner are determined from separate fittings of Iouter and Iinner (Figs. S1 and S3). Between 35 and 10 °C, no peptide and HAfp, pH 7 exhibit typical R2outer:R2inner ≈ 1.1 and 1.2, respectively. As discussed above in #2 the R2 ≈ ΔM2 × τc for these samples and the R2outer > R2inner is reasonably explained by τcouter > τcinner which is consistent with lower mobility of −C2H2 closer to the headgroup vs. chain termini. The larger R2outer:R2inner for HAfp, pH 7 vs. no peptide could be due to HAfp location near the headgroups. At 0 °C, there is significant broadening of the −C2H3 contribution so that the inner and outer −C2H2 ranges are moved to regions corresponding to −C2H bond orientations respectively closer to perpendicular and parallel to the external magnetic field direction. This may be related to R2inner > R2outer at 0 °C, with ratio of ~1.1. Interestingly, the GPfp and HAfp, pH 5 typically have similar R2outer and R2inner at a given temperature but don’t exhibit clear trends like no peptide and HAfp, pH 7 (Fig. S3). For −C2H2’s nearer the headgroup vs. chain termini, there may be different temperature dependences of Scloser and Sfurther which results in different temperature dependences of ΔR2outer and ΔR2inner.
Summary
In this study, 2H NMR R2’s were determined for DMPC-d54 with bound GPfp and HAfp fusion peptides that adopt very different structures, intermolecular antiparallel β sheet and monomer helical hairpin, respectively. For the liquid-crystalline phase between 35 and 25 °C, the typical R2,peptide > R2,no peptide, which is consistent with larger correlation time τc for acyl chain fluctuations with peptide. For no peptide in the gel phase at 20 °C, the R2’s are ~2× times larger than in liquid-crystalline phase, and there is ~1.5× further increase when temperature is reduced to 0 °C, which correlates with increases in τc in the gel phases. At 20 °C, there are similar R2’s and spectral lineshapes for no peptide and HAfp, pH 7, and also similar R2’s at 10 and 0 °C, which correlates with earlier observations of similar τc’s without vs. with peptide in gel phases. GPfp and HAfp, pH 5 exhibit very different R2’s and lineshapes at 20, 10, and 0 °C. The ΔR2CD2 ≈ 104 Hz at 20 °C, with smaller but still substantial ΔR2’s at 10 and 0 °C. At a given temperature, the lineshapes are also narrower than those of no peptide and HAfp, pH 7. The large ΔR2’s for GPfp and HAfp, pH 5 are interpreted to be due to lipid diffusion between locations closer to vs. further from peptide, with respective smaller vs. larger order parameters. This difference in order parameters was previously detected in molecular dynamics simulations of membrane with HAfp. Larger-amplitude chain motion, including protrusion into the aqueous phase, is likely characteristic of transition states between membrane fusion intermediates, and such motion is supported by the present study as a contribution of fusion peptides to fusion catalysis. This contribution exists for both helical and β sheet fusion peptide structures.
Supplementary Material
Acknowledgement
This work was supported by the National Institutes of Health grant number R01 AI047153.
GP, UniProt KB, P04578
HA, UniProtKB P03377
Abbreviations
- d
distance
- D
diffusion constant
- DMPC-d54
dimyristoylphosphatidylcholine with perdeuterated acyl chains
- DOPC
dioleoylphosphatidylcholine
- DPPC-d62
dipalmitoylphosphatidylcholine with perdeuterated acyl chains
- Ed
ectodomain
- f
fast
- fp
fusion peptide
- FsSu
fusion subunit
- GP
HIV glycoprotein
- HA
influenza hemagglutinin
- I
intensity
- LUV
large unilamellar vesicle
- M2
spectral second moment
- n
carbon number in acyl chain
- R1
NMR longitudinal relaxation rate
- R2
NMR transverse relaxation rate
- RbSu
receptor-binding subunit
- s
slow
- S
order parameter
- SARS-CoV-2
severe acute respiratory syndrome coronavirus 2
- δ
uncertainty
- ΔM2
mean-squared amplitude of the NMR frequency fluctuations
- θ
angle with respect to NMR field direction
- ν
frequency
- τ
NMR time delay
- τc
correlation time
- τD
diffusion time
Footnotes
Supporting Information for Publication
Spectra at shortest τ, integration regions, and R2 values and uncertainties; Bar graphs of R2CD2,outer, and R2CD2,inner.
References
- [1].White JM, Delos SE, Brecher M, and Schornberg K (2008) Structures and mechanisms of viral membrane fusion proteins: Multiple variations on a common theme, Crit. Rev. Biochem. Mol. Biol 43, 189–219. [DOI] [PMC free article] [PubMed] [Google Scholar]
- [2].Boonstra S, Blijleven JS, Roos WH, Onck PR, van der Giessen E, and van Oijen AM (2018) Hemagglutinin-mediated membrane fusion: A biophysical perspective, Ann. Revs. Biophys 47, 153–173. [DOI] [PubMed] [Google Scholar]
- [3].Tang T, Bidon M, Jaimes JA, Whittaker GR, and Daniel S (2020) Coronavirus membrane fusion mechanism offers a potential target for antiviral development, Antiviral Research 178, 104792. [DOI] [PMC free article] [PubMed] [Google Scholar]
- [4].Pabis A, Rawle RJ, and Kasson PM (2020) Influenza hemagglutinin drives viral entry via two sequential intramembrane mechanisms, Proc. Natl. Acad. Sci. U.S.A 117, 7200–7207. [DOI] [PMC free article] [PubMed] [Google Scholar]
- [5].Kim CS, Epand RF, Leikina E, Epand RM, and Chernomordik LV (2011) The final conformation of the complete ectodomain of the HA2 subunit of Influenza Hemagglutinin can by itself drive low pH-dependent fusion, J. Biol. Chem 286, 13226–13234. [DOI] [PMC free article] [PubMed] [Google Scholar]
- [6].Durrer P, Galli C, Hoenke S, Corti C, Gluck R, Vorherr T, and Brunner J (1996) H+-induced membrane insertion of influenza virus hemagglutinin involves the HA2 amino-terminal fusion peptide but not the coiled coil region, J. Biol. Chem 271, 13417–13421. [DOI] [PubMed] [Google Scholar]
- [7].Nobusawa E, Aoyama T, Kato H, Suzuki Y, Tateno Y, and Nakajima K (1991) Comparison of complete amino acid sequences and receptor binding properties among 13 serotypes of hemagglutinins of influenza A viruses, Virology 182, 475–485. [DOI] [PubMed] [Google Scholar]
- [8].Freed EO, Delwart EL, Buchschacher GL Jr., and Panganiban AT (1992) A mutation in the human immunodeficiency virus type 1 transmembrane glycoprotein gp41 dominantly interferes with fusion and infectivity, Proc. Natl. Acad. Sci. U.S.A 89, 70–74. [DOI] [PMC free article] [PubMed] [Google Scholar]
- [9].Durell SR, Martin I, Ruysschaert JM, Shai Y, and Blumenthal R (1997) What studies of fusion peptides tell us about viral envelope glycoprotein-mediated membrane fusion, Mol. Membr. Biol 14, 97–112. [DOI] [PubMed] [Google Scholar]
- [10].Qiao H, Armstrong RT, Melikyan GB, Cohen FS, and White JM (1999) A specific point mutant at position 1 of the influenza hemagglutinin fusion peptide displays a hemifusion phenotype, Mol. Biol. Cell 10, 2759–2769. [DOI] [PMC free article] [PubMed] [Google Scholar]
- [11].Jaroniec CP, Kaufman JD, Stahl SJ, Viard M, Blumenthal R, Wingfield PT, and Bax A (2005) Structure and dynamics of micelle-associated human immunodeficiency virus gp41 fusion domain, Biochemistry 44, 16167–16180. [DOI] [PubMed] [Google Scholar]
- [12].Qiang W, Bodner ML, and Weliky DP (2008) Solid-state NMR spectroscopy of human immunodeficiency virus fusion peptides associated with host-cell-like membranes: 2D correlation spectra and distance measurements support a fully extended conformation and models for specific antiparallel strand registries, J. Am. Chem. Soc 130, 5459–5471. [DOI] [PMC free article] [PubMed] [Google Scholar]
- [13].Madu IG, Roth SL, Belouzard S, and Whittaker GR (2009) Characterization of a highly conserved domain within the Severe Acute Respiratory Syndrome coronavirus spike protein S2 domain with characteristics of a viral fusion peptide, J. Virol 83, 7411–7421. [DOI] [PMC free article] [PubMed] [Google Scholar]
- [14].Schmick SD, and Weliky DP (2010) Major antiparallel and minor parallel beta sheet populations detected in the membrane-associated Human Immunodeficiency Virus fusion peptide, Biochemistry 49, 10623–10635. [DOI] [PMC free article] [PubMed] [Google Scholar]
- [15].Lorieau JL, Louis JM, and Bax A (2010) The complete influenza hemagglutinin fusion domain adopts a tight helical hairpin arrangement at the lipid:water interface, Proc. Natl. Acad. Sci. U.S.A 107, 11341–11346. [DOI] [PMC free article] [PubMed] [Google Scholar]
- [16].Sackett K, Nethercott MJ, Zheng ZX, and Weliky DP (2014) Solid-state NMR spectroscopy of the HIV gp41 membrane fusion protein supports intermolecular antiparallel beta sheet fusion peptide structure in the final six-helix bundle state, J. Mol. Biol 426, 1077–1094. [DOI] [PMC free article] [PubMed] [Google Scholar]
- [17].Ratnayake PU, Sackett K, Nethercott MJ, and Weliky DP (2015) pH-dependent vesicle fusion induced by the ectodomain of the human immunodeficiency virus membrane fusion protein gp41: Two kinetically distinct processes and fully-membrane-associated gp41 with predominant beta sheet fusion peptide conformation, Biochim. Biophys. Acta 1848, 289–298. [DOI] [PMC free article] [PubMed] [Google Scholar]
- [18].Ghosh U, Xie L, Jia LH, Liang S, and Weliky DP (2015) Closed and semiclosed interhelical structures in membrane vs closed and open structures in detergent for the Influenza Virus hemagglutinin fusion peptide and correlation of hydrophobic surface area with fusion catalysis, J. Am. Chem. Soc 137, 7548–7551. [DOI] [PMC free article] [PubMed] [Google Scholar]
- [19].Lai AL, Millet JK, Daniel S, Freed JH, and Whittaker GR (2017) The SARS-CoV fusion peptide forms an extended bipartite fusion platform that perturbs membrane order in a calcium-dependent manner, J. Mol. Biol 429, 3875–3892. [DOI] [PMC free article] [PubMed] [Google Scholar]
- [20].Ranaweera A, Ratnayake PU, and Weliky DP (2018) The stabilities of the soluble ectodomain and fusion peptide hairpins of the Influenza virus hemagglutinin subunit II protein are positively correlated with membrane fusion, Biochemistry 57, 5480–5493. [DOI] [PMC free article] [PubMed] [Google Scholar]
- [21].Bodner ML, Gabrys CM, Parkanzky PD, Yang J, Duskin CA, and Weliky DP (2004) Temperature dependence and resonance assignment of 13C NMR spectra of selectively and uniformly labeled fusion peptides associated with membranes, Magn. Reson. Chem 42, 187–194. [DOI] [PubMed] [Google Scholar]
- [22].Davis JH (1979) Deuterium magnetic resonance study of the gel and liquid crystalline phases of dipalmitoyl phosphatidylcholine, Biophys. J 27, 339–358. [DOI] [PMC free article] [PubMed] [Google Scholar]
- [23].Harris RK (1986) Nuclear magnetic resonance spectroscopy: A physiochemical view, Longman. [Google Scholar]
- [24].Rozovsky S, and McDermott AE (2001) The time scale of the catalytic loop motion in triosephosphate isomerase, J. Mol. Biol 310, 259–270. [DOI] [PubMed] [Google Scholar]
- [25].Veatch SL, Soubias O, Keller SL, and Gawrisch K (2007) Critical fluctuations in domain-forming lipid mixtures, Proc. Natl. Acad Sci. U.S.A 104, 17650–17655. [DOI] [PMC free article] [PubMed] [Google Scholar]
- [26].Bloom M, Evans E, and Mouritsen OG (1991) Physical properties of the fluid lipid-bilayer component of cell membranes: a perspective, Quart. Rev. Biophys 24, 293–397. [DOI] [PubMed] [Google Scholar]
- [27].Ghosh U, and Weliky DP (2020) 2H nuclear magnetic resonance spectroscopy supports larger amplitude fast motion and interference with lipid chain ordering for membrane that contains beta sheet human immunodeficiency virus gp41 fusion peptide or helical hairpin influenza virus hemagglutinin fusion peptide at fusogenic pH, Biochim. Biophys. Acta 1862, 183404. [DOI] [PMC free article] [PubMed] [Google Scholar]
- [28].Wasniewski CM, Parkanzky PD, Bodner ML, and Weliky DP (2004) Solid-state nuclear magnetic resonance studies of HIV and influenza fusion peptide orientations in membrane bilayers using stacked glass plate samples, Chem. Phys. Lipids 132, 89–100. [DOI] [PubMed] [Google Scholar]
- [29].Gabrys CM, and Weliky DP (2007) Chemical shift assignment and structural plasticity of a HIV fusion peptide derivative in dodecylphosphocholine micelles, Biochim. Biophys. Acta 1768, 3225–3234. [DOI] [PMC free article] [PubMed] [Google Scholar]
- [30].Li YL, and Tamm LK (2007) Structure and plasticity of the human immunodeficiency virus gp41 fusion domain in lipid micelles and bilayers, Biophys. J 93, 876–885. [DOI] [PMC free article] [PubMed] [Google Scholar]
- [31].Lakomek NA, Kaufman JD, Stahl SJ, Louis JM, Grishaev A, Wingfield PT, and Bax A (2013) Internal dynamics of the homotrimeric HIV-1 viral coat protein gp41 on multiple time scales, Angew. Chem. Int. Ed 52, 3911–3915. [DOI] [PMC free article] [PubMed] [Google Scholar]
- [32].Curtis-Fisk J, Spencer RM, and Weliky DP (2008) Native conformation at specific residues in recombinant inclusion body protein in whole cells determined with solid-state NMR spectroscopy, J. Am. Chem. Soc 130, 12568–12569. [DOI] [PMC free article] [PubMed] [Google Scholar]
- [33].Sun Y, and Weliky DP (2009) 13C-13C Correlation spectroscopy of membrane-associated Influenza virus fusion peptide strongly supports a helix-turn-helix motif and two turn conformations, J. Am. Chem. Soc 131, 13228–13229. [DOI] [PMC free article] [PubMed] [Google Scholar]
- [34].Grewe C, Beck A, and Gelderblom HR (1990) HIV: early virus-cell interactions, J. AIDS 3, 965–974. [PubMed] [Google Scholar]
- [35].Miyauchi K, Kim Y, Latinovic O, Morozov V, and Melikyan GB (2009) HIV enters cells via endocytosis and dynamin-dependent fusion with endosomes, Cell 137, 433–444. [DOI] [PMC free article] [PubMed] [Google Scholar]
- [36].Herold N, Anders-Osswein M, Glass B, Eckhardt M, Muller B, and Krausslich HG (2014) HIV-1 entry in SupT1-R5, CEM-ss, and primary CD4(+) T Cells occurs at the plasma membrane and does not require endocytosis, J. Virol 88, 13956–13970. [DOI] [PMC free article] [PubMed] [Google Scholar]
- [37].Yang J, Gabrys CM, and Weliky DP (2001) Solid-state nuclear magnetic resonance evidence for an extended beta strand conformation of the membrane-bound HIV-1 fusion peptide, Biochemistry 40, 8126–8137. [DOI] [PubMed] [Google Scholar]
- [38].Sackett K, Nethercott MJ, Epand RF, Epand RM, Kindra DR, Shai Y, and Weliky DP (2010) Comparative analysis of membrane-associated fusion peptide secondary structure and lipid mixing function of HIV gp41 constructs that model the early pre-hairpin intermediate and final hairpin conformations, J. Mol. Biol 397, 301–315. [DOI] [PMC free article] [PubMed] [Google Scholar]
- [39].Macosko JC, Kim CH, and Shin YK (1997) The membrane topology of the fusion peptide region of influenza hemagglutinin determined by spin-labeling EPR, J. Mol. Biol 267, 1139–1148. [DOI] [PubMed] [Google Scholar]
- [40].Han X, Bushweller JH, Cafiso DS, and Tamm LK (2001) Membrane structure and fusion-triggering conformational change of the fusion domain from influenza hemagglutinin, Nature Struct. Biol 8, 715–720. [DOI] [PubMed] [Google Scholar]
- [41].Ge M, and Freed JH (2009) Fusion peptide from influenza hemagglutinin increases membrane surface order: An electron-spin resonance study, Biophys. J 96, 4925–4934. [DOI] [PMC free article] [PubMed] [Google Scholar]
- [42].Lorieau JL, Louis JM, Schwieters CD, and Bax A (2012) pH-triggered, activated-state conformations of the influenza hemagglutinin fusion peptide revealed by NMR, Proc. Natl. Acad. Sci. U.S.A 109, 19994–19999. [DOI] [PMC free article] [PubMed] [Google Scholar]
- [43].Liang S, Ratnayake PU, Keinath C, Jia L, Wolfe R, Ranaweera A, and Weliky DP (2018) Efficient fusion at neutral pH by Human Immunodeficiency Virus gp41 trimers containing the fusion peptide and transmembrane domains, Biochemistry 57, 1219–1235. [DOI] [PMC free article] [PubMed] [Google Scholar]
- [44].Ranaweera A, Ratnayake PU, Ekanayaka EAP, Declercq R, and Weliky DP (2019) Hydrogen-deuterium exchange supports independent membrane-interfacial fusion peptide and transmembrane domains in subunit 2 of influenza virus hemagglutinin protein, a structured and aqueous-protected connection between the fusion peptide and soluble ectodomain, and the importance of membrane apposition by the trimer-of-hairpins structure, Biochemistry 58, 2432–2446. [DOI] [PMC free article] [PubMed] [Google Scholar]
- [45].Yao HW, and Hong M (2014) Conformation and lipid interaction of the fusion peptide of the paramyxovirus PIV5 in anionic and negative-curvature membranes from solid-state NMR, J. Am. Chem. Soc 136, 2611–2624. [DOI] [PMC free article] [PubMed] [Google Scholar]
- [46].Chernomordik LV, and Kozlov MM (2008) Mechanics of membrane fusion, Nat. Struct. Mol. Biol 15, 675–683. [DOI] [PMC free article] [PubMed] [Google Scholar]
- [47].Larsson P, and Kasson PM (2013) Lipid tail protrusion in simulations predicts fusogenic activity of influenza fusion peptide mutants and conformational models, PLoS Comp. Biol 9, e1002950. [DOI] [PMC free article] [PubMed] [Google Scholar]
- [48].Victor BL, Lousa D, Antunes JM, and Soares CM (2015) Self-assembly molecular dynamics simulations shed light into the interaction of the influenza fusion peptide with a membrane bilayer, J. Chem. Inform. Model 55, 795–805. [DOI] [PubMed] [Google Scholar]
- [49].Worch R, Krupa J, Filipek A, Szymaniec A, and Setny P (2017) Three conserved C-terminal residues of influenza fusion peptide alter its behavior at the membrane interface, Biochim. Biophys. Acta 1861, 97–105. [DOI] [PubMed] [Google Scholar]
- [50].Tristram-Nagle S, Chan R, Kooijman E, Uppamoochikkal P, Qiang W, Weliky DP, and Nagle JF (2010) HIV fusion peptide penetrates, disorders, and softens T-cell membrane mimics, J. Mol. Biol 402, 139–153. [DOI] [PMC free article] [PubMed] [Google Scholar]
- [51].Legare S, and Lagguee P (2014) The influenza fusion peptide promotes lipid polar head intrusion through hydrogen bonding with phosphates and N-terminal membrane insertion depth, Proteins-Struc. Func. Bioinform 82, 2118–2127. [DOI] [PubMed] [Google Scholar]
- [52].Koynova R, and Caffrey M (1998) Phases and phase transitions of the phosphatidylcholines, Biochim. Biophys. Acta 1376, 91–145. [DOI] [PubMed] [Google Scholar]
- [53].Mayer C, Muller K, Weisz K, and Kothe G (1988) Deuteron NMR relaxation studies of phospholipid membranes, Liquid Crystals 3, 797–806. [Google Scholar]
- [54].Prosser RS, Davis JH, Mayer C, Weisz K, and Kothe G (1992) Deuterium NMR relaxation studies of peptide-lipid interactions, Biochemistry 31, 9355–9363. [DOI] [PubMed] [Google Scholar]
- [55].Morrow MR, Simatos GA, Srinivasan R, Grandal N, Taylor L, and Keough KMW (1991) The effect of changes in gramicidin conformation on bilayer lipid properties, Biochim. Biophys. Acta 1070, 209–214. [DOI] [PubMed] [Google Scholar]
- [56].Simatos GA, Forward KB, Morrow MR, and Keough KMW (1990) Interaction between perdeuterated dimyristoylphosphatidylcholine and low molecular-weight pulmonary surfactant protein SP-C, Biochemistry 29, 5807–5814. [DOI] [PubMed] [Google Scholar]
- [57].Morrow MR, Stewart J, Taneva S, Dico A, and Keough KMW (2004) Perturbation of DPPC bilayers by high concentrations of pulmonary surfactant protein SP-B, Eur. Biophys. J 33, 285–290. [DOI] [PubMed] [Google Scholar]
- [58].Gabrys CM, Yang R, Wasniewski CM, Yang J, Canlas CG, Qiang W, Sun Y, and Weliky DP (2010) Nuclear magnetic resonance evidence for retention of a lamellar membrane phase with curvature in the presence of large quantities of the HIV fusion peptide, Biochim. Biophys. Acta 1798, 194–201. [DOI] [PMC free article] [PubMed] [Google Scholar]
- [59].Pauls KP, Mackay AL, Soderman O, Bloom M, Tanjea AK, and Hodges RS (1985) Dynamic properties of the backbone of an integral membrane polypeptide measured by 2H-NMR, Eur. Biophys. J 12, 1–11. [DOI] [PubMed] [Google Scholar]
- [60].Meier P, Ohmes E, and Kothe G (1986) Multipulse dynamic nuclear magnetic resonance of phospholipid membranes, J. Chem. Phys 85, 3598–3614. [Google Scholar]
- [61].Oradd G, and Lindblom G (2004) NMR studies of lipid lateral diffusion in the DMPC/gramicidin D/water system: Peptide aggregation and obstruction effects, Biophys. J 87, 980–987. [DOI] [PMC free article] [PubMed] [Google Scholar]
- [62].Davis JH, Ziani L, and Schmidt ML (2013) Critical fluctuations in DOPC/DPPC-d62/cholesterol mixtures: 2H magnetic resonance and relaxation, J. Chem. Phys 139, 045104. [DOI] [PubMed] [Google Scholar]
- [63].Warner M (1983) Theory of light scattering from vesicles, Colloid Polym. Sci 261, 508–519. [Google Scholar]
- [64].Han X, and Tamm LK (2000) A host-guest system to study structure-function relationships of membrane fusion peptides, Proc. Natl. Acad. Sci. U.S.A 97, 13097–13102. [DOI] [PMC free article] [PubMed] [Google Scholar]
- [65].Pereira FB, Goni FM, Muga A, and Nieva JL (1997) Permeabilization and fusion of uncharged lipid vesicles induced by the HIV-1 fusion peptide adopting an extended conformation: dose and sequence effects, Biophys. J 73, 1977–1986. [DOI] [PMC free article] [PubMed] [Google Scholar]
- [66].Yang R (2005) Synthesis, enhanced fusogenicity, and solid state NMR measurements of oligomeric HIV-1 fusion peptide constructs, Michigan State University, East Lansing, MI. [Google Scholar]
- [67].Brice AR, and Lazaridis T (2014) Structure and dynamics of a fusion peptide helical hairpin on the membrane surface: Comparison of molecular simulations and NMR, J. Phys. Chem. B 118, 4461–4470. [DOI] [PMC free article] [PubMed] [Google Scholar]
- [68].Jia LH, Liang S, Sackett K, Xie L, Ghosh U, and Weliky DP (2015) REDOR solid-state NMR as a probe of the membrane locations of membrane-associated peptides and proteins, J. Magn. Reson 253, 154–165. [DOI] [PMC free article] [PubMed] [Google Scholar]
- [69].Baylon JL, and Tajkhorshid E (2015) Capturing spontaneous membrane insertion of the Influenza virus Hemagglutinin fusion peptide, J. Phys. Chem. B 119, 7882–7893. [DOI] [PMC free article] [PubMed] [Google Scholar]
- [70].Lai AL, and Freed JH (2014) HIV gp41 fusion peptide increases membrane ordering in a cholesterol-dependent fashion, Biophys. J 106, 172–181. [DOI] [PMC free article] [PubMed] [Google Scholar]
- [71].Chakraborty H, Lentz BR, Kombrabail M, Krishnamoorthy G, and Chattopadhyay A (2017) Depth-dependent membrane ordering by Hemagglutinin fusion peptide promotes fusion, J. Phys. Chem. B 121, 1640–1648. [DOI] [PubMed] [Google Scholar]
- [72].Heller WT, and Zolnierczuk PA (2019) The helix-to-sheet transition of an HIV-1 fusion peptide derivative changes the mechanical properties of lipid bilayer membranes, Biochim. Biophys. Acta 1861, 565–572. [DOI] [PubMed] [Google Scholar]
- [73].Tristram-Nagle S, and Nagle JF (2007) HIV-1 fusion peptide decreases bending energy and promotes curved fusion intermediates, Biophys. J 93, 2048–2055. [DOI] [PMC free article] [PubMed] [Google Scholar]
Associated Data
This section collects any data citations, data availability statements, or supplementary materials included in this article.