Abstract
Purpose:
To assess the diagnostic accuracy measures such as sensitivity and specificity of smartphone-based artificial intelligence (AI) approaches in the detection of diabetic retinopathy (DR).
Methods:
A literature search of the EMBASE and MEDLINE databases (up to March 2020) was conducted. Only studies using both smartphone-based cameras and AI software for image analysis were included. The main outcome measures were pooled sensitivity and specificity, diagnostic odds ratios and relative risk of smartphone-based AI approaches in detecting DR (of all types), and referable DR (RDR) (moderate nonproliferative retinopathy or worse and/or the presence of diabetic macular edema).
Results:
Smartphone-based AI has a pooled sensitivity of 89.5% (95% confidence interval [CI]: 82.3%–94.0%) and pooled specificity of 92.4% (95% CI: 86.4%–95.9%) in detecting DR. For referable disease, sensitivity is 97.9% (95% CI: 92.6%-99.4%), and the pooled specificity is 85.9% (95% CI: 76.5%–91.9%). The technology is better at correctly identifying referable retinopathy.
Conclusions:
The smartphone-based AI programs demonstrate high diagnostic accuracy for the detection of DR and RDR and are potentially viable substitutes for conventional diabetic screening approaches. Further, high-quality randomized controlled trials are required to establish the effectiveness of this approach in different populations.
Keywords: Artificial intelligence, Deep learning, Diabetic retinopathy, Ophthalmology, Screening, Smartphone
INTRODUCTION
Diabetes mellitus remains a major challenge for health systems around the world. With up to 425 million patients worldwide leading to 12% of expenditures on health, the prevalence has nearly doubled from 4.7% to 8.5% between 1980 and 2014.1 The global prevalence is likely to increase with the rise of noncommunicable diseases, with many patients remaining undiagnosed due to lack of access to healthcare facilities and personnel.2
Diabetic retinopathy (DR) is a microvascular complication of diabetes and is the leading cause of blindness in working-age populations.3 With diabetes mellitus becoming a major public health concern for health systems worldwide, it is projected that by 2030, 191 million people will have visual impairment due to the condition from 126.6 million in 2010.3 The loss of productivity and quality of life due to this preventable form of visual impairment are, therefore, a key challenge for public health workers, ophthalmologists, and policy workers to tackle.2
Robust screening programs exist in high-income countries such as the UK through annual check-ups for patients with diabetes.4 The International Council of Ophthalmology recommends a retinal examination through ophthalmoscopy or mydriatic or nonmydriatic fundus imaging with or without optical coherence tomography.4 The images obtained through fundus imaging are graded by a professional trained in grading retinal images. Patients with retinal images indicating sight-threatening DR are referred to the ophthalmologist for further review and treatment.
Although effective in enabling early detection of sight-threatening DR in high-income countries such screening programs may not be as feasible in settings with a lack of professionals trained to grade fundus images and provide treatment.5 Moreover, barriers to take up screening may occur due to lack of adequate transport facilities, awareness of the disease, and access to health-care facilities.2 The size of a fundus camera makes it difficult to implement screening programs in remote settings.2
Portable or smartphone-enabled cameras have been proposed as a means to take retinal images.6 However, despite the potential ease and affordability of acquiring the images through a smartphone, there are potential issues with image quality.6 Another issue is that of a lack of trained professionals who can interpret the images for patients with sight-threatening DR in remote areas where screening programs may take place.6
The use of artificial intelligence (AI) through deep learning has been proposed as a way of detecting retinal images which may be sight-threatening.1 AI systems are trained to detect a large number of retinal images, and they can be enabled to grade disease severity of DR. AI-based algorithms with high sensitivity and specificity have been developed by many tech-based organizations across the world. However, the image analysis is done retrospectively. A device called the Topcon NW400 which uses an AI algorithm to detect DR in retinal images through a retinal camera has been approved in the USA.1 It has been approved by the US Food and Drug Administration (FDA) as a medical device to screen for DR in patients with diabetes and has a sensitivity and specificity rate of above 85%.
Although the Topcon NW400 utilizes AI systems to detect DR, which can alleviate the dependence on trained professionals to grade images and make referrals to the ophthalmologist, it is not a portable device. This review will explore the literature on AI-enabled smartphone-based or portable cameras to detect DR and will assess the diagnostic accuracy values of such interventions.
METHODS
We used the Medline (1946 to present) and Embase (1974 to present) databases as part of the primary search. A search strategy using the words, “smartphone, smartphone-based, portable, artificial intelligence and diabetic retinopathy” was used to collate the papers using Boolean operators (see supplementary file). A PRISMA diagram [Figure 1] displays the search strategy with inclusion and exclusion criteria. The date of the last search was March 29, 2020. The extracted information included author names, journal, year of publication, country, type of study, sensitivity, and specificity, and study setting.
Figure 1.
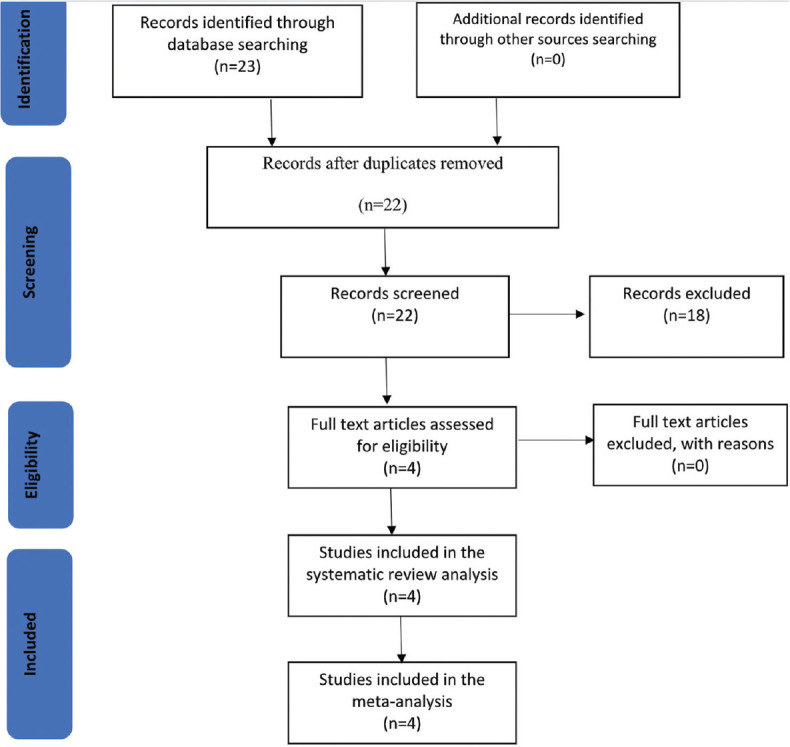
Data selection steps using the Preferred Reporting Items for Systematic Review and Meta-Analyses
Eligibility criteria
We sought to include studies that had outcome measures of diagnostic accuracy for sensitivity and specificity for AI-enabled smartphone or portable devices. Only English-language studies were included. Studies which only had the sensitivity and specificity statistics for non-AI smartphone or portable devices were excluded, as well as AI-based software algorithms which were not linked to a smartphone or portable devices. Conference abstracts, review articles, letters to the editor, editorials, and correspondence notes were excluded.
Two authors (A.S. and A.A.B.) independently evaluated the titles and abstracts of the eligible studies retrieved from the search strategy and extracted the information from them, which are presented in Table 1. Abstracts providing sufficient information regarding the inclusion and exclusion criteria were further selected for full-text evaluation.
Table 1.
Summary of the selected studies showing the type of cameras and the study characteristics
| Authors (year) | Country | Type of study | Study setting | Sample Size | Type of camera | AI software | Classifications* | Study quality** |
|---|---|---|---|---|---|---|---|---|
| Natarajan et al., (2019) | India | Cross-sectional | Dispensaries, primary care | 213 | Remidio NM FOP 10 | Medios technologies, Singapore | 5 | 17 |
| Rajalakshmi et al., (2018) | India | Cross-sectional | Outpatient, tertiary center | 296 | Remidio NM FOP 10 | EyeArtTM | 5 | 18 |
| Sosale Aravind et al., (2020) | India | Cross-sectional | Outpatient, tertiary care | 900 | Remidio NM FOP 10 | Medios technologies, Singapore | 5 | 18 |
| Sosale, Murthy et al., (2020) | India | Cross-sectional | Outpatient, tertiary center | 297 | Remidio NM FOP 10 | Medios technologies, Singapore | 5 | 18 |
*Number of classifications of images defined such as none, mild, moderate, severe, and proliferative, **Study quality method assessed by QUADAS tool. NM FOP: Nonmydriatic fundus on phone, AI: Artificial intelligence
Meta-analysis
For the meta-analysis, we were interested in all-severity and referable DR (RDR). RDR was defined as disease of equal or greater severity to moderate nonproliferative DR according to the International Clinical DR classification, with or without diabetic macular edema.7,8,9 The information we extracted from the selected papers included the sample size, type of camera used, the AI software, and the country where the study was performed. Bias was assessed using the QUADAS tool. The QUADAS tool allows for individual studies looking at diagnostic accuracy values in a systematic review to be assessed for low, intermediate, or high risk of bias and applicability. In addition, the true positive and negative, false positive and negative, sensitivity and specificity values were extracted for both all diabetic and RDR.
The Hierarchical Summary Receiver Operating Characteristic (HSROC) curve was generated to capture the pooled sensitivity and specificity of the studies. We computed the diagnostic odds ratio (DOR) and likelihood ratio (LR) for each study and generated forest plots for all-severity DR and RDR. The DOR is the ratio of the odds of obtaining positive results in patients with DR or RDR relative to odds of obtaining a similar result in patients without DR or RDR.10 We computed DOR as the ratio of the division of true-positive (TP) and false-negative (FN) and the division of false-positive (FP) and true-negative (TN) (DOR = [TP/FN]/[FP/TN]).10
The LR represents the ratio of the expected test results among patients with DR or RDR compared to patients without DR or RDR. Positive LR (LR+) is a measure of the odds of ruling in the DR or RDR while negative LR (LR−) is a measure of the odds of ruling out DR or RDR.10 It is expected that good diagnostic tests should have LR+ values greater than 10 and LR− values <0.1.10 LR+ is calculated as the sensitivity divided by 1 – sensitivity. Similarly, LR− is calculated as 1 - sensitivity divided by specificity ([1 − sensitivity]/specificity). For this study, the LR+ and LR− values were generated from the pooled sensitivity and specificity values from the HSROC curve. In addition, we computed the accuracy and precision of AI software in identifying all-severity and RDR. We defined accuracy as the ratio of the sum of true positives and true negatives divided by the total sample ([TP + TN]/[TP + FP + FN + TN])11 (Baratloo, Hosseini, Negida, and El Ashal, 2015). Precision was calculated as the ratio of true positives and the sum of true positives and false positives (TP/[TP + FP]).11 We generated the weighted accuracy and precision values using the true positive values of the proxy for the weight.
We were interested in calculating the positive and negative predictive values. Since the predictive values are dependent on the prevalence and the selected studies were conducted among heterogeneous populations across India, we used the national prevalence estimates for DR and RDR in India. Guided by extant literature,12,13,14 we used a 64.5 million diabetic population as the population size and 13% and 2% prevalence rate for DR and RDR, respectively.
The heterogeneity of the studies was assessed using the I2 values – a measure of error arising between studies. High values suggest homogeneity while values <25% suggest low error and excellent heterogeneity.15 Publication bias was assessed using funnel plot and Egger's regression analysis. In using the funnel plot, a symmetrical location of the studies around the population effect size within the boundary of the inverted triangle suggests no publication bias.16 Contrastingly, the Egger's test of small study effect generates P values that can be used to objectively quantify publication bias. A P < 0.05 with the Egger's test of small sample effect suggests the presence of publication bias.17 All statistical analysis was undertaken on software (StataCorp. 2019. Stata Statistical Software: Release 16. College Station, TX, USA: StataCorp LLC.). and Review Manager 5.0.18,19
RESULTS
A total of 23 papers were extracted from the literature search. Four papers met the eligibility criteria, and they were synthesized and meta-analyzed [Figure 1]. Of the studies that were excluded, five were review articles. There were also eight conference abstracts and one commentary article, and five articles were not principally related to DR, fundus photography, and AI. Across the four selected studies, a total of 1706 patients were screened for DR.7,8,9,20
Table 1 summarizes the methodological characteristics of the included studies. The study design across all four selected papers was cross-sectional, with the sample population drawn from India. All four papers used the Remidio NM Fundus on Phone (FOP) 10 camera (Remidio Innovative Solutions Pvt. Ltd, Bangalore, India), and three papers used Medios technologies AI software. One paper used the EyeArtTM software. All papers used a five-point classification to describe DR. The study qualities across all papers ranged from 17 to 18, interpreted as average quality.
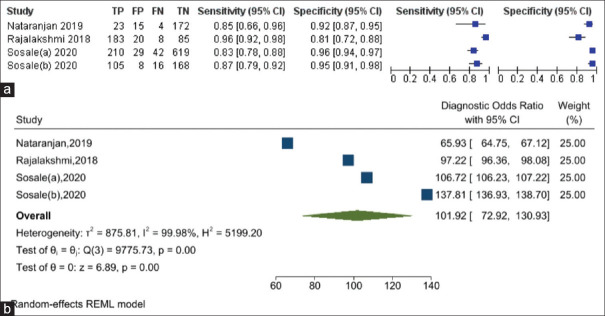
The sensitivity of the AI software in diagnosing DR ranged from 83% to 96%, while the specificity of diagnosing DR ranged from 81% to 96% [Figure 2a]. The DOR of AI for diagnosing DR is 101.92 (95% confidence interval [CI]: 72.92%–130.93%) [Figure 2b]. The i2 test indicates 99.98% (P = 0.001) levels of heterogeneity between the studies. Across the four studies, the pooled sensitivity of AI for diagnosing DR was 89.5% (95% CI: 82.3–94.0%) while the pooled specificity for diagnosing DR was 92.4% (95% CI: 86.4–95.9%) [Figure 3]. AI has 11.7 times (LR+: 11.74; 95% CI: 6.79%–20.32%) the likelihood of identifying a positive test among patients with DR compared to those without DR. Furthermore, AI has 89% reduced likelihood (LR−: 0.11; 95% CI: 0.07%–0.19%) of generating a negative result in a patient with DR compared to patients without DR.
Figure 2.
(a) Summary of the sensitivity and specificity results of artificial intelligence (AI) software across the selected studies in diagnosing diabetic retinopathy (DR). (b) Forest plot showing the diagnostic odds ratio of AI in diagnosing DR
Figure 3.
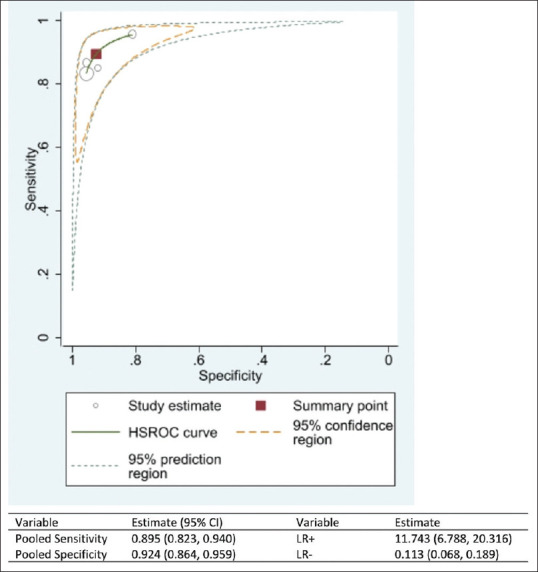
The Hierarchical Summary Receiver Operating Characteristic curve showing the combined effect of the sensitivity and specificity of the artificial intelligence software in diagnosing diabetic retinopathy
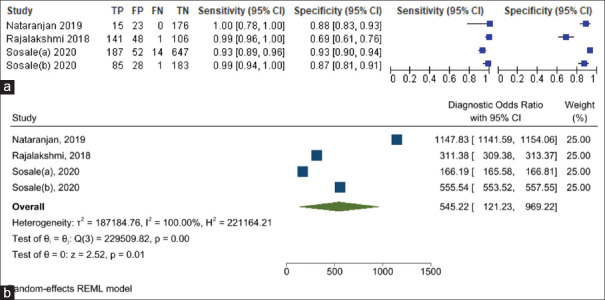
Similarly, the sensitivity of the AI software in diagnosing RDR ranged from 93% to 100% while the specificity of diagnosing RDR ranged from 69% to 93% [Figure 4a]. The DOR of AI for diagnosing RDR is 545.22 (95% CI: 121.23%–969.22%) [Figure 4b]. The i2 test indicates 100.0% (P < 0.001) levels of heterogeneity between the studies. Across the four studies, the pooled sensitivity of AI in diagnosing RDR was 97.9% (95% CI: 92.6%–99.4%), and the pooled specificity was 85.9% (95% CI: 76.5%–91.9%) [Figure 5]. AI has 6.9 times (LR+: 6.95; 95% CI: 4.13%–11.68%) the likelihood of identifying a positive test among patients with RDR compared to those without RDR. Furthermore, AI has 98% reduced likelihood (LR−: 0.02; 95% CI: 0.01%–0.08%) of generating a negative result in a patient with RDR compared to patients without RDR.
Figure 4.
(a) Summary of the sensitivity and specificity results of the artificial intelligence (AI) software across the selected studies in diagnosing referable diabetic retinopathy (RDR). (b) Forest plot showing the diagnostic odds ratio of AI in diagnosing RDR
Figure 5.
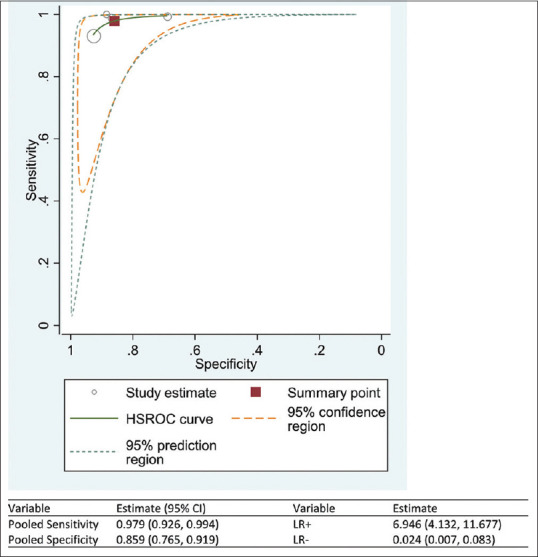
The Hierarchical Summary Receiver Operating Characteristic curve showing the combined effect of the sensitivity and specificity of the artificial intelligence software in diagnosing the referable diabetic retinopathy
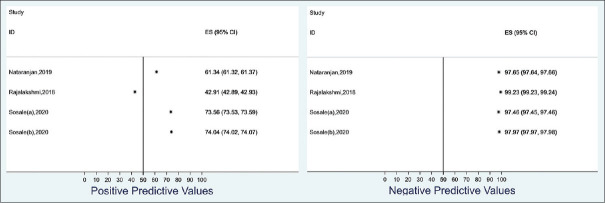
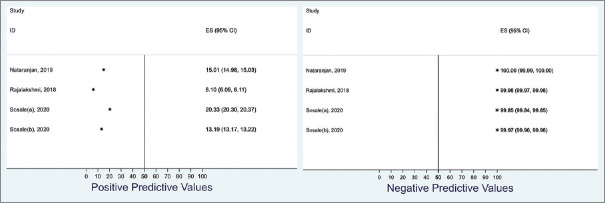
We estimated the positive and negative predictive values of AI diagnosing DR using an estimated Indian diabetic population of 6.45 million at 13% DR prevalence rate. The positive predictive value ranged from 42.9% to 74.0% while the negative predictive value ranged from 97.5% to 99.2% [Figure 6]. Similarly, we estimated the positive and negative predictive values of AI in diagnosing RDR in an Indian diabetic population of 6.45 million at a 2% prevalence rate. The positive predictive value ranged from 6.1% to 20.3% while the negative predictive value ranged from 99.9% to 100.0% [Figure 7].
Figure 6.
Summary of the range of the positive and negative predictive values of the artificial intelligence software in predicting referable diabetic retinopathy using 13% prevalence of diabetic retinopathy among an Indian population of 6.45 million
Figure 7.
Summary of the range of the positive and negative predictive values of the artificial intelligence software in predicting referable diabetic retinopathy (RDR) using 2% prevalence of RDR among an Indian population of 6.45 million
We estimated the diagnostic accuracy and precision of DR and RDR using AI. The weighted average diagnostic accuracy to identify any DR was 91.5% while the weighted average diagnostic precision was 88.5%. Similarly, the weighted average diagnostic accuracy to identify RDR was 89.0% while the weighted average precision was 75.1% [Table 2].
Table 2.
Summary of the weighted accuracy and precision of artificial intelligence software in predicting diabetic retinopathy and referable diabetic retinopathy
| Author (year) | Any diabetic retinopathy | Referable diabetic retinopathy | ||||
|---|---|---|---|---|---|---|
|
|
|
|||||
| Weight | Accuracy (%) | Precision (%) | Weight | Accuracy (%) | Precision (%) | |
| Nataranjan et al., (2019) | 0.044 | 91.12 | 60.53 | 0.035 | 89.25 | 39.47 |
| Rajalakshmi et al., (2018) | 0.351 | 90.54 | 90.15 | 0.329 | 83.45 | 78.24 |
| Sosale (a), (2020) | 0.403 | 92.11 | 87.87 | 0.437 | 92.67 | 74.60 |
| Sosale (b), (2020) | 0.202 | 91.92 | 92.92 | 0.199 | 90.24 | 75.22 |
| Weighted (%) | 91.48 | 88.48 | Weighted (%) | 89.03 | 75.09 | |
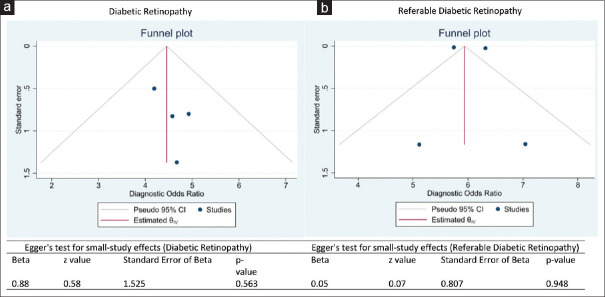
The selected studies showed little to no evidence of publication bias. A visual assessment of the funnel plot of the DR studies showed that log values of the DOR were symmetrically located around the population effect size [Figure 8a]. The Egger's test of small study effect was not significant (P = 0.563), showing that there is no publication bias. Similarly, a visual assessment of the funnel plot of the RDR studies showed that two studies had log values of the DOR symmetrically located around the population effect size [Figure 8b]. In addition, the Egger's test of small study effect was not significant (P = 0.948), showing that there is no publication bias.
Figure 8.
a- Funnel plot with estimates of Egger's regression analysis testing publication bias across the selected studies for diabetic retinopathy, b- Funnel plot with estimates of Egger's regression analysis testing publication bias across the selected studies for referable diabetic retinopathy
DISCUSSION
All four studies included in the meta-analysis used Remidio Innovative Solutions Pvt. Ltd, Bangalore, India, to obtain images from a smartphone. The pooled sensitivity and specificity of DR and RDR of this meta-analysis exceed the FDA superiority endpoints of 87.2% (95% CI: 81.8%–91.2%) (>85%) and specificity of 90.7% (95% CI: 88.3%–92.7%) (>82.5%).21 Moreover, the high DOR values, especially for RDR (286.1), show the effectiveness of using the Remidio FOP with an AI algorithm to screen for DR. However, the results of the pooled sensitivity and specificity with its narrow confidence intervals should be taken into consideration with respect to the wide confidence intervals in the study by Natarajan et al. which has the lowest number of cases analyzed in comparison to the other studies.
We estimated the positive and negative predictive values of AI diagnosing DR using an estimated Indian diabetic population of 6.45 million at 13% DR prevalence rate. The positive predictive value ranged from 42.9% to 74.0% while the negative predictive value ranged from 97.5% to 99.2% [Figure 6]. Similarly, we estimated the positive and negative predictive values of AI in diagnosing RDR in an Indian diabetic population of 6.45 million at a 2% prevalence rate. The positive predictive value ranged from 6.1% to 20.3% while the negative predictive value ranged from 99.9% to 100.0% [Figure 7]. Therefore, it is concluded that when the result of smartphone-based AI for DR or RDR is negative, there is no real concern about the “missing DR or RDR patient.” This is a major priority in a screening program whereas positive results may not necessarily be true.
There have been recent studies looking at DR screening using smartphone-based fundus imaging in India, but to our knowledge, this is the first meta-analysis that has been conducted on smartphone-enabled AI programs.22,23 By combining the findings of relatively small studies, our analysis shows that there are high levels of diagnostic accuracy values associated with using such an intervention in a clinical setting, with narrow confidence intervals [Table 1]. The high DOR values for DR and RDR in particular show how effective this diagnostic test is for screening DR.
The studies included in the review are all well-conducted cross-sectional studies carried out in India. They all answer a clear question and indicate inclusion and exclusion criterion for sampling. A sample size calculation was used to ensure an appropriate number of participants joined the study, and values for statistical significance and confidence intervals were given. Remidio FOP with grading through an AI software was compared with a reference standard of trained ophthalmologists. The latter was used to generate ground truth in each study. Both Sosale et al. and Rajalakshmi et al. used an adjudicated image grading by two retinal specialists to set ground truth, whereas Aravind et al. used the majority diagnosis of five retina specialists and Natarajan et al. used a grading set by one or more ophthalmologists. The disease status of the patients was described, such as the grade of their DR and whether it was referable or not. Finally, all four studies described a clear methodology on how the images were obtained. As assessed by the QUADAS-2 tool, bias such as selection bias is minimal as the few patients who were excluded from each study were done so due to different characteristics such as having retinal vein occlusion. Our analysis also showed that low levels of publication bias within the select substantial levels of heterogeneity in the effect size were shown through the statistical analysis for DR and RDR [Figures 2 and 4]. This can be explained by variations in the study designs of the individual studies. For example, the participants in the study conducted by Nataranjan et al. were from a community setting, whereas the other studies had participants who were tested in an outpatient setting within tertiary care. There are also some differences in the types of images captured in the studies. For example, Aravind et al. only used nonmydriatic images, whereas the other three studies including the one Murthy et al. used tropicamide eye drops to dilate the eyes of the patients.
Rajalakshmi et al. used a different AI software compared to the other three studies, even though all four used the Remidio FOP for fundus imaging. The differences in AI software may impact the diagnostic accuracy values of the images and can be an explanation for the levels of heterogeneity. For example, Medios technologies use a neural network responsible for quality assessment based on a MobileNet architecture. It consists of a binary classifier trained with images deemed as ungradable as well as with images deemed of sufficient quality.9 If the output is negative, a message prompts the user to recapture the image. The other two neural networks are based on an Inception-V3 architecture and have been trained to separate healthy images from images with RDR (moderate nonproliferative DR and above). The final output is a binary recommendation or referral to an ophthalmologist. The software was trained on images obtained from the EyePACS dataset as well as images obtained with the Remidio FOP and a KOWA vx-10 mydriatic camera.
In contrast, the EyeArt™ software used by Rajalakshmi et al. is trained on retinal images from fundus cameras such as the Zeiss FF450, as well as from the EyePACS database.24 The software is computerized and cloud based, and its core analysis engine contains DR analysis algorithms including those for image enhancement, interest region identification, descriptor computation, in conjunction with an ensemble of deep artificial neural networks for DR classification, and detection of clinically significant macular edema surrogate markers. It automatically provides an analysis of retinal images and DR severity level.
Another limitation of this meta-analysis is the small number of studies included. Even though to date, these are the only studies available to answer the research question, the sample sizes of the individual studies are relatively small. Although relatively few images were excluded from the individual studies because they were “ungradable,” this could be as a result of selection bias as patients included in the studies tended to be known diabetics. Therefore, patients enrolled into the study might be different and have had images that are more “gradable” compared to those who were excluded.
Finally, the studies using the Medios technologies AI algorithm state that “the current version of the offline mobile based-AI does not permit grading of retinopathy” and only allow images to be stratified as “referable or nonreferable”.8 This means the end user will not be aware of sight-threatening forms of DR, which may warrant a more urgent referral.
A smartphone-based AI intervention is a cheap, effective tool that can be upscaled to DR screening programs in remote areas. The offline AI software used in the studies of this meta-analysis has the potential of freeing up resources with regard to workforce planning, as less technical expertise by trained ophthalmologists to grade images will be required in the future. This time can be used by ophthalmologists to conduct other tasks such as performing cataract surgeries and treating retinal diseases. The availability of such interventions within primary care can also help to contribute in diagnosing and treating more patients with diabetes mellitus. However, further interventional studies in the form of randomized controlled trials are required to provide more evidence on the effectiveness of smartphone-based AI interventions. These trials can also help to test the diagnostic accuracy values of different AI algorithms, as well as providing evidence for potential modifications to devices produced by Remidio Innovative Solutions Pvt. Ltd, Bangalore, India, to obtain higher quality images. Moreover, such future studies could also look to provide a comparison and analysis between conventional fundus cameras and smartphone base fundus cameras.
Financial support and sponsorship
Nil.
Conflicts of interest
There are no conflicts of interest.
REFERENCES
- 1.Dankwa-Mullan I, Rivo M, Sepulveda M, Park Y, Snowdon J, Rhee K. Transforming diabetes care through artificial intelligence: The future is here. Popul Health Manag. 2019;22:229–42. doi: 10.1089/pop.2018.0129. [DOI] [PMC free article] [PubMed] [Google Scholar]
- 2.Fenner BJ, Wong RL, Lam WC, Tan GS, Cheung GC. Advances in retinal imaging and applications in diabetic retinopathy screening: A review. Ophthalmol Ther. 2018;7:333–46. doi: 10.1007/s40123-018-0153-7. [DOI] [PMC free article] [PubMed] [Google Scholar]
- 3.Garg SJ. Applicability of smartphone-based screening programs. JAMA Ophthalmol. 2016;134:158–9. doi: 10.1001/jamaophthalmol.2015.4823. [DOI] [PubMed] [Google Scholar]
- 4.Zheng Y, He M, Congdon N. The worldwide epidemic of diabetic retinopathy. Indian J Ophthalmol. 2012;60:428–31. doi: 10.4103/0301-4738.100542. [DOI] [PMC free article] [PubMed] [Google Scholar]
- 5.Madanagopalan V, Raman R. Commentary: Artificial intelligence and smartphone fundus photography photography lected studiesre studies could also look to provide a comparison and an Ophthalmol. 2020;68:396. doi: 10.4103/ijo.IJO_2175_19. [DOI] [PMC free article] [PubMed] [Google Scholar]
- 6.Liu TY. Smartphone-based, artificial intelligence-enabled diabetic retinopathy screening. JAMA Ophthalmol. 2019;137:1188–9. doi: 10.1001/jamaophthalmol.2019.2883. [DOI] [PubMed] [Google Scholar]
- 7.Rajalakshmi R, Subashini R, Anjana RM, Mohan V. Automated diabetic retinopathy detection in smartphone-based fundus photography using artificial intelligence. Eye (Lond) 2018;32:1138–44. doi: 10.1038/s41433-018-0064-9. [DOI] [PMC free article] [PubMed] [Google Scholar]
- 8.Natarajan S, Jain A, Krishnan R, Rogye A, Sivaprasad S. Diagnostic accuracy of community-based diabetic retinopathy screening with an offline artificial intelligence system on a smartphone. JAMA Ophthalmol. 2019;137:1182–8. doi: 10.1001/jamaophthalmol.2019.2923. [DOI] [PMC free article] [PubMed] [Google Scholar]
- 9.Sosale B, Aravind SR, Murthy H, Narayana S, Sharma U, Gowda SG, et al. Simple, mobile-based artificial intelligence algorithm in the detection of Diabetic Retinopathy (SMART) study. BMJ Open Diabetes Res Care. 2020;8:e000892. doi: 10.1136/bmjdrc-2019-000892. [DOI] [PMC free article] [PubMed] [Google Scholar]
- 10.Š000892n AM. Measures of diagnostic accuracy: Basic definitions. EJIFCC. 2009;19:203–11. [PMC free article] [PubMed] [Google Scholar]
- 11.Baratloo A, Hosseini M, Negida A, El Ashal G. Part 1: Simple definition and calculation of accuracy, sensitivity and specificity. Emergency (Tehran, Iran) 2015;3:48–9. [PMC free article] [PubMed] [Google Scholar]
- 12.Gadkari SS, Maskati QB, Nayak BK. Prevalence of diabetic retinopathy in India: The All India Ophthalmological Society Diabetic Retinopathy Eye Screening Study 2014. Indian J Ophthalmol. 2016;64:38–44. doi: 10.4103/0301-4738.178144. [DOI] [PMC free article] [PubMed] [Google Scholar]
- 13.Kulkarni S, Kondalkar S, Mactaggart I, Shamanna BR, Lodhi A, Mendke R, et al. Estimating the magnitude of diabetes mellitus and diabetic retinopathy in an older age urban population in Pune, western India. BMJ Open Ophthalmol. 2019;4:e000201. doi: 10.1136/bmjophth-2018-000201. [DOI] [PMC free article] [PubMed] [Google Scholar]
- 14.Raman R, Gella L, Srinivasan S, Sharma T. Diabetic retinopathy: An epidemic at home and around the world. Indian J Ophthalmol. 2016;64:69–75. doi: 10.4103/0301-4738.178150. [DOI] [PMC free article] [PubMed] [Google Scholar]
- 15.Higgins JP, Thompson SG, Deeks JJ, Altman DG. Measuring inconsistency in meta-analyses. BMJ. 2003;327:557–60. doi: 10.1136/bmj.327.7414.557. [DOI] [PMC free article] [PubMed] [Google Scholar]
- 16.Peters JL, Sutton AJ, Jones DR, Abrams KR, Rushton L. Contour-enhanced meta-analysis funnel plots help distinguish publication bias from other causes of asymmetry. J Clin Epidemiol. 2008;61:991–6. doi: 10.1016/j.jclinepi.2007.11.010. [DOI] [PubMed] [Google Scholar]
- 17.Lin L, Chu H. Quantifying publication bias in meta-analysis. Biometrics. 2018;74:785–94. doi: 10.1111/biom.12817. [DOI] [PMC free article] [PubMed] [Google Scholar]
- 18.StataCorp. Stata Statistical Software: Release 16. College Station, TX: StataCorp LLC; 2020. [Google Scholar]
- 19.Review Manager (RevMan). The Cochrane Collaboration. Copenhagen: The Nordic Cochrane Centre. 2020. [Accessed on 2021 Mar 03]. Available from: https://training.cochrane.org/online-learning/core-software-cochrane-reviews/revman/revman-5-download .
- 20.Sosale B, Sosale AR, Murthy H, Sengupta S, Naveenam M. Medios – An offline, smartphone-based artificial intelligence algorithm for the diagnosis of diabetic retinopathy. Indian J Ophthalmol. 2020;68:391–5. doi: 10.4103/ijo.IJO_1203_19. [DOI] [PMC free article] [PubMed] [Google Scholar]
- 21.Abr-5alm MD, Lavin PT, Birch M, Shah N, Folk JC. Pivotal trial of an autonomous AI-based diagnostic system for detection of diabetic retinopathy in primary care offices. NPJ Digit Med. 2018;1:39. doi: 10.1038/s41746-018-0040-6. [DOI] [PMC free article] [PubMed] [Google Scholar]
- 22.Prathiba V, Rajalakshmi R, Arulmalar S, Usha M, Subhashini R, Gilbert CE, et al. Accuracy of the smartphone-based nonmydriatic retinal camera in the detection of sight-threatening diabetic retinopathy. Indian J Ophthalmol. 2020;68(Suppl 1):S42–6. doi: 10.4103/ijo.IJO_1937_19. [DOI] [PMC free article] [PubMed] [Google Scholar]
- 23.Wintergerst MW, Mishra DK, Hartmann L, Shah P, Konana VK, Sagar P, et al. Diabetic retinopathy screening using smartphone-based fundus imaging in India. Ophthalmology. 2020;127:1529–38. doi: 10.1016/j.ophtha.2020.05.025. [DOI] [PubMed] [Google Scholar]
- 24.Bhaskaranand M, Ramachandra C, Bhat S, Cuadros J, Nittala MG, Sadda S, et al. Automated diabetic retinopathy screening and monitoring using retinal fundus image analysis. J Diabetes Sci Technol. 2016;10:254–61. doi: 10.1177/1932296816628546. [DOI] [PMC free article] [PubMed] [Google Scholar]


