Abstract
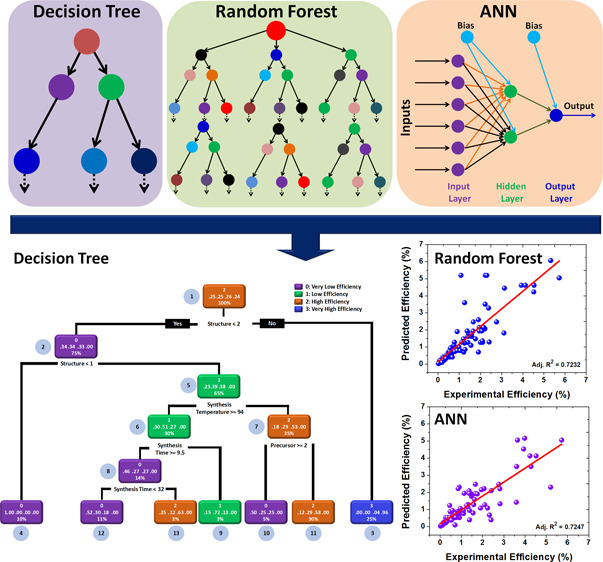
Dye-sensitized solar cells (DSSCs) are one of the most versatile and low-cost solar cells. However, DSSCs are prone to low power conversion efficiency (PCE) compared to their counterparts, owing to their different synthesis parameters and process conditions. Therefore, designing efficient DSSCs and identifying the parameters that control the PCE of DSSCs are a critical tasks. We have collected data from hydrothermally synthesized DSSCs in the present work, published from 2005 to 2020. In line with publishing trends in the said period, we evaluate ZnO as a popular photoactive material for DSSC applications. We further analyzed the performance of hydrothermally synthesized ZnO DSSCs using different statistical techniques and provided some significant insights. We further applied the machine-learning technique with a decision tree algorithm to understand and discover the possible set of rules and heuristics that govern the morphology of the hydrothermally grown ZnO. In addition, we also employed supervised and unsupervised machine-learning models using conventional decision trees and classification and regression trees, respectively, to identify the dependence of the PCE of ZnO DSSCs on the different synthesis parameters. The reported work also evidences the PCE predictions of the ZnO DSSCs by using random forest and artificial neural network algorithms. The results substantiate that the random forest and artificial neural network algorithms successfully predict the PCE of the ZnO DSSCs with reasonable accuracy. Thus, we present a novel approach of applying statistical analysis and machine-learning algorithms to understand, discover, and predict the performance of DSSCs. We recommend extending the said know-how to other solar cells to identify rules and heuristics and experimentally realize highly efficient solar cells in shrinking manufacturing windows with a cost-effective approach.
1. Introduction
Machine learning (ML) has made a remarkable impact on the materials science and energy sector by discovering the hidden patterns and heuristics of many materials and devices at lower computational cost and time.1−3 The new insights provided by the ML models are scientifically and technologically relevant, and they help accelerate the discovery of new materials.4 For instance, the fabrication of highly efficient solar cells requires in-depth knowledge of physical processes and insights into the experimental procedures. Many variables in the above said experimental procedures compete to have a trade-off affecting the device’s performance. Therefore, it is an arduous task for conventional modeling and simulation methods to discover new materials and predict the device properties.5
On the other hand, ML uses the black-box approach to discover properties and correlations between physical and chemical parameters which are otherwise unattainable by traditional methods.6 In ML-assisted solar energy research, most of the time, the data set is created by using density functional theory calculations. However, this approach has very high computational costs, poor scaling, and a homogeneous data set, limiting its effectiveness for general purpose applications.7 Considering this, designing an ML model based on experimentally available data can become an effective solution, and such approaches have paved the way to outstanding results.8,9 Dye-sensitized solar cells (DSSCs), the subject for investigation in this research, are considered low-cost and promising solutions to overcome the current energy-related issues.10 In recent years, the photovoltaic research community has been looking forward to providing highly efficient solar cells based on the DSSC principle. Many researchers are trying hard to achieve this goal. The popularity of DSSCs lies in its low-cost solution-processable synthesis techniques, simple device design, and scale-up possibilities.11,12 The Scopus database reveals more than 25 thousand research articles published on DSSCs. It seems that this number will proliferate in the future (Scopus search keyword: DSSCs). The Scopus data showcases many researchers adopting different approaches with a broad range of combinations of oxide materials, precursors, dyes, and various synthesis methods to obtain highly efficient DSSCs. These combinations challenge the early-stage researcher to select a particular material and the combinations thereof and develop efficient solar cells in a minimal development time window. Moreover, there are still significant gaps in the research and many impediments in front of the scientific and industrial community to overcome the different issues and challenges of DSSC technology that are perceived to be addressed by applying techniques like ML.13,14
In the DSSC research field, ZnO-based DSSCs are one of the hot topics of research.15,16 The popularity of ZnO-based DSSCs lies in the availability of a low-cost precursor, easy synthesis and manufacturability of ZnO powder and thin films, control over different morphologies of ZnO, and well-known scientific understanding of ZnO’s physical, chemical, structural, morphological, and electrical properties.17 These important parameters make ZnO a potential candidate for low-cost DSSC applications. In the case of ZnO synthesis, different techniques are available such as the hydrothermal method, the sol–gel method, spray pyrolysis, spin coating, dip coating, successive ionic layer adsorption and reaction, and so forth. Among the many synthesis techniques, the hydrothermal method is proven to be the best technique to grow different micro- and nanostructures and also provide the best-in-class physical and chemical properties.18 Furthermore, the hydrothermal method is useful to obtain reliable and repeatable ZnO powder and thin films for DSSC application.19
Considering the research scenario depicted above, we report research investigations emanating in three main directions. The said directions are (i) statistical analysis of DSSCs based on hydrothermally grown ZnO, (ii) understanding the possible set of rules and heuristics which govern the morphology and power conversion efficiency (PCE) of the ZnO DSSCs by using a decision tree algorithm, and (iii) prediction of efficiencies using random forest and artificial neural network (ANN) algorithms. Looking at the data-intensive approach implicit in ML, more than 150 research articles related to this field were delved to put in place a data set of 298 experimental observations. Our investigations also explore the effect of different synthesis parameters on the morphology of ZnO. Furthermore, with the help of different statistical measures, we have investigated the effect of different precursors, dyes, synthesis time, synthesis temperature, and seed layer on the efficiencies of the hydrothermally grown ZnO DSSCs. Additionally, we explored the effect of different variables and yearly progress of the ZnO DSSC field from 2005 to 2020 through reported publications using the bubble chart method. Our investigation provides some key insights related to this field and gives researchers direction for understanding, optimizing, and improving the overall PCE of hydrothermally grown ZnO DSSCs. Finally, we conclude that the present approach can be extended to other types of solar cells as well. The present paper comprises different sections. After introducing the theme, the second section deals with the data set preparation. The data set thus prepared is further processed through statistical analysis. This is followed by the application of ML algorithms and thereafter discussion of results and conclusion.
2. Results and Discussion
2.1. Statistical Analysis for Implementing ML Methodology
As stated in the Introduction, the present research aims to apply ML algorithms to predict optimum parameters, leading to an accurate model that leads to efficient DSSCs. Success lies in selecting the size and quality of data sets followed by deciding the dependent and independent variables, with which one can tweak the algorithms. Previous sections have reported the data-gathering process, while this section presents the process and criterion for zeroing down on dependent and independent variables.
The typical DSSC structure consists of a photoanode, a dye sensitizer, a counter electrode, and an electrolyte.20 In this work, we have investigated the role of the hydrothermally synthesized ZnO as a photoanode for DSSC application. In most experimental DSSCs, the counter electrode is always a fluorine- or indium-doped tin oxide (FTO or ITO) substrate. Similarly, iodide/triiodide (I–/I3–) is a common electrolyte used in most experimental DSSCs. Therefore, the counter electrode and electrolyte are the statistically insignificant variables for the present analysis and prediction purposes. Figure 1 presents the infographics of the data set used in the present investigation. The year-wise distribution of the published articles and experimental observation is shown in Figure 1a,b, respectively, forming the standard repository for the investigation. These figures indicate a trend that ZnO DSSC-based research papers favored more publication between 2010 and 2015. Further decline in the overall growth in the DSSC research is evident, which might be attributed to the emergence of perovskite solar cells. In fact, the research on perovskite materials was started due to the discovery of an alternative absorber material for DSSCs.8 The holistic picture is realized by categorizing different ZnO structures into four major types: microstructure, 1D nanostructure, 2D nanostructure, and 3D nanostructure. The different substructure categorization is shown in Figure 1c. The number of experimental observations of each case is shown in the bracket. These results indicate that the hydrothermal synthesis process can produce different kinds of morphologies using ZnO as a model material.21,22 In addition to morphology, we have also investigated the effect of different precursors, dyes, hydrothermal synthesis time, hydrothermal synthesis temperature, and seed layers on the PCE of the hydrothermally synthesized ZnO DSSCs. The box plot and statistical measures related to the PCE, synthesis temperature, and synthesis time of the hydrothermally synthesized ZnO DSSCs are shown in Figure 1d–f, respectively. The data points are shown using blue, red, and orange spheres (298 data points) together with a box plot to comprehend the variability of the experimental observations. The mentioned statistical analysis makes us understand the relationship between the ZnO morphology and its effect on the PCE of the DSSCs.
Figure 1.
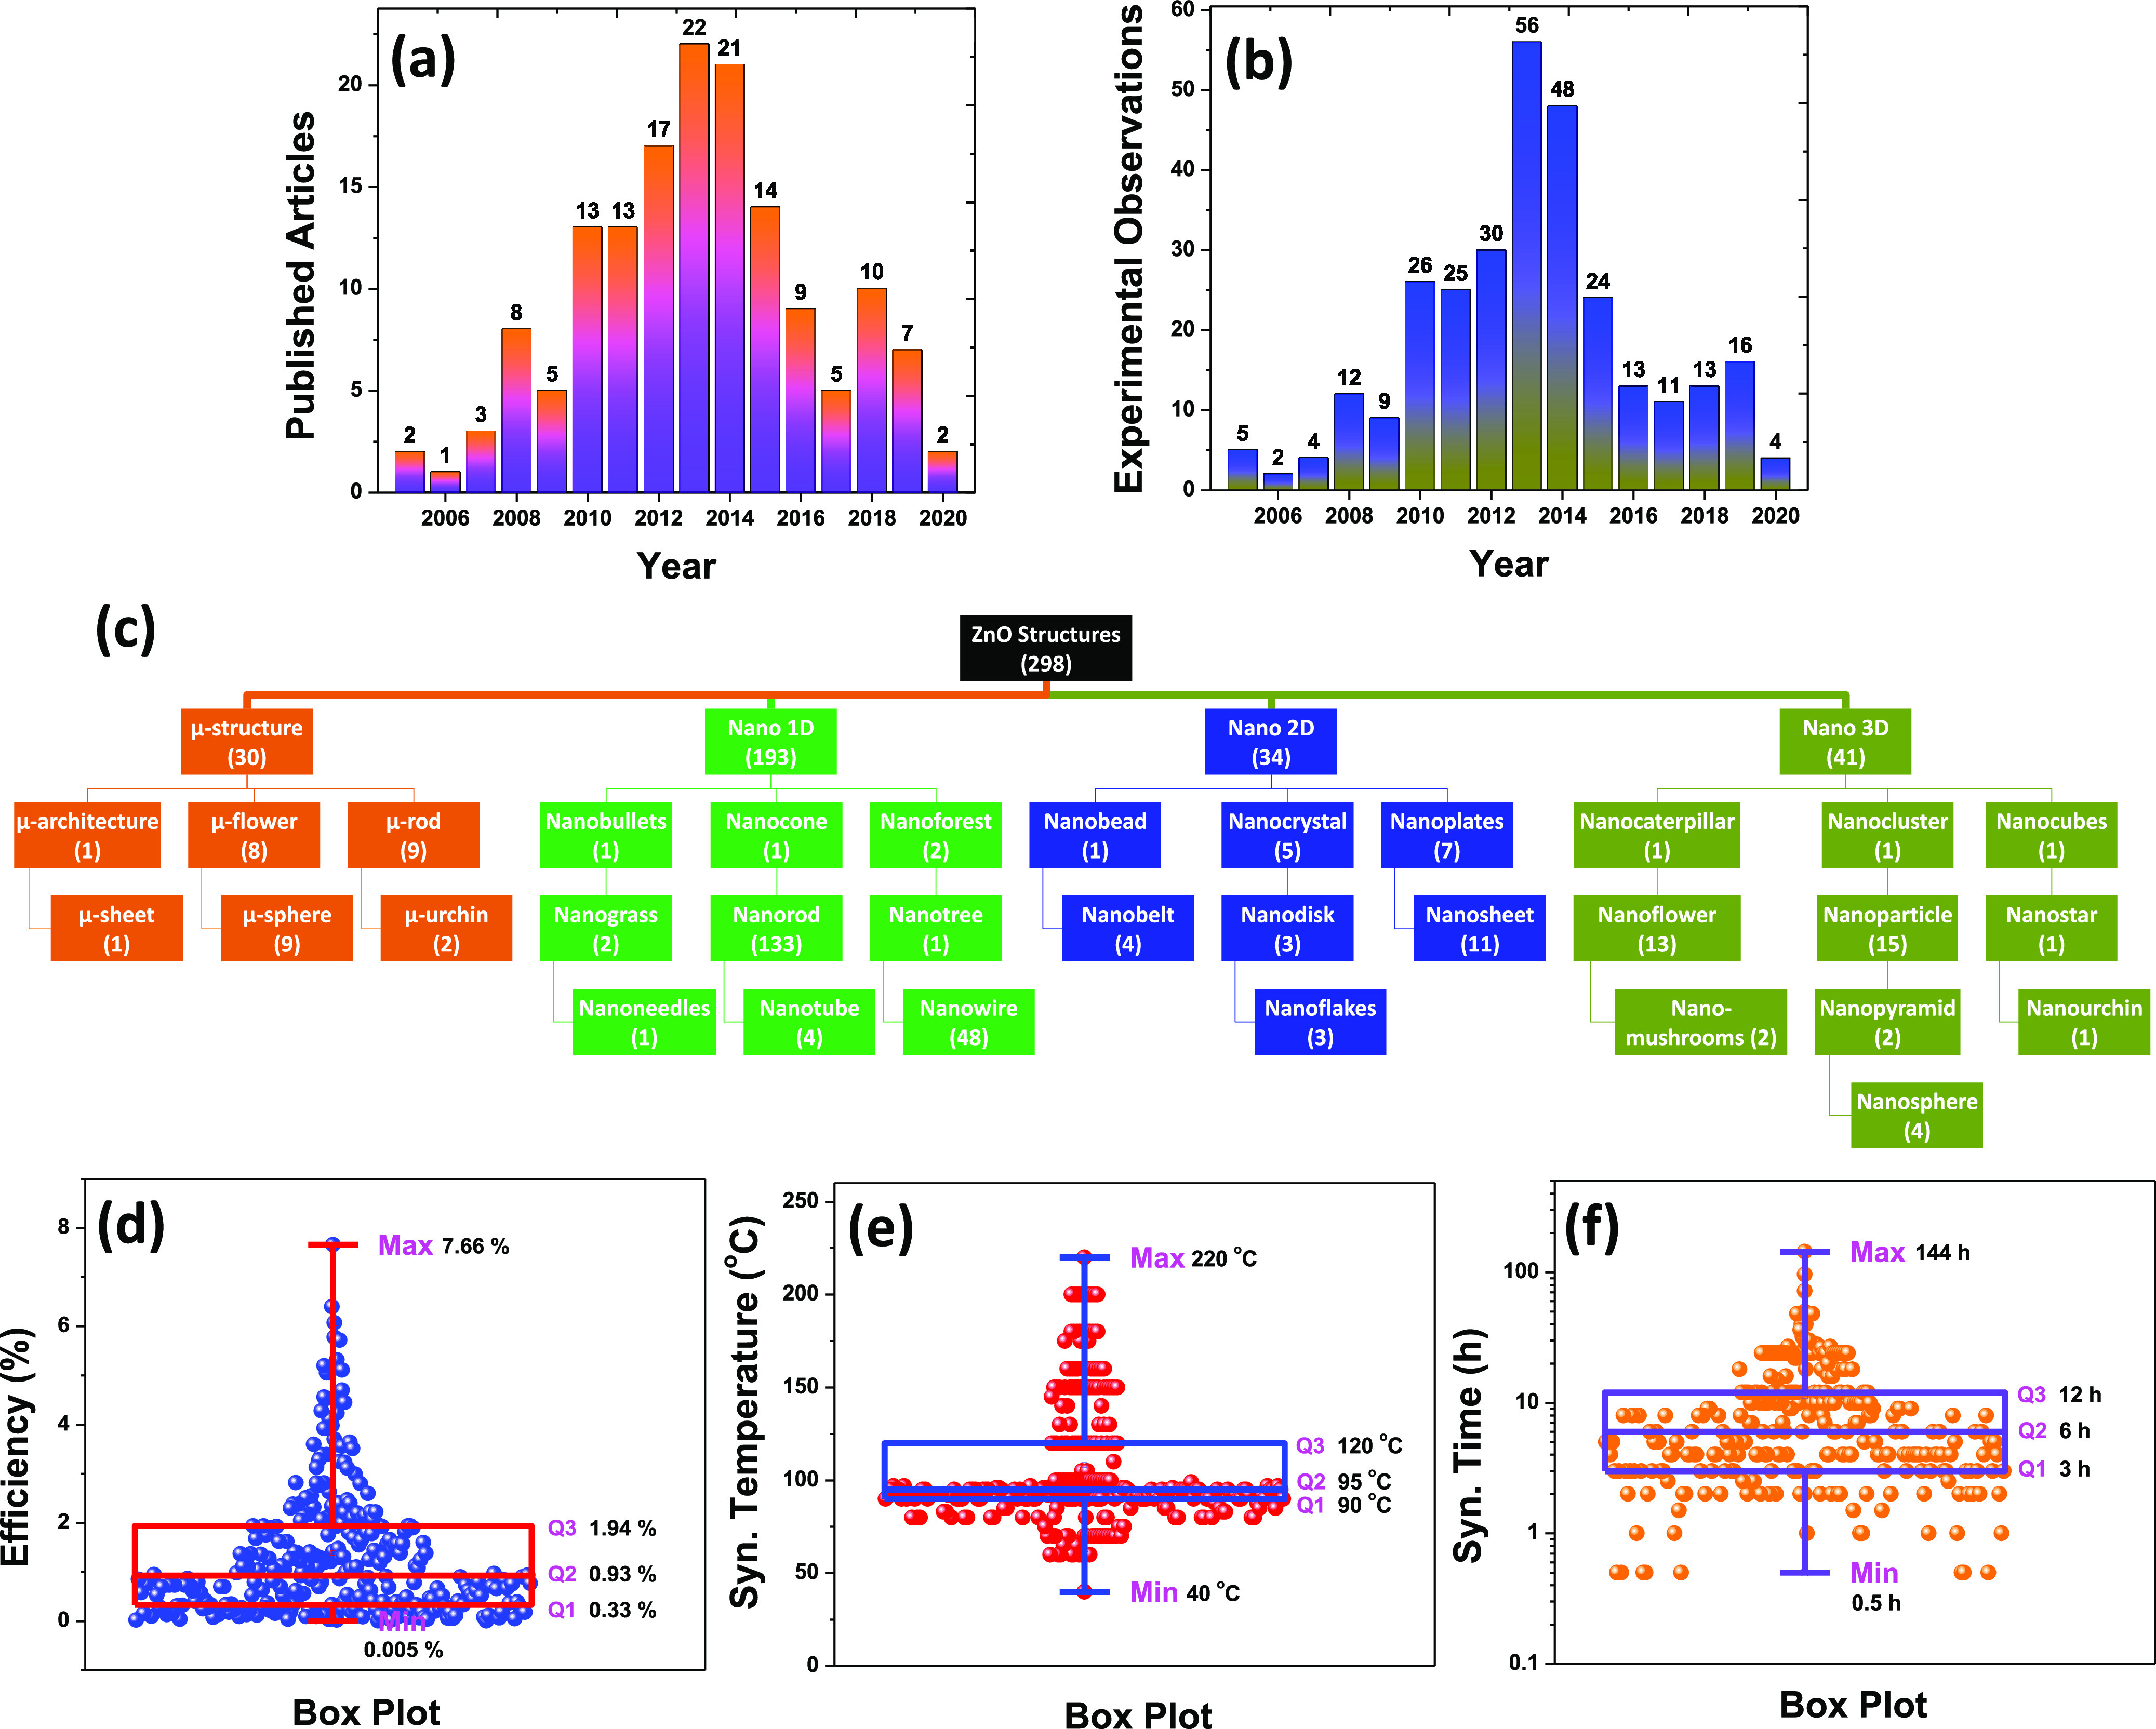
Representation of the data set used in the present investigation. (a) Distribution of the published articles and corresponding year of publication. (b) Distribution of the experimental observation and corresponding year of publication. (c) Classification of the different ZnO structures and corresponding substructures. Box plot and statistical measures related to the (d) PCE, (e) synthesis temperature, and (f) synthesis time of the hydrothermally synthesized ZnO DSSCs.
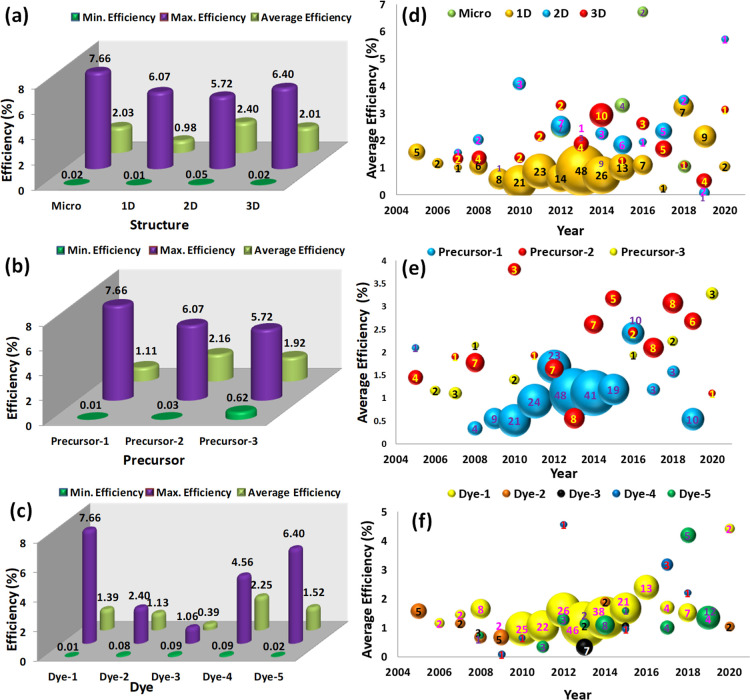
Figure 2 presents the effect of different process parameters on the PCE of the ZnO DSSCs. The statistical measures and year-wise comparative performance point out the parameters affecting the PCE of DSSCs. Figure 2a presents the effect of the ZnO morphology or structure on the PCE of DSSCs. The minimum PCE was found to be independent of the structure. However, the microstructure and 3D structure show higher PCEs than the other two structures. The results indicate that the microstructure and 2D and 3D nanostructures show better average efficiencies than the 1D structure. The resulting superior efficiencies may be attributed to the larger surface area in the microstructure and 2D and 3D nanostructures to capture incident photons and convert them into electrical energy.23 Furthermore, the higher surface area can help dye molecules absorb on the ZnO surface, which results in maximum visible-region photon absorption24 and delayed the interfacial charge recombination.25 The effect of the precursor on the PCE of the ZnO DSSCs is shown in Figure 2b. The results comprehensively indicate that the maximum PCE was recorded for precursor-1 (zinc nitrate). However, a large sample size of precursor-1 is affecting the average PCE of DSSCs. Precursor-2 (zinc acetate) shows the highest average PCE than the remaining two precursors. Interestingly, precursor-3 (zinc chloride) is the least reported chemical compound for ZnO DSSC application.
Figure 2.
(a) Structure-, (b) precursor-, and (c) dye-dependent minimum, maximum, and average efficiencies of the ZnO-based DSSCs. Comparison of the number of data points (bubble size) and average efficiencies of the ZnO-based DSSCs at different years based on the (d) structures, (e) precursors, and (f) dyes. The number of experimental observations is shown at the center of each bubble.
Figure 2c presents the dye-dependent minimum, maximum, and average efficiencies of the ZnO DSSCs. Dye-1 (N719) is the most effective dye to obtain highly efficient ZnO DSSCs. Furthermore, it is a frequently reported dye for DSSC applications, and its average efficiencies are also comparable with those of other dyes.26 Interestingly, dye-4 and dye-5 have also provided higher efficiencies than the remaining dyes, which intuitively conclude that there is room to achieve maximum efficiencies using dye-4 and dye-5. One more critical revelation is about some of the process parameters possessing surplus data points than the remaining ones; therefore, sample size contribution plays an essential role in the analysis. Given this, we have plotted the year-wise trend of the average efficiencies using a bubble plot. The comparison related to the data points (bubble size) and average efficiencies of ZnO-based DSSCs at different years based on the structures, precursors, and dyes is illustrated in Figure 2d–f, respectively. The trend indicates that though many researchers frequently report the 1D nanostructure, its average PCE is lower than that of microstructure- and 2D and 3D nanostructure-based DSSCs (Figure 2d). The bubble plot of different dyes implies that precursor-2 (zinc acetate) has good average PCE compared to that of the other two precursors (Figure 2e). However, precursor-1 (zinc nitrate) was found to be the most favored chemical compound for the hydrothermal synthesis of ZnO for DSSC application. The bubble plot of the dyes entails that dye-1 (N719) was the most effective and most used dye among all dyes (Figure 2f). The average efficiencies of the N719 dye were comparable to those of the other dyes.
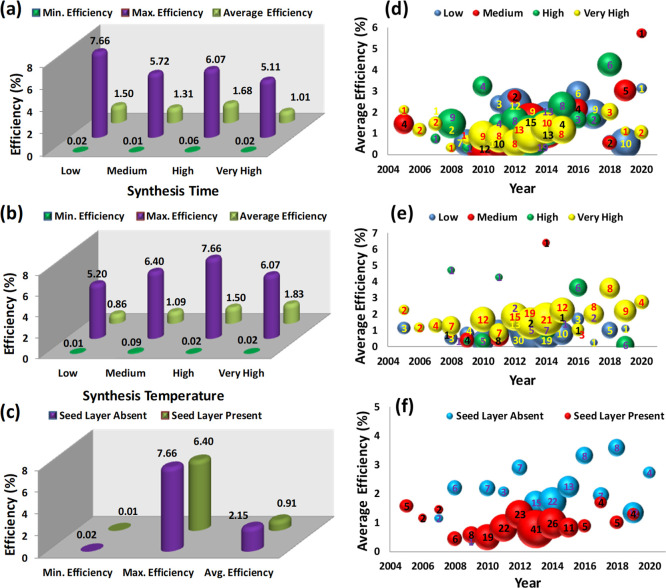
Nevertheless, another facet of the present research work investigates the role of the hydrothermal synthesis time, synthesis temperature, and seed layer on the PCE of the ZnO DSSCs. We applied the same methodology as reported previously to calculate statistical measures and plotted the data in a bubble plot format to understand the comparative performance. Subsequently, Figure 3a shows the effect of the hydrothermal synthesis time on the efficiencies of DSSCs. The results affirm that the low (0.5–3 h), medium (3–6 h), and high (6–12 h) hydrothermal synthesis time conditions result in maximum PCE. Furthermore, the average PCE also suggests that the lower hydrothermal synthesis time is a better option to realize highly efficient DSSCs. Additionally, the hydrothermal synthesis temperature also plays a vital role in DSSC operation. It is observed that the medium (90–95 °C), high (95–120 °C), and very high (120–220 °C) temperature conditions are the natural choice to fabricate efficient ZnO DSSCs (Figure 3b). Herein, both the average and maximum efficiencies are found to be higher for medium, high, and very high hydrothermal synthesis temperatures. It is a general presumption that a seed layer can improve the growth of the 1D nanostructure. However, our previous results (Figure 2a) suggested that the microstructure and 2D and 3D nanostructures show better average efficiencies than 1D structure-based ZnO DSSCs. Therefore, the effect of the seed layer (presence or absence) on the PCE of the ZnO DSSCs is shown in Figure 3c. The absence of the seed layer shows promising results in terms of all three statistical measures, that is, minimum, maximum, and average efficiencies. The year-wise comparative performance of different process parameters such as synthesis time, synthesis temperature, and the seed layer is presented using bubble plots, as shown in Figure 3d–f, respectively. Most of the synthesis time process conditions (low, medium, high, and very high) were explored equally by various research groups. However, a very high growth period only shows consistently poorer results than the remaining three cases (Figure 3d). On the other hand, medium, high, and very high hydrothermal synthesis temperatures are natural choices to obtain high-performance ZnO DSSCs (Figure 3e). The bubble plot of the seed layer clearly shows two separate regions and suggested that the researchers could achieve good average efficiencies whenever the seed layer was absent (Figure 3f).
Figure 3.
(a) Synthesis time-, (b) synthesis temperature-, and (c) seed layer-dependent minimum, maximum, and average efficiencies of the ZnO-based DSSCs. Comparison of the number of data points (bubble size) and average efficiencies of ZnO-based DSSCs at different years based on the (d) synthesis time, (e) synthesis temperature, and (f) seed layer. The number of experimental observations is shown at the center of each bubble.
2.2. Decision Tree-Based Heuristics for ZnO Synthesis and PCE Predictions
As revealed in the previous section, the statistical analysis provides a holistic picture of hydrothermally synthesized ZnO DSSCs. However, these techniques cannot provide significant insights and rules, leading to the highly efficient ZnO DSSCs. Considering these aspects, we have used the decision tree ML algorithm to obtain possible rules and heuristics from the data set. In particular, we have investigated different synthesis conditions and device parameters that affect the PCE of the ZnO DSSCs. At the outset, we aimed to look out for a possible set of rules and heuristics to obtain the different morphologies of ZnO. We intended to discover the inherent synthesis rules to obtain different morphologies of ZnO. For this, the data set was divided into four classes in line with the observed morphology of ZnO. These four classes are microstructure, nano-1D, nano-2D, and nano-3D structures. This is followed by formulating a decision tree based on the available data set, as shown in Figure 4. Different classes of the decision tree are highlighted in different colors. The decision rules were placed at the bottom of each decision node. The percentage numbers located at the bottom of each decision node represent the total data obeying the decision rule. The fraction numbers located in the middle of the decision node represent the probabilities of classes, and upper numbers (0–3) represent different classes.9 After executing the decision tree algorithm on the data set, we found that the decision tree splits from the root node (node-1), which consists of 100% data. The first split was done for the seed-layer level, and it checks the association rule: if the seed layer is present, then a nano-1D morphology can be obtained (node-2). Herein, the probability of the occurrence of a nano-1D morphology is 87%. If this condition was not satisfied, then the decision tree checks the other rules. In the negation case also, the decision tree shows the occurrence of a nano-1D morphology (node-3). However, the probability of this event is very low, that is, 29%. Therefore, the decision tree executes another rule. Herein, the decision tree splits into different branches and checks the rule: if the synthesis temperature is greater than or equal to 190 °C, then a nano-1D morphology can be obtained (probability: 90%, node-4); if a rule is not satisfied, then a nano-3D morphology can be obtained (probability: 30%, node-5). On a similar note, we recommend that prospective researchers can evaluate the outcomes of the present decision tree. Considering the various structure-related decision tree, we have made the following observations:
-
(i)
The microstructure morphology (node-12, probability: 50%) is achievable by synthesizing ZnO without the seed layer (node-1), synthesis temperature < 93 °C (nodes 8, 6, and 3), and precursor 1 (zinc nitrate, node-5). Additionally, the microstructure is attainable by maintaining the synthesis time less than 2.5 h (node-16) at synthesis temperatures greater than 93 °C (negation case, node-8, probability: 36%). There is another way to synthesize microstructured ZnO (node-14) by using precursors 2 (zinc acetate) and 3 (zinc chloride, node-5) with a synthesis time ≥ 9 h and synthesis temperature ≥ 140 °C. However, the probability of this case is 33%.
-
(ii)
The nano-1D morphology (nodes 1 and 2) can be obtained by the addition of the seed layer during the ZnO growth process (probability: 87%). When the seed layer is absent, one can also obtain the nano-1D morphology (nodes 4 and 17) by maintaining the synthesis temperature greater than 190 °C (node-3) and synthesis temperature less than 2.5 h (node-17). The nano-1D morphology (node-9) can also be obtained by maintaining the synthesis temperature from 168 °C to 190 °C and using precursor 1 (zinc nitrate). However, the probability of growth is low, that is, 35%.
-
(iii)
The nano-2D morphology (node-15) can be obtained without the seed layer (node-1), utilizing precursors 2 (zinc acetate) and 3 (zinc chloride, node-5), and maintaining the synthesis time ≥ 9 h (node-7) and synthesis temperature ≤ 140 °C (node-10, negation case). The synthesis probability of this case is high (75%).
-
(iv)
The nano-3D structure (node-11) can be effectively synthesized without the seed layer (node-1), maintaining the synthesis temperature ≤ 190 °C (node-3, negation case) and synthesis time ≤ 9 h (node-7, negation case). The said route is 53% effective in the synthesis of the nano-3D morphology and higher among other routes (nodes: 5, 6, 8, and 13).
Figure 4.
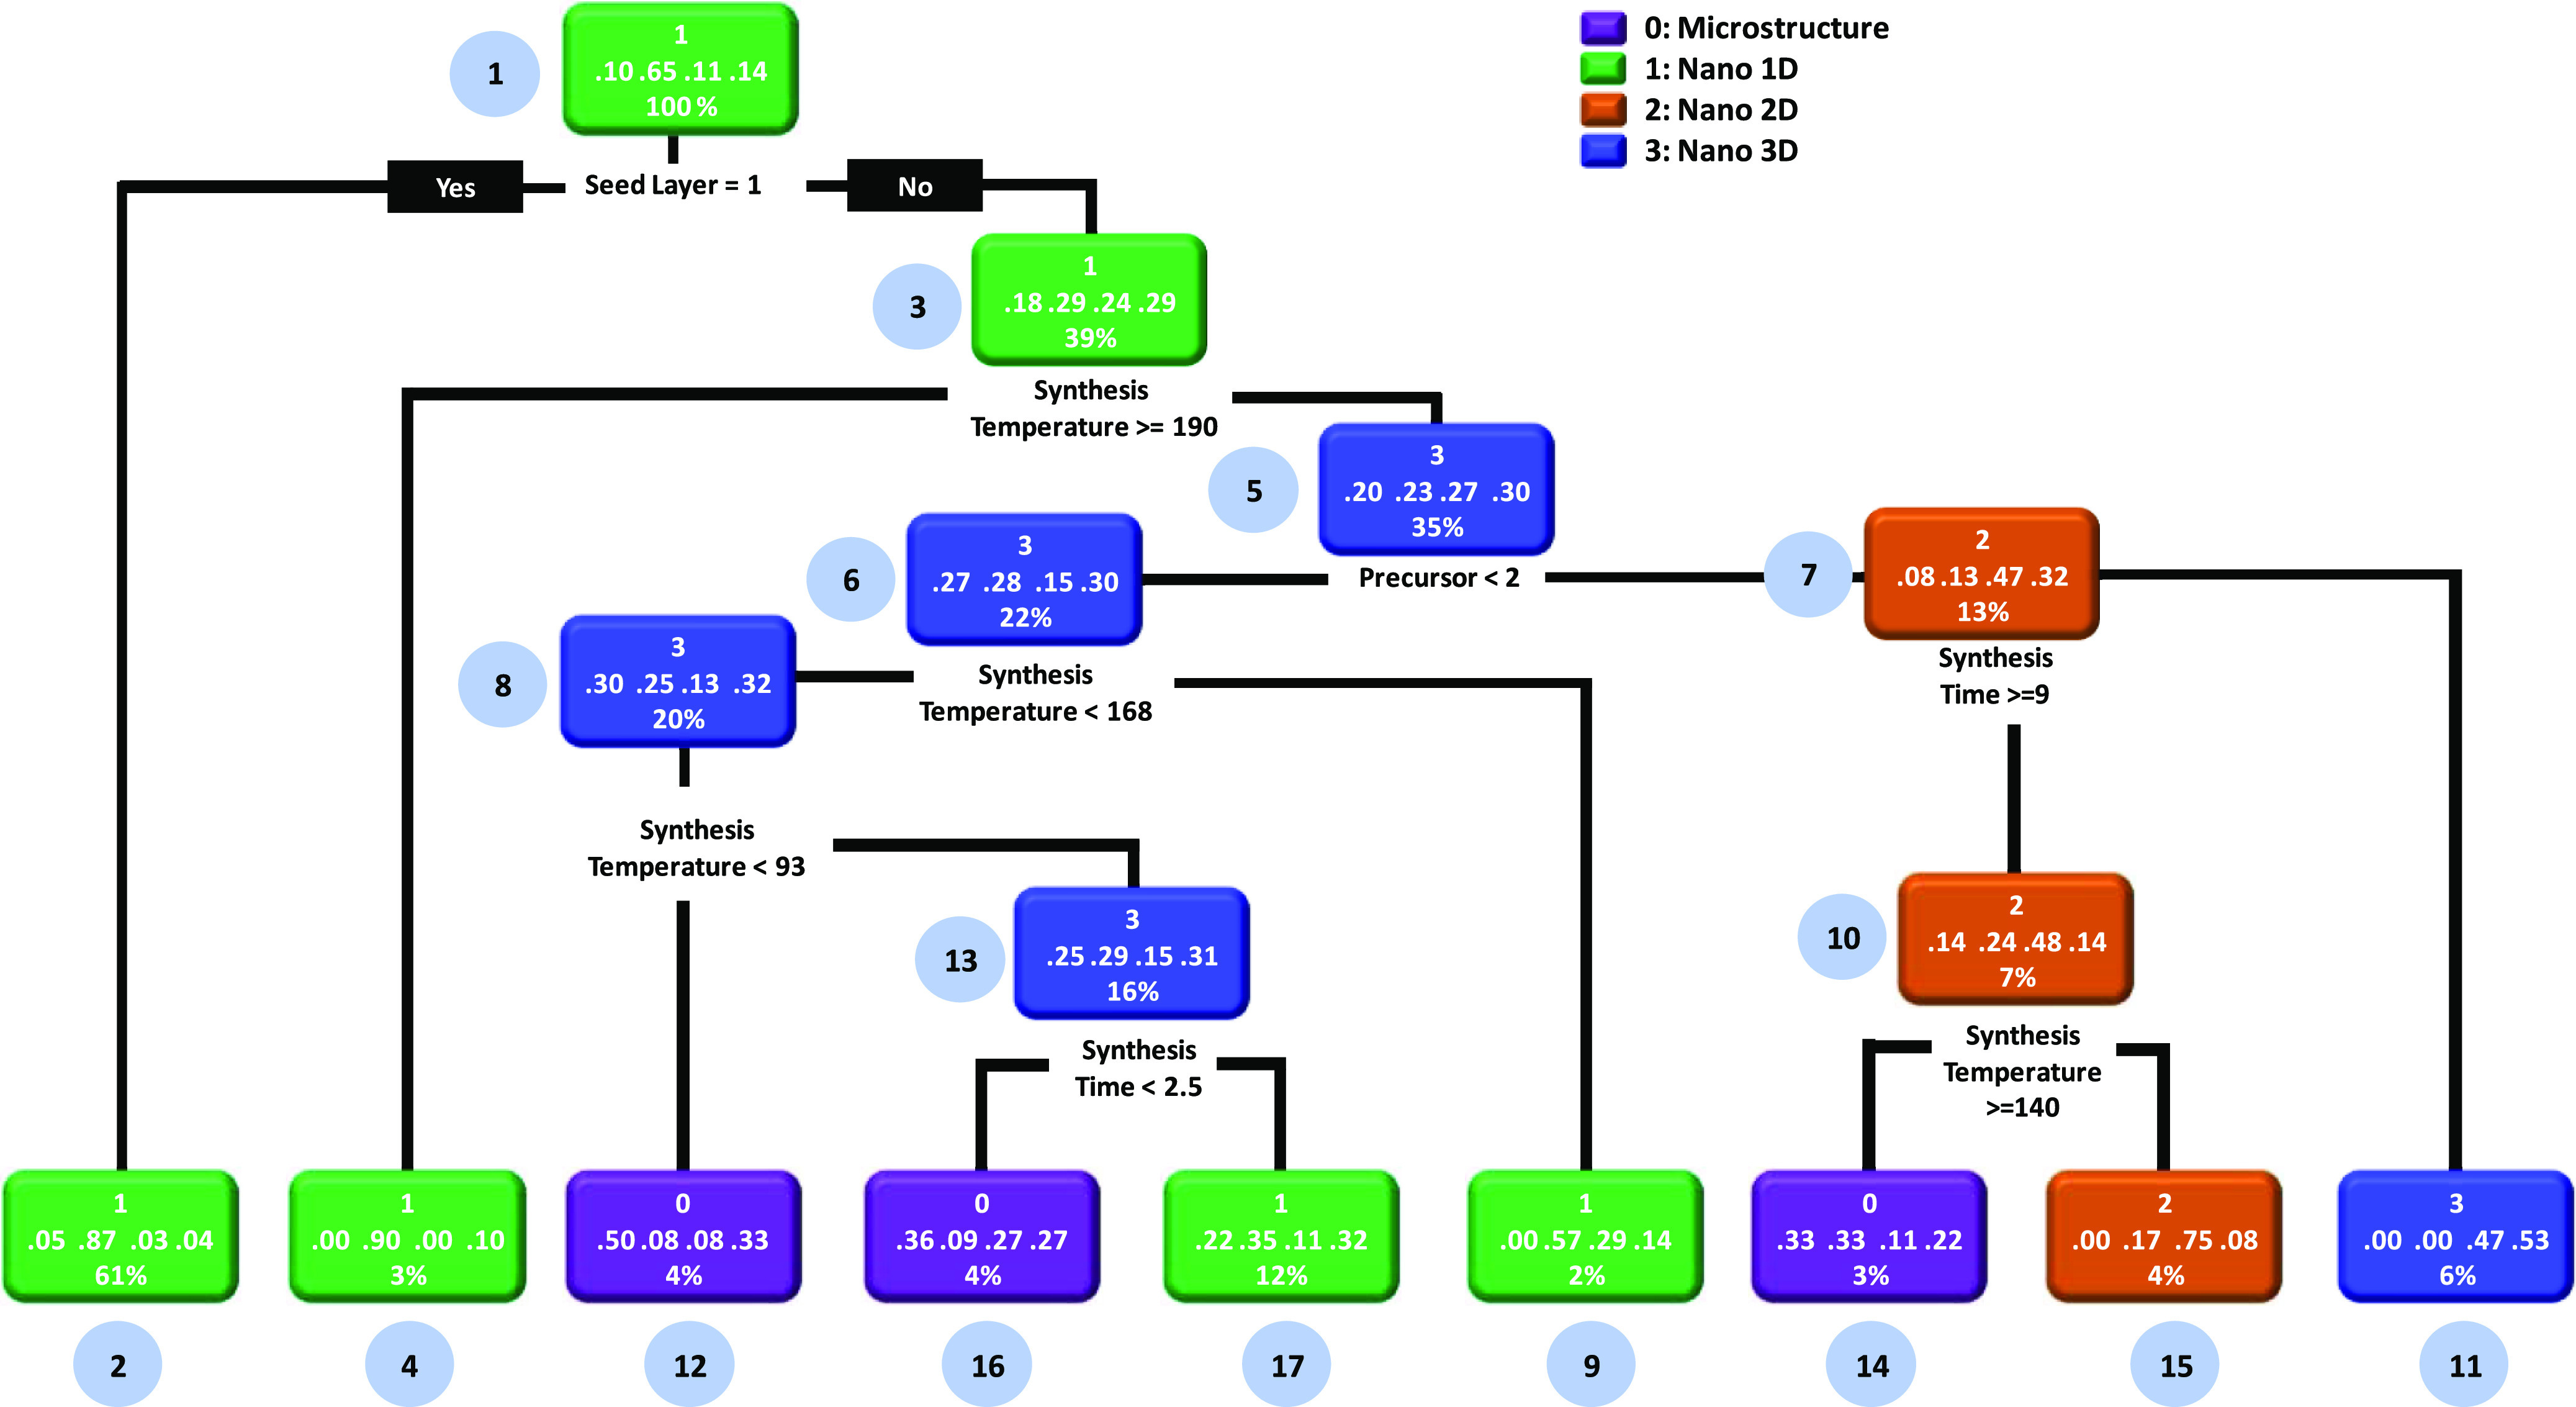
Decision tree model to identify possible rules and heuristics related to how synthesis conditions affect the morphology of ZnO. Herein, we have used the classification feature of the decision tree which provides different classes of structures/morphologies.
After executing the workflow of ML described above, in the next step, we obtain the possible set of rules and heuristics which govern the PCE of the ZnO DSSCs. The objective is to discover how synthesis conditions affect the PCE of the hydrothermally synthesized ZnO DSSCs. For this, we employed supervised and unsupervised learning algorithms of the decision tree. Figure 5 presents the supervised decision tree learning model of the ZnO DSSCs. This model employs the classification feature of the decision tree to discover the hidden set of rules and heuristics. This kind of model is beneficial for the qualitative segregation of the data. Given this, the root node (node-1) splits into two branches and checks the association rule: if the structure is greater than the 2D nanostructure, then very low PCE can be obtained (node-2, probability: 34%); otherwise, very high PCE can be obtained (negation case, node-3, probability: 96%). With this, it is evident that the morphology/structure is the most crucial factor to obtain efficient ZnO DSSCs. The remaining rules can be assessed by carefully examining the decision tree. Subsequently, for simplifying the workflow, we have made the following observation from the supervised decision-tree learning model:
-
(i)
Very low-PCE results are obtained with the microstructure and 1D nanostructure (node-2 and node-4). Additionally, very low PCE (node-12) is obtained by maintaining the synthesis temperature ≥ 94 °C (node-5) and synthesis time between 9.5 h (node-6) and 32 h (node-8). For the lower synthesis temperature (≤94 °C node-5, negation case), very low PCE (node-10) can be observed if precursors 2 (zinc acetate) and 3 (zinc chloride) are used during the synthesis (node-7).
-
(ii)
Low PCE (node-5, -6, and -9) can be observed in the case of the 1D nanostructure (node-2) and by maintaining the synthesis temperature ≥ 94 °C (node-5) and synthesis time ≤ 9.5 h (node-6, negation case).
-
(iii)
High PCE (node-13) can be obtained by synthesizing the 1D nanostructure (node-2, negation case) and synthesizing ZnO at a synthesis temperature ≥ 94 °C (node-5) and synthesis time > 32 h (node-8). On the other hand, high PCE (node-7 and 11) can also be obtained by synthesizing the 1D nanostructure (node-2, negation case) and synthesizing ZnO at a synthesis temperature ≤ 94 °C (node-5) with precursor-1 (zinc nitrate, node-7).
-
(iv)
Very high PCE (node-3) can be obtained by utilizing the 2D and 3D nanostructures (node-1, negation case).
Figure 5.
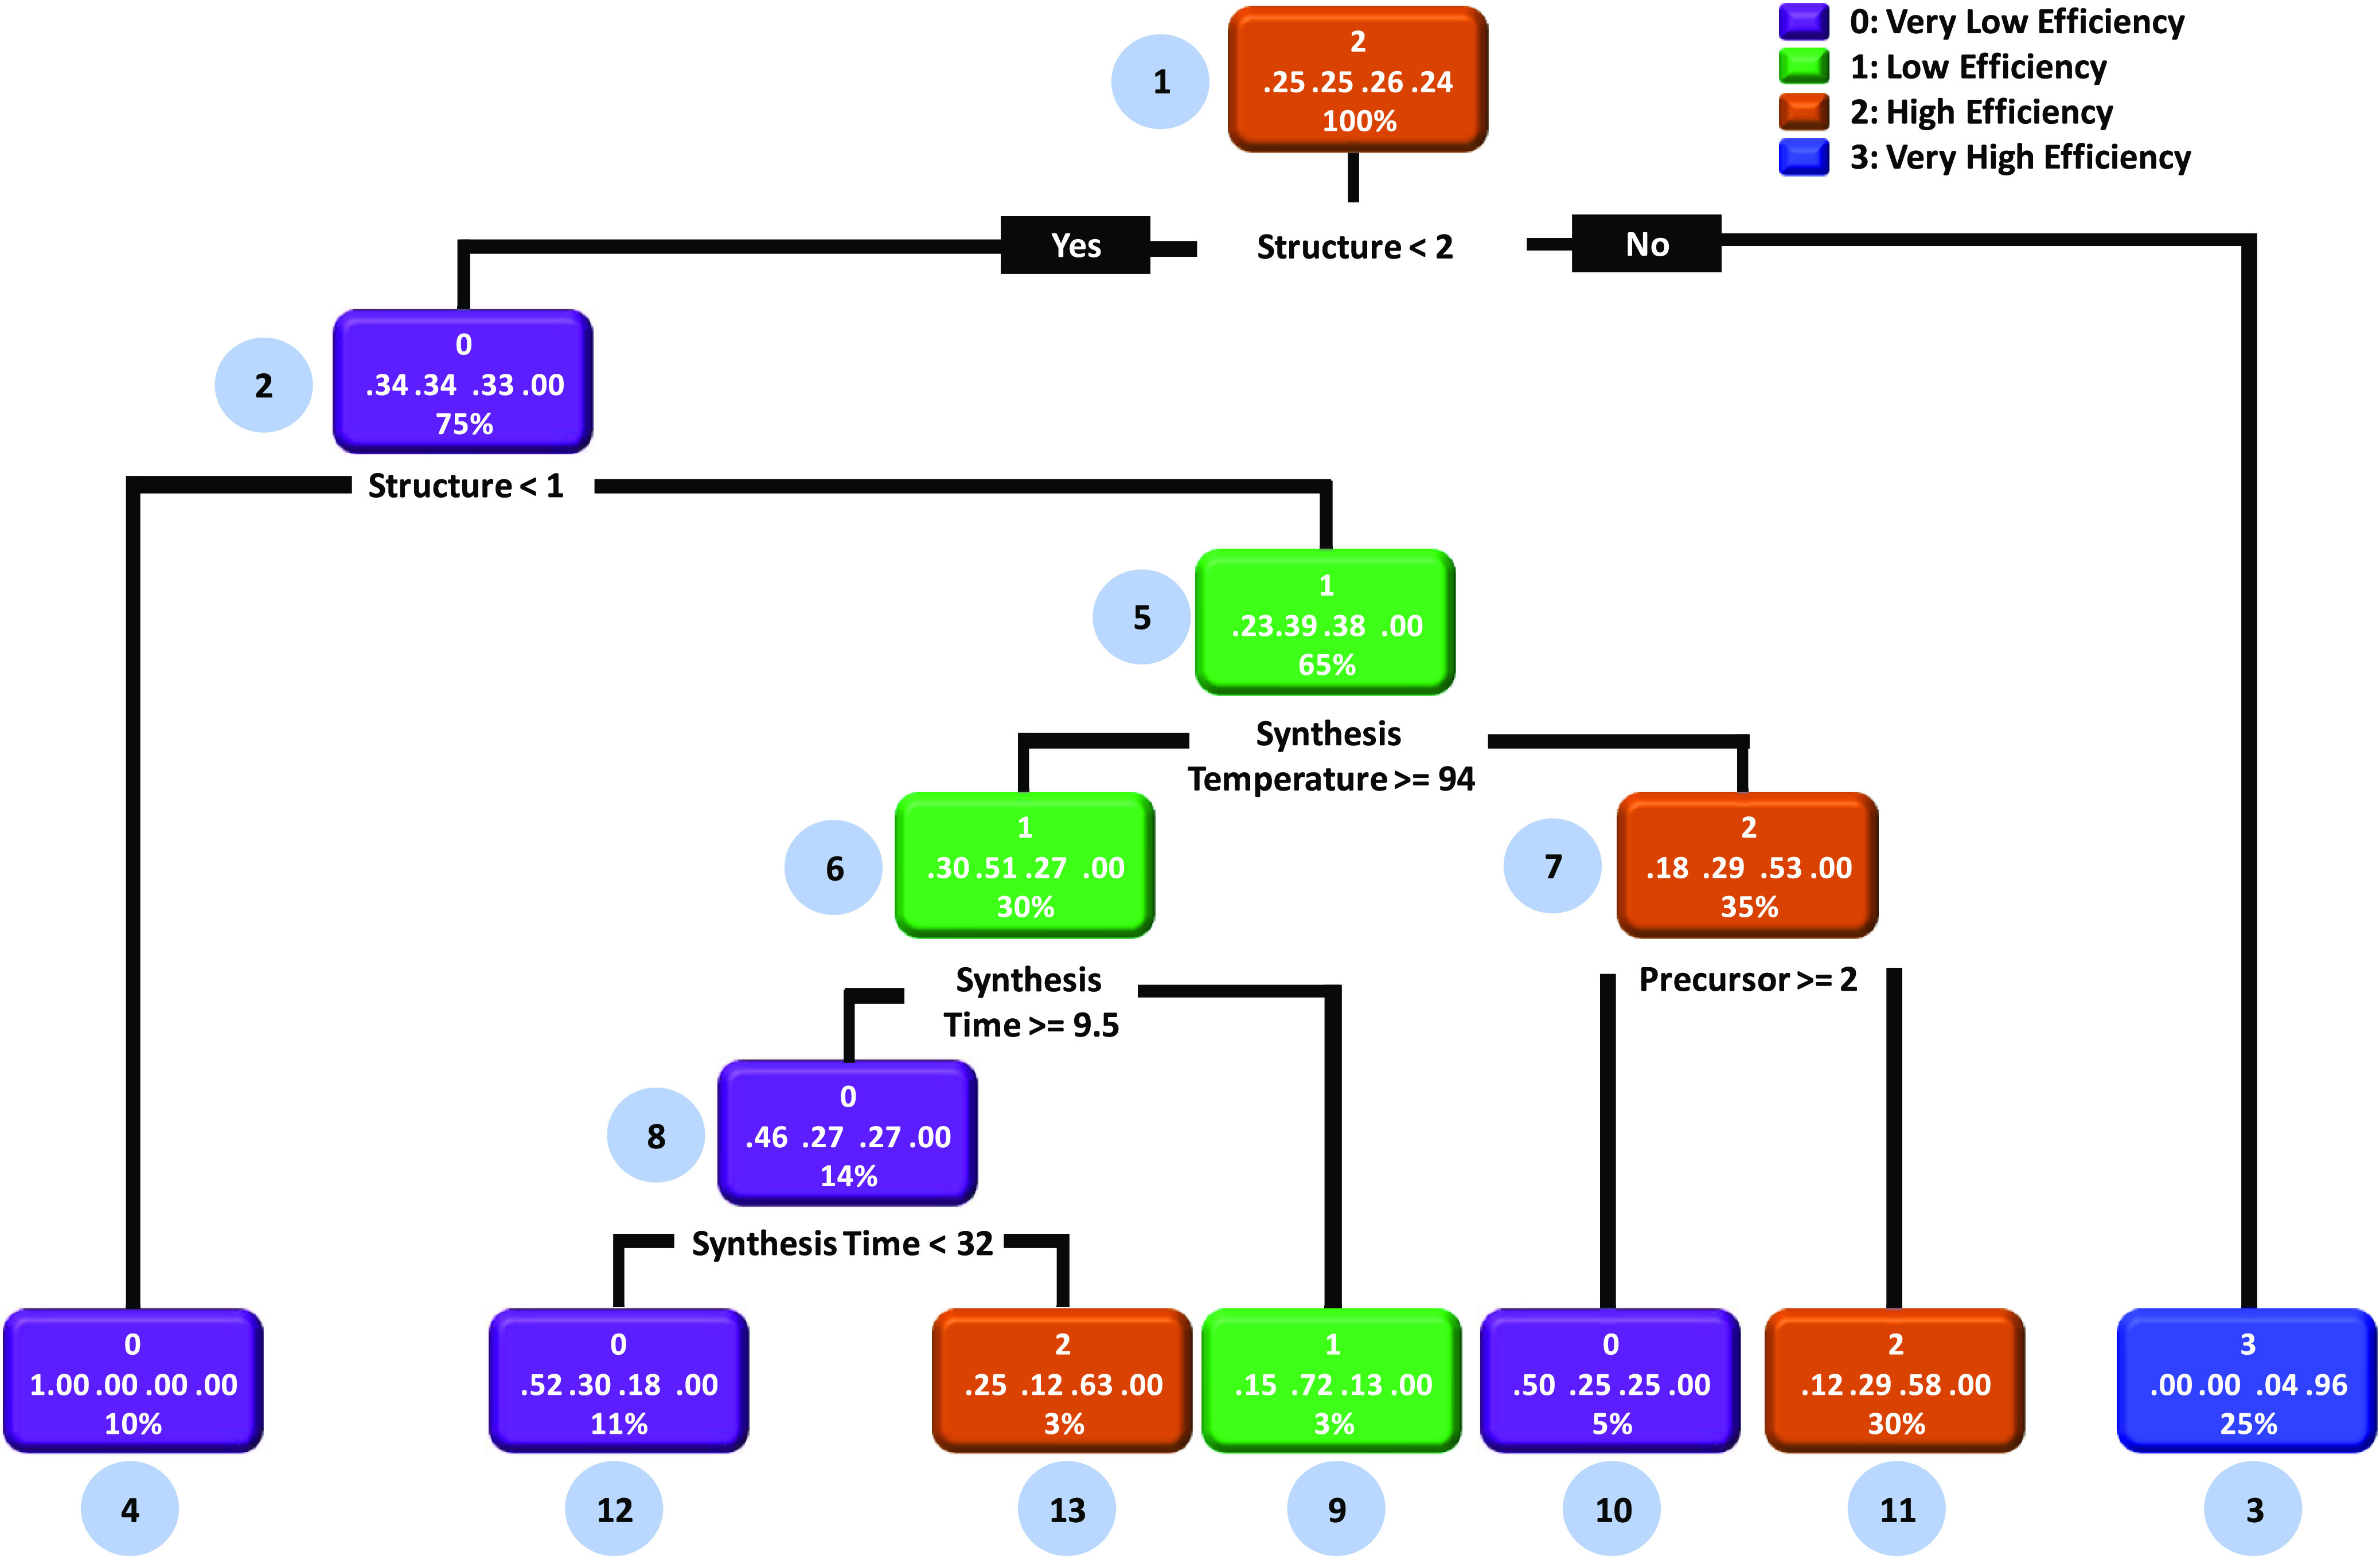
Decision tree model to identify possible rules and heuristics related to how synthesis conditions affect the PCE of the ZnO DSSCs. Herein, we have used the classification feature of the decision tree which provides different classes of PCE. This is a supervised learning model of the ZnO DSSCs.
Unlike supervised learning, the unsupervised learning models do not require the labeling of data, which lowers the manual work and expenses.27 In addition to this, the unsupervised models can help reduce the dimensionality of the data and easily find out the patterns from the data set.28 Considering the above advantages, we have modeled the ZnO DSSCs by employing the unsupervised learning algorithm of the decision tree, that is, classification and regression tree (CART). In the present case, the CART model provides different clusters as nodes with average PCE values and describes how different synthesis conditions affect the PCE of the ZnO DSSCs, as shown in Figure 6. In this case, the percentage numbers located at the bottom of each decision node represent the total data obeying the decision rule, and fraction numbers located at the upper side of the decision node represent the average values of efficiencies belonging to that cluster. The CART model verifies that the synthesis temperature is a major factor for deciding the PCE of the ZnO DSSCs. In the case of supervised learning, the structure/morphology of ZnO was found to be an important factor (Figure 5). The implementation of the CART model leads to four different clusters from very low PCE to very high PCE. In this case, the root node (node-1) is split into two nodes by evaluating the association rule: if the synthesis temperature is less than 100 °C, then very low PCE is obtained (node-2); otherwise, high PCE can be obtained (negation case, node-3). Similar to the workflow in the case of decision trees portrayed above, the following observations are noted:
-
(i)
Very low PCE (cluster-1) can be obtained by synthesizing ZnO at a temperature lower than 100 °C (node-1) and producing the microstructure and 1D nanostructure (nodes 2 and 4).
-
(ii)
Low PCE (cluster-2) can be obtained by synthesizing ZnO at a temperature lower than 100 °C (node-1) with 2D and 3D nanostructures (node-2, negation case). If the synthesis temperature is ≥93 °C (node-5), then also low PCE can be obtained (node-8). In addition to this, low PCE can be obtained by using the following parameters: synthesis temperature > 100 °C (node-1, negation case), precursor-1 (zinc nitrate, node-6), and synthesis time ≥ 3.5 h (node-10). The use of precursor-3 (zinc chloride, node-3) and the 3D nanostructure (node-7) can also achieve low PCE (node-12).
-
(iii)
High PCE (cluster-3, node-9) can be obtained by synthesizing ZnO at a temperature lower than 100 °C (node-1) with 2D and 3D nanostructures (node-2, negation case) and a synthesis temperature ≤ 93 °C (node-5). The high PCE (nodes 3 and 15) can also be obtained by using the following parameters: temperature > 100 °C (node-1), precursor-1 (node-3, zinc nitrate), and synthesis time ≥ 3.5 h (node-6) with 2D and 3D nanostructures (node-10). High PCE (node-16 and 18) can also be obtained by using precursors 2 and 3 (node-3, negation case) and micro- and 1D and 2D nanostructures (node-7) with synthesis times < 3.5 h (node-17) and ≥11 h (node-13).
-
(iv)
Very high PCE (cluster-4, node-11) can be obtained by synthesizing ZnO at a temperature greater than 100 °C (node-1, negation case), using precursor-1 (zinc nitrate, node-3), and maintaining the synthesis time < 3.5 h. In addition to this, very high PCE (node-19) can also be obtained by synthesizing ZnO at a temperature greater than 100 °C (node-1), using precursors 2 and 3 (node-3), utilizing micro- and 1D and 2D nanostructures (node-7), and maintaining the synthesis time < 11 h (node-13) and >3.5 h (node-17 and 19).
Figure 6.
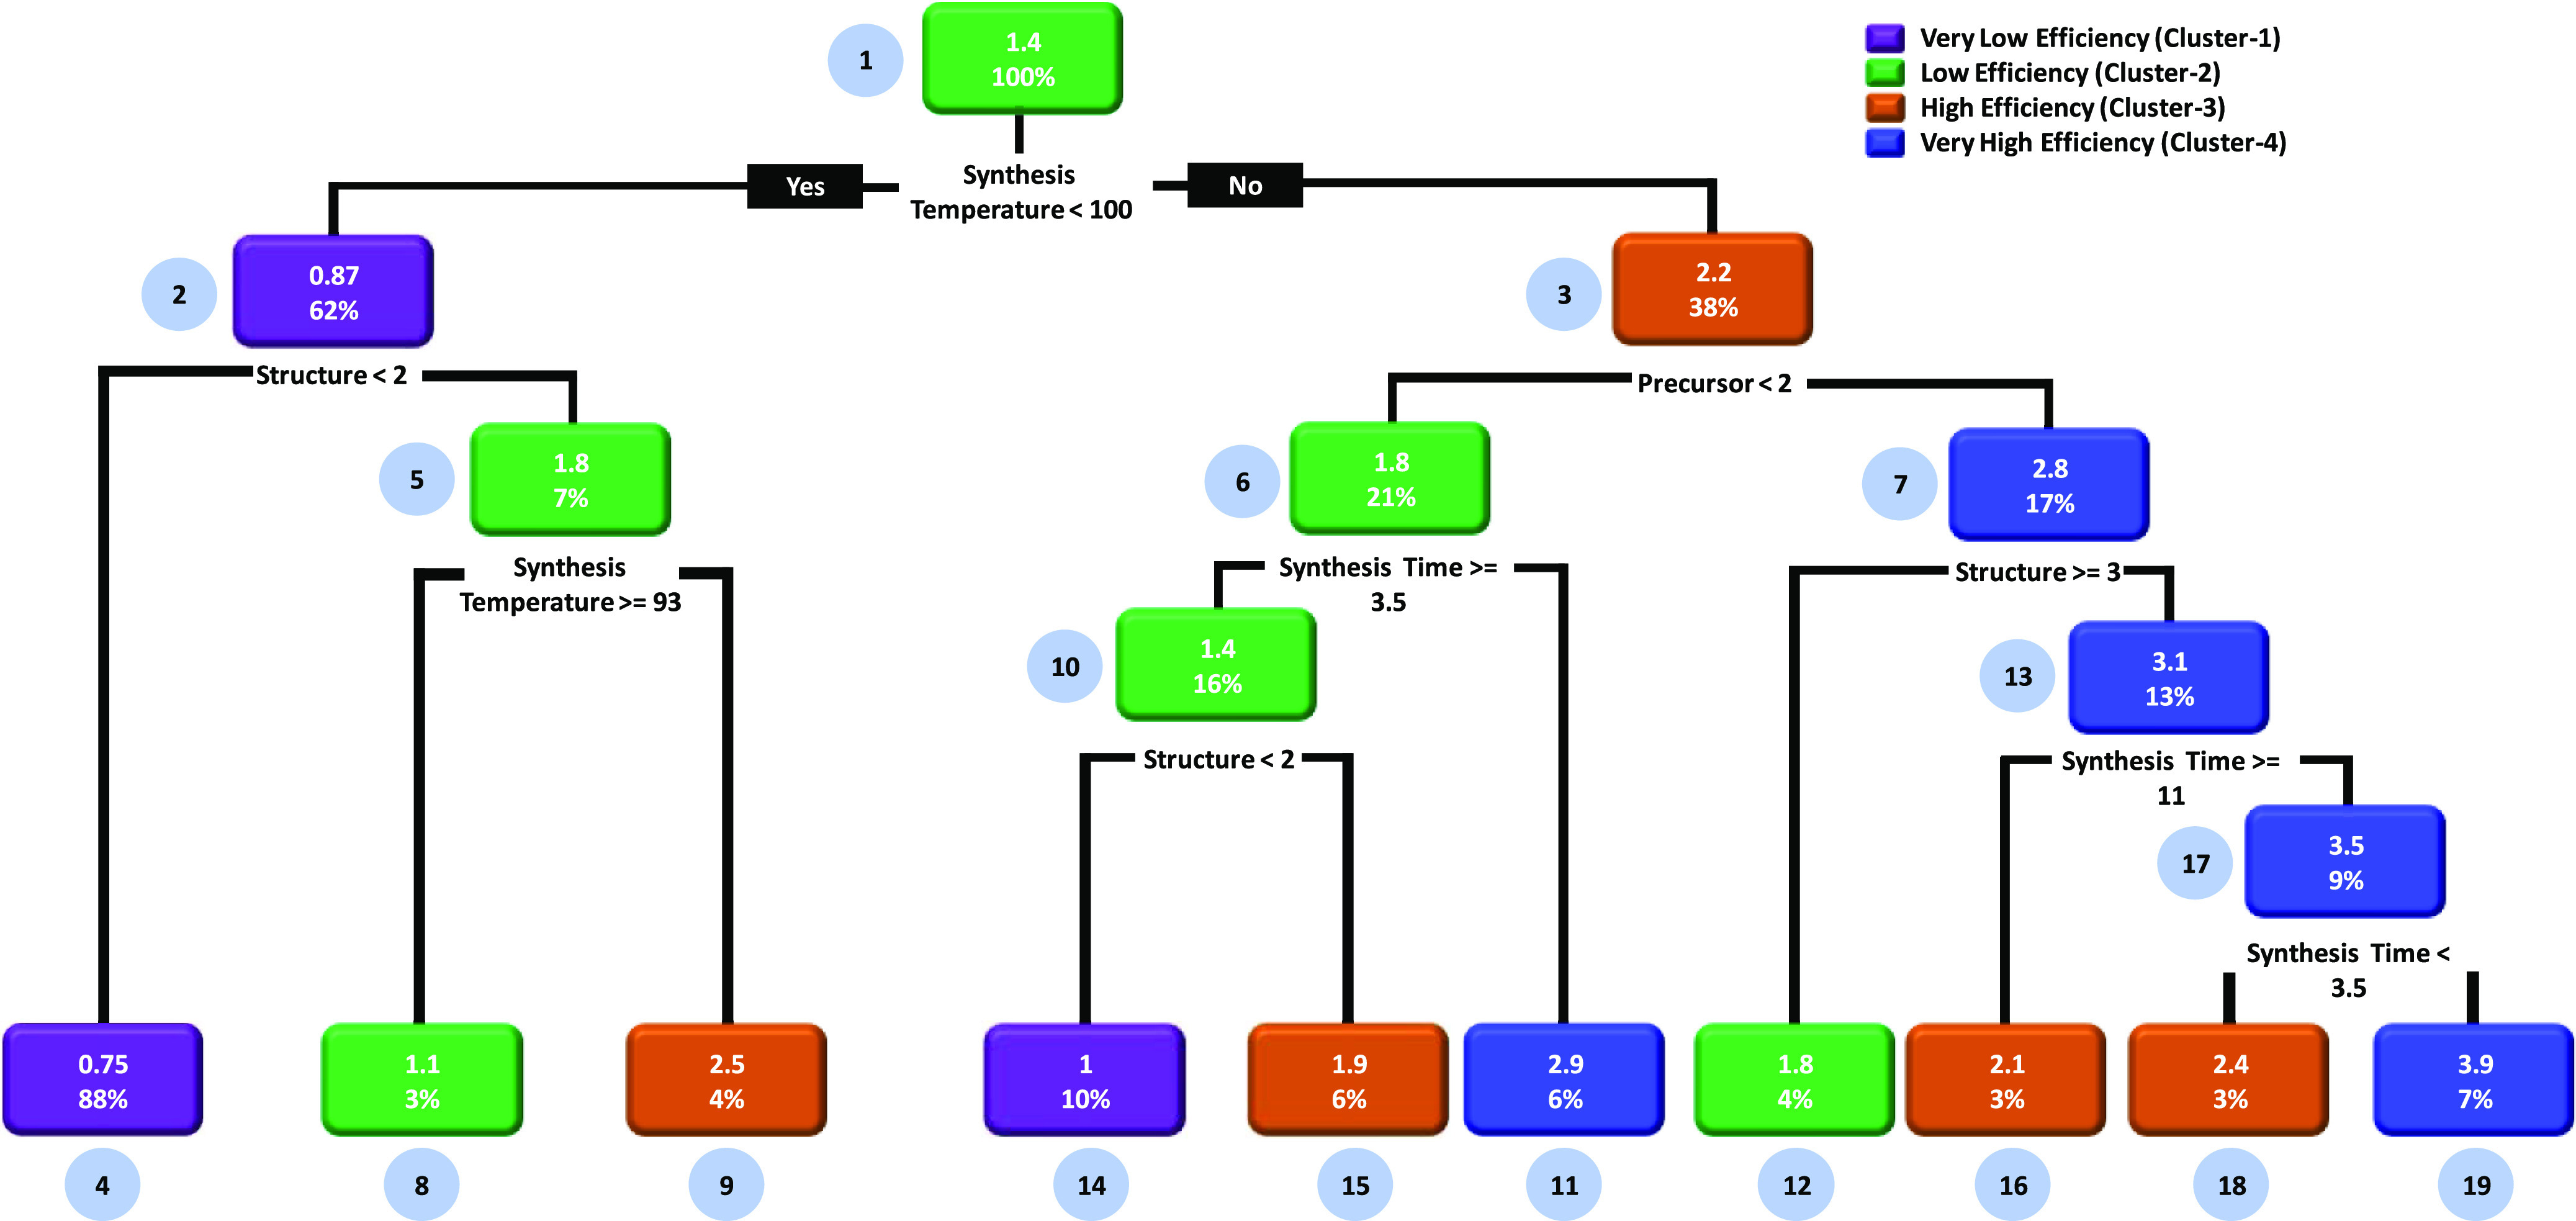
CART model to identify possible rules and heuristics related to how synthesis conditions affect the PCE of the ZnO DSSCs. The CART is a decision tree that results in different clusters representing the average efficiency values. Herein, we have used the clustering feature of the decision tree which provides different clusters of PCE. This is an unsupervised learning model of the ZnO DSSCs.
2.3. PCE Predictions Using Random Forest and ANN Algorithms
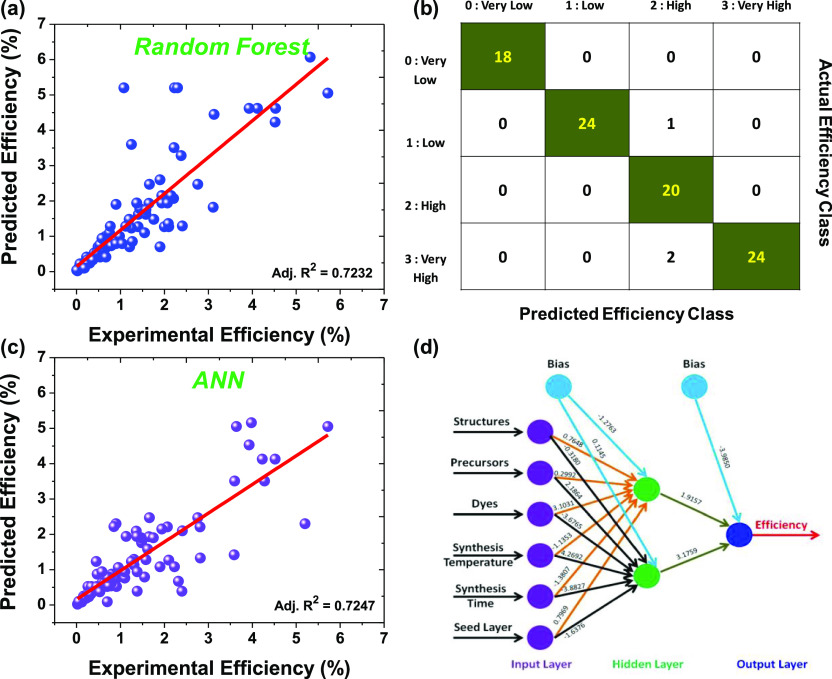
In this section, we showcase the prediction of the PCE of the hydrothermally synthesized ZnO DSSCs using two popular ML algorithms. In particular, we have used random forest and ANN algorithms to predict the efficiencies of the ZnO DSSCs by employing different synthesis conditions as input variables. A cross-validation technique was used for both analyses. For the predictions, the data was divided into two parts: 70% of the data was used for the training of the model, whereas the remaining 30% of the data was used for testing purposes. In this case, the random sampling method was used to segregate the data into the training and testing data sets. The models were built up using a training data set, whereas the test data set was used to check the performance of these models with the help of the accuracy measure. Figure 7 depicts the results related to the PCE prediction using random forest and ANN algorithms. The scatter plots (Figure 7a,c) of random forest and ANN algorithms are built upon the unlabeled data set to visualize the relationship between the actual and predicted PCE. On the other hand, the confusion matrix is created using a labeled data set (Figure 7b). Figure 7a displays the predicted versus the actual experimental PCE performance of the random forest algorithm. For model building, different synthesis conditions such as structures, precursors, dyes, synthesis temperature, synthesis time, and the seed layer were taken as input variables, and the output PCE was predicted based on these variables. The scatter plot confirms that the random forest algorithm can predict the PCE very well (Adj. R2 = 0.7232). In particular, it can predict the PCE up to 3% very accurately, whereas the model deviates for very high PCE. The confusion matrix of the random forest algorithm is depicted in Figure 7b. The numbers shown in each cell represent the number of observations classified for given actual and predicted class labels. Most of the numbers have appeared in the diagonal cells, validating the model, and thereby predicting the PCE of the ZnO DSSCs. In the present case, the accuracy of the random forest algorithm turns out to be 96.62%, which substantiates the prediction ability of the model. On the other hand, the misclassification factor turns out to be relatively low, that is, 0.0112, which corroborates the prediction ability. We observed that there is a trade-off between Adj. R2 and the accuracy of the model. Such kind of trade-off may lead to overfitting, and it can be addressed through implementing ensemble methods like bagging and boosting to prevent overfitting of the model.29
Figure 7.
Prediction of the PCE using random forest and ANN algorithms. (a) Predicted vs the actual experimental PCE performance of the random forest algorithm. (b) Confusion matrix of the random forest algorithm. (c) Predicted vs the actual experimental PCE performance of the ANN algorithm. (d) ANN structure to predict the PCE of the ZnO DSSCs using different synthesis parameters.
To validate the ML-based prediction as mentioned earlier, we have used one more widely used ML algorithm. The approach adopted by us is doubly checked by employing the ANN algorithm on the same data set. The ANN is designed based on the human brain, and it mimics the functionality of the biological neurons and synapses.30 The ANN provides better results in the case of complex and nonlinear data.31,32Figure 7c reveals the predicted versus the actual experimental PCE performance of the ANN algorithm (training data set). The scatter plot shows a good relationship between the experimental PCE and model-predicted PCE with Adj. R2 equal to 0.7447. Most of the data lie on the straight line, which suggested that the ANN algorithm more accurately and effectively predicts the PCE of the ZnO DSSCs. Similar to the previous case (random forest), we have used different synthesis parameters to build the ANN model. The resultant ANN structure with input, hidden, and output layers is shown in Figure 7d. The synaptic weights and bias of the models are also shown in the ANN structure. The ANN model takes structures, precursors, dyes, synthesis temperature, synthesis time, and the seed layer as input variables and predicts the PCE based on the optimized connections between input, hidden, and output layers. The ANN model’s root-mean-square error was found to be 2.44% and computes the results in the 23658 steps. The prediction results of the random forest and ANN are very satisfactory and show a similar performance level for PCE predictions. This can be seen from the Adj. R2 values of the scatter plots (Figure 7a,c). These results asserted that the random forest and ANN algorithms are better options for PCE predictions. Our work confirms that it is possible to improve the accuracy of estimates of material properties manyfold by incorporating the latest advances in ML. Currently, we are working on Monte Carlo simulations for predicting the PCE of solar cells, and the results in the initial stage are encouraging in terms of accuracy, offering a significant advantage in predicting the properties of complex material systems based on small data sets.
3. Conclusions
In conclusion, the present report showcases the importance of the statistical and ML tools for analysis and predictions of DSSC properties. The statistical results suggested that the morphology/structure of ZnO is an important property and many times it governs the PCE of the DSSCs. Apart from this, the type of precursor, dyes, and different synthesis conditions also have an impact on the PCE. With the help of bubble charts, the year-wise (2005–2020) trend in the use of different morphologies, precursors, dyes, and other synthesis parameters has been elucidated. The major insights, set of rules, and heuristics have been investigated by using different ML algorithms. In particular, we addressed two major questions, that is, how synthesis conditions affect the morphology of hydrothermally synthesized ZnO and how the PCE of the ZnO DSSCs depends on the different synthesis parameters. For this, the classification and clustering features of the decision tree and CART are used and possible rules and heuristics are discussed. In the case of predictions, random forest and ANN-based ML algorithms accurately predict the PCE of the ZnO DSSCs.
4. Materials and Methods
4.1. Data Set Preparation: Data Gathering, Preprocessing, and Cleaning
We have created a data set of 298 experimental observations for the present work using the published work from 2005 to 2020. The research papers were searched through Scopus scientific databases, and relevant information was extracted from each paper. The search keywords were ZnO + hydrothermal method + DSSCs. The manual method was adopted to collect the experimental data from each research paper. During the initial data set creation, we have collected more than 350 experimental observations. However, some of the papers did not mention sufficient information. Therefore, few papers were excluded from the data set. In some instances, the authors’ domain knowledge was applied to complete missing information. For prospective readers and researchers, a complete investigation data set is provided in the Supporting Information (Table S1). Table 1 presents the categorical features and variables used in the present investigation to analyze and predict the properties of the hydrothermally synthesized ZnO DSSCs using statistical methods and ML techniques.
Table 1. Categorical Features and Variables of the Hydrothermally Synthesized ZnO DSSCs.
| categorical feature | variables of the DSSCs | number of experimental observations |
|---|---|---|
| morphological structures | microstructure (0): microflower, microrod, microsheet, microsphere, and microurchin | 30 |
| nano-1D (1): nanobullets, nanocone, nanoforest, nanograss, nanoneedles, nanorod, nanotree, nanotube, and nanowire | 193 | |
| nano-2D (2): nanobead, nanobelt, nanocrystal, nanodisk, nanoflakes, nanoplates, nanosheet | 34 | |
| nano-3D (3): nanocaterpillar, nanocluster, nanocubes, nanoflower, nanomushrooms, nanoparticle, nanopyramid, nanosphere, nanostar, and nanourchin | 41 | |
| precursors | precursor 1: zinc nitrate | 216 |
| precursor 2: zinc acetate | 68 | |
| precursor 3: zinc chloride | 14 | |
| dyes | dye 1: N719 | 222 |
| dye 2: N3 | 21 | |
| dye 3: D102 | 8 | |
| dye 4: D149 | 8 | |
| dye 5: natural dye, rodhamine B, eosin-Y, D205, mercurochrome, Z907, LEG-4, and C-218 | 39 | |
| synthesis temperature | low: 40–90 °C | 110 |
| medium: 90–95 °C | 18 | |
| high: 95–120 °C | 37 | |
| very high: 120–220 °C | 133 | |
| synthesis time | low: 0.5–3 h | 79 |
| medium: 3–6 h | 72 | |
| high: 6–12 h | 78 | |
| very high: 12–144 h | 69 | |
| seed layer | present | 183 |
| absent | 115 | |
| PCE | minimum: 0.005% | |
| first Quartile (Q1): 0.33% | ||
| second quartile (Q2): 0.93% | 298 | |
| third quartile (Q3): 1.94% | ||
| maximum: 7.66% |
4.2. Computational Details
The focus of the DSSC research community is on the improvements of the PCE of the solar cells. Therefore, the PCE was considered a significant performance variable for the statistical analysis and ML predictions. In the descriptive statistical analysis, the PCE of the DSSCs was investigated for each process condition (structure, precursor, dye, synthesis time, synthesis temperature, and seed layer). For statistical analysis, the PCE was classified into three categories, viz., minimum, maximum, and average. In addition to this, bubble plots were drawn to assess the year-wise comparative performance of the DSSCs at different process conditions. For this, the average efficiencies were plotted against the year of publication. The bubble size represents the number of experimental observations in a particular year. In the case of ML investigations, we have used a decision tree as a supervised ML algorithm to identify possible rules and heuristics from the data set. In particular, we have tried to identify how synthesis conditions affect the different morphologies of ZnO and efficiencies of the ZnO DSSCs. In addition to this, we have employed random forest and ANN algorithms to predict the efficiencies of the ZnO DSSCs. The details of the decision tree, random forest, and ANN algorithms are explained in the Supporting Information. The source code of all algorithms was created using RStudio (R version 3.6.2).
Data Availability Statement
The authors confirm that the data supporting the findings of this study are available within the article and its Supporting Information. For prospective readers and researchers, a complete investigation data set is provided in the Supporting Information (Table S1).
Acknowledgments
This study is supported by financial assistance under the “RUSA-Industry Sponsored Centre for VLSI System Design”, Maharashtra state. This research was supported by the MOTIE [Ministry of Trade, Industry & Energy (10080581)] and the KSRC (Korea Semiconductor Research Consortium) support program for the development of the future semiconductor device. T.D.D. acknowledges the encouragement given by Suhas Yadav (Bar-Ilan University, Israel) and Dr. Mansing Takale (Shivaji University, Kolhapur) to pursue the research work in the field of artificial intelligence and machine learning.
Supporting Information Available
The Supporting Information is available free of charge at https://pubs.acs.org/doi/10.1021/acsomega.1c04521.
Details of the complete data set used in the investigation and information of the decision tree, random forest, and ANN algorithms (PDF)
The authors declare no competing financial interest.
Supplementary Material
References
- Liu Y.; Zhao T.; Ju W.; Shi S. Materials discovery and design using machine learning. J. Materiomics 2017, 3, 159–177. 10.1016/j.jmat.2017.08.002. [DOI] [Google Scholar]
- Bartók A. P.; De S.; Poelking C.; Bernstein N.; Kermode J. R.; Csányi G.; Ceriotti M. Machine learning unifies the modeling of materials and molecules. Sci. Adv. 2017, 3, e1701816 10.1126/sciadv.1701816. [DOI] [PMC free article] [PubMed] [Google Scholar]
- Carleo G.; Cirac I.; Cranmer K.; Daudet L.; Schuld M.; Tishby N.; Vogt-Maranto L.; Zdeborová L. Machine learning and the physical sciences. Rev. Mod. Phys. 2019, 91, 045002. 10.1103/revmodphys.91.045002. [DOI] [Google Scholar]
- Saal J. E.; Oliynyk A. O.; Meredig B. Machine Learning in Materials Discovery: Confirmed Predictions and Their Underlying Approaches. Annu. Rev. Mater. Res. 2020, 50, 49–69. 10.1146/annurev-matsci-090319-010954. [DOI] [Google Scholar]
- Padula D.; Simpson J. D.; Troisi A. Combining electronic and structural features in machine learning models to predict organic solar cells properties. Mater. Horiz. 2019, 6, 343–349. 10.1039/c8mh01135d. [DOI] [Google Scholar]
- Jørgensen P. B.; Mesta M.; Shil S.; García Lastra J. M.; Jacobsen K. W.; Thygesen K. S.; Schmidt M. N. Machine learning-based screening of complex molecules for polymer solar cells. J. Chem. Phys. 2018, 148, 241735. 10.1063/1.5023563. [DOI] [PubMed] [Google Scholar]
- Chen C.; Zuo Y.; Ye W.; Li X.; Deng Z.; Ong S. P. A critical review of machine learning of energy materials. Adv. Energy Mater. 2020, 10, 1903242. 10.1002/aenm.201903242. [DOI] [Google Scholar]
- Odabaşı Ç.; Yıldırım R. Performance analysis of perovskite solar cells in 2013–2018 using machine-learning tools. Nano Energy 2019, 56, 770–791. 10.1016/j.nanoen.2018.11.069. [DOI] [Google Scholar]
- Odabaşı Ç.; Yıldırım R. Machine learning analysis on stability of perovskite solar cells. Sol. Energy Mater. Sol. Cells 2020, 205, 110284. 10.1016/j.solmat.2019.110284. [DOI] [Google Scholar]
- Zeng K.; Tong Z.; Ma L.; Zhu W.-H.; Wu W.; Xie Y. Molecular engineering strategies for fabricating efficient porphyrin-based dye-sensitized solar cells. Energy Environ. Sci. 2020, 13, 1617–1657. 10.1039/c9ee04200h. [DOI] [Google Scholar]
- Richhariya G.; Kumar A.; Tekasakul P.; Gupta B. Natural dyes for dye sensitized solar cell: A review. Renew. Sustain. Energy Rev. 2017, 69, 705–718. 10.1016/j.rser.2016.11.198. [DOI] [Google Scholar]
- Yeoh M.-E.; Chan K.-Y. Recent advances in photo-anode for dye-sensitized solar cells: a review. Int. J. Energy Res. 2017, 41, 2446–2467. 10.1002/er.3764. [DOI] [Google Scholar]
- Yeoh M.-E.; Chan K.-Y. A Review on Semitransparent Solar Cells for Real-Life Applications Based on Dye-Sensitized Technology. IEEE J. Photovolt. 2021, 11, 354–361. 10.1109/jphotov.2020.3047199. [DOI] [Google Scholar]
- Singh B. P.; Goyal S. K.; Kumar P. Solar PV cell materials and technologies: Analyzing the recent developments. Mater. Today: Proc. 2021, 43, 2843–2849. 10.1016/j.matpr.2021.01.003. [DOI] [Google Scholar]
- Vittal R.; Ho K.-C. Zinc oxide based dye-sensitized solar cells: A review. Renew. Sustain. Energy Rev. 2017, 70, 920–935. 10.1016/j.rser.2016.11.273. [DOI] [Google Scholar]
- Boro B.; Gogoi B.; Rajbongshi B. M.; Ramchiary A. Nano-structured TiO2/ZnO nanocomposite for dye-sensitized solar cells application: A review. Renew. Sustain. Energy Rev. 2018, 81, 2264–2270. 10.1016/j.rser.2017.06.035. [DOI] [Google Scholar]
- Consonni V.; Briscoe J.; Kärber E.; Li X.; Cossuet T. ZnO nanowires for solar cells: a comprehensive review. Nanotechnology 2019, 30, 362001. 10.1088/1361-6528/ab1f2e. [DOI] [PubMed] [Google Scholar]
- Tong Y.; Liu Y.; Dong L.; Zhao D.; Zhang J.; Lu Y.; Shen D.; Fan X. Growth of ZnO nanostructures with different morphologies by using hydrothermal technique. J. Phys. Chem. B 2006, 110, 20263–20267. 10.1021/jp063312i. [DOI] [PubMed] [Google Scholar]
- Aksoy S.; Polat O.; Gorgun K.; Caglar Y.; Caglar M. Li doped ZnO based DSSC: Characterization and preparation of nanopowders and electrical performance of its DSSC. Phys. E 2020, 121, 114127. 10.1016/j.physe.2020.114127. [DOI] [Google Scholar]
- Grätzel M. Dye-sensitized solar cells. J. Photochem. Photobiol., C 2003, 4, 145–153. 10.1016/s1389-5567(03)00026-1. [DOI] [Google Scholar]
- Li X.; Zhang F.; Ma C.; Deng Y.; Wang Z.; Elingarami S.; He N. Controllable synthesis of ZnO with various morphologies by hydrothermal method. J. Nanosci. Nanotechnol. 2012, 12, 2028–2036. 10.1166/jnn.2012.5177. [DOI] [PubMed] [Google Scholar]
- Farbod M.; Jafarpoor E. Hydrothermal synthesis of different colors and morphologies of ZnO nanostructures and comparison of their photocatalytic properties. Ceram. Int. 2014, 40, 6605–6610. 10.1016/j.ceramint.2013.11.116. [DOI] [Google Scholar]
- Zhang Q.; Dandeneau C. S.; Zhou X.; Cao G. ZnO nanostructures for dye-sensitized solar cells. Adv. Mater. 2009, 21, 4087–4108. 10.1002/adma.200803827. [DOI] [Google Scholar]
- Parra M. R.; Pandey P.; Siddiqui H.; Sudhakar V.; Krishnamoorthy K.; Haque F. Z. Evolution of ZnO nanostructures as hexagonal disk: Implementation as photoanode material and efficiency enhancement in Al: ZnO based dye sensitized solar cells. Appl. Surf. Sci. 2019, 470, 1130–1138. 10.1016/j.apsusc.2018.11.077. [DOI] [Google Scholar]
- Cho S. I.; Sung H. K.; Lee S.-J.; Kim W. H.; Kim D.-H.; Han Y. S. Photovoltaic Performance of Dye-Sensitized Solar Cells Containing ZnO Microrods. Nanomaterials 2019, 9, 1645. 10.3390/nano9121645. [DOI] [PMC free article] [PubMed] [Google Scholar]
- Aksoy S.; Gorgun K.; Caglar Y.; Caglar M. Effect of loading and standbye time of the organic dye N719 on the photovoltaic performance of ZnO based DSSC. J. Mol. Struct. 2019, 1189, 181–186. 10.1016/j.molstruc.2019.04.040. [DOI] [Google Scholar]
- Wang N.; Zhou W.; Song Y.; Ma C.; Liu W.; Li H. Unsupervised deep representation learning for real-time tracking. Int. J. Comput. Vis. 2021, 129, 400–418. 10.1007/s11263-020-01357-4. [DOI] [Google Scholar]
- Bah M.; Hafiane A.; Canals R. Deep learning with unsupervised data labeling for weed detection in line crops in UAV images. Remote Sens. 2018, 10, 1690. 10.3390/rs10111690. [DOI] [Google Scholar]
- Im J.; Lee S.; Ko T.-W.; Kim H. W.; Hyon Y.; Chang H. Identifying Pb-free perovskites for solar cells by machine learning. npj Comput. Mater. 2019, 5, 37. 10.1038/s41524-019-0177-0. [DOI] [Google Scholar]
- Yang G. R.; Wang X.-J. Artificial neural networks for neuroscientists: A primer. Neuron 2020, 107, 1048–1070. 10.1016/j.neuron.2020.09.005. [DOI] [PubMed] [Google Scholar]
- Dongale T. D.; Jadhav P. R.; Navathe G. J.; Kim J. H.; Karanjkar M. M.; Patil P. S. Development of nano fiber MnO2 thin film electrode and cyclic voltammetry behavior modeling using artificial neural network for supercapacitor application. Mater. Sci. Semicond. Process. 2015, 36, 43–48. 10.1016/j.mssp.2015.02.084. [DOI] [Google Scholar]
- Dongale T. D.; Patil K. P.; Vanjare S. R.; Chavan A. R.; Gaikwad P. K.; Kamat R. K. Modelling of nanostructured memristor device characteristics using artificial neural network (ANN). J. Comput. Sci. 2015, 11, 82–90. 10.1016/j.jocs.2015.10.007. [DOI] [Google Scholar]
Associated Data
This section collects any data citations, data availability statements, or supplementary materials included in this article.
Supplementary Materials
Data Availability Statement
The authors confirm that the data supporting the findings of this study are available within the article and its Supporting Information. For prospective readers and researchers, a complete investigation data set is provided in the Supporting Information (Table S1).


