

Abstract
Objective
The Scleroderma: Cyclophosphamide or Transplantation (SCOT) trial demonstrated clinical benefit of haematopoietic stem cell transplant (HSCT) compared with cyclophosphamide (CYC). We mapped PBC (peripheral blood cell) samples from the SCOT clinical trial to scleroderma intrinsic subsets and tested the hypothesis that they predict long-term response to HSCT.
Methods
We analysed gene expression from PBCs of SCOT participants to identify differential treatment response. PBC gene expression data were generated from 63 SCOT participants at baseline and follow-up timepoints. Participants who completed treatment protocol were stratified by intrinsic gene expression subsets at baseline, evaluated for event-free survival (EFS) and analysed for differentially expressed genes (DEGs).
Results
Participants from the fibroproliferative subset on HSCT experienced significant improvement in EFS compared with fibroproliferative participants on CYC (p=0.0091). In contrast, EFS did not significantly differ between CYC and HSCT arms for the participants from the normal-like subset (p=0.77) or the inflammatory subset (p=0.1). At each timepoint, we observed considerably more DEGs in HSCT arm compared with CYC arm with HSCT arm showing significant changes in immune response pathways.
Conclusions
Participants from the fibroproliferative subset showed the most significant long-term benefit from HSCT compared with CYC. This study suggests that intrinsic subset stratification of patients may be used to identify patients with SSc who receive significant benefit from HSCT.
INTRODUCTION
Systemic sclerosis (SSc; scleroderma) is a rare autoimmune disease with heterogeneous clinical presentation. Despite modest advances in disease management, such as the approval of nintedanib for the treatment of SSc-associated interstitial lung disease,1 overall prognosis for SSc is worse than for other rheumatic diseases, and it continues to exhibit high mortality rates, primarily due to cardio-pulmonary involvement.2,3 Patients are classified clinically into two subgroups, limited (lcSSc) and diffuse cutaneous SSc (dcSSc), based on the extent of skin involvement.4 Patients with dcSSc typically suffer from severe scleroderma and increased internal organ involvement.5 In SSc, reproducible ‘intrinsic’ gene expression subsets (inflammatory, fibroproliferative, limited and normal-like) have been identified in skin6–8 and subsequently recapitulated in other affected organs from patients with SSc.9,10 The limited intrinsic subset is composed primarily of lcSSc patients, but the inflammatory, fibroproliferative and normal-like subsets include both dcSSc and lcSSc.6 Patients with morphea can fall into the inflammatory subset or cluster adjacent to this group. Some clinical covariates, such as modified Rodnan skin score (MRSS), incidence of lung disease and disease duration, have been associated with SSc intrinsic subsets,6,7,11 but they alone cannot predict intrinsic subset assignment.6 The pervasiveness and reproducibility of the SSc intrinsic subsets across tissues highlight the systemic nature of the disease and identify distinct groups of patients that may respond differently to therapy.
The Scleroderma: Cyclophosphamide or Transplantation (SCOT) clinical trial12 demonstrated long-term benefit of myeloablative autologous haematopoietic stem cell transplantation (HSCT) compared with cyclophosphamide (CYC) for treatment of severe scleroderma with organ involvement, corroborating results from the Autologous Stem Cell Transplantation International Scleroderma trial.13 Significant long-term improvements in MRSS have also been reported in patients with SSc after transplantation in the American Scleroderma Stem Cell versus Immune Suppression Trial.14 However, HSCT is an intensive procedure with significant side effects,14,15 potentially severe complications13,16 and considerable economic burden.17 Identifying the patients with SSc who are most and least likely to benefit from this treatment regimen is critically important.
In order to do this, we applied a machine learning classifier we developed earlier to predict the SSc intrinsic subsets and allow precision medicine in SSc.18 Previously, assignment of intrinsic subsets required large sets of samples to be accumulated allowing only retrospective analyses. The machine learning classifier uses a multinomial elastic net classification (GLMnet) to assign a sample to an intrinsic subset according to the relative expression levels of a large set of genes. The genes included in the model have been shown to represent the hallmark signatures of intrinsic subsets and identify these patterns in new datasets with high (~85%) accuracy.18
Herein, we demonstrate, for the first time, the existence of SSc intrinsic subsets using peripheral blood and test the hypothesis that the intrinsic gene expression subsets in SSc predict long-term response to HSCT. We show that our machine learning classifier may hold utility as a prognostic tool for precision medicine in SSc. In a subset of SCOT participants, we investigate the longitudinal molecular changes associated with HSCT or CYC treatment.
METHODS
Participants
The SCOT trial enrolled participants with severe SSc for 5 years or less with pulmonary or renal involvement as defined in Sullivan et al.12 This study analysed samples from all patients who provided whole blood samples at baseline (93% of the participants), as well as longitudinal follow-up at 8, 14, 20/26, 38 and 48/54 months for a subset of participants (online supplemental table S4).
Sample collection and processing
Peripheral blood was collected at baseline and longitudinally from SCOT trial participants. We restricted our genomic analyses to the per-protocol (PP) group, defined as the participants who received at least nine doses of CYC or received a transplant12 (online supplemental table S4). Of note, because samples were not collected after individuals died or experienced organ failure (respiratory, renal or cardiac failure), missing post-baseline specimens are not missing-at-random, which impacts interpretations of the longitudinal analyses. A Consolidated Standards of Reporting Trials diagram details the samples analysed in this study (figure 1).
Figure 1.
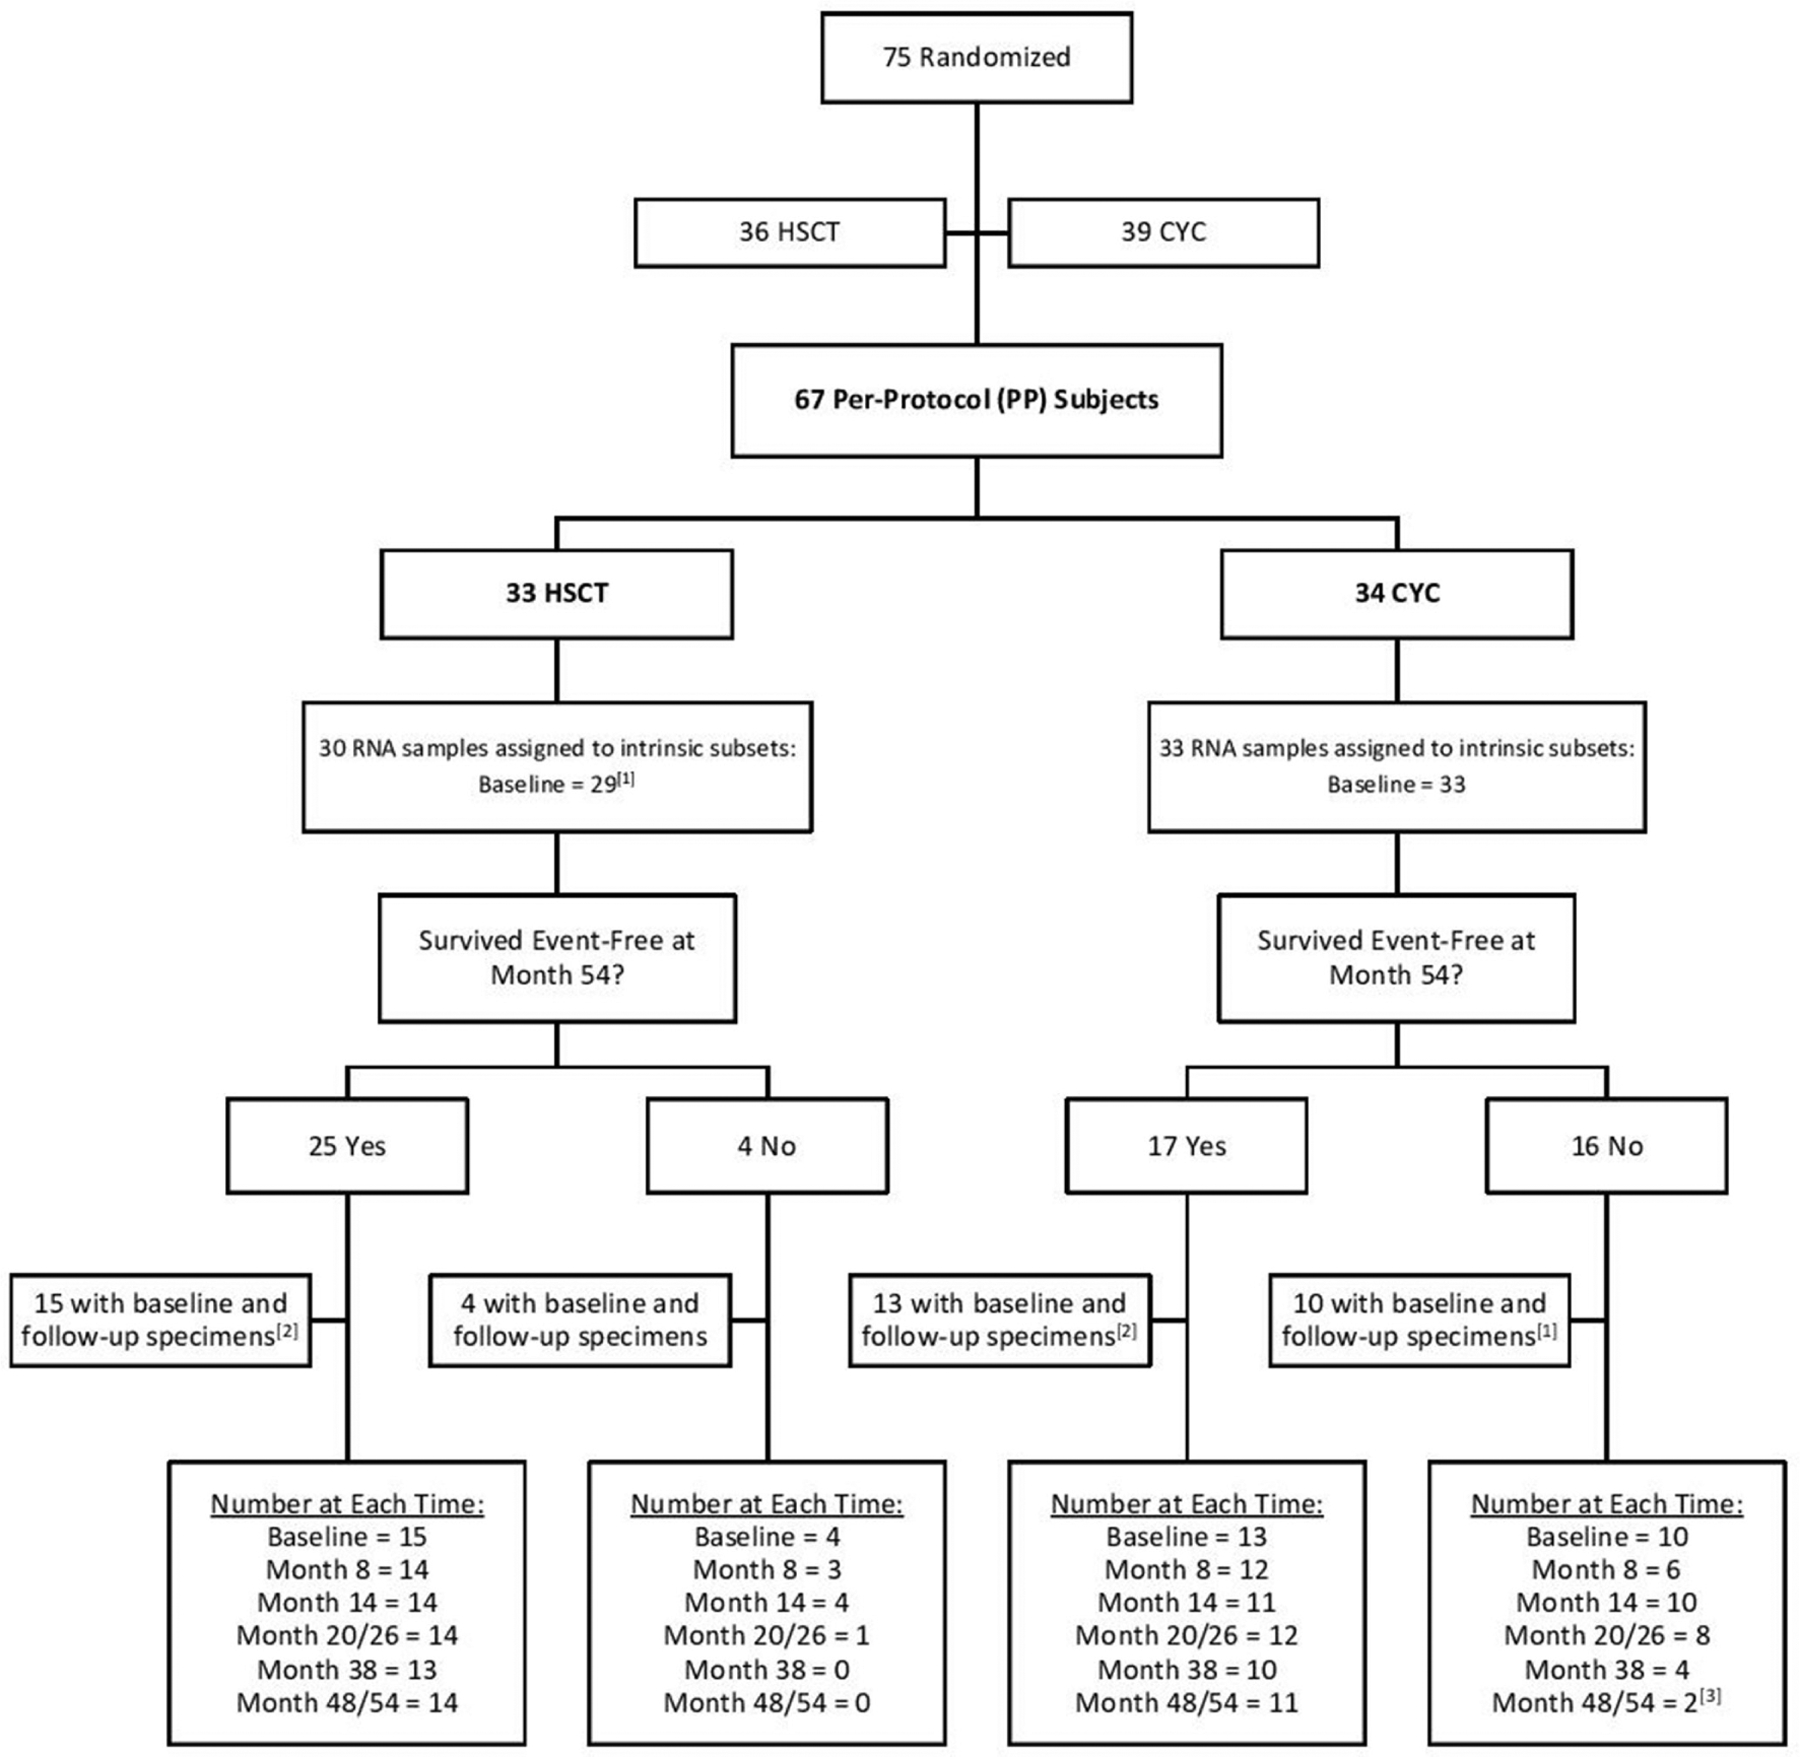
CONSORT diagram1,2,22 (1) One baseline sample failed quality control thresholds in analysis. The 8-month timepoint was initially used as a proxy for intrinsic subset assignment for this patient but was not used in the final survival analysis in presented in Figure 3. (2) A subset of subjects with available follow-up specimens was selected with preference given to those with the most available specimens at the desired timepoints. (3) The last available timepoint for subject 63 was at month 44 and was grouped with the month 48/54 samples. CONSORT, Consolidated Standards of Reporting Trials; CYC, cyclophosphamide; HSCT, haematopoietic stem cell transplant.
RNA was purified from PBC samples. cRNA was hybridised to Agilent (Santa Clara, California, USA) 8×60 k Sure-Print G3 Human Gene Expression Microarrays.8 Probes were filtered to include only those with <20% missing values across samples. Gene expression data were imputed for missing values and collapsed to unique genes using GenePattern.19 Data were median-centred across genes using Cluster V.3.0,20 and visualised using Java TreeView.21 Data are available from the National Center for Biotechnology Information Gene Expression Omnibus (NCBI GEO) (GSE134310).
Gene expression analyses
Participants who completed treatment protocol12 (PP) were assigned to intrinsic gene expression subsets at baseline using a machine learning classifier based on multinomial elastic net classification previously trained and tested on six independent SSc cohorts.18 Significant differentially expressed gene (DEGs) (False discovery rate (FDR) <5%) were identified between baseline and each follow-up timepoint using significance analysis of microarrays.22 Significant DEGs were annotated with gene ontology (GO) functional terms via g:Profiler23 and GO terms with p<0.05 corrected for multiple testing via default g:SCS method were treated as significant. For the visualisation of representative functional terms, ‘enrichment logs’ were calculated from g:Profiler p values as follows: for DEGs with increased expression at follow-up, -log10(p value); for DEGs with decreased expression at follow-up, log10(p value). This way, functional terms significantly enriched in downregulated DEGs were assigned negative ‘enrichment logs’ and terms enriched in upregulated DEGs were assigned positive ‘enrichment logs.’ Weighted gene coexpression network analysis (WGCNA) was used to identify modules of genes by constructing a signed network using default power of 12.
Statistics
Wilcoxon rank sum test was used for continuous variables and Fisher’s exact test for categorical variables. Kaplan-Meier survival curves were compared using Mantel-Haenszel (log-rank) χ2 test. All statistical tests were two sided and p values less than 0.05 were considered significant. Analyses were performed using R V.3.3.2.24
Patient and public involvement
Patients participated in the clinical trial and the study was in part funded by the Scleroderma Research Foundation, which includes scleroderma patients and advocates.
RESULTS
Overview of cohort
Gene expression data were generated for 33 participants from CYC group and for 30 participants from HSCT group (online supplemental table S1). Overall, subjects included in this analysis had an average age of 45.0 years and were primarily female (60.3%), white (76.2%), and never-smokers (73.0%) (table 1). There were no notable differences in sex, age, race or clinical parameters between treatment arms for our analyses (online supplemental table S2). Importantly, the participants included in this analysis at baseline were representative of all SCOT trial participants (online supplemental table S3). There were no notable differences between participants with (n=63) and without (n=4 baseline gene expression data in terms of sex, age, race and most clinical parameters (MRSS, forced vital capacity (FVC) and Scleroderma Health Assessment Questionnaire (SHAQ)). Participants included in our study had slightly lower diffusing lung capacity for carbon monoxide (DLCO) compared with those not included (mean: 51.9 with gene expression data, 59.1 without, p=0.0287; online supplemental table S3). Although samples were collected from multiple sites, there was no strong evidence of site-collection bias in a principle components analysis of the gene expression data (online supplemental figure S1).
Table 1.
Clinical characteristics of the cohort includes subjects who completed the SCOT trial per-protocol (PP) and for which gene expression was available at baseline
| Gene expression dataset—PP | |||
|---|---|---|---|
| Cyclophosphamide | Transplantation | ||
| Characteristic | n=33 | n=30 | P value |
| Age-mean (SD) | 46.1 (10.7) | 43.8 (10.1) | 0.379 |
| Female sex-no (%) | 23 (69.7) | 15 (50.0) | 0.129 |
| Race | |||
| White-no (%) | 25 (75.8) | 23 (76.7) | 0.805 |
| Black/African-American-no (%) | 4 (12.1) | 2 (6.7) | |
| Asian-no (%) | 1 (3.0) | 2 (6.7) | |
| Multiple-no (%) | 3 (9.1) | 2 (6.7) | |
| Other/unknown-no (%) | 0 (0.0) | 1 (3.3) | |
| Ethnicity Hispanic or Latino-no (%) | 4 (12.1) | 3 (10.0) | >0.999 |
| Smoking history | |||
| Current-no (%) | 2 (6.1) | 1 (3.3) | 0.410 |
| Ever-no (%) | 5 (15.2) | 9 (30.0) | |
| Never-no (%) | 26 (78.8) | 20 (66.7) | |
| Duration of disease-months since onset of first non-Raynaud’s Sign or symptom of scleroderma-mean (SD) | 30.8 (16.4) | 24.9 (12.8) | 0.117 |
| Disease-modifying antirheumatic drug use within 6 months of randomisation-no (%) | 21 (63.6) | 23 (76.7) | 0.287 |
| Lung involvement-no (%) | 32 (97.0) | 30 (100.0) | >0.999 |
| modified Rodnan Skin Score-mean (SD) | 30.4 (10.7) | 27.5 (7.7) | 0.225 |
| Mean FVC-% of predicted value | 73.6 (17.9) | 76.2 (13.4) | 0.525 |
| Mean DLCO-% of predicted value | 51.8 (7.9) | 54.1 (6.7) | 0.207 |
| Failures prior to month 54-no (%) | 16 (48.4) | 5 (16.7) | 0.0088 |
Fisher’s exact test was used for categorical variables and Student’s t-test was used for continuous measures.
DLCO, diffusing lung capacity for carbon monoxide; FVC, forced vital capacity; SCOT, Scleroderma: Cyclophosphamide or Transplantation.
The intrinsic subset signatures are present in blood
We assigned SSc participants from the SCOT trial to intrinsic subsets according to gene expression at baseline using a classifier previously trained and tested in skin.18 In order to validate the intrinsic molecular subsets in blood, we applied WGCNA25 to identify gene modules, which are large groups of co-expressed genes. Gene modules are defined solely by the gene expression values that are co-expressed across samples and are determined with no prior knowledge of intrinsic subset assignment. We identified three primary modules significantly (p<0.05) associated with three intrinsic subsets (figure 2A; online supplemental figure S2 and table S4). Module 15 was significantly associated with the inflammatory subset and the genes in this module are upregulated in biological processes including inflammatory response, immune system process, and leukocyte activation (figure 2B). Module 3 was significantly associated with the fibroproliferative subset; cell cycle, mitotic cell cycle, and RNA processing are upregulated (figure 2C). Module 24 was significantly associated with the normal-like subset, although less strongly correlated than the inflammatory-and fibroproliferative-associated modules (figure 2D). Tissue development and epithelium development are upregulated in the normal-like subset, consistent with the lack of immune activation in this subset.
Figure 2.
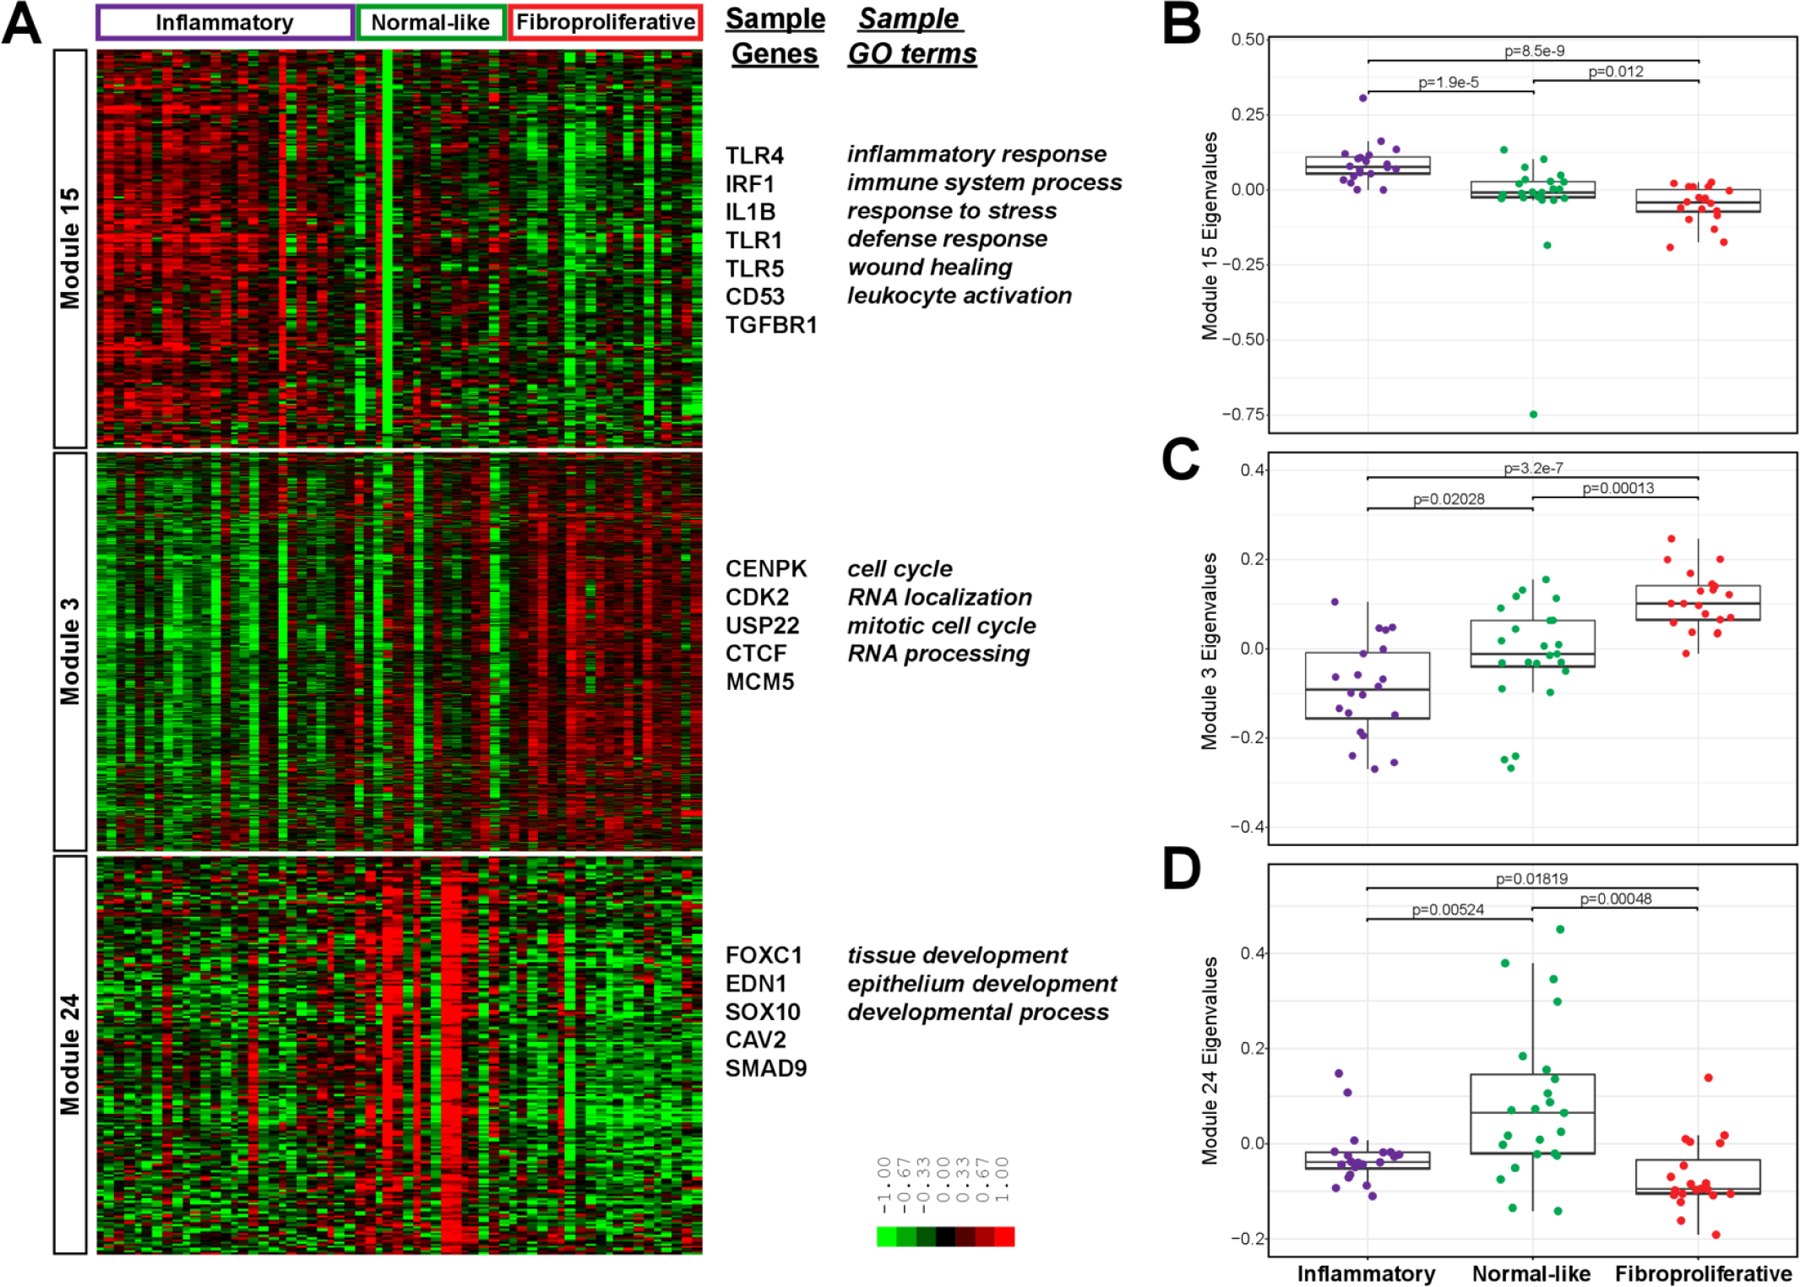
Intrinsic subsets in blood. (A) Gene expression values are displayed in a heatmap where each row is a gene in a WGCNA module and each column is a participant, ordered and labelled by intrinsic subset at the top. The eigenvalues for each sample, stratified by intrinsic subset, are plotted for the (B) inflammatory module, (C) fibroproliferative module and (D) normal-like module. P values are for Wilcoxon rank sum test. For B–D, n=20, 23 and 20 for inflammatory, normal-like and fibroproliferative intrinsic subsets. GO, gene ontology; WGCNA, weighted gene coexpression network analysis.
Comparison of intrinsic subsets to 28 age-matched and gender-matched controls (online supplemental table S6) identified differentially expression genes with similarly deregulated biological processes (online supplemental figure S2 and table S7). There were 362 genes differentially expressed between normal-like SSc samples and healthy controls (<2.4% of measured genome); comparison of normal-like to healthy controls did not identify any enriched biological processes among the DEGs. This is in contrast to the comparisons of the inflammatory subset (2162 genes; 14.3% of measured genome) and fibroproliferative subset (3712 genes; 24.6% of measured genome) to healthy controls. Thus, the normal-like subset represents a disease status that, from a gene expression perspective, is much closer to healthy controls than to other SSc patients. Consistent with this result, we find that 83% of healthy controls were assigned to the normal-like subset. These findings in peripheral blood replicate our earlier characterisation of the intrinsic subsets in skin. While fibrotic gene expression signatures were not identified in the fibroproliferative blood samples, we have retained the original naming convention for consistency.
We examined demographics and baseline characteristics between the intrinsic subsets for the PP population (online supplemental table S5). There were no significant differences in age, sex, race, ethnicity, smoking history, MRSS, disease-modifying antirheumatic drug (DMARD) use, SHAQ, FVC or DLCO between the intrinsic subsets. There was a significant difference in the duration of SSc at baseline. In this cohort, the inflammatory subset had average disease duration of 34.7 months and the fibroproliferative subset had an average of 21.6 months (p=0.039). The average disease duration for the normal-like subset was 27.8 months. Thus, there are no definitive clinical markers that can be used to assign patients with SSc to an intrinsic subset and the classifications must be made using gene expression data.
Event-free survival stratified by subset
In order to investigate the clinical outcomes for participants with SSc, the SCOT trial tracked the occurrence of major events (death; respiratory, renal or cardiac failure) following treatment. The trial reported a statistically significant increase in the event-free survival (EFS) of SSc participants who received HSCT compared with CYC. For this analysis, we used the baseline intrinsic subset assignments from the GLMnet machine learning classifier. In the CYC arm, there were 12 participants assigned to the normal-like subset, 12 participants assigned to the inflammatory subset and 9 participants assigned to the fibroproliferative subset. In the HSCT arm, there were 10 participants assigned to the normal-like subset, 8 participants assigned to the inflammatory subset and 11 participants assigned to the fibroproliferative subset (figure 3A). There were no statistically significant differences in distribution of intrinsic subsets at baseline between the treatment arms (p=1, Fisher’s exact test).
Figure 3.
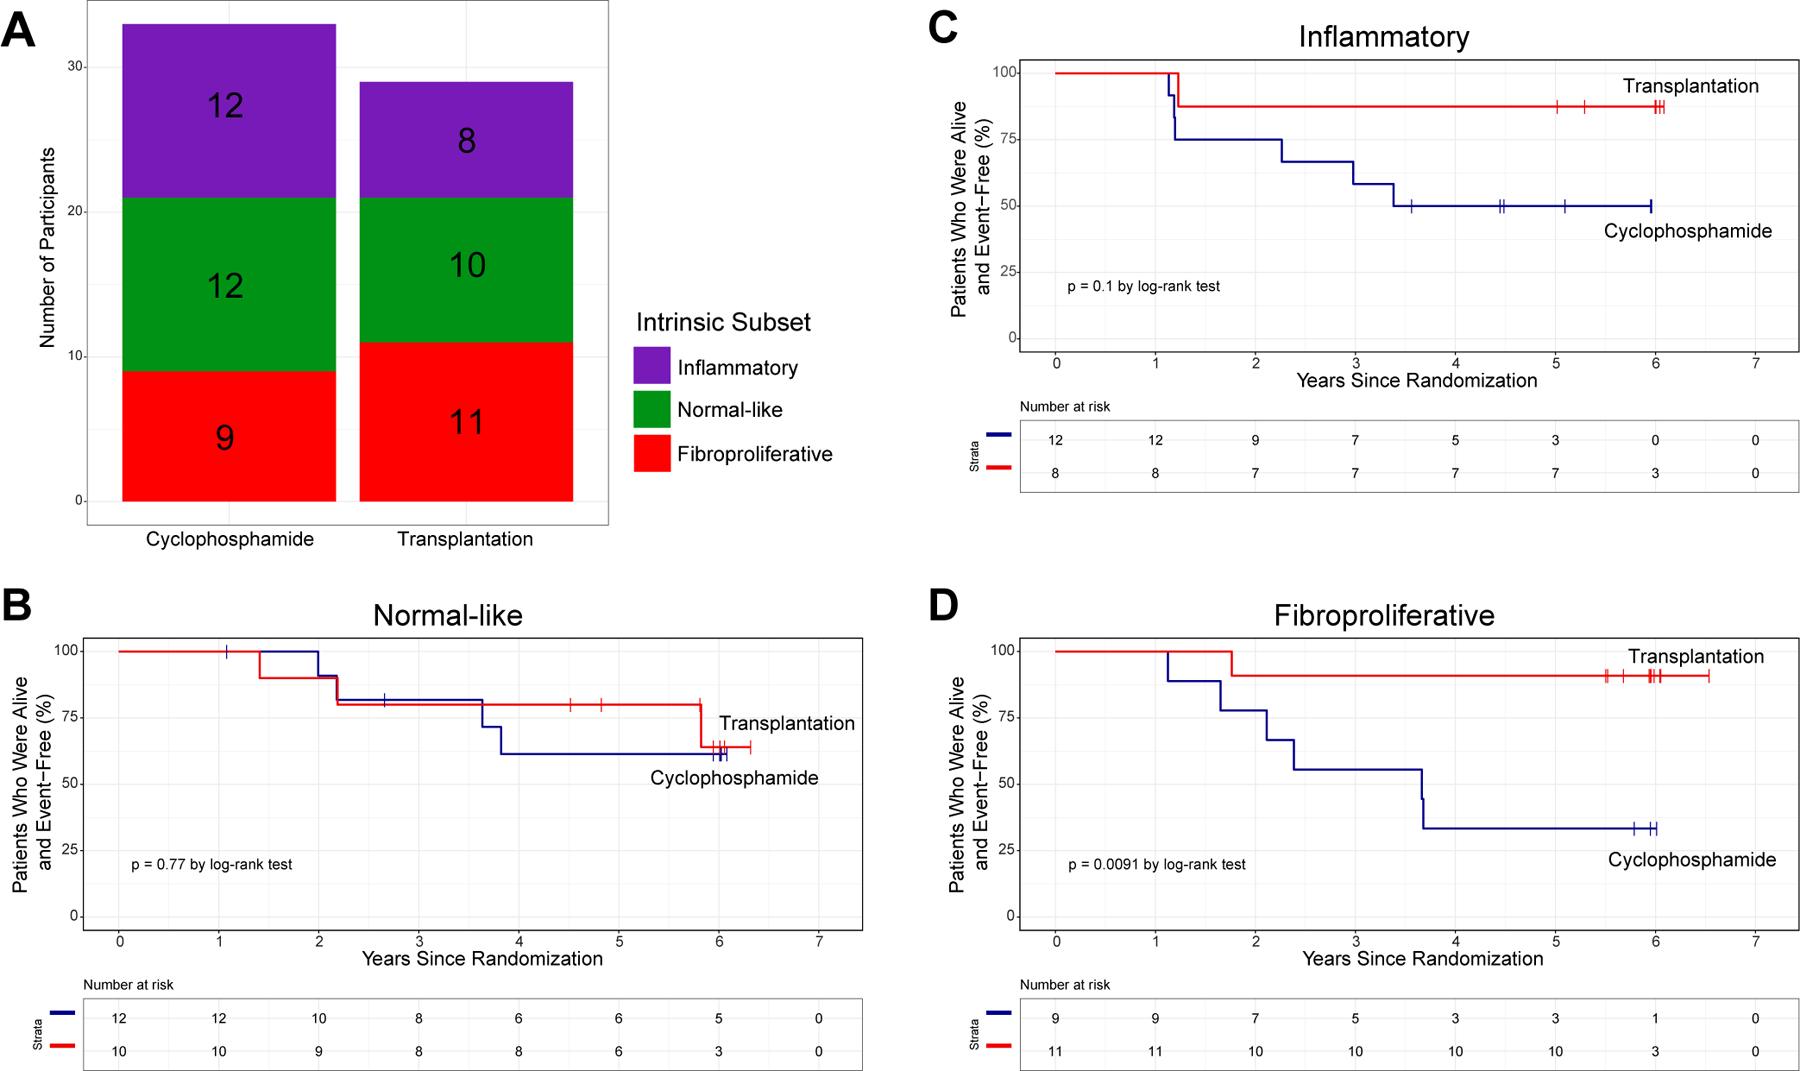
Survival analysis stratified by intrinsic molecular subset. (A) The number of participants assigned to each intrinsic subset at baseline was not significantly different between treatment arms. EFS analysis by treatment arm (HSCT in red, CYC in blue) for participants assigned to the (B) normal-like, (C) inflammatory and (D) fibroproliferative intrinsic subsets. P values are for Fisher’s exact test (A) and Mantel-Haenszel (log-rank) χ2 test (B–D). CYC, cyclophosphamide; EFS, event-free survival; HSCT, haematopoietic stem cell transplant.
We compared the EFS between treatment arms, stratified by intrinsic subset. Within the normal-like subset, there was no difference in EFS between participants in the HSCT and CYC arms (p=0.77, figure 3B). Participants assigned to the inflammatory subset trended towards improved EFS in HSCT arm, which did not reach significance (p=0.1, figure 3C). Strikingly, participants assigned to the fibroproliferative subset who received HSCT experienced significant improvement in EFS compared with fibroproliferative participants who received CYC (p=0.0091, figure 3D).
We performed the same EFS analysis stratified by treatment arm. Though there were no significant differences in EFS between intrinsic subsets in either treatment arm (online supplemental figure S4), there are evident trends. In the CYC arm, the normal-like participants tend to have the best long-term survival. The fibroproliferative subset has the lowest EFS in the CYC arm while the inflammatory subset shows intermediate EFS. Notably, this trend is exactly the opposite in the HSCT arm: fibroproliferative participants have the best long-term survival, followed by inflammatory, and the normal-like subset has the lowest EFS.
The results from both EFS analyses suggest that neither CYC nor HSCT changes the long-term disease trajectory for the normal-like subset. Though results did not reach statistical significance, it is evident that the inflammatory subset may still see some long-term benefit from HSCT. The fibroproliferative participants are the most likely to see increased long-term EFS with HSCT.
DEGs over time
We investigated longitudinal effects of HSCT and CYC on gene expression in PBC samples using baseline and follow-up time points up to 54 months in a subset of SCOT participants. At each timepoint, numbers of PBC specimens evaluated in HSCT and CYC arms were similar (figure 4A). However, there was significant difference between HSCT and CYC arms in terms of number of significant DEGs (figure 4B; p<0.001, Fisher’s exact test at each time point). Principal component analysis of all genes between paired participant samples at baseline and 48/54 months showed little differentiation between pre-treatment and post-treatment with CYC (online supplemental figure S5A). However, we observed significant variability in the HSCT arm evidenced by distinct groups between the pre-treatment and post-treatment samples (online supplemental figure S5B).
Figure 4.
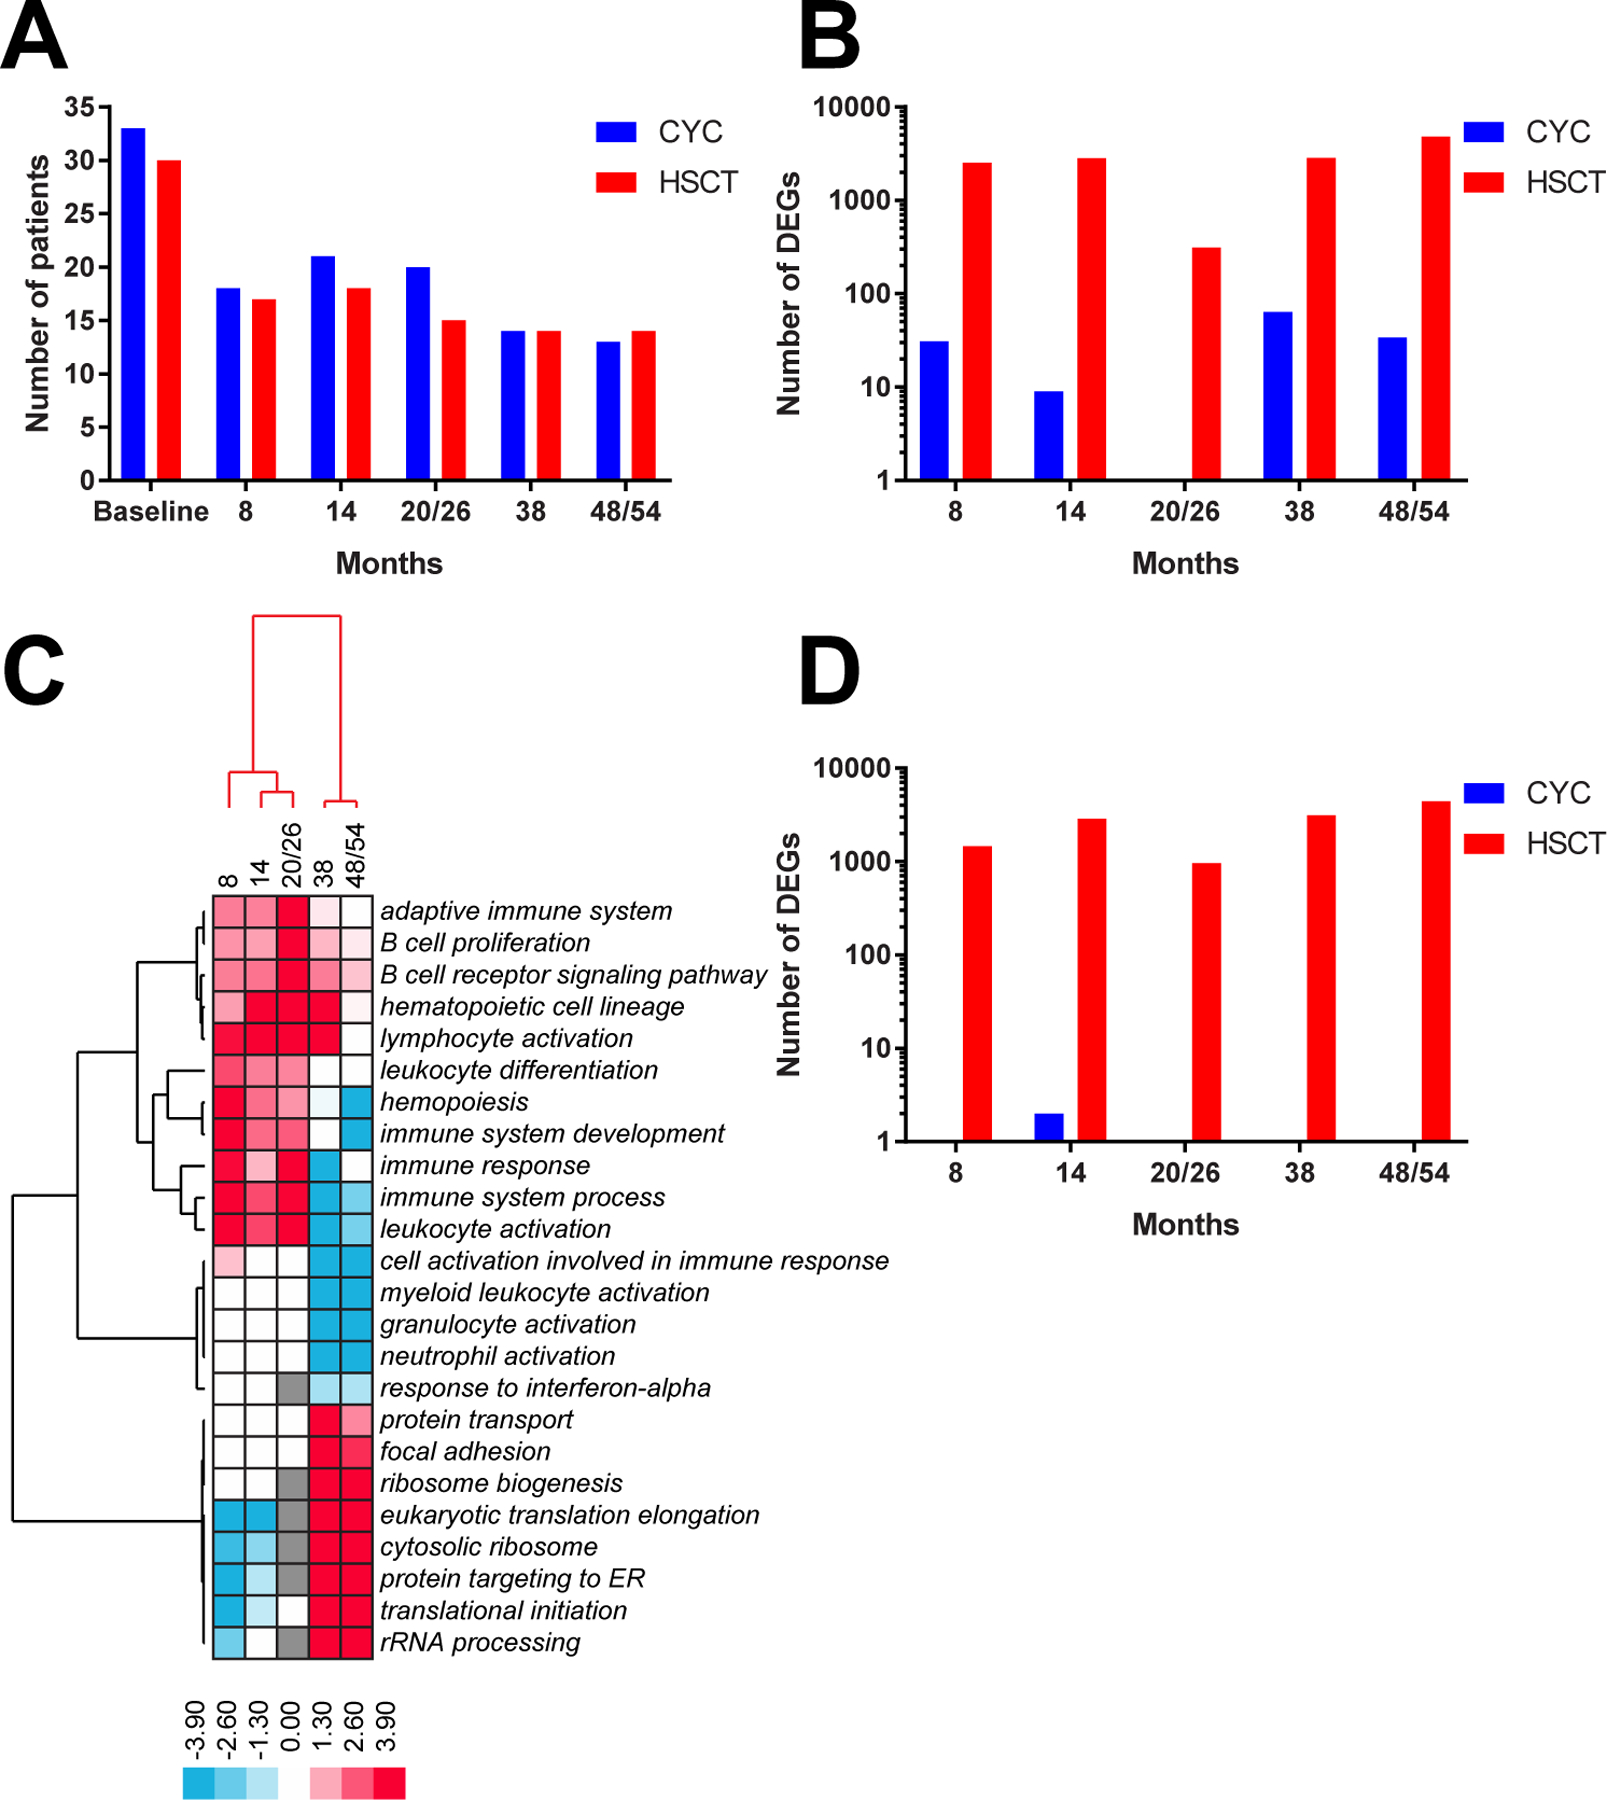
Differential gene expression analyses. Comparison between HSCT and CYC arms in terms of (A) number of available samples and (B) number of DEGs for each baseline/follow-up analysis. (C) longitudinal changes in sample functional terms in HSCT arm. The data structure was driven by clusters of earlier (8, 14, 20/26 months) and later (38, 48/54 months) time points. Each cell in a heatmap represents an ‘enrichment log’ for a given functional term at a given follow-up time point reflecting the significance of a functional enrichment (see the Methods section) in at least 2/5 comparisons. negative ‘enrichment logs’ correspond to functional terms for DEGs downregulated at follow-up and positive ‘enrichment logs’ correspond to functional terms for DEGs upregulated at follow-up with respect to baseline. (D) comparison between HSCT and CYC arms in terms of DEGs for participants with EFS and specimens available for all time points. CYC, cyclophosphamide; DEGs, differentially expressed genes; EFS, event-free survival; HSCT, haematopoietic stem cell transplant.
The DEGs for each baseline/follow-up comparison in HSCT arm were analysed for significantly enriched pathways that changed with respect to participant baseline. For each sample term, we calculated an ‘enrichment log’ of its functional enrichment p value from g:Profiler (see the Methods section) and visualised those values for all follow-up timepoints (figure 4C). The genes that map to each pathway and are differentially expressed at each timepoint can be found in online supplemental table S8. Early timepoints (8, 14 and 20/26 months) were characterised by increased expression of three distinct groups of pathways related to immune system signalling. The first group included adaptive immune system, B cell receptor signalling pathway and lymphocyte activation while the second group included hemopoiesis, immune response and leukocyte activation, among others. Both groups generally displayed decreased expression in later (38 and especially 48/54 months) time points. A third group included granulocyte activation and response to interferon-alpha. Later time points were characterised by increased expression of pathways related to translation such as ribosome biogenesis, cytosolic ribosome and translational initiation.
Samples at 38 months appeared to represent a switch from increased to decreased immune system signalling. While they still showed increased expression of B cell receptor signalling pathway and lymphocyte activation (similar to 8–20/26 months) they also exhibited significant decrease in such processes as granulocyte activation, myeloid leukocyte activation and neutrophil activation. By 48/54 months of HSCT treatment, the switch appeared to be complete as the immune signalling pathways were now uniformly decreased.
We repeated this analysis for the participants who experienced EFS and had specimens available at all timepoints (13 HSCT, 7 CYC). Similar to general trends across HSCT arm, participants with EFS showed robust expression changes in terms of increased immune signatures at 8–20/26 months, followed by their transition from increased to decreased at 38 months and significant overall decrease at 48/54 months. No changes were observed in CYC participants with EFS (figure 4D; p<0.001, Fisher’s exact test at each time point).
The absence of DEGs in seven CYC participants with EFS and all timepoints could be attributed to the small sample size of this group. In order to rule this out, we added four more CYC participants who did not have specimens at all timepoints but had EFS and specimens at 48/54 months bringing the group size to 11. This set of CYC participants with EFS still resulted in only two significant DEGs at 48/54 mo. We also performed the analysis on 7 randomly selected HSCT participants with EFS and found 99 DEGs at 48/54 mo, even with decreased sample size. Therefore, we observed major differences between HSCT and CYC arms in terms of differential expression particularly when comparing participants with EFS.
DISCUSSION
The SCOT trial reported improved long-term EFS for participants with severe scleroderma who received HSCT compared with participants who received CYC. Our work represents a randomised study of immune reconstitution and builds on the results of the SCOT trial by providing genomic insight into the long-term molecular effects of CYC or HSCT. Importantly, our results exemplify that genomic and immune signatures are intertwined and impacted by stem cell transplantation (ie, differential expression is a function of treatment), similar to those observed by Assassi et al who observed a normalisation of gene expression after transplant.26 Participants treated with HSCT demonstrated changes in gene expression but not all attained EFS at 54 months. Conversely, participants treated with CYC who attained EFS did not exhibit significant DEGs.
In this analysis, we identified intrinsic molecular subsets in SCOT participants using machine learning classification of gene expression from peripheral blood. This is the first time that the SSc intrinsic molecular subsets have been identified in blood, and this represents an important advancement in clinical utility of a biospecimen that is more easily and readily accessible. It is important to note that the fibroproliferative, inflammatory and normal-like patients are not currently clinically distinguishable when analysing a cohort of dcSSc patients, and gene expression profiling must be performed to identify these individuals.
In small pilot clinical trials, the SSc intrinsic molecular subsets in skin identify participants most likely to benefit from treatment. SSc participants who improved with abatacept were classified in the inflammatory subset27 and mycophenolate mofetil has been linked to decreases in the inflammatory signature coincident with MRSS improvement.8,28,29 Until now, no DMARD treatments have been associated with clinical improvement for SSc participants in the fibroproliferative subset.
In this study, we demonstrated that HSCT is particularly effective for those with severe diffuse SSc who have a baseline fibroproliferative phenotype. Work from prior studies has suggested that normal-like patients have the longest disease duration6,30 and may represent late-stage disease. A change to normal-like over time in this setting could be influenced by the inherent design of the study, because the later time points for longitudinal samples come from participants with EFS. To determine if patients transition to normal-like with treatment requires further study with appropriate controls.
Limitations of this study are that these analyses were exploratory and not pre-specified in the SCOT study protocol, and there were a limited number of samples available for gene expression analysis. Therefore, these findings need to be independently confirmed in prospectively collected samples.
This body of work demonstrates that there may be significant prognostic value in assigning intrinsic subsets for patients with SSc. One may be able to predict clinical outcomes based on a patient’s gene expression subset at baseline. Identifying the treatments most likely to benefit an individual will ultimately lead to improved outcomes and faster time to clinical improvement for patients with SSc, setting the stage for personalised therapy and precision medicine in SSc and related conditions.
Supplementary Material
Key messages
What is already known about this subject?
Haematopoietic stem cell transplant (HSCT) has demonstrated clinical benefit and normalises gene expression compared with cyclophosphamide (CYC) in patients with systemic sclerosis (SSc).
The intrinsic gene expression subsets have been shown to be a reproducible feature of SSc that are observed across multiple tissues and distinct patient cohorts.
What does this study add?
This study shows that molecular subsets can be identified in PBC samples.
Participants from the fibroproliferative intrinsic subset on HSCT experienced significant improvement in event-free survival (EFS) compared with fibroproliferative participants on CYC. EFS did not significantly differ between CYC and HSCT arms for the participants from the normal-like intrinsic subset.
How might this impact on clinical practice or future developments?
This study suggests that intrinsic subset patient stratification may be used to identify patients with SSc who receive significant benefit from HSCT.
Funding
Supported by awards from the Scleroderma Research Foundation (MLW), Burroughs-Wellcome PUP Big Data in the Life Sciences Training Program, the National Institutes of Health BD2K T32 5T32LM012204–03 (JMF), and the Dr Ralph and Marian Falk Medical Research Trust (MLW) to Dartmouth College, NIH NIAID grants (N01-AI05419 and HHSN272201100025C) to Duke University, and to Rho, the statistical and clinical coordinating center (N01-AI25481, HHSN272200900057C and 1UM2AI117870).
Competing interests
MLW reports grants and personal fees from Celdara Medical, grants and personal fees from Bristol Myers Squib, personal fees from Acceleron, personal fees from Abbvie, grants and personal fees from Corbus, personal fees from Boehringer Ingelheim, outside the submitted work. MDM reports personal fees from Medtelligence, personal fees from Actelion Pharma, personal fees from Astellas, personal fees from Mitsubishi-Tanabe, grants from Bayer, grants from Reata, grants from Sanofi, grants from Corbus, grants and personal fees from Boehringer-Ingelheim, grants and personal fees from EICOS, grants and personal fees from Galapagos, grants from GSK, outside the submitted work. DEF reports grants from Actelion, grants and personal fees from Amgen, grants and personal fees from Bristol Myers Squibb, grants and personal fees from Galapagos, grants and personal fees from Novartis, grants and personal fees from Pfizer, grants from Sanofi, grants from Roche/Genentech, grants and personal fees from Corbus, grants from GSK, outside the submitted work. All other authors have nothing to disclose.
Patient and public involvement
Patients participated in the clinical trial and the study was in part funded by the Scleroderma Research Foundation, which includes scleroderma patients and advocates.
Footnotes
Ethics approval The SCOT study protocol was approved by the local Institutional Review Boards of the participating institutions.
Data availability statement
Data are available in a public, open access repository. The gene expression data and related deidentified clinical information are available on the Gene Expression Omnibus (GEO) database-accession number: GSE134310.
REFERENCES
- 1.Distler O, Gahlemann M, Maher TM. Nintedanib for systemic sclerosis-associated interstitial lung disease. reply. N Engl J Med 2019;381:1596–7. [DOI] [PubMed] [Google Scholar]
- 2.Steen VD, Medsger TA. Changes in causes of death in systemic sclerosis, 1972–2002. Ann Rheum Dis 2007;66:940–4. [DOI] [PMC free article] [PubMed] [Google Scholar]
- 3.Barnes J, Mayes MD. Epidemiology of systemic sclerosis: incidence, prevalence, survival, risk factors, malignancy, and environmental triggers. Curr Opin Rheumatol 2012;24:165–70. [DOI] [PubMed] [Google Scholar]
- 4.LeRoy EC, Black C, Fleischmajer R, et al. Scleroderma (systemic sclerosis): classification, subsets and pathogenesis. J Rheumatol 1988;15:202–5. [PubMed] [Google Scholar]
- 5.Steen VD, Medsger TA. Severe organ involvement in systemic sclerosis with diffuse scleroderma. Arthritis Rheum 2000;43:2437–44. [DOI] [PubMed] [Google Scholar]
- 6.Milano A, Pendergrass SA, Sargent JL, et al. Molecular subsets in the gene expression signatures of scleroderma skin. PLoS One 2008;3:e2696. [DOI] [PMC free article] [PubMed] [Google Scholar]
- 7.Pendergrass SA, Lemaire R, Francis IP, et al. Intrinsic gene expression subsets of diffuse cutaneous systemic sclerosis are stable in serial skin biopsies. J Invest Dermatol 2012;132:1363–73. [DOI] [PMC free article] [PubMed] [Google Scholar]
- 8.Hinchcliff M, Huang C-C, Wood TA, et al. Molecular signatures in skin associated with clinical improvement during mycophenolate treatment in systemic sclerosis. J Invest Dermatol 2013;133:1979–89. [DOI] [PMC free article] [PubMed] [Google Scholar]
- 9.Taroni JN, Martyanov V, Huang C-C, et al. Molecular characterization of systemic sclerosis esophageal pathology identifies inflammatory and proliferative signatures. Arthritis Res Ther 2015;17:194. [DOI] [PMC free article] [PubMed] [Google Scholar]
- 10.Taroni JN, Greene CS, Martyanov V, et al. A novel multi-network approach reveals tissue-specific cellular modulators of fibrosis in systemic sclerosis. Genome Med 2017;9:27. [DOI] [PMC free article] [PubMed] [Google Scholar]
- 11.Sargent JL, Milano A, Bhattacharyya S, et al. A TGFbeta-responsive gene signature is associated with a subset of diffuse scleroderma with increased disease severity. J Invest Dermatol 2010;130:694–705. [DOI] [PMC free article] [PubMed] [Google Scholar]
- 12.Sullivan KM, Goldmuntz EA, Keyes-Elstein L, et al. Myeloablative autologous stem-cell transplantation for severe scleroderma. N Engl J Med 2018;378:35–47. [DOI] [PMC free article] [PubMed] [Google Scholar]
- 13.van Laar JM, Farge D, Sont JK, et al. Autologous hematopoietic stem cell transplantation vs intravenous pulse cyclophosphamide in diffuse cutaneous systemic sclerosis: a randomized clinical trial. JAMA 2014;311:2490–8. [DOI] [PubMed] [Google Scholar]
- 14.Burt RK, Shah SJ, Dill K, et al. Autologous non-myeloablative haemopoietic stem-cell transplantation compared with pulse cyclophosphamide once per month for systemic sclerosis (assist): an open-label, randomised phase 2 trial. Lancet 2011;378:498–506. [DOI] [PubMed] [Google Scholar]
- 15.Sullivan KM, Shah A, Sarantopoulos S, et al. Review: hematopoietic stem cell transplantation for scleroderma: effective immunomodulatory therapy for patients with pulmonary involvement. Arthritis Rheumatol 2016;68:2361–71. [DOI] [PMC free article] [PubMed] [Google Scholar]
- 16.Binks M, Passweg JR, Furst D, et al. Phase I/II trial of autologous stem cell transplantation in systemic sclerosis: procedure related mortality and impact on skin disease. Ann Rheum Dis 2001;60:577–84. [DOI] [PMC free article] [PubMed] [Google Scholar]
- 17.Majhail NS, Mau LW, Denzen EM, et al. Costs of autologous and allogeneic hematopoietic cell transplantation in the United States: a study using a large national private claims database. Bone Marrow Transplant 2013;48:294–300. [DOI] [PMC free article] [PubMed] [Google Scholar]
- 18.Franks JM, Martyanov V, Cai G, et al. A machine learning classifier for assigning individual patients with systemic sclerosis to intrinsic molecular subsets. Arthritis Rheumatol 2019;71:1701–10. [DOI] [PMC free article] [PubMed] [Google Scholar]
- 19.Reich M, Liefeld T, Gould J, et al. GenePattern 2.0. Nat Genet 2006;38:500–1. [DOI] [PubMed] [Google Scholar]
- 20.de Hoon MJL, Imoto S, Nolan J, et al. Open source clustering software. Bioinformatics 2004;20:1453–4. [DOI] [PubMed] [Google Scholar]
- 21.Saldanha AJ. Java Treeview--extensible visualization of microarray data. Bioinformatics 2004;20:3246–8. [DOI] [PubMed] [Google Scholar]
- 22.Tusher VG, Tibshirani R, Chu G. Significance analysis of microarrays applied to the ionizing radiation response. Proc Natl Acad Sci U S A 2001;98:5116–21. [DOI] [PMC free article] [PubMed] [Google Scholar]
- 23.Reimand J, Kull M, Peterson H, et al. g:Profiler--a web-based toolset for functional profiling of gene lists from large-scale experiments. Nucleic Acids Res 2007;35:W193–200. [DOI] [PMC free article] [PubMed] [Google Scholar]
- 24.Team RC. R: a language and environment for statistical computing. R Foundation for Statistical Computing 2016. [Google Scholar]
- 25.Langfelder P, Horvath S. WGCNA: an R package for weighted correlation network analysis. BMC Bioinformatics 2008;9:559. [DOI] [PMC free article] [PubMed] [Google Scholar]
- 26.Assassi S, Wang X, Chen G, et al. Myeloablation followed by autologous stem cell transplantation normalises systemic sclerosis molecular signatures. Ann Rheum Dis 2019;78:1371–8. [DOI] [PMC free article] [PubMed] [Google Scholar]
- 27.Chakravarty EF, Martyanov V, Fiorentino D, et al. Gene expression changes reflect clinical response in a placebo-controlled randomized trial of abatacept in patients with diffuse cutaneous systemic sclerosis. Arthritis Res Ther 2015;17:159. [DOI] [PMC free article] [PubMed] [Google Scholar]
- 28.Hinchcliff M, Toledo DM, Taroni JN, et al. Mycophenolate mofetil treatment of systemic sclerosis reduces myeloid cell numbers and attenuates the inflammatory gene signature in skin. J Invest Dermatol 2018;138:1301–10. [DOI] [PMC free article] [PubMed] [Google Scholar]
- 29.Gordon JK, Martyanov V, Franks JM, et al. Belimumab for the treatment of early diffuse systemic sclerosis: results of a randomized, double-blind, placebo-controlled, pilot trial. Arthritis Rheumatol 2018;70:308–16. [DOI] [PMC free article] [PubMed] [Google Scholar]
- 30.Assassi S, Swindell WR, Wu M, et al. Dissecting the heterogeneity of skin gene expression patterns in systemic sclerosis. Arthritis Rheumatol 2015;67:3016–26. [DOI] [PMC free article] [PubMed] [Google Scholar]
Associated Data
This section collects any data citations, data availability statements, or supplementary materials included in this article.
Supplementary Materials
Data Availability Statement
Data are available in a public, open access repository. The gene expression data and related deidentified clinical information are available on the Gene Expression Omnibus (GEO) database-accession number: GSE134310.