

ABSTRACT
The adaptation of tumour cells to hypoxic microenvironment is one of the most significant characteristics of many malignant tumour diseases including hepatocarcinoma. Recently, long non-coding RNAs (lncRNAs) have been reported to play important roles in the various levels of gene regulation thus functioning in growth and survival of tumour cells. Here, new hypoxia-related lncRNAs in hepatocarcinoma cells were screened and validated by lncRNA chip-array as well as real-time RT-PCR. Among them, a hypoxia-activated lncRNA that we identified and termed Hypoxia-Activated BNIP3 Overlapping Non-coding RNA (HABON), was not only regulated by hypoxic-induced factor-1α (HIF-1α) but its expression increased significantly under hypoxia in tumour cells. We deciphered the biological characteristics of HABON including its cell localization, genomic location, as well as its full-length sequence, and proved HABON could promote growth, proliferation and clone-formation of hepatocarcinoma cells under hypoxia. Then, we revealed that HABON was transcriptionally activated by HIF-1α in hypoxic cells, furthermore, it could interact with HIF-1α and promote its protein degradation, thus affecting transcription of HIF-1α’s target genes to exert its effects on cells. Besides, the elevated expression of HABON under hypoxia could promote the transcriptional activation of BNIP3 through HIF-1α, and increasing the expression level of BNIP3. This research provides a novel clue for the adaptive survival and growth mechanism of tumour under hypoxia, and gives a way to reveal the nature of tumour cells’ resistance characteristics to harsh microenvironment.
KEYWORDS: Hepatocarcinoma, hypoxia, lncRNA, HABON, HIF-1α, BNIP3
Introduction
Hepatocarcinoma or liver cancer is one of the most serious malignant tumour diseases that has high morbidity and mortality[1,2]. New cases of liver cancer are increasing at a striking rate especially in East Asia. Hepatitis B virus carriers in China climbs to 90 million, accounting for 54% of the world. Nearly 400 000 people die of liver cancer every year [1,2]. Hepatoinflammation caused by hepatitis virus infection, fatty liver and so on is an important factor of it [3,4]. The occurrence and development of liver cancer is a complex process, and its molecular mechanism needs further studies.
With the development of research, people realized that the biological behaviour of cancer depends not only on tumour cells themselves but also on their interaction with their environment. Hypoxia is a crucial environmental factor [5–8]. Solid tumours are full of mild hypoxia area [9–11], and reports have shown that tumour with hypoxia (pO2 < 10 mmHg) is related to the increase of mortality [12]. As early as 1956, Warburg effect proposed by Warburg et al. pointed tumour cells tend to use glycolysis to obtain energy rather than oxidative phosphorylation in normal cells [13]. This metabolic reprogramming is considered as a sign of cancer [14]. Cancer cells must optimize nutrition utilization when resources are scarce, and hypoxia regulation plays a crucial role in it.
Early on 1990s, the research teams of Semenza, G.L, Ratcliffe, P.J, Kaelin Jr., W.G. et al. laid the foundation of hypoxia research. It was found that the hypoxia inducing factors (HIFs) including the HIF-1, HIF-2 complexes, which consisted by alpha and beta proteins while beta proteins for the compositional stable expression and alpha proteins regulated by multiple factors, were involved in core regulatory process under hypoxia [15–17]. Thus, HIF-1α, HIF-2α and their regulations are the most critical parts of cell stress on hypoxic environment [5,15,16,18,19]. The whole HIF-1α protein contains 826 amino acid residues, of which 402,564 proline residues are key functional sites for Von Hippel-Lindau protein (VHL) and other factors to bind and regulate it to rapidly degrade through proteasome pathway mediated by proline hydroxylation under normoxic condition [20–23]. The FIH domain, which containing 803 asparagine residues, is the binding regulatory region of CBP/p300 transcription factors [24–26]. Although HIF-1α or HIF-2α protein has been synthesized in cells under normoxic condition, it will degrade rapidly and is unable to accumulate its protein amount; however, under hypoxia, the two proteins can accumulate significantly, and perform their transcriptional activities by entering nucleus, interacting with HIF-1β, CBP/p300 and other transcription regulatory factors, binding with the target gene hypoxia regulatory element HRE [27], to regulate the expression of a large number of related genes affecting the survival, growth, proliferation, invasion and metastasis of tumour cells under hypoxia [15,18,19]. For example, proteins coded by GLUT1, HK2, LDHA genes are the key enzymes of glucose uptake and glycolysis pathway. HIF-1α can activate their expression, thus enhancing the relative activity of cells under hypoxia, so that cells can adapt to the hypoxic environment [28,29]. While heavily dependent on glycolysis rather than aerobic respiration is a sign of tumour cells, this provides an important guarantee for survival and growth of tumour cells under the microenvironment of relatively insufficient oxygen and energy [13]. The angiogenesis factor VEGF regulating the formation of tissue vessels is also activated by HIF-1α, to make it conducive to the uptake of nutrients and energy by cells under hypoxia [30]. BNIP3, belongs to BH3 only subfamily with only BH-3 domain related to mitochondrial function, is another target gene of HIF-1α which can induce cell apoptosis and autophagy under hypoxia [31,32].
However, many mechanism details of hypoxia regulation are still unclear. In recent years, people pay more attention to the function of noncoding RNA, of which long non-coding RNA (lncRNA) is a prominent part. LncRNA generally refers to noncoding RNA with more than 200 nucleotides, which accounts for the largest proportion in human transcriptome [33–35]. LncRNA participates in gene transcriptional regulation, chromatin modification, RNA processing, stability regulation and other important regulatory processes through cis- and trans- regulatory mechanisms in cytoplasm and nucleus [36,37], and plays an important role in various functions of tumour cells, thus becoming a hot research topic [38–40]. For example, HULC is a confirmed lncRNA specifically expressed by hepatocytes and up-regulated in liver cancer tissue, and can promote tumour by regulating ZAK protein expression in ERK/MAPK signalling pathway to be directly related to prognosis [41,42]; high expression of HOTAIR(HOX transcript antisense RNA) in tumour cells can reduce the expression of tumour metastasis suppressor genes and promote tumour metastasis, malignant transformation, while its expression level in liver cancer tissues is closely related to tumour metastasis and recurrence [43]; MEG3 is a tumour suppressor lncRNA, which plays a role in the process of apoptosis of liver cancer cells [44,45].
Many lncRNAs with abnormal expression and regulation responses under hypoxia, such as H1946 lincROR [47] and NEAT148, are increased in a variety of cancer tissues, while lncRNA-LET, ENST00000480739 are down-regulated [49,50]. These responses are closely related to HIF of HRE-binding in the promoter region [51]. HIF-1α can specifically bind to HRE on promoter to regulate the expression of HOTAIR [52]. Some lncRNA plays a regulatory role under hypoxia in tumour cells, such as participating in regulating tumour growth, vascular formation, invasion and metastasis [48,53]. In lung cancer cells, for example, increased HOTAIR can reduce the expression of tumour metastasis suppressor genes to promote tumours while inhibiting the expression of HOTAIR in HeLa cells can make them lose the ability of metastasis [43]; lnc-p21 is not only regulated by the transcription of HIF-1α in HeLa cells under hypoxia but also plays a reciprocal regulation with HIF-1α, ultimately affecting the metabolism of HeLa cells [54], and so on [42,46,48,49,50,55–64].
However, compared with the large amount of lncRNAs, the above researches are still only a drop in the bucket. This field needs to be further understood especially the biological roles and mechanisms of lncRNAs in tumour cells under hypoxia. Therefore, we focus on the role of lncRNAs regulated by hypoxia in hepatocarcinoma cells, looking for the significantly changed lncRNAs under hypoxia and explore their roles on HIF. First, we screened the up-regulated lncRNAs under hypoxia by RNA expression profile assay and verified their expression in different cancer cell lines through real-time RT-PCR. Among them, we identified a hypoxia-activated lncRNA that we termed hypoxia-activated BNIP3 Overlapping Non-coding RNA (HABON), was not only regulated by hypoxia-induced factor-1α (HIF-1α) but its expression increased significantly under hypoxia in a variety of tumour cells. We proved HABON promote the proliferation and clone formation of hepatocarcinoma cells under hypoxia. Furthermore, the interaction factors were detected to elucidate the mechanism especially its effect on HIF-1α. These studies can provide some guidance for clarifying the biological behaviour of hepatocarcinoma cells under hypoxia.
Result
HABON is up-regulated in hepatocarcinoma cells under hypoxia
To obtain lncRNAs with significant expression changes in cells under hypoxia, we cultured SMMC-7721 (a hepatocellular carcinoma cell line) cells in normoxia (20% oxygen, N) or hypoxia (1% oxygen, Hx) environment, respectively, and analysed the lncRNA (mRNA) expression microarray (Fig. 1A). The results of mRNA cluster analysis show that the HIF-1 signalling is the top-changed signal pathway, which also demonstrates the reliability of experiments and the microarray (Fig. 1B). The expression of 1236 lncRNAs was significantly (p < 0.05) up-regulated more than two-folds after hypoxia treatment in SMMC-7721 cells; while 742 lncRNAs’ expression decreased more than two-folds significantly (Fig. 1C). Only 99 of the 1,236 hypoxia-increased lncRNAs are already included in the NCBI RefSeq database, and the rest are new lncRNAs that lack reliable researches. For further study, we limited to more than 6 folds’ increase under hypoxia (p < 0.05), thus 52 lncRNAs were obtained, such as ENST00000551539, NR_038262, ENST00000517565, ENST00000412143, ENST00000560010, ENST00000417355, uc001lku.1(AK125699), TCONS_00008647, uc003xew.3, TCONS_000023842, etc.(Fig. 1D, Tab.S4).
Figure 1.
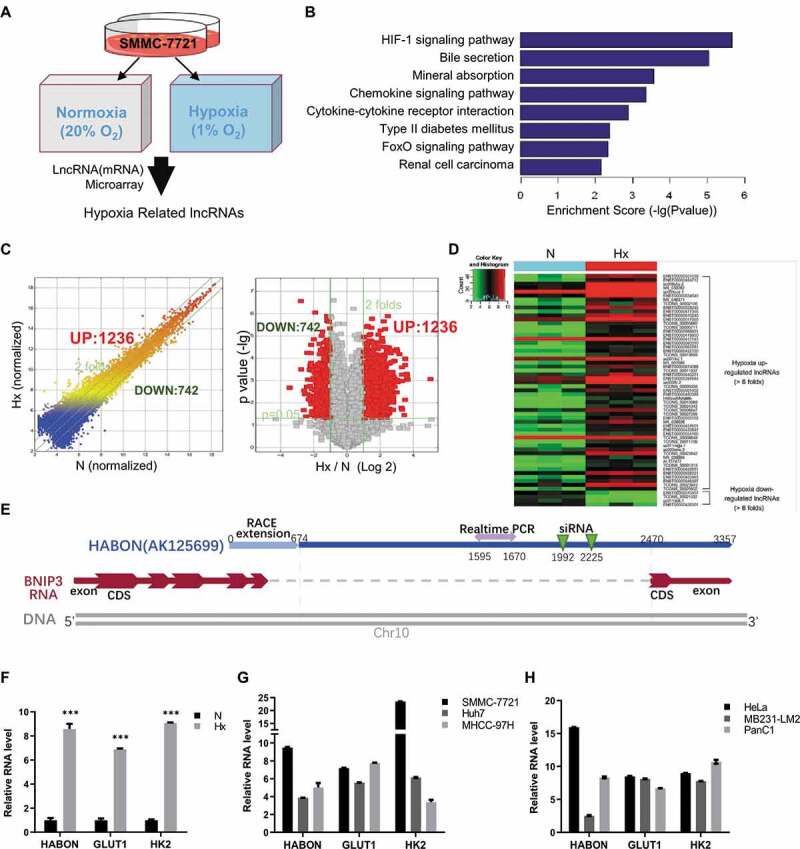
HABON is up-regulated in hepatocarcinoma cells under hypoxia
A, Schematic of hypoxia/normoxia related lncRNA microarray in hepatocellular carcinoma cell SMMC-7721;B, Pathway enrichment analysis in microarray of mRNAs with significant differential expression between the hypoxic group and the normoxic group;C, Comparative analysis of lncRNAs’ expression between hypoxia (Hx) and normoxia (N) in microarray;D, The most up/down-regulated lncRNAs under hypoxia in microarray;E, Schematic map of location of HABON gene on human genome;F, Relative expression level of HABON RNA under hypoxia or normoxia in SMMC-7721 cells was detected by real-time PCR;G, H, Real-time PCR was used to detect the expression of HABON in liver cancer cells/non-liver-cancer cells under normoxia/hypoxia. The vertical coordinate was expression folds under hypoxia (normalized with normoxic group, Hx/N).
Next, we screened and verified the above 52 lncRNAs. First, real-time polymerase chain reaction (PCR) was used to detect expressions of lncRNAs in hypoxia culture compared with that in normoxia culture in SMMC-7721 cells (Fig.S1). Most of them were successfully amplified and up-regulated obviously in hypoxia group, which was consistent with the results of the microarray; nevertheless there were also large differences on No.12, 13, 18, 19, 24, 29 between the results and the microarray. We also verified these lncRNAs in different liver cancer cell lines such as Hep-G2, Huh-7 and non-liver cancer cell lines (Fig.S2). The results showed that lncRNA No.3, 9, 17, 20, 42 were significantly up-regulated under hypoxia in various cells, suggesting these lncRNAs may have universal and more important functions in survival of tumour cells under hypoxia (Tab.S5).
Among them, uc001lku.1 (AK125699, No. 20) had attracted our attention because of some related pre-experiments (such as RNA-IP by HIF and the effect of knockdown in cells on growth and proliferation). The basic information of lncRNA uc001lku.1 came from the UCSC database (the same as AK125699 in RefSeq). Its genome location is near the coding gene BNIP3 within some overlaps (the quantitative PCR primers and siRNA knockdown sequences were all designed into the non-overlapping region considering the interference of BNIP3 gene) (Fig. 1E). We named this lncRNA hypoxia-activated BNIP3 Overlapping Non-coding RNA, HABON in brief. The expression of HABON in SMMC-7721 cells under hypoxia was 8.6 times higher than that under normoxia (p < 0.01), which was similar to GLUT1 and HK2 (reported as significantly up-regulated genes in hypoxia) (Fig. 1F); in addition, it also had a significant increase under hypoxia in various liver cancer cell lines such as Huh-7, MHCC-97 h and non-liver cancer cells such as HeLa, MDA 231-LM2 and PANC1 (Fig. 1G,Fig. 1H). These results suggest that HABON is significantly up-regulated under hypoxia in various tumour cells, thus it may play a noteworthy role within.
Because the large-scale sequencing and splicing results of the database do not necessarily provide complete RNA sequence information, we further explored the location and sequence of the HABON gene. By using PCR strategy, we speculated that the transcripts of HABON and BNIP3 only overlapped in the tail part (Fig.S3A). Furthermore, rapid amplification of cDNA ends (RACE) experiment successfully extended 674nt sequence to 5ʹ-end, thus finally achieved a full-length HABON sequence of 3357 ribonucleotides (Fig.S4). To prove that HABON does not have the ability to encode protein (i.e. a lncRNA), we analysed it with the prediction tool of open reading frame and peptide BLAST (Fig.S5A,B), no ideal alignment and the low comparison score suggested it is a non-coding transcript. The protein-coding potential score also told HABON’s coding potential is very poor (Fig.S5C, comparing to GAPDH sequence). Consistently, in the in vitro translation system of reticulocytes, there was no significant protein expression in the test of HABON sequence, which also proved that it is a non-coding RNA (Fig.S5D).
HABON promotes the growth, proliferation and clone formation of hepatocarcinoma cells under hypoxia
We used small interfering RNA (siRNA) to specifically knock-down the expression of HABON in cells, and the amount of HABON was significantly decreased than control group after 1, 2 and 4 days of hypoxic culture. (about 40–55%, p < 0.01)(Fig. 2A, S3D). We also over-expressed full-length HABON in cells, and after hypoxia culture, it was significantly increased (about 10 ~ 300 folds than control, p < 0.01)(Fig. 2B).
Figure 2.
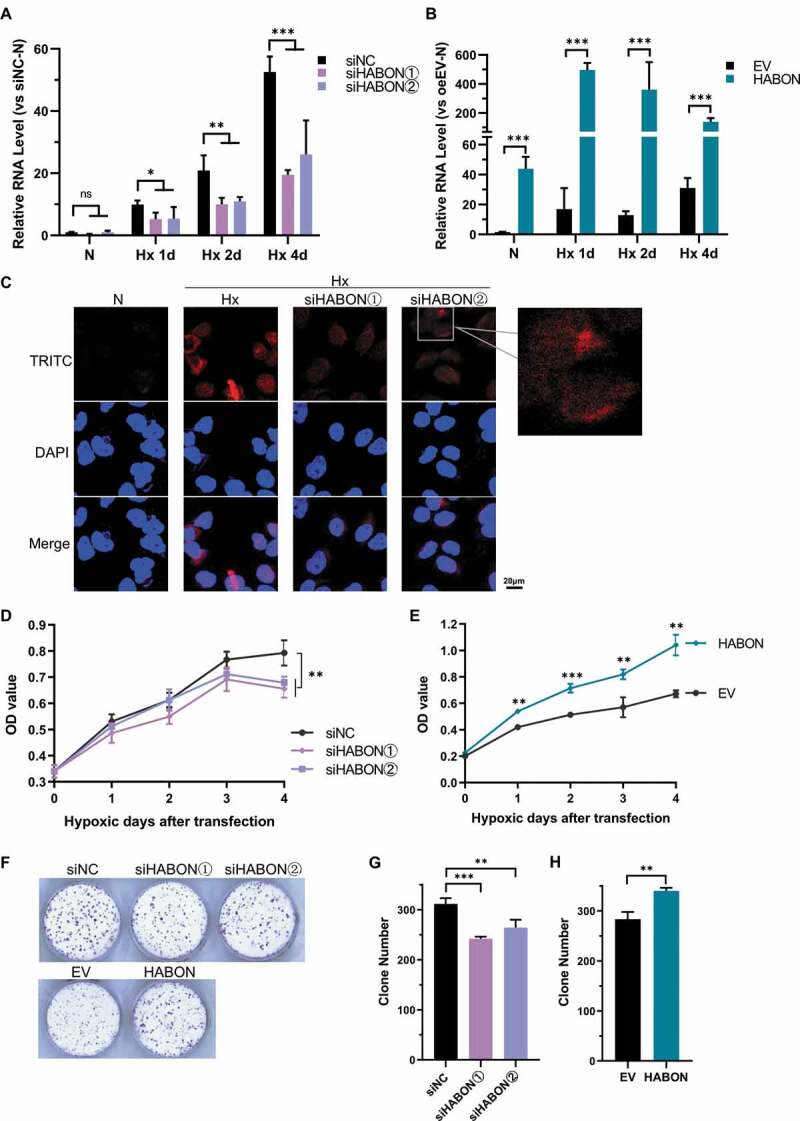
HABON promotes growth, proliferation and clone formation of hepatocarcinoma cells under hypoxia
A, Knock-down of HABON. Real-time PCR was used to detect the knock-down effect of siRNAs on the expression of HABON in SMMC-7721 cells at different time (hypoxic 1,2,4 days). The vertical coordinate was the relative expression level folds of RNA (normalized with normoxic siNC group);B, Over-expression of HABON. Real-time PCR was used to detect the over-expression effect of HABON in SMMC-7721 cells at different time (hypoxic 1,2,4 days). The vertical coordinate was the relative expression level folds of RNA (normalized with normoxic empty vector/EV group);C: Fluorescence in situ hybridization (FISH) analysis of the expression and localization of HABON in SMMC-7721 cells. HABON was labelled with TRITC red fluorescent probe while the nucleus was labelled with DAPI, and merge was the overlapping of the two (the right picture is the amplification of selected part);D,E, CCK-8 assay to detect the effect of HABON knocking-down/over-expression on the growth and proliferation of SMMC-7721 cells under hypoxia (OD is the absorbance value of 450 nm, and the photo shows cells after 4 days’ hypoxic culture);F,G,H, Clone formation results (crystal violet staining) of HABON knocking-down/overexpression in SMMC-7721 cells.
We hybridized the HABON of SMMC-7721 cells in normoxia/hypoxia with RNA fluorescence probe (Fig. 2C), and the result showed the expression of HABON was significantly increased under hypoxia then attenuated by siRNA-knockdown. In addition, it can be seen that HABON is mainly distributed in cytoplasm around the nucleus, and a small amount also distributed in the nucleus. RNA structure prediction software told its structure is complex, and may have many branches (Fig.S5E). These studies provide some clues for the subsequent function and mechanism researches.
Next, we explored the function of HABON in hepatocarcinoma cells. First of all, the growth and proliferation activity of the HABON-knockdown under hypoxia was significantly inhibited in SMMC-7721 cells (Fig. 2D). On the contrary, HABON over-expression significantly increased the growth and proliferation under hypoxia in SMMC-7721 cells (Fig. 2E). In addition, xCelligence RTCA used to record the cell growth curve of different liver cancer cells such as Hep-3B and Hep-G2 in real-time also showed that the hypoxic growth of the cells of the HABON-knockdown was inhibited (Fig.S6A-C). We have calculated the doubling time and performed the statistical test on it (Fig.S6D,E) and it indicating that HABON can accelerate the growth and proliferation of SMMC-7721 cells significantly. We have also tried to explorer the effect of HABON in the normoxic environment, and found that HABON knocking-down/over-expression has the same effect on cell growth and proliferation as in hypoxic cells (Fig.S6F,G).
HABON also plays an important role in the formation of hepatocarcinoma cell clones under hypoxia. The colony-forming ability of HABON-knockdown was significantly weaker than control, while that of HABON-over-expression was more intense in SMMC-7721 cells (Fig. 2F,G,H).
Expression of HABON is activated by HIF-1α under hypoxia
We studied the mechanism of HABON’s up-regulation in human hepatocarcinoma cells under hypoxia. As mentioned before, HIF-1α, HIF-2α and their related regulation are the most important parts of hypoxia-induced stress. In order to determine whether HABON is up-regulated by HIF protein through transcriptional activation and whether HIF-1α or HIF-2α plays decisive role under hypoxia, we knocked-down the expression of HIF-1α and HIF-2α separately in SMMC-7721 cells, and then cultured the cells in hypoxia or normoxia environment to analyse the expression of HABON (Fig. 3,S3B). The RNA and protein level of HIF-1α/HIF-2α was significantly decreased after knockdown separately both in normoxia and hypoxia (p < 0.01)(Fig. 3A,B), and the hypoxic elevated folds (Hx/N) of HABON in HIF-1α knockdown group dropped significantly than control, which was consistent with the trend of classical HIF-1α regulated genes GLUT1, HK2 (Fig. 3C); while in the HIF-2α knockdown group, there was no significant drop of hypoxic elevated folds (Fig. 3D). These indicated that the activation of HABON expression was regulated by HIF-1α protein rather than HIF-2α.
Figure 3.
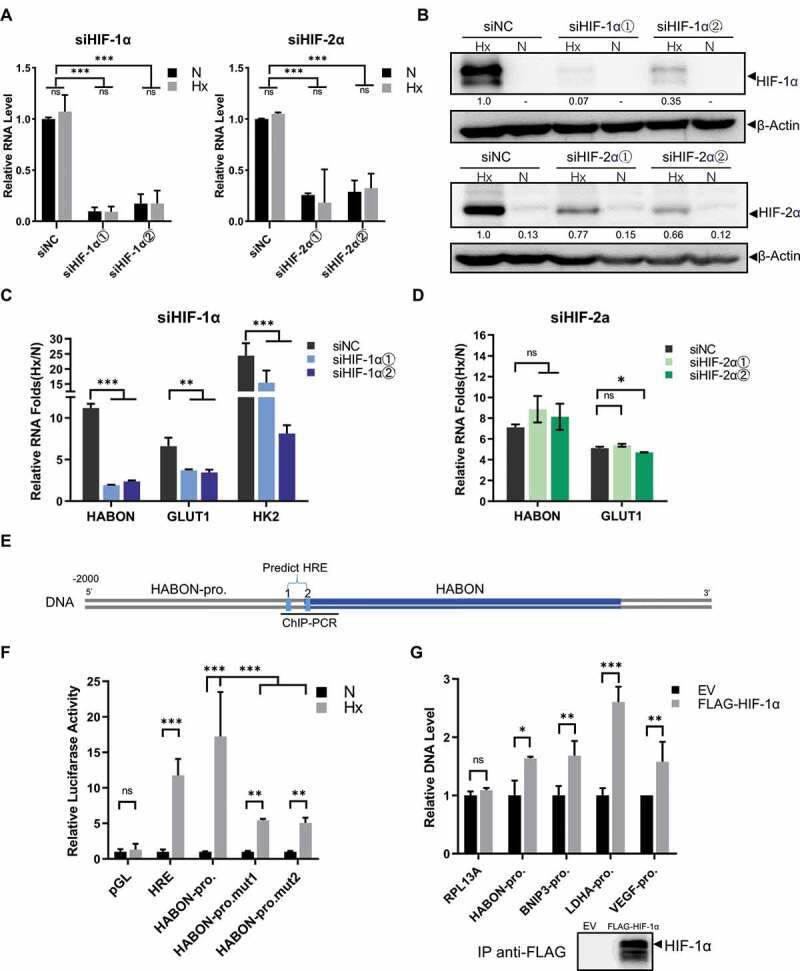
The expression of HABON is activated by HIF-1α through HRE under hypoxia
A, Real-time PCR analysis of HIF-1α, HIF-2α mRNA levels in normoxia/hypoxia after siRNA knockdown separately, the vertical coordinate is the relative expression level of RNAs (normalized with normoxic siNC group);B, Western blotting analysis of HIF-1α, HIF-2α protein levels in normoxia/hypoxia after siRNA knockdown separately (the value indicated relative HIF-1α/HIF-2α protein level normalized with β-actin);C, D, Real-time PCR analysis of hypoxic up-regulation folds (Hx/N) of HABON and other RNAs after knockdown of HIF-1α/HIF-2α separately;E, Schematic map of conserved hypoxia response elements predicted on the promoter region of HABON gene (about 2 000 bp upstream);F, Luciferase reporter assay analysis of HABON’s promoter sequence (HABON-pro.), its HRE-mutation sequence (HABON-pro.mut1/2) and other genes’ promoter sequences;G, Real-time PCR analysis of DNA fragments in genes’ promoter region after chromatin immunoprecipitation using anti-FLAG-HIF-1α (normalized with empty vector control, EV), and western blotting analysis of HIF-1α protein.
We used Jaspar (http://jaspardev.genereg.net/) to predict several conserved HRE elements in about 2 000 bp upstream region of HABON gene (Fig. 3E), then the luciferase reporter gene assays were used to determine which HRE really works in cells. This result showed that the luciferase activity of HABON-promoter integrated cells increased significantly under hypoxia, and this is consistent with the trend of proven effective HREs integrated cells; the luciferase activity of mutant predicting HRE 1 or 2 on HABON-promoter integrated hypoxic cells was still higher than normoxic cells, while compared to wild type of HABON-promoter the activity dropped significantly after mutation of predicted HRE 1/2 (Fig. 3F). This proved that the two predicted HREs are actually activated by HIF-1α. In addition, the binding of HIF-1α to HABON promoter region was further confirmed by chromatin immunoprecipitation (ChIP). The components (protein and DNA complex) of SMMC-7721 cells expressing FLAG-tagged HIF-1α were specifically immunoprecipitated with FLAG antibody, and quantitative real-time PCR confirmed the specific concentration of DNA fragments in the promoter region (HRE) of HABON. This is consistent with the promoter regions (HREs) of the classical HIF-1α regulated genes, while RPL13A, a negative control gene, don’t have this phenomenon. These results proved HIF-1α can bind to the HRE region of the HABON promoter (Fig. 3G). Therefore, it is suggested that the expression of HABON is up-regulated by HIF-1α through binding to HRE elements in its promoter region therefore activating its transcription under hypoxia.
Interaction between HABON and HIF-1α
We studied the role of HABON in cytoplasm. Recently, some factors were reported to be up-regulated by HIF-1α under hypoxia and could play a role in feedback regulation by binding to HIF-1α, which brings clues for our research. Therefore, we wondered if there is any interaction between HABON and HIF-1α.
First of all, we implemented RNA immunoprecipitation (RNA-IP/RIP) towards HIF-1α in cells (Fig. 4). For endogenous HIF-1α, based on the successfully immunoprecipitation of HIF-1α protein of SMMC-7721 cells cultured in hypoxia using the antibody of HIF-1α, RNA of HABON was significantly enriched simultaneously in the immunoprecipitate (~4 folds, p < 0.001), proving that HIF-1α interacts with HABON (Fig. 4A,B). For exogenous HIF-1α, results showed that HABON was successfully enriched as well as FLAG-tagged HIF-1α protein in the HIF-1α expressing SMMC-7721 cells (~4 folds, p < 0.001), also confirming the interaction between HIF-1α and HABON (Fig. 4C,D).
Figure 4.
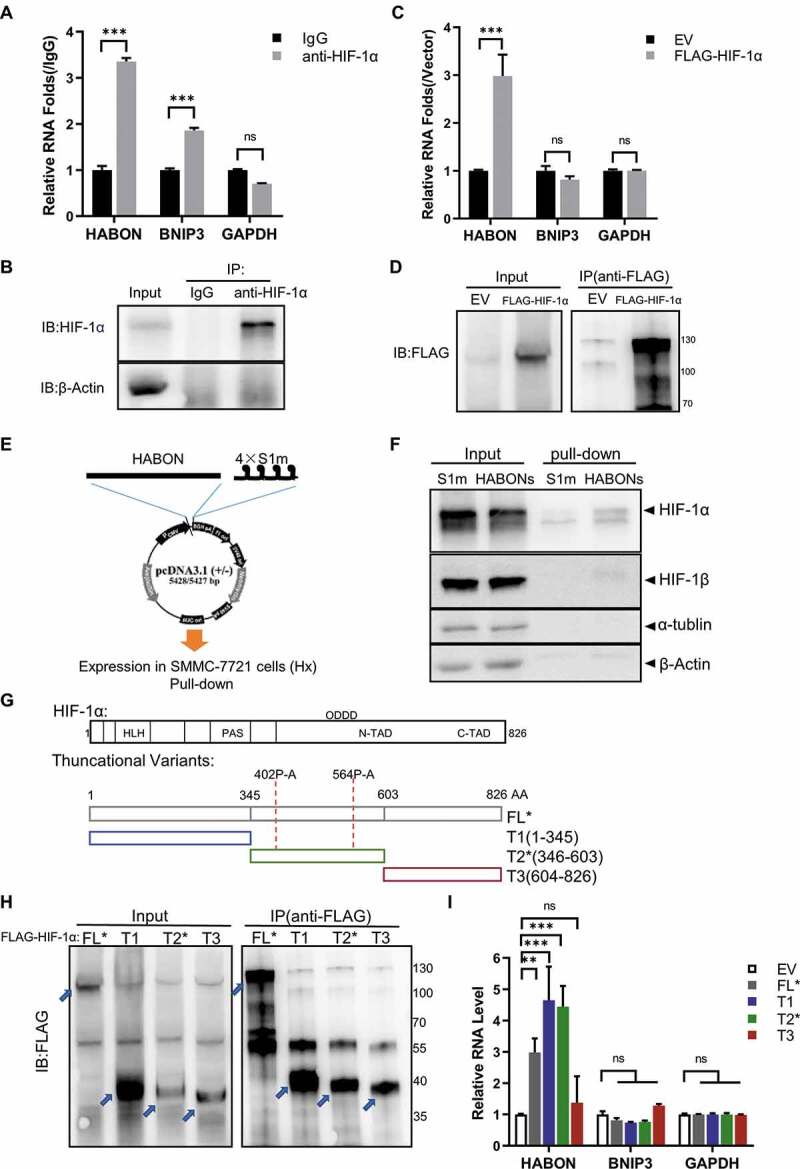
HABON interacts with HIF-1α
A,B: Endogenous HIF-1α RIP assay. Real-time PCR analysis of HABON and other RNAs, western blotting analysis of HIF-1α protein in the immunoprecipitates of SMMC-7721 cells under hypoxia (immunoprecipitation using the antibody of HIF-1α, normalized with IgG control group);C,D: Exogenous HIF-1α RIP assay. Real-time PCR analysis of HABON and other RNAs, western blotting analysis of HIF-1α protein in the immunoprecipitates of 3× FLAG-HIF-1α expressing SMMC-7721 cells under hypoxia (immunoprecipitation using beads specifically binding FLAG, normalized with empty vector control, EV);E: Schematic map of HABON RNA pull-down;F: HABON RNA pull-down assay. Western blotting analysis of HIF-1α or other proteins in the precipitates of 4× S1m-HABON expressing (HABONs) SMMC-7721 cells under hypoxia (precipitation using streptavidin magnetic beads, S1m-only vector as control);G: Construction and design of the (truncated) variant plasmid of HIF-1α, which are full-length FL*, variant T1, variant T2*, variant T3, respectively (the prolines in 402 and 564 of the variants were mutated into alanines to obtain stable protein expression, while with FLAG tag on N-terminal for enrichment);H,I: Truncated HIF-1α RIP assay. Real-time PCR analysis of HABON and other RNAs (normalized with empty vector), western blotting analysis of truncated HIF-1α protein in the immunoprecipitates of 3× FLAG-(truncated) HIF-1α expressing SMMC-7721 cells under hypoxia (immunoprecipitation with beads specifically binding FLAG);
We also demonstrated from another angle that HABON interacts with HIF-1α in the RNA pull-down experiment (Fig. 4E). HIF-1α had a significant enrichment compared with the control group after HABON pull-down by streptavidin magnetic beads binding 4 × S1m tag [65] on its 3ʹ end in SMMC-7721 cells under hypoxia (Fig. 4F). In addition, we also found that HIF-1α was significantly enriched in the results of RNA pull-down by mass spectrometry analysis (Fig.S8A). These results once again confirmed the interaction between HABON and HIF-1α.
The location and effect of binding site between HABON and HIF-1α was the next problem. According to the reported functional domain information of HIF-1α protein, we constructed four different HIF-1α (truncated) vectors with 3 × FLAG tag at N-terminus, which are full-length FL*, 1 ~ 345 AA (amino acid peptide segment) variant T1, 346 ~ 603 AA variant T2*, 604 ~ 826 AA variant T3, respectively (Fig. 4G). T1 region, which mainly contains DNA binding domains such as HLH and PAS, is the functional region of HRE binding on target gene promoter; T2* segment contains 402, 564 prolines, is the key region that VHL and other factors combined to regulate its protein degradation through proline hydroxylation mediated proteasome pathway under normoxia; T3 contains the FIH domain including 803-asparagine, which is the binding regulatory region of CBP/p300 transcription factors [25,26]. The RNA-IP result showed that HABON RNA was only enriched simultaneously in the FL*, T1, T2* expressing immunoprecipitates (2.9, 4.5, 4.3 folds, p < 0.01) based on successful immunoprecipitation of these truncated HIF-1α proteins separately in SMMC-7721 cells (Fig. 4H,I). This experiment showed that the 1 ~ 603AA region of HIF-1α was the region of HABON specific binding. It also suggested that HABON may affect the degradation of HIF-1α, thus regulating the transcription of HIF-1α’s target genes.
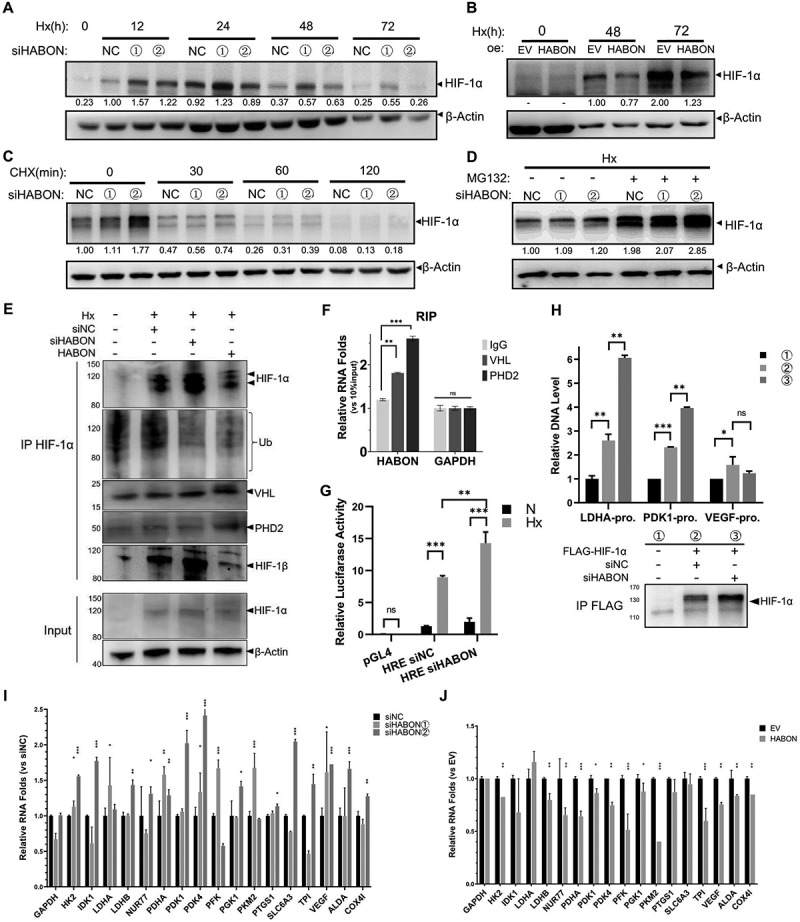
Regulatory effect of HABON on HIF-1α protein and transcription of hypoxia-activated genes
Subsequently, we studied the effect of HABON on HIF-1α protein. We first noticed that the amount of HIF-1α protein was increased by HABON knocking-down in SMMC-7721 cells cultured in hypoxia for different time (12, 24, 48 and 72 h, Fig. 5A); on the contrary, HIF-1α decreased in different levels after HABON over-expression (Fig. 5B, there are significant differences on blotting-band density statistics). This indicated that the accumulation of HIF-1α protein was inhibited by HABON under hypoxia. Due to the interaction between HABON and HIF-1α, we speculate that HABON may affect the protein degradation of HIF-1α rather than its protein synthesis. We proved this conjecture by experiment of cycloheximide (CHX, a small molecule compound that inhibits the synthesis of eukaryotic cell protein [66]) treating in hypoxia for different time. The protein of HIF-1α in HABON-knockdown group degraded less than control after 60 minutes of CHX treatment (Fig. 5C, there are significant differences in blotting-band density statistics). Furthermore, the increasing of HIF-1α protein after knocking-down of HABON under hypoxia was eliminated due to significantly raising to the level of control after MG132 (a classical proteasome inhibitor [67,68]) treatment for 12 hours (Fig. 5D). These state that the protein of HIF-1α is mainly degraded by proteasome pathway, and when the proteasome degradation pathway is blocked, the promotion of HABON on the degradation of HIF-1α protein is eliminated, proving that the degradation of HIF-1α protein can be promoted by HABON under hypoxia.
Figure 5.
HABON can promote degration of HIF-1α protein under hypoxia and affect transcription of hypoxia activated genes
A, B: Western blotting analysis of HIF-1α protein after HABON knockdown/over-expression in SMMC-7721 cells cultured in hypoxia for different time (the value indicated quantitative analysis of HIF-1α blotting bands level normalized with β-actin);C,D: Western blotting analysis of HIF-1α protein after HABON knockdown in SMMC-7721 cells cultured in hypoxia for 24 hours then treated with cycloheximide for different time or MG132 for 12 hours (the value indicated relative HIF-1α level normalized with β-actin);E: Western blotting analysis of ubiquitin(Ub), VHL and other proteins after immunoprecipitation anti-HIF-1α;F: Real-time PCR analysis of HABON in the immunoprecipitates of SMMC-7721 cells anti-VHL/PHD2 under hypoxia (Endogenous RIP assay, normalized with IgG control group);G: Luciferase reporter assay analysis of HRE activity and the effect of HABON knock-down in 293 T cells expressing reporter gene. The coordinates are the ratio folds of hypoxia to normoxia;H: Real-time PCR analysis of DNA fragments of genes’ promoter region after chromatin immunoprecipitation using anti-FLAG-HIF-1α (RPL13A as internal reference), and western blotting analysis of HIF-1α protein;I, J: Real-time PCR analysis of the RNA levels of HIF-1α regulated genes after knocking-down/over-expression of HABON (the ordinate is the relative expression folds than siNC/EV control).
Because the former results told us that HABON binds to the 1 ~ 603 AA region of HIF-1α -the region where VHL binds and mediates the ubiquitination and degradation of it, we studied the combination of HIF-1α with PHD2, VHL and ubiquitin (Fig. 5E). The binding ubiquitins on HIF-1α in cells was significantly reduced after knocking-down HABON under hypoxia, and was further increased after exogenous over-expression HABON. Consistently, the binding of VHL and PHD2 on HIF-1α showed the same trend (considering the increase of HIF-1α, their binding decreased slightly after siHABON while increased after overexpression of HABON). These indicate that knocking-down HABON can inhibit the binding and modification of PHD2, VHL to HIF-1α, thus inhibiting the ubiquitin degradation of HIF-1α. Furthermore, HABON was significantly enriched simultaneously in the VHL/PHD2-immunoprecipitate (Fig. 5F, S7B), and VHL had a significant enrichment after HABON pull-down in SMMC-7721 cells under hypoxia(Fig.S7C), proving that HABON could enhance the interaction of VHL/PHD2 with HIF-1α through acting as a scaffold.
Then, we studied the effect of HABON on the transcription activity of HIF-1α and its target genes. The luciferase activity in HRE integrated cells increased significantly under hypoxia, and increased more after further HABON-knockdown in 293 T cells (Fig. 5G). This indicated that the activity of HIF-1α in hypoxic cells increased with the knockout of HABON. In addition, ChIP result showed that the promoter region DNA fragments of HIF-1α regulated genes LDHA, PDK1 and VEGF were significantly enriched by immunoprecipitation for FLAG-tagged HIF-1α, proving HIF-1α can bind to these promoters; moreover, these DNAs were further increased after HABON knock-down, indicating that HIF-1α’s binding to the promoter regions of genes LDHA, PDK1 and VEGF was enhanced (Fig. 5H). We also knocked-down/over-expressed HABON and cultured cells in hypoxia or normoxia, respectively, to detect RNA expression levels of classical HIF-1α regulated genes. Most of these genes’ RNAs increased significantly after siHABON while decreased after HABON over-expression under hypoxia (Fig. 5I,J). These results confirmed that HABON can affect the transcription of HIF-1α regulated genes through promoting HIF-1α ubiquitination and degradation in hypoxic cells. Furthermore, we also detected the effect of siHIF-1α after HABON knocking-down on the growth and proliferation of SMMC-7721 cells under hypoxia (Fig.S7D). The results demonstrated that reducing HIF-1α impaired the inhibitory effect of HABON on cell proliferation under hypoxia.
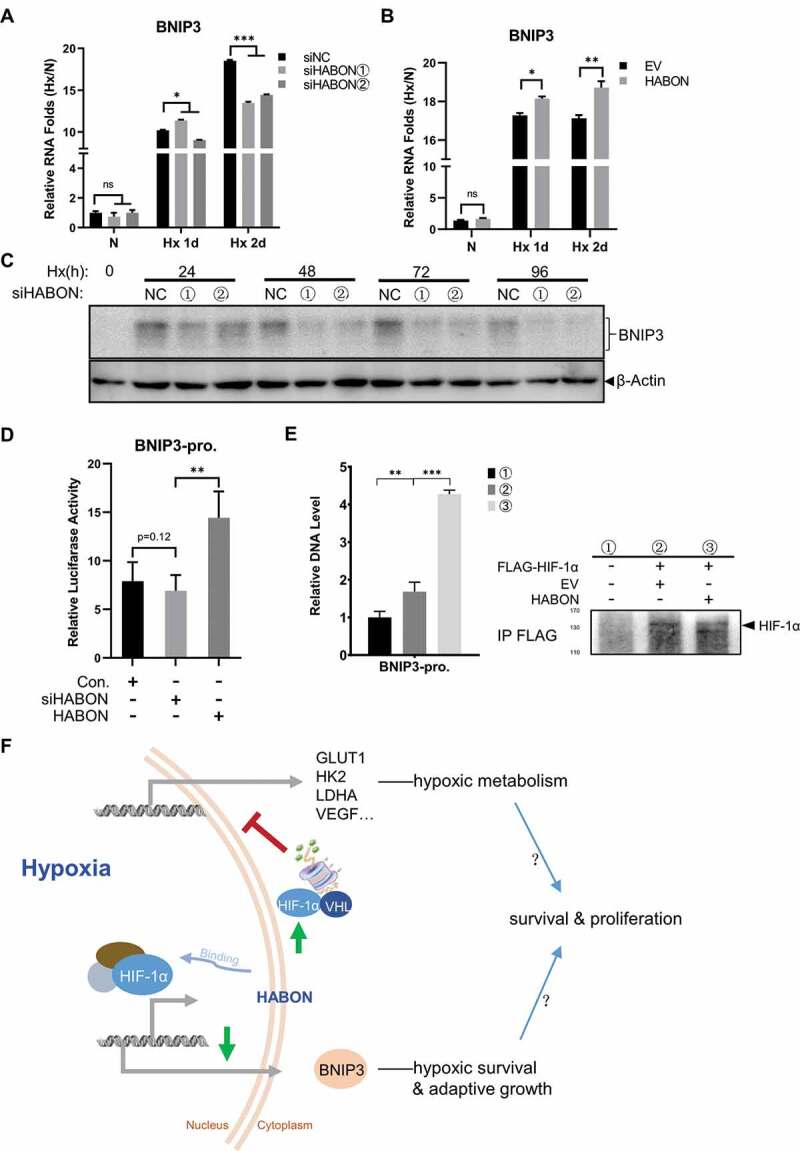
HABON can regulate the expression of BNIP3
The localization of HABON showed that in addition to the enrichment and distribution in the cytoplasm, it also has a certain amount in the nucleus (Fig. 2C). Therefore, we believe that there might be other mechanisms independent of promoting the ubiquitin modification of HIF-1α in cytoplasm. As well known, the regulation of lncRNAs on the adjacent coding gene in cis-regulation manner is one of the most recognized and valued mechanisms [69–71]. Given that HABON gene is near and overlapped with BNIP3 gene in genome and BNIP3 is also a reported important gene regulated by HIF-1α, therefore, we studied the effect of HABON on BNIP3. Different from other HIF-1α regulated genes such as GLUT1, HK2, LDHA and VEGF, RNA level of BNIP3 in hypoxic SMMC-7721 cells decreased significantly after knocking-down HABON, while increased after over-expression of HABON (Fig. 6A,B); corresponding to RNA level, the protein level of BNIP3 also decreased after knocking-down HABON (Fig. 6C). Considering the location of its gene we speculated that the binding of HABON to HIF-1α can promote the localization of HIF-1α in BNIP3 promoter, thus promoting the expression of BNIP3 gene. Proving this, experimental results showed that the luciferase activity of BNIP3-promoter (including HRE) [32] integrated cells was barely decreased by HABON knocking-down but significantly increased by HABON over-expression compared with control (Fig. 6D). In addition, ChIP result confirmed that the promoter region DNA fragments of BNIP3 gene was significantly enriched by immunoprecipitation for FLAG-tagged HIF-1α, proving HIF-1α can bind to to the promoter region of BNIP3 gene; moreover, this DNA fragment was further increased after over-expression of HABON, indicating that the combination of HIF-1α and BNIP3 gene promoter region was enhanced by HABON (Fig. 6E). These results showed that HABON can promote transcription of the adjacent BNIP3 gene, thus elevating the expression of BNIP3 in cis-regulation manner.
Figure 6.
HABON can promote the expression of BNIP3 through transcriptional activation by HIF-1α
A,B: Real-time PCR analysis of BNIP3 RNA level after knocking-down/over-expressing of HABON;C: Western blotting analysis of BNIP3 protein after knocking-down of HABON;D: Luciferase reporter assay analysis of BNIP3 promoter activity and the effect of HABON knock-down/over-expression in 293 T cells expressing reporter gene. The coordinates are the relative level folds to normoxia;E: Real-time PCR analysis of BNIP3ʹ promoter region DNA fragments after chromatin immunoprecipitation using anti-FLAG-HIF-1α (normalized with IgG control group), and western blotting analysis of HIF-1α protein;F: Schematic drawing of mechanism of HABON.
Discussion
Hypoxia is one of the important microenvironment factors for many solid tumours, and the stress and adaptation of tumour cells to hypoxia is also an important feature and guarantee for tumour development, invasion and metastasis. Our research group screened out the lncRNAs which were obviously up-regulated by hypoxia and found a new lncRNA HABON (AK125699/uc001lku.1) among them. Promoted by HIF-1α under hypoxia, HABON can regulate growth, proliferation and clonal formation of hepatocarcinoma cells, meanwhile it had an interaction with HIF-1α and impact on the stability of HIF-1α. HABON promotes the degradation of HIF-1α protein and produces a negative feedback effect on its transcriptional activity under hypoxia, resulting in changing of HIF-1α’s target genes. We also have performed a preliminary study on the relationship between HABON, VHL and PHD2 protein under hypoxia (Fig.S7A), and there was no significant change in the amount of VHL and PHD2 after HABON knock-down/over-expression. Thus, we inferred HABON could affect their binding to HIF-1α and caused the stability change of HIF-1α protein just as a scaffold, and the degradation of HIF-1α may still be mediated by PHD2 and VHL.
On the other hand, HABON can promote transcription of the adjacent BNIP3 gene, thus elevating the expression of BNIP3 in cis-regulation manner (Fig. 6F). These effects indicate that HABON plays a remarkable and complicated role in regulating the growth and proliferation of tumour cells through the adaptation of HIF-1α to hypoxia metabolism, which provides a new idea for the hypoxia survival mechanism of tumour cells.
BNIP3 can induce the apoptosis and autophagy in hypoxia [31,32], which is considered to be closely related to the pathogenesis of cancer, heart failure and so on, while a certain tumour inhibitory effect reported72. Through up-regulated BNIP3 by HIF-1α, HABON is likely to further induce apoptosis and autophagy and increase the death of tumour cells, thus cancer cells adapted to the poor hypoxia environment may be screened and expanded. This can promote the growth, proliferation and clonal formation of the overall behaviour of hepatocarcinoma cells. However, in our preliminary study, knocking-down/over-expression HABON changed necrosis proportion rather than apoptosis of SMMC-7721 cells (Fig.S6H, I). The mechanism and several problems may need further study, such as whether BNIP3 inducing mitochondrial autophagy plays a key role in this process. These could further link hypoxia, related lncRNAs and autophagy to tumour cells, and clarify a detailed interpretation of the comprehensive performance and mechanism of tumour hypoxia microenvironment. At present, it can be inferred that the effect of HABON on tumour cells is not simple and its regulatory effect on hypoxic tumour cells could be attributed to its indirect inhibition of hypoxic adaptive metabolism and potential promotion of apoptosis and autophagy.
Because HABON is composed of one non-spliced exon with a total length of 3357 ribonucleotides, and its folding structure could be complicated (lots of hairpin and bifurcation structures in the preliminary structural prediction, Fig. 5E), we have not been able to divide it into several fragments for analysis. Moreover, the mechanism of its participation in the interaction of HIF-1α, VHL and PHD2 is likely to be a skeleton structure, so the integrity may be more important, and the research on segmentation will be more difficult. However, disintegration studies are still needed to clarify the mechanism detail of its interaction, and our team will analyse its sequence by using various and more reasonable structural analysis methods for this. Besides, in addition to the interaction with HIF-1α, there must be other unknown binding and regulatory effects of HABON. Our team have analysed the proteins that can bind to HABON in SMMC-7721 cells by RNA pull-down plus mass spectrometry (Fig.S8). Through pathway enrichment, oncology and other analysis, we found that HABON is likely to bind and regulate related molecules and pathways such as cell membrane, nucleus, mitochondria etc, providing clues for the follow-up study of HABON.
In conclusion, HABON is an important hypoxia-related lncRNA. This study provides new clues for tumour survival and growth mechanism under hypoxia, and reveal the nature of tumour cell resistance to harsh microenvironment.
Materials and methods
Cells and culture
Human hepatocarcinoma cell lines SMMC-7721, Huh-7, MHCC-97 h, MHCC-97 L, Hep-G2, Hep-3B; human cervical cancer cell line HeLa; human pancreatic cancer cell line PanC1; human renal epithelial cell line 293 T are from Shanghai cell bank, Chinese Academy of Sciences.
Cells were cultured in DMEM (GE/GIBCO) standard medium plus 10% foetal bovine serum (GIBCO), 37°C 5% carbon dioxide culture environment, and in 20% oxygen concentration environment for normoxic culture, 1% oxygen concentration for hypoxic culture. The usage of MG132(Millipore) [67,68], cycloheximide (MCE) [66] is described in the respective references.
Plasmid transfection and RNA interference:
Small interfering RNAs(siRNAs) (Table S1, synthesis by Shanghai Gemma Bio Pharmaceutical Co.) was for knocking down lncRNA and genes. The target gene fragments were obtained by polymerase chain reaction (PCR) from cell cDNA using TOYOBO KOD One Master Mix with primers (Table S2, synthesized by Shanghai Jieli Bio.). Restriction enzymes (TAKARA Bio.) or Vazyme ClonExpress II one-step clone kit were used for construct them into vectors pcDNA3.1+(Invitrogen), pCMV-3Tag(Agilent) (for expression of lncRNA and genes), pRenilla, pGL4.27(Promega, for luciferase reporter gene detection). Vazyme Mut Express II Fast Mutagenesis Kit was used for site-specific mutations of target genes, and process is described in its manual.
Cells were seeded into the culture plate to reach 1 –2 × 10⁴ per well in 96 well plate (6 well plate 0.5 × 10⁶ per well, 10 cm dish 3 × 10⁶) and cultured continuously, then transfected with nucleic acid the next day. SiRNA was transfected with Roche X-Tremegene siRNA transfer reagent; plasmid vector was transfected with Roche X-Tremegene 9 DNA transfer reagent Transfection process was described in the reagent manual. Renew the culture medium 6 hours later and cultured continuously, then the subsequent experiments were carried out.
Cell growth and proliferation assay
(Cell Counting Kit-8) Cells in logarithmic growth stage after different nucleic acid transfection were seeded into 96 well plate to get 5000 cells/100 μl each well, and cultured in cell incubator (hypoxia); every 24 hours, 10 μL Dojindo Cell Counting Kit-8 solution was added into each well, and then the absorption value of 450 nm was detected by spectrophotometer after 2 hours of continuous culture; finally, the daily data were summarized and plotted.
(RTCA) Cells in logarithmic growth stage after different nucleic acid transfection were seeded into ACEA xCelligence RTCA growth and proliferation detection plate to get 5000 cells/100 μL per well. The plate was put onto the ACEA xCelligence RTCA instrument in cell incubator (hypoxia) and began to detect and record. After a period of time, the cell growth and proliferation curves of different treatment groups could be obtained.
Cell clone formation assay
Cells in logarithmic growth stage after different nucleic acid transfection were seeded into 24-well plate to get about 100 cells in each well, and then incubated for about 2 weeks (hypoxia, excessive volatilization of medium can be supplemented appropriately); when each clone grows up to be visible (dozes of cells per clone), stop culture, dye with crystal violet and scan/shoot and count for statistical analysis.
Cell apoptosis assay
Cell apoptosis assay was performed using Annexin V-FITC/PI Apoptosis Kit (Abnova) according to its manual. Briefly, cell was harvest and washed (about 1 × 10⁵ cells per test) then suspended in Binding buffer; 5 μL of Annexin V-FITC and PI was added and incubated for 10 minutes at room temperature in dark. Analyse cells by flow cytometry within 1 h.
RNA extraction and quantification (Real-time PCR)
The RNA of cells was extracted by TRIzol reagent (Invitrogen) according to its manual. The extracted RNA was reverse transcripted using Promega MMLV reverse transcriptase at once according to its manual with Random 6 mers or Oligo dT primers (TAKARA Bio.).
RNA quantification (real-time PCR) was carried out using ABI SYBR Select Master Mix and according to its manual (primers are listed in Table S3, synthesized by Shanghai Jieli Bio.). Each sample had three repetitions, and ABI 7900HT Fast Real-time PCR system was used for detection and quantitative analysis (ACTB, GAPDH or U6 as internal reference gene) to obtain relative expression of fluorescence value (RQ = 2−ΔΔCt).
Fluorescence in situ hybridization (FISH)
The fluorescent probes of RNA were designed and synthesized by Guangzhou RiboBio Co. and the matched FISH kit was used and operated according to its instructions (cell transfection, culture treatment, fix and hybridization). Nikon confocal microscope was used to observe and record.
Rapid amplification of cDNA ends (RACE)
Clonetech Smarter RACE 5ʹ/3ʹ Kit (including In Fusion Cloning Kit) was used, and gene-specific primers were designed according to the instructions of it. Briefly, the special reverse transcription, PCR and electrophoresis, molecular cloning and sequencing for 5ʹ-RACE or 3ʹ-RACE fragments were carried out began with total RNA of cells. The sequencing results were compared with the original HABON RNA/cDNA and all non-specific amplified fragments were removed. The complete sequence was finally obtained by the sequence of 5ʹ-RACE or 3ʹ-RACE fragments amplified from HABON gene overlapped with known HABON sequence.
In vitro translation system
Experiments were performed using TnT T7 Quick Transcription/Translation Kit and Transcend Biotin-Lysyl-tRNA reagent (Promega) according to its manual. Briefly, the vectors were constructed and translated in reticulocyte lysate, and then western blotting was used for detection of the translated proteins/peptides (if there are proteins/peptides translated, the blotting will show obvious bands in this lane).
Western blotting
Antibodies: Anti human HIF-1α(610958,BD Bio.), HIF-1β(611078,BD Bio.), BNIP3(#44060,Cell Signalling Tech.), VHL(NB100-1899,Novus), CBP/p300(#7389, Cell Signalling Tech.), Ubiquitin (#3936,Cell Signalling Tech.), FLAG(F1804,Sigma), β-Actin-HRP(PM053-7,MBL), GAPDH(SC32233,Santa Cruz) and HRP-conjugated secondary antibodies(#7076/7074,Cell Signalling Tech.).
Briefly, cell culture medium was removed and cells were washed with appropriate cold phosphate buffer saline (PBS) before adding SDS-lysis-electrophoresis buffer; then cells were scraped off for immediately boiling 30 min (the cell lysis/protein denaturation process must be carried out on ice quickly when detecting HIF-1α or related protein); after separated by SDS-PAGE, proteins were transferred to nitrocellulose membrane; then the membrane was blocked with 5% skimmed milk for 1 h, washed with Tris-buffer saline (including 1‰ Tween-20, TBST) and incubated in primary antibody solution (1 µg/ml in TBST) for overnight at 4°C; after TBST washing, the membrane was incubated in secondary antibody solution (0.5 µg/ml in TBST) for 2 h at room temperature followed by washing. Detection was carried out according to the instructions of ECL chemoluminescent developer reagent (Millipore) (the intensity of bands was quantified by densitometry using BD Image J software and normalized to the corresponding β-actin bands).
Immunofluorescence
Place the sterilized Φ 13 cover glass into the 24-well cell culture plate, and seed 1 × 10⁵ cells. The cells were treated with transfection or hypoxia incubation. After culture, medium was removed and cells were washed with cold PBS, and 4% paraformaldehyde was added to fix the cells at room temperature for 10 minutes. After PBS washing, 1 ml of cold acetone was added, and 10 min later, after PBS washing, 1% bovine serum albumin (BSA) was added for 1 h incubation. Add 100 μL PBS containing 1% primary antibody (see Western blotting) respectively, and incubate overnight at 4°C (prevent volatilization). After 3 times of PBS washing, 100 μL PBS containing 1% FITC-coupling-anti-IgG antibody (Sigma) was added before 2 h- dark incubation. Carefully take out the cover glass after washing 3 times, and add a drop of sealing solution containing DAPI to seal onto a clean slide (away from light). Nikon confocal microscope was used to observe and take photos.
Immunoprecipitation (IP)
Anti-Human-HIF-1α(Novus), Protein A/G-agarose (Santa Cruz), anti-FLAG-agarose (Sigma) were used for immunoprecipitation (mouse IgG (Santa Cruz) was used as the negative control).
Cells of each group with different treatments (> 107) were collected and washed with cold PBS; 100 μl weak RIPA protein lysis buffer (Beyond Time Bio., containing 1 mM dithiothreitol and 1% Protease Inhibitor Cocktail (Millipore) was added and supersonicate the cells in ice bath until no obvious precipitation was observed. After centrifuging at 10 000 g 4 °C for 10 min (as input sample, 10 μl was added to 10 μL 2 × SDS electrophoresis sample buffer immediately before 30 min boiling water bath), the lysate supernatant was added to the corresponding antibody complex solution (5 μg antibody incubated with 20 μl of protein A/G-Agarose or anti-FLAG agarose in PBS for 1 h to form the complex, with 0.5 M EDTA, 1% protease inhibitor cocktail (Millipore) added for using), incubated at 4°C for 6–10 h, and then washed with cold PBS for six times. Finally, add 20 μL PBS to mix and 10 μl was added to 10 μL 2 × SDS electrophoresis sample buffer immediately before 30 min boiling water bath as IP sample. Both input and IP samples were centrifuged at 5 000 g for 5 min, and the supernatant was retained for later western blotting analysis.
Chromatin immunoprecipitation (ChIP)
ChIP was performed using Simple ChIP Enzymatic Chromatin IP Kit (Cell Signalling Tech.) according to its manual. Briefly, cells of each group with different treatments (>107) were fixed with 1% formaldehyde at 37°C for 15 min and subsequently quenched in 125 mM glycine for 5 min. The cross-linked chromatin was fragmented by partial digestion with Micrococcal Nuclease to obtain chromatin fragments of 1 to 5 nucleosomes. Chromatin fragments were immunoprecipitated using anti-FLAG-agarose (Sigma) or mouse IgG (Santa Cruz) with Protein G Magnetic Beads.
After reversal of protein-DNA cross-links, the DNA was purified using DNA purification spin columns. The enrichment of particular DNA sequences during immunoprecipitation was analysed by quantitative real-time PCR using the primers listed in Table S3.
RNA immunoprecipitation (RNA-IP/RIP)
RIP was performed using EZ-Magna RIP Kit (Millipore) according to its manual. Briefly, cells of each group with different treatments (> 107) were collected and lysed in RIP lysis buffer with 1 mM PMSF, 1 mM DTT, 1% Protease Inhibitor Cocktail (Millipore) and 200 U/mL RNase inhibitor (Takara Bio.). Then 100 µL of whole cell lysates were incubated with Protein A/G-agarose (Santa Cruz) conjugated with Human-HIF-1α antibody (Novus) or anti-FLAG-agarose (Sigma) or normal mouse IgG (Millipore) in RIP buffer. After Proteinase K (Beyond Time Bio.) treated, the RNA on immunoprecipitated beads/agarose was isolated using TRIzol reagent (Invitrogen) and subjected to quantitative real-time PCR analysis using the primers listed in Table S3. Meanwhile, both input and IP protein samples were collected and analysed as same as immunoprecipitation.
RNA pull-down analysis
Cells of each group containing 4× S1m tagged [65] expression vector (>107) were collected and washed with cold PBS and 1 mL Buffer-A (150 mM KCl, 25 mM Tris 7.4, 5 mM EDTA, 0.5% NP40, 0.5 M DTT 1 μL, Protease Inhibitor Cocktail (Millipore) 10 μL, RNase Inhibitor 20 μL(TAKARA Bio.)) was added. After centrifuging at 2 000 g 4 °C for 5 min (as input sample, 50 μl was added to 50 μL 2 × SDS electrophoresis sample buffer immediately before 30 min boiling water bath), the lysate supernatant was incubated with Streptavidin Magnetic Beads(New England Bio.) at 4°C for 6 –10 h, and then washed with cold Buffer-A for 6 times. Finally, add 50 μl deposit was added to 50 μL 2 × SDS electrophoresis sample buffer immediately before 30 min boiling water bath as IP sample. Both input and IP sample were centrifuged at 5 000 g for 5 min, and the supernatant was retained for later SDS-PAGE/western blotting or mass spectrometry analysis (Platform of Mass Spectrometry, Shanghai Jiaotong University).
Luciferase reporter gene assay
The promoter sequences (or predicted/known HREs) of genes were constructed on pGL4.27 firefly luciferase reporter gene vector (pRenilla as Renilla luciferase reporter gene vector as an internal reference, Promega), and the Promega Dual Luciferase Report Assay Kit and Promega Luciferase Detector were used, and seeding cells, nucleic acid transfection, cell lysis, preparation of reagents and detection were carried out according to its manual. All the luciferase activities were normalized against the Renilla values and shown as the relative folds of control group.
RNA microarray analysis, informatics tools and statistics analysis
Normoxic/hypoxic treated SMMC-7721 cells’ RNA was extracted and delivered to Shanghai Kangchen Biotech. for Arraystar 3.0 LncRNA/mRNA microarray analysis.
NCBI Gene (RefSeq) UC(https://www.ncbi.nlm.nih.gov/gene/)and SC genome data bank(http://genome.ucsc.edu/cgi-bin/hgGateway) were used for lncRNA’s deification and information. RNA Fold(http://rna.tbi.univie.ac.at/cgi-bin/RNAWebSuite/RNAfold.cgi) was used for lncRNA’s structure prediction. ORF Finder(https://www.ncbi.nlm.nih.gov/orffinder) was used for lncRNA’s structure prediction. PhyloCSF software, Coding Potential Assessment Tool(CPAT, http://lilab.research.bcm.edu/cpat/) was used for calculation RNA’s protein-coding potential score. JASPAR (http://jaspardev.genereg.net/) was used for prediction of transcription elements/factors. GEO(https://www.ncbi.nlm.nih.gov/geo/) was used for analysis of RNA’s expression in cancer.
Each experiment was done in triplicate. Statistical analysis was carried out using Microsoft Excel and GraphPad Prism to assess differences between experimental groups. Statistical significance was analysed by Student’s t-test and expressed as a p value. p values lower than 0.05 were considered to be statistical significance. One asterisk, two asterisks, and three asterisks indicate p < 0.05, p < 0.01, and p < 0.001, respectively.
Supplementary Material
Acknowledgements
We thank Dr. Guo-Hong Hu (Shanghai Institute of Nutrition and Health, Chinese Academy of Sciences) for providing the human breast cancer cell line MDA231-LM2; Professor Xiang-Huo He for scientific discussion; Proteomics Core of College of Basic Medical Sciences, SJTU-SM for the protein LC-MS analyses.
Funding Statement
This study was funded by the National Natural Science Foundation of China [No.81772831, 81721004, 81830091, 91853206]; Chinese Universities Scientific Fund; CAMS Innovation Fund for Medical Sciences [2019-I2M-5-051]; Shanghai Natural Science Foundation [19ZR1428400].
Disclosure statement
The authors report no conflict of interest.
Supplementary material
Supplemental data for this article can be accessed here.
References
- [1].Bray F, Ferlay J, Soerjomataram I, et al. Global cancer statistics 2018: GLOBOCAN estimates of incidence and mortality worldwide for 36 cancers in 185 countries. CA Cancer J Clin. 2018;68:394–424. [DOI] [PubMed] [Google Scholar]
- [2].Ferlay J, Colombet M, Soerjomataram I, et al. Estimating the global cancer incidence and mortality in 2018: GLOBOCAN sources and methods. Int J Cancer. 2019;144:1941–1953. [DOI] [PubMed] [Google Scholar]
- [3].El-Serag HB. Epidemiology of viral hepatitis and hepatocellular carcinoma. GASTROENTEROLOGY. 2012;142:1264–1273. [DOI] [PMC free article] [PubMed] [Google Scholar]
- [4].El-Serag HB. Hepatocellular carcinoma and hepatitis C in the United States. HEPATOLOGY. 2002;36:S74–83. [DOI] [PubMed] [Google Scholar]
- [5].Iyer NV, Kotch LE, Agani F, et al. Cellular and developmental control of O2 homeostasis by hypoxia-inducible factor 1 alpha. Genes Dev. 1998;12:149–162. [DOI] [PMC free article] [PubMed] [Google Scholar]
- [6].Graeber TG, Osmanian C, Jacks T, et al. Hypoxia-mediated selection of cells with diminished apoptotic potential in solid tumours. NATURE. 1996;379:88–91. [DOI] [PubMed] [Google Scholar]
- [7].Quail DF, Joyce JA. Microenvironmental regulation of tumor progression and metastasis. Nat Med. 2013;19:1423–1437. [DOI] [PMC free article] [PubMed] [Google Scholar]
- [8].Carmeliet P, Jain RK. Angiogenesis in cancer and other diseases. NATURE. 2000;407:249–257. [DOI] [PubMed] [Google Scholar]
- [9].Semenza GL. Hypoxia-inducible factors: mediators of cancer progression and targets for cancer therapy. Trends Pharmacol Sci. 2012;33:207–214. [DOI] [PMC free article] [PubMed] [Google Scholar]
- [10].Dewhirst MW. Relationships between cycling hypoxia, HIF-1, angiogenesis and oxidative stress. Radiat Res. 2009;172:653–665. [DOI] [PMC free article] [PubMed] [Google Scholar]
- [11].Dang CV, Hamaker M, Sun P, et al. Therapeutic targeting of cancer cell metabolism. J Mol Med (Berl). 2011;89:205–212. [DOI] [PMC free article] [PubMed] [Google Scholar]
- [12].Semenza GL. Regulation of metabolism by hypoxia-inducible factor 1. Cold Spring Harb Symp Quant Biol. 2011;76:347–353. [DOI] [PubMed] [Google Scholar]
- [13].Warburg O. On the origin of cancer cells. SCIENCE. 1956;123:309–314. [DOI] [PubMed] [Google Scholar]
- [14].Hanahan D, Weinberg RA. Hallmarks of cancer: the next generation. CELL. 2011;144:646–674. [DOI] [PubMed] [Google Scholar]
- [15].Wood SM, Wiesener MS, Yeates KM, et al. Selection and analysis of a mutant cell line defective in the hypoxia-inducible factor-1 alpha-subunit (HIF-1alpha). Characterization of hif-1alpha-dependent and -independent hypoxia-inducible gene expression. J Biol Chem. 1998;273:8360–8368. [DOI] [PubMed] [Google Scholar]
- [16].Carmeliet P, Dor Y, Herbert JM, et al. Role of HIF-1alpha in hypoxia-mediated apoptosis, cell proliferation and tumour angiogenesis. NATURE. 1998;394:485–490. [DOI] [PubMed] [Google Scholar]
- [17].Wang GL, Jiang BH, Rue EA, et al. Hypoxia-inducible factor 1 is a basic-helix-loop-helix-PAS heterodimer regulated by cellular O2 tension. Proc Natl Acad Sci U S A. 1995;92:5510–5514. [DOI] [PMC free article] [PubMed] [Google Scholar]
- [18].Keith B, Simon MC. Hypoxia-inducible factors, stem cells, and cancer. CELL. 2007;129:465–472. [DOI] [PMC free article] [PubMed] [Google Scholar]
- [19].Semenza GL. Targeting HIF-1 for cancer therapy. Nat Rev Cancer. 2003;3:721–732. [DOI] [PubMed] [Google Scholar]
- [20].Maxwell PH, Wiesener MS, Chang GW, et al. The tumour suppressor protein VHL targets hypoxia-inducible factors for oxygen-dependent proteolysis. NATURE. 1999;399:271–275. [DOI] [PubMed] [Google Scholar]
- [21].Tanimoto K, Makino Y, Pereira T, et al. Mechanism of regulation of the hypoxia-inducible factor-1 alpha by the von Hippel-Lindau tumor suppressor protein. Embo J. 2000;19:4298–4309. [DOI] [PMC free article] [PubMed] [Google Scholar]
- [22].Ivan M, Kondo K, Yang H, et al. HIFalpha targeted for VHL-mediated destruction by proline hydroxylation: implications for O2 sensing. SCIENCE. 2001;292:464–468. [DOI] [PubMed] [Google Scholar]
- [23].Jaakkola P, Mole DR, Tian YM, et al. Targeting of HIF-alpha to the von Hippel-Lindau ubiquitylation complex by O2-regulated prolyl hydroxylation. SCIENCE. 2001;292:468–472. [DOI] [PubMed] [Google Scholar]
- [24].Chen Z, Liu X, Mei Z, et al. EAF2 suppresses hypoxia-induced factor 1alpha transcriptional activity by disrupting its interaction with coactivator CBP/p300. Mol CELL Biol. 2014;34:1085–1099. [DOI] [PMC free article] [PubMed] [Google Scholar]
- [25].Kallio PJ, Okamoto K, O’Brien S, et al. Signal transduction in hypoxic cells: inducible nuclear translocation and recruitment of the CBP/p300 coactivator by the hypoxia-inducible factor-1alpha. Embo J. 1998;17:6573–6586. [DOI] [PMC free article] [PubMed] [Google Scholar]
- [26].Ema M, Hirota K, Mimura J, et al. Molecular mechanisms of transcription activation by HLF and HIF1alpha in response to hypoxia: their stabilization and redox signal-induced interaction with CBP/p300. Embo J. 1999;18:1905–1914. [DOI] [PMC free article] [PubMed] [Google Scholar]
- [27].Kaluz S, Kaluzova M, Stanbridge EJ. Regulation of gene expression by hypoxia: integration of the HIF-transduced hypoxic signal at the hypoxia-responsive element. CLIN CHIM ACTA. 2008;395:6–13. [DOI] [PMC free article] [PubMed] [Google Scholar]
- [28].Lu X, Kang Y. Hypoxia and hypoxia-inducible factors: master regulators of metastasis. Clin Cancer Res. 2010;16:5928–5935. [DOI] [PMC free article] [PubMed] [Google Scholar]
- [29].Rankin EB, Giaccia AJ. Hypoxic control of metastasis. SCIENCE. 2016;352:175–180. [DOI] [PMC free article] [PubMed] [Google Scholar]
- [30].Forsythe JA, Jiang BH, Iyer NV, et al. Activation of vascular endothelial growth factor gene transcription by hypoxia-inducible factor 1. Mol Cell Biol. 1996;16:4604–4613. [DOI] [PMC free article] [PubMed] [Google Scholar]
- [31].Greijer AE, van der Wall E. The role of hypoxia inducible factor 1 (HIF-1) in hypoxia induced apoptosis. J Clin Pathol. 2004;57:1009–1014. [DOI] [PMC free article] [PubMed] [Google Scholar]
- [32].Sowter HM, Ratcliffe PJ, Watson P, et al. HIF-1-dependent regulation of hypoxic induction of the cell death factors BNIP3 and NIX in human tumors. Cancer Res. 2001;61:6669–6673. [PubMed] [Google Scholar]
- [33].Erdmann VA, Szymanski M, Hochberg A, et al. Collection of mRNA-like non-coding RNAs. Nucleic Acids Res. 1999;27:192–195. [DOI] [PMC free article] [PubMed] [Google Scholar]
- [34].Bhartiya D, Scaria V. Genomic variations in non-coding RNAs: structure, function and regulation. GENOMICS. 2016;107:59–68. [DOI] [PubMed] [Google Scholar]
- [35].Esteller M. Non-coding RNAs in human disease. Nat Rev Genet. 2011;12:861–874. [DOI] [PubMed] [Google Scholar]
- [36].Angrand PO, Vennin C, Le Bourhis X, et al. The role of long non-coding RNAs in genome formatting and expression. Front Genet. 2015;6:165. [DOI] [PMC free article] [PubMed] [Google Scholar]
- [37].van Jaarsveld MT, Wouters MD, Boersma AW, et al. DNA damage responsive microRNAs misexpressed in human cancer modulate therapy sensitivity. Mol Oncol. 2014;8:458–468. [DOI] [PMC free article] [PubMed] [Google Scholar]
- [38].Slaby O, Laga R, Sedlacek O. Therapeutic targeting of non-coding RNAs in cancer. Biochem J. 2017;474:4219–4251. [DOI] [PubMed] [Google Scholar]
- [39].Bhan A, Soleimani M, Mandal SS. Long noncoding RNA and cancer: a new paradigm. Cancer Res. 2017;77:3965–3981. [DOI] [PMC free article] [PubMed] [Google Scholar]
- [40].Qiu L, Tang Q, Li G, et al. Long non-coding RNAs as biomarkers and therapeutic targets: recent insights into hepatocellular carcinoma. Life Sci. 2017;191:273–282. [DOI] [PubMed] [Google Scholar]
- [41].Xu WH, Zhang JB, Dang Z, et al. Long non-coding RNA URHC regulates cell proliferation and apoptosis via ZAK through the ERK/MAPK signaling pathway in hepatocellular carcinoma. Int J Biol Sci. 2014;10:664–676. [DOI] [PMC free article] [PubMed] [Google Scholar]
- [42].Cui M, Xiao Z, Wang Y, et al. Long noncoding RNA HULC modulates abnormal lipid metabolism in hepatoma cells through an miR-9-mediated RXRA signaling pathway. Cancer Res. 2015;75:846–857. [DOI] [PubMed] [Google Scholar]
- [43].Li H, An J, Wu M, et al. LncRNA HOTAIR promotes human liver cancer stem cell malignant growth through downregulation of SETD2. Oncotarget. 2015;6:27847–27864. [DOI] [PMC free article] [PubMed] [Google Scholar]
- [44].Wang P, Ren Z, Sun P. Overexpression of the long non-coding RNA MEG3 impairs in vitro glioma cell proliferation. J Cell Biochem. 2012;113:1868–1874. [DOI] [PubMed] [Google Scholar]
- [45].Zhu J, Liu S, Ye F, et al. Long noncoding RNA MEG3 interacts with p53 protein and regulates partial p53 target genes in hepatoma cells. Plos One. 2015;10:e139790. [DOI] [PMC free article] [PubMed] [Google Scholar]
- [46].Matouk IJ, Raveh E, Abu-lail R, et al. Oncofetal H19 RNA promotes tumor metastasis. Biochim Biophys Acta. 2014;1843:1414–1426. [DOI] [PubMed] [Google Scholar]
- [47].Takahashi K, Yan IK, Haga H, et al. Modulation of hypoxia-signaling pathways by extracellular linc-RoR. J Cell Sci. 2014;127:1585–1594. [DOI] [PMC free article] [PubMed] [Google Scholar]
- [48].Choudhry H, Albukhari A, Morotti M, et al. Tumor hypoxia induces nuclear paraspeckle formation through HIF-2alpha dependent transcriptional activation of NEAT1 leading to cancer cell survival. ONCOGENE. 2015;34:4546. [DOI] [PMC free article] [PubMed] [Google Scholar]
- [49].Yang F, Huo XS, Yuan SX, et al. Repression of the long noncoding RNA-LET by histone deacetylase 3 contributes to hypoxia-mediated metastasis. Mol Cell. 2013;49:1083–1096. [DOI] [PubMed] [Google Scholar]
- [50].Sun YW, Chen YF, Li J, et al. A novel long non-coding RNA ENST00000480739 suppresses tumour cell invasion by regulating OS-9 and HIF-1alpha in pancreatic ductal adenocarcinoma. Br J Cancer. 2014;111:2131–2141. [DOI] [PMC free article] [PubMed] [Google Scholar]
- [51].Shen XH, Qi P, Du X. Long non-coding RNAs in cancer invasion and metastasis. Mod Pathol. 2015;28:4–13. [DOI] [PubMed] [Google Scholar]
- [52].Zhou C, Ye L, Jiang C, et al. Long noncoding RNA HOTAIR, a hypoxia-inducible factor-1alpha activated driver of malignancy, enhances hypoxic cancer cell proliferation, migration, and invasion in non-small cell lung cancer. Tumour Biol. 2015;36:9179–9188. [DOI] [PubMed] [Google Scholar]
- [53].Chang YN, Zhang K, Hu ZM, et al. Hypoxia-regulated lncRNAs in cancer. GENE. 2016;575:1–8. [DOI] [PubMed] [Google Scholar]
- [54].Yang F, Zhang H, Mei Y, et al. Reciprocal regulation of HIF-1alpha and lincRNA-p21 modulates the Warburg effect. Mol Cell. 2014;53:88–100. [DOI] [PubMed] [Google Scholar]
- [55].Wang Y, Yao J, Meng H, et al. A novel long non-coding RNA, hypoxia-inducible factor-2alpha promoter upstream transcript, functions as an inhibitor of osteosarcoma stem cells in vitro. Mol Med Rep. 2015;11:2534–2540. [DOI] [PMC free article] [PubMed] [Google Scholar]
- [56].Li Z, Li X, Wu S, et al. Long non-coding RNA UCA1 promotes glycolysis by upregulating hexokinase 2 through the mTOR-STAT3/microRNA143 pathway. Cancer Sci. 2014;105:951–955. [DOI] [PMC free article] [PubMed] [Google Scholar]
- [57].Ellis BC, Graham LD, Molloy PL. CRNDE, a long non-coding RNA responsive to insulin/IGF signaling, regulates genes involved in central metabolism. Biochim Biophys Acta. 2014;1843:372–386. [DOI] [PubMed] [Google Scholar]
- [58].Xue M, Li X, Li Z, et al. Urothelial carcinoma associated 1 is a hypoxia-inducible factor-1alpha-targeted long noncoding RNA that enhances hypoxic bladder cancer cell proliferation, migration, and invasion. Tumour Biol. 2014;35:6901–6912. [DOI] [PubMed] [Google Scholar]
- [59].Michalik KM, You X, Manavski Y, et al. Long noncoding RNA MALAT1 regulates endothelial cell function and vessel growth. Circ Res. 2014;114:1389–1397. [DOI] [PubMed] [Google Scholar]
- [60].Ferdin J, Nishida N, Wu X, et al. HINCUTs in cancer: hypoxia-induced noncoding ultraconserved transcripts. Cell Death Differ. 2013;20:1675–1687. [DOI] [PMC free article] [PubMed] [Google Scholar]
- [61].Iio A, Takagi T, Miki K, et al. DDX6 post-transcriptionally down-regulates miR-143/145 expression through host gene NCR143/145 in cancer cells. Biochim Biophys Acta. 2013;1829:1102–1110. [DOI] [PubMed] [Google Scholar]
- [62].Steck E, Boeuf S, Gabler J, et al. Regulation of H19 and its encoded microRNA-675 in osteoarthritis and under anabolic and catabolic in vitro conditions. J Mol Med (Berl). 2012;90:1185–1195. [DOI] [PubMed] [Google Scholar]
- [63].Matouk IJ, Mezan S, Mizrahi A, et al. The oncofetal H19 RNA connection: hypoxia, p53 and cancer. Biochim Biophys Acta. 2010;1803:443–451. [DOI] [PubMed] [Google Scholar]
- [64].Matouk IJ, DeGroot N, Mezan S, et al. H19 non-coding RNA is essential for human tumor growth. Plos One. 2007;2:e845. [DOI] [PMC free article] [PubMed] [Google Scholar]
- [65].Leppek K, Stoecklin G. An optimized streptavidin-binding RNA aptamer for purification of ribonucleoprotein complexes identifies novel ARE-binding proteins. Nucleic Acids Res. 2014;42:e13. [DOI] [PMC free article] [PubMed] [Google Scholar]
- [66].Buchanan BW, Lloyd ME, Engle SM, et al. Cycloheximide chase analysis of protein degradation in saccharomyces cerevisiae. J Vis Exp. 2016;107:59–68. [DOI] [PMC free article] [PubMed] [Google Scholar]
- [67].Guo N, Peng Z. MG132, a proteasome inhibitor, induces apoptosis in tumor cells. Asia Pac J Clin Oncol. 2013;9:6–11. [DOI] [PubMed] [Google Scholar]
- [68].Yamaki A, Muratsubaki H. Phenazine methosulfate decreases HIF-1alpha accumulation during the exposure of cells to hypoxia. Biosci Biotechnol Biochem. 2012;76:1682–1687. [DOI] [PubMed] [Google Scholar]
- [69].Gil N, Ulitsky I. Regulation of gene expression by cis-acting long non-coding RNAs. Nat Rev Genet. 2020;21:102–117. [DOI] [PubMed] [Google Scholar]
- [70].Kopp F, Mendell JT. Functional classification and experimental dissection of long noncoding RNAs. CELL. 2018;172:393–407. [DOI] [PMC free article] [PubMed] [Google Scholar]
- [71].Lam MT, Li W, Rosenfeld MG, et al. Enhancer RNAs and regulated transcriptional programs. Trends Biochem Sci. 2014;39:170–182. [DOI] [PMC free article] [PubMed] [Google Scholar]
- [72].Chourasia AH, Tracy K, Frankenberger C, et al. Mitophagy defects arising from BNip3 loss promote mammary tumor progression to metastasis. Embo Rep. 2015;16:1145–1163. [DOI] [PMC free article] [PubMed] [Google Scholar]
Associated Data
This section collects any data citations, data availability statements, or supplementary materials included in this article.