

Summary
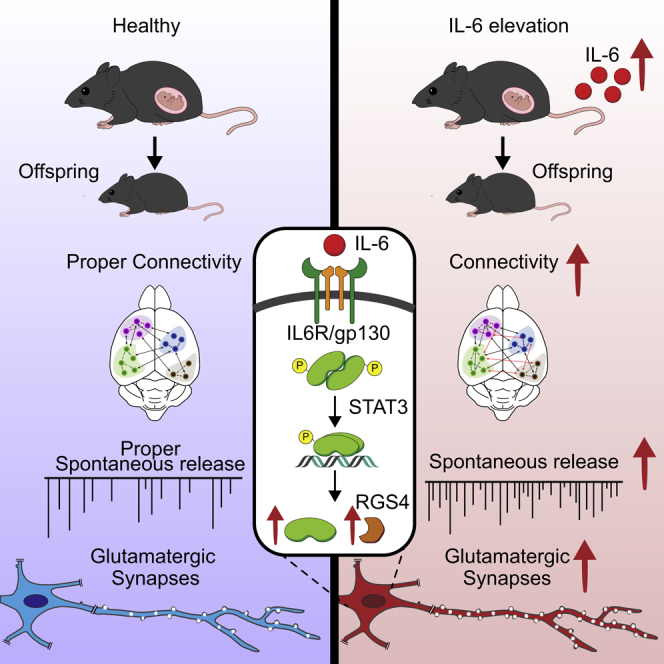
Early prenatal inflammatory conditions are thought to be a risk factor for different neurodevelopmental disorders. Maternal interleukin-6 (IL-6) elevation during pregnancy causes abnormal behavior in offspring, but whether these defects result from altered synaptic developmental trajectories remains unclear. Here we showed that transient IL-6 elevation via injection into pregnant mice or developing embryos enhanced glutamatergic synapses and led to overall brain hyperconnectivity in offspring into adulthood. IL-6 activated synaptogenesis gene programs in glutamatergic neurons and required the transcription factor STAT3 and expression of the RGS4 gene. The STAT3-RGS4 pathway was also activated in neonatal brains during poly(I:C)-induced maternal immune activation, which mimics viral infection during pregnancy. These findings indicate that IL-6 elevation at early developmental stages is sufficient to exert a long-lasting effect on glutamatergic synaptogenesis and brain connectivity, providing a mechanistic framework for the association between prenatal inflammatory events and brain neurodevelopmental disorders.
Keywords: neurodevelopmental disorder, synaptic development, IL-6, STAT3, RGS4, pro-inflammatory cytokines, neuroinflammation, glutamatergic transmission, maternal immune activation, brain connectivity
Graphical abstract
Highlights
-
•
Prenatal IL-6 causes increases in excitatory synapses and brain connectivity in adults
-
•
IL-6 activates genetic programs of synaptogenesis in developing neurons
-
•
Transcription factor STAT3 is activated in neurons upon IL-6 elevation
-
•
The STAT3 downstream gene Rgs4 is responsible for the increase in excitatory synapses
Prenatal inflammation is a risk factor for different neurodevelopmental disorders, but the mechanisms by which brain connectivity is affected remain unclear. Mirabella et al. demonstrate that transient maternal elevation of IL-6 induces an abnormal, long-lasting increase of excitatory synapses and brain connectivity in the offspring, providing a mechanistic link between maternal immune activation and defects in newborn brain development.
Introduction
Synapse formation during brain development is a complex and hierarchically regulated event ensuring proper brain connectivity (Lu et al., 2009; McAllister, 2007; Williams et al., 2010) and correct excitatory/inhibitory (E/I) balance in the adulthood (Cline, 2005; Gatto and Broadie, 2010). Defects in this process result in altered brain development (Courchesne et al., 2007; Supekar et al., 2013) and neurodevelopmental disorders (Melom and Littleton, 2011; Penzes et al., 2011).
Beyond activation of highly specialized genetic programs (Shen and Scheiffele, 2010), environmental factors critically contribute to the process of synapse formation (Grabrucker, 2013). Among them, inflammatory states occurring at early stages of neurodevelopment are recognized as main environmental insults negatively affecting the entire brain developmental trajectory (Bergink et al., 2014; Fontana et al., 2021; Knuesel et al., 2014; Li et al., 2009; Onore et al., 2012; Potvin et al., 2008). Although the underlying mechanisms are still undefined, soluble inflammatory mediators are thought to be key players in this process (Bauer et al., 2007; Deverman and Patterson, 2009; McAfoose and Baune, 2009).
Interleukin-6 (IL-6) is a pleiotropic proinflammatory cytokine that exerts several actions on the mature nervous system (Balschun et al., 2004; Erta et al., 2012), modulating a plethora of brain processes, including energy homeostasis (Timper et al., 2017; Wallenius et al., 2002), adult neurogenesis (Monje et al., 2003; Vallières et al., 2002), and axonal regeneration (Cafferty et al., 2004; Leibinger et al., 2013a, 2013b; Pieraut et al., 2011). IL-6 also plays key roles during brain development, and mouse embryos prenatally exposed to IL-6 display behavioral defects at adult stages (Choi et al., 2016; Shin Yim et al., 2017; Smith et al., 2007). A tight association between elevated IL-6 during pregnancy, altered brain connectivity, and working memory in newborns has been reported in humans (Rudolph et al., 2018; Spann et al., 2018). Whether IL-6 affects synaptogenesis trajectories is unknown.
We describe a pro-synaptogenic effect of IL-6 specifically involving glutamatergic synapses. The enhanced excitatory synapses persist at mature stages and associate with brain hyperconnectivity. This process depends on activation of signal transducer and activator of transcription-3 (STAT3) and involves its downstream target gene regulator of G protein signaling 4 (RGS4). Therefore, a transient increase in IL-6, consequent to inflammatory processes occurring at early phases of neurodevelopment, is sufficient to disturb the process of excitatory synaptogenesis, resulting in abnormal brain connectivity in adulthood.
Results
Transient prenatal IL-6 elevation enhances hippocampal glutamatergic synapses and functional connectivity in adulthood
We assessed whether transient prenatal IL-6 elevation affects the density of synaptic contacts in the offspring. A single intraperitoneal (i.p.) injection of 5 μg of IL-6 (Choi et al., 2016; Gallagher et al., 2013; Smith et al., 2007) or vehicle (as a control) was administered to pregnant mice on gestational day 15 (GD15) (Figure 1A), when the hippocampus is already formed (Urbán and Guillemot, 2014), neurogenesis is peaking, and synaptogenesis and astrogenesis have not yet started (Angevine, 1965; Finlay and Darlington, 1995; Reemst et al., 2016).
Figure 1.

Transient prenatal exposure of embryos to IL-6 on E15 increases glutamatergic synapses and brain connectivity in the offspring at post-natal stages
(A) Experimental workflow: i.p. injection of vehicle or IL-6 on GD15. Male offspring was analyzed on P15.
(B) Immunofluorescence analysis of vesicular glutamate transporter (VGLUT1; green) and vesicular GABA transporter (VGAT; red) puncta in the stratum radiatum of the CA1 hippocampal region of offspring on P15. Right panels: high-magnification images relative to the dotted squares. Scale bars, 5 μm.
(C) Quantitative analysis of VGLUT1 (vehicle, n = 5 mice; IL-6, n = 7 mice; 3 independent experiments) and VGAT area under the two conditions. Vehicle, n = 6 mice; IL-6, n = 7 mice; 3 independent experiments; Mann-Whitney test; ∗∗p = 0.0025.
(D) Electrophysiological traces of mEPSCs and mIPSCs recorded in CA1 pyramidal hippocampal neurons in acute brain slices established from P15 male offspring.
(E and F) Analysis of frequency and amplitude of mEPSCs (vehicle, n = 18 cells, 4 mice; IL-6, n = 19 cells, 6 mice; 3 independent experiments; Mann-Whitney test; ∗∗∗∗p = 0.00002) and mIPSCs (vehicle, n = 12 cells, 3 mice; IL-6, n = 8 cells, 4 mice; 3 independent experiments).
(G) Quantitative analysis of the E/I ratio, calculated as the ratio between mEPSC and mIPSC frequency recorded at the single-cell level. Vehicle, n = 12 cells, 3 mice; IL-6, n = 8 cells, 3 mice; 3 independent experiments; Mann-Whitney test; ∗∗∗p = 0.0007.
(H) Top panel: experimental workflow; i.c.v. injection of vehicle or IL-6 into E15 embryos. The offspring was analyzed on P15. Bottom panels: immunofluorescence analysis of Vglut-1-positive puncta (green) in the stratum radiatum of the CA1 hippocampal region of P15 offspring. Scale bar, 10 μm. Also shown is quantitative analysis of Vglut-1 area in the CA1 hippocampal region under the two conditions. Vehicle, n = 7 injected mice; IL-6, n = 8 injected mice; Mann-Whitney test; ∗∗∗p = 0.0003.
(I) Top panel: experimental workflow; in utero co-electroporation of PSD95.FingR-GFP and TdTomato in E14 embryos, followed by i.p. injection of vehicle or IL-6 in the mother on GD15. The male offspring was analyzed at P20 for synaptic density in the cortex. Bottom panels: representative dendritic segment of cortical neurons expressing PSD95.FingR-GFP of embryos exposed to vehicle or IL-6. Scale bar, 5 μm. Also shown is quantitative analysis of PSD-95 cluster density along the dendrite. Vehicle, n = 25; IL-6, n = 48, number of mice (vehicle, n = 5; IL-6, n = 11), number of independent experiments (vehicle, n = 4; IL-6, n = 5; ∗p = 0.0295; Mann-Whitney test.
(J) Randomized non-parametric statistics of whole-brain functional connectome mapping indicate a shift toward hyperconnectivity in IL-6 male mice.
(K) Circos plot showing the anatomical location of hyperconnected edges (n = 242) in IL-6 mice compared with vehicle-treated mice (p < 0.05, uncorrected; vehicle, n = 9 mice; IL-7, n = 7 mice; 3 independent experiments).
(L) Dual regression analysis in 15 rs networks (RSNs) revels a significant increase in dorsal hippocampal network strength in the IL-6-treated group compared with vehicle ctrl mice (p = 0.017, Bonferroni corrected).
(M) Multivariate ANOVA, Bonferroni corrected across 15 RSNs. The bar plots represents mean ± SEM; ∗∗p = 0.017.
See also Figures S1 and S2.
The density of excitatory and inhibitory synaptic puncta was evaluated in the hippocampal CA1 region of mice on post-natal day 15 (P15) through immunofluorescence analysis of the glutamate vesicular transporter (VGLUT) and GABA vesicular transporter (VGAT) (Figure 1B). The area of VGLUT- but not VGAT-positive puncta was enhanced significantly in the hippocampus of mice exposed prenatally to IL-6 (Figure 1C). To evaluate possible functional changes, glutamatergic and GABAergic basal transmission was recorded simultaneously by whole-cell patch-clamp technique in pyramidal CA1 neurons (Figure 1D). We found a substantial increase in the frequency of miniature excitatory postsynaptic currents (mEPSCs) in mice exposed prenatally to IL-6 (Figure 1E). Miniature inhibitory postsynaptic currents (mIPSCs) were not altered (Figure 1F), resulting in E/I imbalance of neurotransmission (Figure 1G).
Maternal IL-6 elevation triggers activation of peripheral cells and modulates immune molecules and the gut microbiota in the mother (Choi et al., 2016; Kim et al., 2017; Shin Yim et al., 2017). To bypass any possible indirect signaling from the mother, IL-6 or vehicle was injected intracerebroventricularly (i.c.v.) into embryos at embryonic day 15 (E15) (Figure 1H). Consistent with the results obtained upon i.p. injection, i.c.v. administration of IL-6, acting locally in the embryonic brain without inducing an immune response in the mother (Choi et al., 2016), promotes an increase of glutamatergic synapses (Figure 1H).
The increase in excitatory synapse density in mice exposed prenatally to IL-6 was confirmed using the recombinant antibody-like protein fibronectin intrabodies generated with mRNA display (FingRs), which binds endogenous PSD-95 (PSD95.FingR-GFP). GD14 cortical progenitors were co-electroporated with PSD95.FingR-EGFP to selectively target excitatory neurons and a TdTomato-expressing vector to visualize dendritic branches. Pregnant dams were subsequently injected i.p. with vehicle or IL-6 at GD15, and the offspring was analyzed at P20 (Figure 1I). In line with the results obtained in the hippocampus, the density of endogenous PSD-95 clusters in cortical dendritic branches of mice exposed prenatally to IL-6 was increased significantly relative to vehicle-exposed mice (Figure 1I).
The selective increase in excitatory but not inhibitory synapses in mice exposed to prenatal IL-6 elevation persisted up to P30 (Figures S1A–S1C). An abnormal number of excitatory synapses and/or altered E/I balance within local microcircuits, occurring in many models of neurodevelopmental disorders (Durand et al., 2007; Lee et al., 2015; Sala et al., 2001), is often associated with macroscale alterations in functional connectivity, detectable by resting-state fMRI (Ajram et al., 2017; Filipello et al., 2018; Pagani et al., 2019; Zhou et al., 2019). Hence, we determined whether the transient prenatal IL-6 elevation affects brain connectivity in adulthood. We acquired resting-state fMRI (rs-fMRI) scans in 16 mice (9 treated and 7 controls) at 14 weeks of age using standardized pipelines for anesthesia control, data acquisition, and preprocessing (Figure S1D; Zerbi et al., 2015, 2018). To probe the existence of aberrant functional connections, blood-oxygen-level-dependent (BOLD) time series were extracted from 165 regions of interest (ROIs) using Allen’s Common Coordinate Framework, and their connectivity couplings were measured using regularized Pearson’s correlation coefficients. Randomized permutation testing (5,000 permutations) revealed an overall hyperconnectivity phenotype of IL-6 mice compared with controls (Figure 1J). The spatial distribution of the hyperconnected edges was widespread (242 of 2,724 edges were identified as significantly hyperconnected at p < 0.05), and the strongest contribution was given by hippocampal-midbrain, hippocampal-parietal, hippocampal-cortical subplate, prefrontal-parietal, and somatomotor-thalamic connections among all (Figure 1K). Only 36 edges (1.3%) were found to be hypoconnected in the IL-6 group compared with vehicle controls (Figure S1D).
Next we examined whether excessive excitatory neurotransmission prompts large-scale rs network (RSN) reconfiguration. The connectivity strength within 15 maximally independent RSNs was measured using a dual regression approach, as described elsewhere (Filippini et al., 2009); for a complete list and spatial distribution of the networks please refer to our previous study (Zerbi et al., 2015). Statistical analysis was conducted by comparing the connectivity strength within all voxels that constitute each RSN. In the dorsal hippocampal network, connectivity was significantly higher in the IL-6 group compared with controls (p = 0.017; Figures 1L and 1M). The temporal association network also showed moderate increases in connectivity in the IL-6 group without reaching statistical significance (p = 0.09). Conversely, a reduction in connectivity approaching significance was seen in the primary and secondary somatosensory networks (p = 0.066 and p = 0.130, respectively; Figure S1E). None of the other networks were affected. These data suggest that excitatory neurotransmission after IL-6 exposure can be detected with rs-fMRI in the form of increased synchronicity, especially within elements of the hippocampal network. The structural integrity of major axonal bundles was quantified by extracting fractional anisotropy (FA) values from seven white-matter structures, as described previously (Zerbi et al., 2013b, 2019). Not all white matter tracts exhibited significant differences between IL-6 mice and vehicle controls (Figure S1F), indicating that prenatal IL-6 does not compromise the macroscopic characteristics of anatomical connections but, rather, impairs their function. In line with the altered brain connectivity primarily involving the hippocampal region, mice exposed prenatally to IL-6 showed a lower discrimination index in the object location memory test (Figure S1G), indicating a specific impairment of spatial memory, without defective performance in the novel object recognition, open field, and elevated plus maze tests (Figures S1H–S1J).
No major anatomical alterations, including cortical architecture or lamination, were observed under any experimental condition (Figures S2A and S2B). In addition, no sign of astrogliosis or inflammation (Figures S2C–S2H), including the transcriptional amount of mRNA coding for inflammatory mediators (Figures S2I and S2J), was detected in the offspring brain. These data demonstrate that transient prenatal exposure to IL-6 results, in the offspring, in a selective increase in glutamatergic inputs associated with altered hippocampus-related functional connectivity and behavior, with no major morphological defects or inflammatory signs.
Prenatal IL-6 engages molecular programs of synaptogenesis in developing hippocampal neurons
The long-lasting effects produced by IL-6 suggest involvement of a transcriptional mechanism. To investigate the molecular programs activated by prenatal IL-6, pregnant mothers were injected with the cytokine or vehicle on GD15, and embryonic hippocampi were dissociated and analyzed through 10X single-cell sequencing after 24 h (GD16). This time window allowed us to investigate the early transcriptome rearrangements induced by IL-6 with single-cell resolution (Mancinelli and Lodato, 2018; Figure 2A).
Figure 2.

Single-cell sequencing of embryonic brains exposed to IL-6 reveals a deep transcriptional rearrangement in neuronal populations and engagement of key biological processes in synaptogenesis
(A) Experimental workflow: maternal i.p. injection of vehicle or IL-6 was performed on GD15. 24 h later, embryonic hippocampi were dissected, and single-cell dissociation was sequenced.
(B) Uniform manifold approximation and projection (UMAP) plot showing the cell type population identified.
(C) Dot plot showing selected cell type markers used for cluster annotation.
(D) Rose plots showing the number of upregulated or downregulated genes upon IL-6 treatment in all different cell types.
(E) Volcano plots showing the correlation between statistical significance (−log10-adjusted p value) and the fold change of the deregulated genes in selected cell types of interest.
(F) Bar plots showing Gene Ontology enrichment for selected and most significant biological processes.
(G) Average heatmap of the top upregulated genes in the CA-ExN1 cell type.
i.p., intraperitoneal(ly); Hp, hippocampus; CA, cornu ammonis; ExN, excitatory neuron; RG, radial glia; CR, Cajal-Retzius; DG, dentate gyrus; MGE-InhN, medial ganglionic eminence-derived inhibitory interneuron; CGE-InhN, caudal ganglionic eminence-derived InhIN; VC, vascular cell; OPC, oligodendrocyte precursor cell. See also Figure S3.
We profiled 10,877 cells isolated from five pooled hippocampi under control conditions or upon IL-6 administration (control [ctrl], 5,892; IL-6, 4,985). The median number of genes detected per cell was 3,948 for IL-6 and 4,042 for ctrl conditions. Unsupervised clustering analysis identified 14 transcriptionally independent clusters that were assigned to distinct cell types according to the expression of known signature genes (Figure 2B; Figures S3A and S3B; Table S1). The most abundant clusters (cornu ammonis excitatory neuron 1 (CA-ExN1), CA-ExN2, andCA-ExN3) displayed enrichment of CA neuron-specific genes at different stages of their differentiation (e.g., Cntn2, Neurod2, Bhlhe22, Arpp21, Ndrg1, Crym, Emx1, and Sstr2), and one cluster (radial glia [RG]) expressed cycling glia-specific markers (Hes5, Vim, and Mt3) (Figure 2C; Table S1). We also identified a cell cluster expressing specific markers of dentate gyrus (DG-ExN; e.g., Prox1, Calb2, and Kcnk1) and Cajal-Retzius neurons (CA-CR; e.g., Rspo1, Rspo3, and Reln; Figure 2C). Two clusters were clearly ascribed to the GABAergic lineage, expressing prototypical markers of medial ganglionic eminence (MGE)-derived (Sst, Sp9, and Maf) and caudal ganglionic eminence (CGE)-derived (Adarb2, Htr3a, and Cxcl14) cortical and hippocampal GABAergic neurons (Figure 2C; Table S1; Mancinelli and Lodato, 2018; Tomassy et al., 2010). At this stage of development, besides being the most abundant cell types identified, neuronal clusters are also the main cells affected by IL-6. Indeed, differential expression analysis revealed that the subtype displaying the highest number of deregulated genes was CA-ExN1 (Figures 2D and 2E; Figures S3D and S3E; Table S2), corresponding to the excitatory pyramidal neurons of the CA periventricular stratum (differentially expressed genes [DEGs], ctrl versus IL-6 = 460). In contrast, non-neuronal subtypes were modified only to a very low extent (Figures 2D and 2E). Gene Ontology analysis of DEGs in neuronal clusters revealed enrichment of key biological processes related to axonogenesis (GO:0007409, log10 false discovery rate [FDR] = −9.5768) and synapse organization (GO:0050808, log10 FDR = −3.1784) (Figure 2F; Figure S3F). Particularly, in CA-ExN1, IL-6 induced increased expression of genes associated previously with cortical spine maturation (Opcml; Zhang et al., 2019b) and axon formation (Shtn1; Zhang et al., 2019a) (Figure 2G). Specific pathways associated with energetic metabolism were also upregulated (e.g., GO:0046034, ATP metabolic process; GO:0006091, generation of precursor metabolites and energy; GO:0007005, mitochondrion organization; GO:0022900, electron transport chain), suggesting that extensive reprogramming of cellular metabolism occurs in neurons upon prenatal IL-6 challenge.
IL-6 selectively enhances glutamatergic synaptogenesis through direct action on neurons
To investigate the putative pro-synaptogenic role of IL-6 at the cellular and molecular levels, we exploited primary neuronal cultures, in which synapses develop from immature (4–7 days in vitro [DIV]) to mature (13–14 DIV) stages (Matteoli et al., 1995). Primary cultures of hippocampal neurons established from IL-6-exposed E18 embryos (Figure 3A) showed a higher mEPSC but not mIPSC frequency (Figures 3B and 3C). Thus, the effect of IL-6 is sculpted intrinsically in neurons, even after their isolation from the brain context.
Figure 3.

The proinflammatory cytokine IL-6 selectively increases glutamatergic synaptogenesis in developing neurons
(A) Experimental workflow: a single pulse of vehicle or IL-6 was injected i.p. into a pregnant mother on GD15, and primary hippocampal neurons were established on E18. Cultured neurons were assayed at 14 DIV through patch-clamp recording.
(B and C) Representative traces of glutamatergic and GABAergic synaptic basal transmission (B) followed by quantitative analysis (C) of the frequency and amplitude of mEPSCs and mIPSCs in hippocampal cultures established from vehicle- or IL-6-exposed embryos. mEPSCs: vehicle, n = 21 cells; IL-6, n = 31 cells; Mann-Whitney test; ∗∗∗∗p = 0.00004. mIPSCs: vehicle, n = 15 cells; IL-6, n = 21 cells; Mann-Whitney test; 4 independent experiments.
(D) Experimental workflow: different concentrations of IL-6 were incubated throughout in vitro development of hippocampal neurons, from 1 DIV up to 13 DIV, adding the cytokine every 3 days, and then analyzed at 14 DIV.
(E and F) Electrophysiological traces (E) and quantitative analysis (F) of mEPSC frequency (left panel) and amplitude (right panel) in neuronal cultures at 14 DIV upon chronic treatment with IL-6 at the indicated concentrations. Cells: Ctrl, n = 27; 1 ng/mL, n = 17; 5 ng, n = 14; 10 ng, n = 28; 3 independent experiments; one-way ANOVA on ranks followed by Dunn’s multiple comparisons test; ∗∗∗p = 0.0005, ∗∗p = 0.0062, ∗p = 0.0376.
(G) Electrophysiological traces of mIPSCs of neuronal cultures at 14 DIV upon chronic treatment with IL-6 at 10 ng/mL. Bottom panel: quantitative analysis of the amplitude and frequency of mIPSCs. Cells: Ctrl, n = 22; IL-6, n = 23; 3 independent experiments; Mann-Whitney test.
(H) Immunofluorescence analyses of PSD-95-positive (green) and VGLUT1-positive (blue) punctum density along dendritic processes (beta III tubulin, red) under ctrl conditions and after chronic treatment with IL-6 (10 ng/mL). Scale bar, 10 μm. Bottom panels: bar graphs showing postsynaptic (left graph), presynaptic (center panel), and colocalizing punctum density (right panel). Four independent experiments. Dendrites analyzed: ctrl, n = 62; IL-6, n = 71; paired t test; ∗p = 0.0341PSD95 density, ∗∗p = 0.0089Vglut density, ∗p = 0.0173Coloc density).
See also Figure S4.
To assess whether IL-6 promotes synapse formation through specific action on neurons, primary cultures of embryonic hippocampal neurons were exposed to different IL-6 concentrations (1, 5, and 10 ng/mL) from 1–14 DIV, refreshing IL-6 every 3 days (Figure 3D), and analyzed through patch-clamp recording at 14 DIV (Figure 3E). Again, the frequency of mEPSCs, but not mIPSCs, was increased significantly upon incubation with IL-6 at 10 ng/mL (Figures 3F and 3G), reflecting an E/I imbalance even in vitro. No changes in passive membrane properties were observed (Figure S4A), indicating that the overall health state of neurons was not affected by the cytokine at this concentration. The increased glutamatergic basal transmission was accompanied by a higher number of mature excitatory synapses (Figure 3H) with no effect on the density of inhibitory synapses (Figures S4B and S4C).
The increase in mEPSCs frequency might, in principle, result from different mechanisms, including enhanced release probability at presynaptic terminals or homeostatic compensatory mechanisms (e.g., synaptic scaling) (Vereyken et al., 2007; Wierenga et al., 2006). We excluded these possibilities because short-term plasticity in synaptically connected neurons (Figure S4D; Maximov et al., 2007) and neuronal excitability (Bedogni et al., 2016; Pozzi et al., 2013) were not altered upon IL-6 treatment (Figures S4E, S4G, and S4H). Notably, the amplitude of postsynaptic currents (EPSCs) evoked by a single action potential was significantly higher in neurons exposed to IL-6 treatment (Figure S4F), in line with the increase in glutamatergic inputs (Chao et al., 2007).
To rule out a possible contribution of astrocytes to the enhanced excitatory neurotransmission, hippocampal cultures were grown in the presence of the anti-proliferative agent cytosine arabinoside (Ara-C), which reduces the astrocytic component by 97%, comparable with that of 1 DIV cultures (Figures S4I–S4K). Even under these conditions, IL-6 enhanced mEPSCs frequency (Figure S4L), indicating a negligible role of astrocytes. Furthermore, the lack of changes in the total number of cells as well as in the ratio between astrocytes and neurons in cultures chronically exposed to IL-6 (Figure S4M) excluded a role of the cytokine in changing the overall cellular composition of the culture. Finally, because primary neuronal cultures do not contain microglia unless added specifically (Figure S4N; Filipello et al., 2018), a role of these immune cells in the IL-6 effect can be ruled out.
A single pulse of IL-6 at stages preceding synaptogenesis is sufficient to promote a long-lasting increase in glutamatergic synaptic transmission
To identify developmental stages more sensitive to IL-6, neuronal cultures were incubated with the cytokine at early stages of neuronal development (1–4 DIV; Figure 4A). This treatment was sufficient to increase mEPSC frequency (Figures 4B and 4C) and glutamatergic synapse density at 14 DIV in hippocampal (Figures 4D and 4E) and cortical neurons (Figure S5A). Furthermore, even a single pulse of IL-6, applied before (1 DIV) or during (4 DIV) synaptogenesis (Figures 4F–4H) was sufficient to enhance excitatory transmission. Conversely, transient (Figures 4I–4K) or prolonged (Figure S5B) treatment at synaptically mature stages (13–21 DIV) failed to increase glutamatergic transmission. No modulation of synaptic transmission was observed upon acute application of IL-6 (Figure S5C). Transient IL-6 treatment was effective even in neuronal cultures established from embryos at E15 (Figure S5D), a stage far preceding onset of gliogenesis (Bedogni et al., 2016), when the amount of astrocytes is even lower (Figures S5E and S5F). Unlike IL-6, different proinflammatory cytokines, such as interferon γ (INFγ), tumor necrosis factor alpha (TNF-α), and IL-1β, failed to enhance excitatory transmission (Figure S5G), indicating specificity of IL-6 as a pro-synaptogenic molecule.
Figure 4.

A transient elevation of IL-6 at the early stage of neuronal development is sufficient to promote glutamatergic synaptogenesis
(A) Experimental workflow: IL-6 at 10 ng/mL was added at early stages of neuronal development at 1 and 4 DIV. Neurons were assayed at 14 DIV.
(B) Electrophysiological traces of mEPSCs in neuronal cultures at 14 DIV under ctrl conditions and upon short (1–4 DIV) treatment with IL-6.
(C) Quantitative analysis of mEPSC frequency and amplitude under ctrl conditions and upon IL-6 treatment. Cells: ctrl, n = 24; IL-6, n = 22; 3 independent experiments; Mann-Whitney test; ∗∗∗p = 0.0007.
(D) Immunofluorescence analysis of glutamatergic synaptic density using presynaptic (VGLUT1, blue) and postsynaptic (PSD-95, green) markers along a dendritic branch stained with beta III tubulin (red). Scale bar, 10 μm.
(E) Quantitative analysis of PSD-95 (left panel) and VGLUT1 (center panel) and colocalizing punctum density (right panel) under both conditions (3 independent experiments). Dendrites analyzed: ctrl, n = 133; IL-6, n = 153; paired t test; ∗p = 0.0328Vglut density, ∗p = 0.0373Coloc density.
(F) Experimental workflow: a single exposure of IL-6 10 ng/mL was applied at 1 DIV (top panel) or 4 DIV (bottom panel), and neurons were assayed at 14 DIV.
(G and H) Representative traces (G) and quantitative analysis (H) of mEPSC frequency and amplitude at 14 DIV under ctrl conditions and upon single IL-6 exposure at the indicated time points Cells: ctrl, n = 14; IL-6, 1 DIV, n = 14; IL-6, 4 DIV, n = 19; 3 independent experiments; one-way ANOVA on ranks followed by Dunn’s multiple comparisons test; ∗∗p = 0.0011; ∗∗∗∗p = 0.00001).
(I) Experimental workflow: a single exposure of IL-6 (10 ng/mL) was performed at 13 DIV, and neurons were assayed at 14 DIV.
(J and K) Representative traces (J) and quantitative analysis (K) of mEPSC frequency and amplitude recorded at 14 DIV under ctrl conditions and upon single IL-6 exposure at later stages of development. Cells: ctrl, n = 22; IL-6, n = 22; 3 independent experiments.
See also Figures S5 and S6.
Thus, transient IL-6 elevation at stages preceding synapse formation promotes long-lasting, selective enhancement of glutamatergic synapses without a crucial contribution from glial cells.
STAT3 activity is required for the IL-6-dependent increase in glutamatergic synapses
IL-6 is known to activate a cascade of molecular events converging on activation of STAT3 (Heinrich et al., 2003). Accordingly, we found that STAT3 transcript and protein were enhanced in neuronal cultures upon IL-6 treatment at early stages of development (Figures 5A–5D), which also occurred in Ara-C-treated cultures (Figures 5C and 5D), indicating neuron-specific STAT3 activation. A significant increase in mean fluorescence intensity of the protein was also detected in the hippocampus upon prenatal IL-6 treatment for 24 h (Figure 5E), confirming STAT3 activation in vivo (Figures 5F and 5G).
Figure 5.

IL-6 increases STAT3 transcript and protein in neurons and induces selective phosphorylation at Tyr-705
(A) Experimental workflow: IL-6 at 10 ng/mL was added at 1 and 4 DIV, and neurons were collected at 6 DIV for the analysis.
(B) qPCR analysis of Stat3 mRNA in ctrl and IL-6-treated cultures (4 independent experiments, one-sample t test, ∗∗p = 0.008).
(C) Western blot analysis of STAT3 protein in ctrl and IL-6-treated neuronal cultures in the absence (with astrocytes, left panel) or presence of Ara-C (no astrocytes, right panel).
(D) Quantitative analysis of the optical density of STAT3 immunoreactive bands normalized by GAPDH in untreated (left graphs) and Ara-C-treated cultures (right graphs). Four independent experiments; one-sample t test; Ctrl cultures, ∗p = 0.025; Ara-C cultures, ∗p = 0.041).
(E) Experimental workflow: a single pulse of vehicle (saline, as a ctrl) or IL-6 was injected i.p. into pregnant mothers on GD15 and the Hp of the embryo was analyzed 24 h after injection through immunofluorescence.
(F) Immunofluorescence of hippocampal regions stained with STAT3 (red) and Hoechst (blue), established from embryos on E16 exposed to vehicle or IL-6 on GD15 via maternal i.p. injection. VZ, ventricular zone; HNE, hippocampal neuroepithelium; DNE, dentate neuroepithelium; CH, cortical hem. Inset panels: higher magnification of the selected area. Scale bars, 250 μm.
(G) Quantitative analysis of normalized STAT3 mean intensity in the Hp under the two conditions (vehicle, n = 7 embryos; IL-6, n = 6 embryos; Three independent experiments (3 litters); Student’s t test; ∗p = 0.0129).
(H) Cultured neurons at 6 DIV were treated acutely with IL-6 and collected at different time points for western blot analysis.
(I and J) Time course analysis of STAT3 phosphorylation at Tyr-705 (I) and Ser-727 (J) upon acute (30-min) IL-6 treatment at 6 DIV in cultured neurons. Values were normalized (bottom panels) against the total amount of STAT3 (4 independent experiments, Wilcoxon signed-rank test, ∗p = 0.0313).
See also Figure S5.
STAT3 undergoes phosphorylation at two specific residues, tyrosine-705 (Tyr-705) and serine-727 (Ser-727). according to the kind of stimulation (Chung et al., 1997a, 1997b; Lim and Cao, 1999; Wen et al., 1995). A transient increase in phosphorylation at Tyr-705 (Figure 5H) was detected after acute IL-6 application to neuronal cultures (Figure 5I), whereas Ser-727 remained unaltered (Figure 5J). Accordingly, STAT3 phosphorylation at Tyr-705 was enhanced in embryonic cortices upon i.c.v. injection with IL-6 (Figure S5H).
IL-6-dependent signaling can be classified as classical or trans-signaling, according to which receptor, membrane-bound (mIL-6R) or soluble protein (sIL-6R), dimerizes with β-receptor subunit glycoprotein 130 (gp130), triggering a cascade of intracellular events (Hunter and Jones, 2015; Jones et al., 2001, 2011; Rothaug et al., 2016). In our cultures, expression of both receptors was upregulated significantly upon IL-6 elevation (Figure S5I), whereas downregulation of IL-6R reduced constitutive STAT3 phosphorylation and prevented its activation upon IL-6 (Figure S5J), indicating specificity of this receptor for activation of IL-6-dependent intracellular pathways. A time course analysis showed that transcriptional expression of IL-6R and gp130 mRNA was stable at 5 and 10 DIV and underwent significant downregulation at 14 DIV (Figure S5K). In vivo, transcriptional expression of IL-6R increases steadily from E16 to P0 in the hippocampus and cortex, whereas gp130 undergoes strong downregulation at birth (Figures S5L and S5M). To discriminate which of the two pathways, classical or trans-signaling, was predominant in developing neurons, we exploited the recombinant soluble form of the GP130 receptor (sGP130) to interfere with the trans-signaling pathway (Jostock et al., 2001). We found that sGP130 did not affect IL-6-mediated phosphorylation of STAT3 in cultured neurons (Figure S5N), whereas in raw 264.7 cells, a monocyte/macrophage-like cell line known to produce and secrete high amounts of sIL-6R (Schumacher et al., 2015), sGP130 reduced STAT3 activation (Figure S5O). Accordingly, sIL-6R was detected only in the extracellular medium of raw 264.7 cells and not in cultured neurons at any developmental stage (Figure S5P). Hence, IL-6 primarily engaged classical signaling in developing neurons.
To assess the contribution of STAT3 activation to glutamatergic synaptogenesis, we used Stattic, a drug that selectively prevents STAT3 phosphorylation (Schust et al., 2006). Cultured neurons were transiently exposed to IL-6 (Figure S6A) in the presence of vehicle or 1 μM Stattic, a concentration effective in blocking STAT3 phosphorylation (Figures 6A and 6B), without affecting neuronal survival (Figure S6B) or synaptic basal transmission (Figure S6C). Stattic occluded enhancement of mEPSC frequency (Figures 6C and 6D) and substantially prevented the increase in glutamatergic density (Figures 6E and 6F) induced by IL-6. Stattic also prevented the increase in glutamatergic transmission induced by chronic treatment with IL-6 (Figures S6D–S6F) without affecting the overall increase in the total amount of STAT3 protein (Figure S6G), indicating that IL-6-mediated upregulation of the transcription factor is not self-sustained by STAT3. Moreover, IL-6 did not change expression of a panel of pre- and postsynaptic proteins or expression of the transcription factor nuclear factor κB (NF-κβ), involved in many immune-dependent processes (Figure S6H). Finally, the transcription factor STAT3 is only induced transiently by IL-6 because transient application of IL-6 at early stages of development did not result in sustained upregulation of STAT3 protein at later stages (Figure S6I).
Figure 6.

STAT3 genomic activity is causally linked to the IL-6-dependent increase in glutamatergic synapses
(A) Western blot analysis of STAT3 phosphorylation in cultured neurons at 6 DIV treated acutely (30 min) with IL-6 in the absence or presence of Stattic (1 μM).
(B) Quantification of STAT3 phosphorylation normalized to total STAT3 protein amount. Ctrl, n = 3; IL-6, n = 3; 3 independent experiments; one-sample t test; ∗p = 0.019.
(C and D) Electrophysiological traces (C) and quantitative analysis (D) of mEPSC frequency and amplitude in cultured neurons at 14 DIV under ctrl conditions and upon application of IL-6 (see scheme in Figure S6A) in the presence of vehicle or 1 μM Stattic. Ctrl, n = 33 cells; IL-6, n = 30 cells; IL-6, Stattic, n = 19 cells; 3 independent experiments; one-way ANOVA followed by Tukey’s multiple comparisons test; ∗∗∗∗p = 0.000004, ∗∗p = 0.006.
(E) Immunofluorescence analysis of glutamatergic synaptic density through antibodies against presynaptic (VGLUT1, blue) and postsynaptic (PSD-95, red) markers along dendritic branches (beta III tubulin, red). Scale bar, 10 μm.
(F) Quantitative analysis of colocalizing punctum density under the different conditions. Three independent experiments; dendrites analyzed: Ctrl, n = 117; IL-6, n = 130; IL-6 + Stattic, n = 88; one-way ANOVA on ranks followed by Turkey’s multiple comparisons test).
(G) Representative images of hippocampal neurons expressing GFP together with myc alone (top panels), myc-flagged STAT3-phosphomutant Y705E (center panels), and myc-flagged STAT3-phosphomutant Y705F (bottom panels). Neurons were stained with antibodies against myc (red) and with PSD-95 (blue) to evaluate the density of postsynaptic puncta along the GFP-expressing (green) dendritic branches. High-magnification images are shown on the right; arrows indicate PSD-95-positive puncta. Scale bars: left panel, 20 μm; right panel, 10 μm.
(H) Quantitative analysis of PSD-95-positive punctum density and size under the three different conditions with respect to ctrl conditions. Three independent experiments; dendrites: Y705E = 33; Y705F = 30; Myc = 35; one-way ANOVA on ranks followed by Turkey’s multiple comparisons test; Myc-T705E, ∗p = 0.034; Myc-T705F, ∗p = 0.018.
(I) STAT3 luciferase reporter assay performed in cultured neurons stimulated with IL-6 for 48 h alone and in the presence of galiellalactone (1 and 4 μM). Five independent experiments; one-sample t test; IL-6, ∗p = 0.0353; IL-6 + galiellalactone (Gall; 1 μM), ∗p = 0.0122.
(J and K) Representative electrophysiological traces (J) and quantitative analysis (K) of mEPSC frequency and amplitude in cultured neurons at 14 DIV under ctrl conditions and upon application of IL-6 with vehicle or Gall (Figure S7D). Cells: ctrl, n = 30; IL-6, n = 20; IL-6, Gall (1 μM), n = 13; IL-6, Gall (4 μM), n = 20; 3 independent experiments; one-way ANOVA on ranks followed by Dunn’s multiple comparisons test; ctrl versus IL-6, ∗∗∗∗p = 1.01 × 10⁻⁷; ctrl versus IL-6 + Gall (1 μM), ∗∗∗p = 3.53 × 10⁻⁴; IL-6 versus IL-6 + Gall (4 μM), ∗∗∗∗p = 6.56 × 10⁻⁶; IL-6 + Gall (1 μM) versus IL-6 + Gall (4 μM), ∗∗p = 0.0027.
See also Figures S6 and S7.
To demonstrate that STAT3 activation per se is sufficient to increase glutamatergic synapses in a neuron-autonomous fashion, we took advantage of two STAT3 mutant forms: the mutant Y705F, mimicking a constitutively unphosphorylated state of the protein (inactive form), and the mutant Y705E, mimicking a constitutively phosphorylated state (active form). Both STAT3 phospho mutants were translated as fusion proteins bearing a Myc tag, and the synaptic analysis was performed in sparse transfected neurons expressing the fusion proteins (Figure 6G). Analysis of PSD-95-positive punctum density in transfected neurons showed that Y705E, but not Y705F, significantly increases PSD-95 density (Figure 6H). Thus, transient activation of STAT3 in neurons is required for the IL-6 effect on glutamatergic synapses.
IL-6 promotes glutamatergic synaptogenesis through a STAT3-dependent genomic effect involving RGS4 activity
Recent evidence has shown cytoplasmic effects of STAT3 in neurons (Nicolas et al., 2012); hence, to exclude possible non-genomic mechanisms, the fungal metabolite galiellalactone, a selective STAT3 inhibitor able to prevent STAT3 binding to DNA (Weidler et al., 2000), was employed. 4 μM galiellalactone was sufficient to block STAT3 genomic activity (Figure 6I) without affecting neuronal survival (Figure S7A), IL-6-dependent STAT3 phosphorylation (Figure S7B), or basal synaptic transmission (Figure S7C). 4 μM galiellalactone (Figure S7D) was able to block the increase in mEPSC frequency induced by IL-6 (Figures 6J and 6K), demonstrating that the pro-synaptogenic effect of IL-6 required STAT3 genomic activity.
To identify the molecular pathways involved in IL-6-induced glutamatergic synaptogenesis, we investigated the overall transcriptional rearrangement induced by IL-6 through STAT3 activation by 10X single-cell transcriptomics. We assessed genome-wide expression profiling of 3,687 single cells isolated from cultured hippocampal neurons under ctrl conditions or upon IL-6 application (ctrl, 1,865; IL-6, 1,822) at 5 DIV (Figure S7E). The median number of genes detected per cell was 5,229 for IL-6 and 4,714 for ctrl, and the median number of transcripts (unique molecular identifiers [UMIs]) per cell was 22,011 and 17,572, respectively. Unsupervised clustering analysis identified eight distinct populations according to their gene transcriptional profiles (Figures 7A and 7C). In agreement with in vivo data, the clusters were represented under the two experimental conditions and overlapped substantially (Figure 7B), suggesting that changes in transcriptional profiling within each single cluster, rather than modifications of the distinct cell identities, occurred upon IL-6 treatment.
Figure 7.

Rgs4 is upregulated in specific neuronal clusters upon IL-6 treatment and is required to increase glutamatergic synaptogenesis
(A) UMAP of all detected single cells. Each point represents a single cell, colored according to cluster designation. n = 3,687 individual cells. Clusters are labeled according to cell enrichment assessed by the AUCell R Bioconductor package (Figure S7E).
(B) UMAP of all detected single cells, colored according to experimental condition. Black points, ctrl cells; red points, IL-6-treated cells.
(C) Dot plot showing average gene expression of selected markers used for cluster annotation.
(D) Feature plot showing Stat3 gene expression split by treatment. Left panel: ctrl cells; right panel, IL-6-treated cells.
(E) Top: expression distribution (violin plots) showing log-transformed, normalized expression of the Stat3 gene in all clusters grouped by cell type and colored according to experimental condition. Black points, ctrl cells; red points, IL-6-treated cells. ∗p ≤ 0.05, Wilcoxon rank-sum test. Bottom: table showing Pearson r correlation values of genes correlated significantly with Stat3 gene expression level in c0 and c3 of IL-6-treated cells and modulated significantly after IL-6 treatment in c0 and c3.
(F) Feature plots showing Rgs4 gene expression split by treatment. Left panel: ctrl cells; right panel, IL-6-treated cells.
(G) Expression distribution (violin plots) showing log-transformed, normalized expression of the Rgs4 gene in all clusters grouped by cell type and colored according to experimental condition. Black points, ctrl cells; red points, IL-6-treated cells; ∗p ≤ 0.05; Wilcoxon rank-sum test.
(H) qPCR analysis of Rgs4 mRNA transcripts in cultured neurons at 6 DIV upon short IL-6 treatment (see scheme in Figure 4A) with and without 4 μM Gall, normalized to GAPDH expression. Four independent experiments, one-sample t test, ∗p = 0.0389).
(I) Schematic workflow: N2A cell lines were co-transfected with plasmids coding for the STAT3 phosphomutants Y705E and Y705F together with GFP. After 24 h, GFP+ cells were subjected to fluorescence-activated cell sorting (FACS) and assessed for RGS4 expression through qPCR analysis.
(J) Quantitative analysis of Rgs4 mRNA transcripts normalized to GAPDH expression under the indicated conditions. Four independent experiments, one-sample t test, ∗p = 0.0411.
(K) Representative traces of mEPSCs recorded in cultured neurons at 14 DIV under ctrl conditions and upon application of IL-6 (see scheme in Figure S7H) in the presence or absence of the RGS4 inhibitor CCG-63802.
(L) Quantitative analysis of mEPSC frequency and amplitude under the indicated conditions. Cells: ctrl, n = 23; IL-6, n = 20; IL-6, CCG-63802 (CCG), n = 25; CCG n = 15; 3 independent experiments; one-way ANOVA on ranks followed by Dunn’s multiple comparisons test; ∗∗p = 0.0046, ∗p = 0.0391, ∗∗∗p = 0.0008.
(M) Experimental procedure used for the Maternal Immune Activation (MIA) model: a single pulse of vehicle (saline, as a ctrl), IL-6 (5 μg), or poly(I:C) (at 2 or 20 mg/kg) was injected i.p. into pregnant mothers at GD15, and the Hp of embryos was analyzed 24 h after injection through qPCR analysis.
(N) Quantitative analysis of Stat3 and Rgs4 expression normalized to the total amount of Gapdh transcript in the Hp of embryos under the indicated conditions. Stat3: vehicle, n = 9 embryos; IL-6, n = 16 embryos; poly(I:C), 2 mg, n = 6 embryos; poly(I:C), 20 mg, n = 16 embryos; 2 independent experiments. Rgs4: vehicle, n = 13 embryos; IL-6, n = 19 embryos; poly(I:C), 2 mg, n = 9 embryos; poly(I:C), 20 mg, n = 19 embryos; 3 independent experiments; one-way ANOVA on ranks followed by Dunn’s multiple comparisons test. Stat3 analysis: vehicle-IL-6, ∗∗∗∗p = 0.00009; vehicle-poly(I:C), 20 mg, ∗p = 0.03826; vehicle-poly(I:C), 2 mg, ∗p = 0.01247. Rgs4 analysis: ∗p = 0.0238, ∗∗p = 0.0073.
(O) Experimental procedure: a single pulse of vehicle (saline, as a ctrl) or IL-6 (5 μg) was injected i.p. into pregnant mothers at GD15, and the Hp or cortex of pups was analyzed on P6 through qPCR analysis.
(P) Quantitative analysis of Stat3 and Rgs4 expression normalized to the total amount of Gapdh transcript in the Hp of embryos under the indicated conditions. Stat3 mRNA level: Hp (vehicle, n = 16 mice, Three independent experiments (3 litters); IL-6, n = 11 mice, N = 2 litters), cortex (vehicle, n = 14 mice, N = 3 litters; IL-6, n = 13 mice, N = 3 litters). Rgs4 transcripts: Hp (vehicle, n = 16 mice, Three independent experiments (3 litters); IL-6, n = 11 mice, N = 2 litters), cortex (vehicle, n = 15 mice, N = 3 litters; IL-6, n = 14 mice, N = 3 litters); Student’s t test. Stat3 analysis: ∗∗∗∗p = 0.00005, ∗p = 0.03. RGS4 analysis: ∗p = 0.0201.
See also Figure S7.
We systematically classified the cells by comparing their transcriptional profiles with the newly identified neuronal and non-neuronal markers from single-cell analysis performed in the developing hippocampus (Figure 2; Table S1) and by pre-existing signature gene sets of endogenous neuronal and glial types (Cahoy et al., 2008; Cembrowski et al., 2016; Harris et al., 2018; Lein et al., 2007) (see STAR Methods for details). We defined eight main transcriptionally distinct cell types reflecting the diversity of neuronal and non-neuronal classes found in the hippocampus (Cembrowski et al., 2016; Pelkey et al., 2017).
Based on this enrichment analysis, we found that two of the eight clusters belonged to the astrocyte lineage (cluster 1 [c1] and c2), expressing glial specific marker genes, including Gfap and Aqp4, with one of them showing markers of cycling cells (c2) (Figure S7F; Table S3). c0, c3, c4, c5, c6, and c7 displayed enrichment of neuron-specific genes, among others Map2, Grin2b, and Syt4, expressed in hippocampal neurons. Among them, c0 and c3 expressed specific markers for CA pyramidal neurons (Opcml and Crym), and c4 and c5 showed enriched expression for DG neuronal markers (e.g., Prox1, Calb2, and Sema3c) (Figure S7F) and c7 for CR neurons. Only one cluster could be clearly ascribed to the GABAergic lineage (c6), expressing prototypical markers of GABAergic neurons, including Gad2, Erbb4, and Lhx6 (Figures 7A and 7C; Figure S7F; Table S3; Mancinelli and Lodato, 2018). In terms of relative abundance of distinct cellular populations, the single-cell sequencing data also provided evidence that our in vitro culture system supports development of the different classes, while, at large, respecting the ratio of excitatory and inhibitory neurons and glial cells, which is appropriate for the developmental stage of the analysis (Lodato and Arlotta, 2015; Mancinelli and Lodato, 2018; Pelkey et al., 2017)
To further investigate the transcriptional changes induced by transient IL-6 application, we performed differential expression analysis between IL-6-stimulated and ctrl conditions. We identified 63 DEGs (adjusted p value cut-off of 0.05 and a log-fold changes (logfc) threshold of 0.20), with 55 upregulated and 8 downregulated upon IL-6 treatment (Table S4). As expected, Stat3 gene expression was upregulated significantly (p ≤ 0.05), but only in the CA-ExN clusters (c0 and c3), indicating predominant involvement of CA pyramidal neurons upon IL-6 stimulation. IL-6-mediated Stat3 expression was not subjected to any significant modifications in DG-ExN, astrocyte, or GABAergic clusters (Figures 7D and 7E).
To identify possible Stat3 co-regulated genes, we combined an unbiased correlation analysis within neuronal clusters where Stat3 was upregulated significantly (c0 and c3) with a differential analysis between IL-6-stimulated cultures and ctrls. Only four genes showed significant correlation with Stat3 expression upon IL-6 treatment (Figure 7E, bottom). Among them, the highest correlation (positive) was found between Stat3 and Rgs4 (Pearson r correlation value = 0.31), indicating that, in clusters where Stat3 was upregulated, Rgs4 expression was increased concomitantly (Figures 7F and 7G), ranking at the top of significantly correlated genes. This gene was highly enriched in neuronal clusters (Figure 7G). Furthermore, when we analyzed the promoter region of Rgs4 using bioinformatics tools for transcription factor binding sites prediction (Khan et al., 2018; Sandelin et al., 2004), we found distinct putative sites containing Stat3 response elements predicted with a relative profile score threshold of 80% (Figure S7G). These results suggest that Rgs4 could be a downstream target gene of STAT3 upon IL-6 stimulation.
The data obtained through the single-cell sequencing approach were then validated through qPCR quantitation of Rgs4 mRNA transcripts in cultured neurons in which Rgs4 was upregulated significantly upon IL-6 treatment via STAT3 genomic activity (Figure 7H). Also, STAT3-dependent RGS4 transcriptional elevation occurred in a cell-autonomous fashion because the only expression of the active form of STAT3 enhances RGS4 mRNA expression in N2A cell lines (Figure 7I-J).
To provide a causal link between RGS4 upregulation and the IL-6-mediated increase in glutamatergic synapses, neuronal cultures treated with IL-6 were incubated with the recently identified small molecule CCG-63802, a selective RGS4 inhibitor (Blazer et al., 2010; Figure S7H), at a dose not toxic to hippocampal neurons (Figure S7I). Inhibition of RGS4 prevented the IL-6-dependent enhancement of glutamatergic transmission at 14 DIV (Figures 7K and 7L), demonstrating that STAT3 -dependent RGS4 elevation is required for the increase of glutamatergic synaptic contacts induced by IL-6.
To investigate whether STAT3 and RGS4 are engaged in in vivo models of prenatal inflammation, pregnant mice were injected i.p. on GD15 with IL-6 or polyinosinic:polycytidylic acid (poly(I:C)) (Figure 7M), a synthetic analog of viral double-stranded RNA, a well-established model of maternal immune activation (Choi et al., 2016; Corradini et al., 2018; Hsiao and Patterson, 2011; Shin Yim et al., 2017; Smith et al., 2007). Poly(I:C) was used at 2 mg/kg or 20 mg/kg, and expression of STAT3 and RGS4 mRNA was evaluated 24 h after injection in embryonic hippocampi (Figure 7M). Similar to IL-6 injection, poly(I:C), applied at 20 mg/kg, promoted upregulation of STAT3 and RGS4 (Figure 7N). Also, higher transcriptional amounts of the two genes were detected in mice exposed prenatally to IL-6 at the postnatal stage (P6) (Figures 7O and 7P).
Discussion
Synapse formation is a key step in the brain developmental program. Environmental stressors acting at early stages—among all inflammatory conditions—may have long-term effects on physiological trajectories affecting brain connectivity and behavior in adulthood (Boulanger, 2009; Deverman and Patterson, 2009). Maternal inflammation, usually occurring as a transient phenomenon (Benedusi et al., 2015; Garetto et al., 2016; Kallikourdis, 2018; Munoz-Suano et al., 2012), has a long-range effect on brain development and is recognized as risk factor for neurodevelopmental diseases such as autism and schizophrenia (Boulanger-Bertolus et al., 2018; Estes and McAllister, 2016; Knuesel et al., 2014). However, the molecular underpinnings are still unknown. Here we show that transient elevation of IL-6 during prenatal development is sufficient to exert a long-lasting effect on glutamatergic synaptogenesis, resulting in excessive density of excitatory inputs and enhanced synaptic basal transmission. Although IL-6 elevation in models of prenatal immune activation engages different immune molecules (Choi et al., 2016; Shin Yim et al., 2017) through involvement of the maternal gut microbiota (Kim et al., 2017), leading to brain developmental defects (Choi et al., 2016; Shin Yim et al., 2017), here we show that direct injection of IL-6 into embryonic ventricles on E15 phenocopied the increases in glutamatergic synapses produced by IL-6 in dams. Hence, besides engaging immune-related molecules in the mother, IL-6 can affect synapse formation directly in the embryonic brain, even in view of its capacity to cross the placenta barrier and reach the fetus (Dahlgren et al., 2006; Lim et al., 2021). The pro-synaptogenic effect is highly specific for IL-6.
The ability of IL-6 to enhance glutamatergic synapses in the offspring relies on early activation of specific biological processes linked to synaptogenesis in selected embryonic cell clusters identified as glutamatergic neurons. Different from non-neuronal cells and inhibitory neuron clusters, these glutamatergic clusters are abundant at this developmental stage and display the highest number of deregulated genes upon IL-6 treatment in vivo, likely being the main target for IL-6. The enhanced glutamatergic transmission is also detectable when neurons are isolated from the embryonic brain and grown in vitro, indicating that prenatal IL-6 increases the intrinsic capacity of glutamatergic neurons to form excitatory synapses. Besides activating key processes related to synaptogenesis, prenatal IL-6 resulted in modulation of pathways associated with energetic metabolism, suggesting acceleration of the metabolic reprogramming that normally occurs in immature postmitotic neurons during differentiation (Agostini et al., 2016; Zheng et al., 2016).
The increased number of excitatory but not inhibitory contacts in the offspring produced by prenatal IL-6 elevation is indicative of an E/I imbalance, a pathological hallmark of neurodevelopmental disorders (Lisman, 2012; Nelson and Valakh, 2015; O’Donnell et al., 2017; Sohal and Rubenstein, 2019) associated with altered brain functional connectivity (Ajram et al., 2017; Filipello et al., 2018; Pagani et al., 2019; Zhou et al., 2019). Similarly, genetic models of neurodevelopmental disorders display abnormal glutamatergic connections and altered brain connectivity (Xiong et al., 2012; Zaslavsky et al., 2019). Accordingly, we found an overall hyperconnectivity in the brain of adult mice exposed prenatally to IL-6, with particular involvement of the hippocampal regions. Although the cellular processes that are the basis of these alterations are totally unknown, it has been proposed that abnormal excitatory inputs in neural circuits contribute to aberrations in global brain connectivity (Deco et al., 2014; Markicevic et al., 2020). In our model, the highest glutamatergic connections were observed in the hippocampus and cortex, although the effect on the hippocampus was more pronounced. Cell-type-specific STAT3-dependent gene programs, region-specific onset of synaptogenesis, and cell-type-specific expression of IL-6R (Gadient and Otten, 1994) may be the basis of these differences.
Studies in humans have highlighted a clear link between prenatal inflammation and functional brain connectivity in the offspring (Iidaka et al., 2019; Supekar et al., 2013). Moreover, specific brain connectivity patterns in children reflected maternal elevation of IL-6 (Rudolph et al., 2018; Spann et al., 2018). Our findings provide a mechanistic framework for the detrimental effects induced by inflammation during pregnancy, with important implications for the clinical setting. For instance, in the “cytokines storm” induced by severe acute respiratory syndrome coronavirus 2 (SARS-CoV-2), the etiological agent of coronavirus disease 2019 (COVID-19), IL-6 is the major pro-inflammatory cytokine (Moore and June, 2020; Zhou et al., 2020) secreted by immune cells (Hunter and Jones, 2015; Jones and Hunter, 2021; Velazquez-Salinas et al., 2019). Although data so far did not highlight severe complications in pregnant women with SARS-CoV-2 (Wastnedge et al., 2021), our evidence prompts the need for long-term neurodevelopmental follow-up of newborns from women affected by SARS-CoV-2, especially in the case of infections occurring around the third trimester of gestation, when synaptogenesis starts in human embryos (Huttenlocher and Dabholkar, 1997).
IL-6 exerts its pro-synaptogenic effect by acting on the IL-6 receptor, which is expressed in the brain (Aniszewska et al., 2015; Gadient and Otten, 1993, 1996; Rothaug et al., 2016) and in hippocampal neurons (Gadient and Otten, 1994; Sawada et al., 1993; Vereyken et al., 2007). We found that IL-6R and gp130 are expressed steadily in neurons at early stages of development and undergo significant downregulation later on, providing a possible explanation for the selective pro-synaptogenic role of IL-6 in developing but not mature neurons. We also showed that developing neurons do not produce sIL-6R and are insensitive to sgp130 when challenged with IL-6, indicating that, at early stages of development, the IL-6 classical signaling mechanism is predominant. Previous findings in the mature brain indicated trans-signaling as the main mechanism of the pathological role of IL-6 (Campbell et al., 2014; Kraakman et al., 2015; Timper et al., 2017; Willis et al., 2020), suggesting that the two pathways might be engaged in a development-dependent fashion. The two receptors were detectable in vivo in the hippocampus and cortex at different prenatal stages, in line with other studies performed in rodent and human embryos (Barnabé-Heider et al., 2005; Dame and Juul, 2000; Gallagher et al., 2013). Downregulation of gp130 was also observed in the hippocampus and cortex at P0, pointing to prenatal stages as the most vulnerable period, when neurons may be particularly sensitive to IL-6.
The long-lasting effect produced by IL-6 on glutamatergic synaptogenesis results from a transcriptional mechanism associated with a genomic rearrangement, in which the transcription factor STAT3 plays a central role. Although already studied in many different cellular contexts, including in the immune system (Jiang et al., 2014; Maritano et al., 2004), cancer (Yu et al., 2009), neuronal progenitors (Gallagher et al., 2013), and mature neurons (Fang et al., 2013; Leibinger et al., 2013a; Murase et al., 2012; Nicolas et al., 2012; Park et al., 2012), a direct role of STAT3 in synapse formation has never been demonstrated. We showed that STAT3 is activated transiently upon IL-6 elevation in neurons, and its genomic effect is causally linked with the increase in glutamatergic synapses, probably through transitory upregulation of synapse-specific genes at early developmental stages. STAT3 activation in vitro occurred in two specific bona fide glutamatergic cell clusters, distinct from GABAergic and non-neuronal clusters, which likely explains the selective action of the cytokine on ExNs.
We identified RGS4 as a STAT3 downstream neuronal gene responsible for the increase in excitatory synapses through single-cell transcriptomics. RGS4 belongs to a gene family involved in regulation of G-coupled receptor-associated signaling (Bansal et al., 2007; Berman et al., 1996a, 1996b; Hepler et al., 1997). RGS4 is the most abundant isoform in the CNS is expressed highly in the prefrontal cortex, hippocampus, thalamus and striatum (Ni et al., 1999; Nomoto et al., 1997), and is enriched mainly in neurons, along proximal apical dendrites, and at presynaptic terminals (Paspalas et al., 2009). Accordingly, our single-cell analysis revealed high RGS4 expression in neuronal clusters, specifically in those where STAT3 was upregulated.
Although RGS4 is known to modulate multiple aspects of neuronal physiology, including synaptic transmission and plasticity in mature neurons (Gerber et al., 2016), few studies have investigated its possible involvement in neuronal development (Cheng et al., 2013; Pallaki et al., 2017). We provided evidence that RGS4 expression is dependent on STAT3 genomic activity and that its activation is crucial for IL-6-mediated enhancement of excitatory synapses. Given the importance of G-protein signaling in neuronal development (Munno et al., 2003; Shelly et al., 2010), we propose RGS4 as an additional player in the process of glutamatergic synaptogenesis, when its early upregulation might modulate G-protein-dependent intracellular signaling, affecting the intrinsic capacity of neurons to form excitatory synapses. In line with this hypothesis, a recent study highlighted a prominent role of G-protein-coupled receptor signaling in hippocampal synaptogenesis (Sando and Südhof, 2021). RGS4 gene polymorphisms (Chowdari et al., 2002; Shirts and Nimgaonkar, 2004; Talkowski et al., 2006) and alterations of the protein amount (Dean et al., 2009; Erdely et al., 2006; Schwarz, 2018) have been detected in individuals affected by schizophrenia, (Levitt et al., 2006). Also, allelic variation of the rgs4 gene is associated with altered functional and structural brain connectivity in humans (Buckholtz et al., 2007). It is now established that autism and schizophrenia are neurodevelopmental pathological conditions characterized by aberrant synaptic connectivity (Frankle et al., 2003; Glausier and Lewis, 2013; Konopaske et al., 2014; Penzes et al., 2011; Zuccaro et al., 2021). Given the importance of maternal immune activation as a risk factor for neurodevelopmental disorders (Bauman et al., 2014; Estes and McAllister, 2016; Giovanoli et al., 2016; Lipina et al., 2013; Malkova et al., 2012; Missault et al., 2014), upregulation of STAT3 and RGS4 indicates critical involvement of these two genes in inducing long-term consequences for synaptic density and brain connectivity in prenatal inflammatory conditions. Given the current lack of pharmacological tools for prevention of neurodevelopment disorders, these results represent a promising perspective in identification of druggable pathways for early interventional strategies.
Limitation of the study
Our data point to a direct role of IL-6 in neurons, specifically occurring at stages shortly preceding synaptogenesis. The effects of IL-6 are reproduced in pure neuronal cultures and even in neurons established from brains on E15, a stage far preceding onset of gliogenesis. Despite this evidence being well supported using the in vitro system, other cell types being involved in vivo cannot be completely ruled out. Prenatal IL-6 elevation in embryos genetically devoid of IL-6R expression in distinct cell types would be a valuable strategy to address this issue. A second limitation relies on the causal role of STAT3 and RGS4 and altered synaptogenesis in maternal immune activation models, which was not fully addressed in this study. Ablation of STAT3 in vivo leads to embryonic lethality (Takeda et al., 1997); hence, interference with the activity of this transcriptional factor in vivo (especially at early stages of development) might lead to neuronal damage, making it difficult to clarify the precise contribution of STAT3 to the IL-6-mediated effect.
STAR★Methods
Key resources table
| REAGENT or RESOURCE | SOURCE | IDENTIFIER |
|---|---|---|
| Antibodies | ||
| Mouse monoclonal anti-STAT3 (124H6) | Cell Signaling Technology | Cat# 9139; RRID AB_331757 |
| Rabbit monoclonal anti- Phospho-Stat3 (Tyr705) (D3A7) | Cell Signaling Technology | Cat# 9145; RRID AB_2491009 |
| Rabbit monoclonal anti- Phospho-Stat3 (Ser727) Antibody | Cell Signaling Technology | Cat# 9134; RRID AB_331589 |
| Rabbit polyclonal anti-GAPDH | Synaptic System | Cat# 247-002; RRID AB_10804053 |
| Mouse monoclonal anti-Post Synaptic Density Protein 95 Antibody, clone 6G6-1C9 | Merk-Millipore | Cat# MAB1596; RRID AB_2092365 |
| Guinea Pig polyclonal anti- vGlut-1 | Synaptic System | Cat# 135-304; RRID AB_887878 |
| Rabbit polyclonal anti- Shank 2 | Synaptic System | Cat# 162-202; RRID AB_2619860 |
| Rabbit polyclonal anti- NFκB p65 (C-20) | Santa Cruz Biotechnology | Cat# sc-372; RRID AB_632037 |
| Rabbit polyclonal anti- NeuroD2 | Abcam | Cat# ab104430; RRID AB_10975628 |
| Rabbit polyclonal anti- Satb2 | Abcam | Cat# ab34735; RRID AB_2301417 |
| Mouse monoclonal anti- Glial Fibrillary Acidic Protein (GFAP) antibody | Merk-Millipore | Cat# G3893; RRID AB_477010 |
| Rabbit polyclonal anti- vGAT | Synaptic System | Cat# 131-003; RRID AB_887869 |
| Guinea Pig polyclonal anti-NeuN | Synaptic System | Cat# 266 004; RRID AB_2619988 |
| rabbit anti-IBA-1 | FUJIFILM Wako Chemicals U.S.A. Corp | Cat#01919741; RRID AB_839504 |
| Mouse monoclonal anti-βIII Tubulin (Clone 5G8) | Promega | Cat# G7121; RRID AB_430874 |
| Rabbit monoclonal anti- Jak2 (D2E12) XP® | Cell Signaling Technology | Cat# 3230; RRID AB_2128522 |
| Rabbit polyclonal anti-alphaTubulin | Sigma Aldrich | Cat# T3526; RRID AB_261659 |
| Goat anti-Mouse IgG (H+L) Secondary Antibody, HRP | ThermoFisher | Cat# 31430; RRID AB_228307 |
| Goat anti-Rabbit IgG (H+L) Secondary Antibody, HRP | ThermoFisher | Cat# 31460; RRID AB_228341 |
| Goat anti-Mouse IgG, IgM (H+L) Highly Cross-Adsorbed Secondary Antibody, Alexa Fluor 488 | ThermoFisher | Cat# A-11029; RRID AB_2534088 |
| Goat anti-Rabbit IgG (H+L) Highly Cross-Adsorbed Secondary Antibody, Alexa Fluor 488 | ThermoFisher | Cat# A-11034; RRID AB_2576217 |
| Goat anti-Rabbit IgG (H+L) Highly Cross-Adsorbed Secondary Antibody, Alexa Fluor 555 | ThermoFisher | Cat# A-21429; RRID AB_2535850 |
| Goat anti-Mouse IgG (H+L) Highly Cross-Adsorbed Secondary Antibody, Alexa Fluor 555 | ThermoFisher | Cat# A-21424; RRID AB_141780 |
| Goat anti-Guinea Pig IgG (H+L) Highly Cross-Adsorbed Secondary Antibody, Alexa Fluor 633 | ThermoFisher | Cat# A-21105; RRID AB_2535757 |
| Chemicals, peptides, and recombinant proteins | ||
| Recombinant Murine Interleukin 6 | Peprotech | Cat# 216-16 |
| Stattic | Tocris | Cat# 2798 |
| Galiellalactone | Bioaustralis | Cat# BIA-G1032 |
| Polyinosinic:polycytidylic acid (Poly(I:C)) | Sigma Aldrich | Cat# 117M4005V |
| CCG-63802 | Sigma Aldrich | Cat#SML0016 |
| Tetrodotoxin | Tocris | Cat#1078 |
| Bicuculline | Tocris | Cat#0109/10 |
| CNQX | Tocris | Cat# 1045/1 |
| D-AP5 | Tocris | Cat# 0106/1 |
| Critical commercial assays | ||
| Cignal Lenti STAT3 reporter Kit | QIAGEN | Cat# CLS-6028L |
| Deposited data | ||
| Raw and analyzed scRNA-seq data | This Paper | GEO:GSE180345 |
| Raw data from Figures 1,5 and Supplementary Figure 1,2,4,5,6 and 7 | This Paper | Mendeley Data https://doi.org/10.17632/5vpsd5d9zw.1 |
| Experimental models: Cell lines | ||
| N2A | ATCC | Cat# CCL-131; RRID CVCL_0470 |
| Experimental models: organisms/strains | ||
| Mouse C56BL/6N | Charles River | Strain Code 027 |
| Mouse CD1 | Charles River | Strain Code 022 |
| Recombinant DNA | ||
| pCDNA 3.1 EGFP | Valeria Poli’s lab (Unito, Italy) | N/A |
| pCDNA 3.1 myc 768-STAT3 Y795E | Valeria Poli’s lab (Unito, Italy) | N/A |
| pCDNA 3.1 myc 768-STAT3 Y705F | Valeria Poli’s lab (Unito, Italy) | N/A |
| pCAG-PSD95.FingR-eGFP-CCR5TC | Addgene | Cat#46295; RRID Addgene_4629 |
| Software and algorithms | ||
| GraphPad Prism 7 | GraphPad Software | https://www.graphpad.com; RRID:SCR_002798 |
| ImageJ | NIH | https://imagej.nih.gov/ij/index.html; RRID:SCR_003070 |
| Adobe Photoshop CC17 | Adobe | https://www.adobe.com/; RRID:SCR_014199 |
| R package edgeR | N/A | https://bioconductor.org/packages/release/bioc/html/edgeR.html; RRID:SCR_012802 |
| R software (version 3.4.0) | R Foundation for Statistical Computing | https://www.r-project.org/ |
| Mini Analysis Program | Synaptosoft Inc. | Version 6.0.3 |
Resource availability
Lead contact
Further information and requests for resources and reagents should be directed to and will be fulfilled by the lead contact, Davide Pozzi (davide.pozzi@humanitasresearch.it).
Materials availability
This study did not generate new unique reagents
Experimental model and subject details
Mice
All experiments were performed using mice C57BL/6N (Charles River Laboratories) according to the guidelines established by the European Community Council (Directive 2010/63/EU of September 22nd,2010) and were approved by the Institutional Animal Care and Use Committee (IACUC, permission number 467 and 565) of the Humanitas Research Hospital and by the Italian Ministry of Health. Mice were housed in a Specific Pathogen Free (SPF) facility under constant temperature (22 ± 1°C) and humidity (50%) conditions with a 12 h light/dark cycle and were provided with food and water ad libitum. Pregnant females aged 3-6 months were used for experiments, and male embryos (E16-E18) and offspring (age P15-P60) were selected for ex-vivo and in-vivo analysis.
Primary cultures and cell lines
Primary hippocampal neurons were established from E18 C57BL/6 mice as previously described (Pozzi et al., 2013). Briefly, hippocampal regions were isolated from the brain in HBBS 1X (Hank’s Balanced Salt Solution) (Life technology), 1% Pen/Strep, 10mM HEPES) and, after trypsinization, they were dissociated and plated onto 24 mm-diameter round glass coverslips, previously coated with 0.1% Poly-L-Lysine (Sigma-Aldrich) in Borate buffer (50 mM Boric Acid, 15 mM Borax) pH 8.5. 80000 cells were seeded onto each coverslip. Cultures were grown in Neurobasal medium supplemented with 2% B27 and 1% Glutamax (Life Technology) at 37°C and 5% CO2. Neurons were transfected with Lipofectamine 2000 (Life Technology) at 5 days in vitro (DIV) according to the manufacturer’s protocol, at the same age neurons were infected.
Neuro2a (N2A; ATCC® CCL-131) Neuroblastoma cell line was used to perform FACS experiments. N2A cells were cultured in complete DMEM medium (Life Technology) supplemented with 10% FBS, 1% pen/strep; 1% Ultraglutamine (Life technologies) until reaching the sub-confluence and then seeded in 60mm-diameter round dishes at 5x10ˆ5 density.
Method details
IL-6 and Poly(I:C) injection in dams
At gestational day 15, pregnant mothers were intraperitoneally (IP) injected with either 5 μg of IL-6, polyinosinic:polycytidylic acid (Poly(I:C)) 2 or 20mg/kg. For the intraventricular injection, laparotomy was performed by injecting inject 1 ul of IL-6 at 10ng/μl directly into the embryos lateral ventricles using the Nanoject II Auto-Nanoliter Injector (Drummond, cat.# 3-000-204). Saline solution was used as a control of injection. Only male embryos and offspring were selected for the ex-vivo and in-vivo analysis.
In utero electroporation
The pCAG-tdTomato and pCAG-PSD95.FingR-eGFP-CCR5TC (Plasmid #46295) constructs were electroporated in vivo as described previously (Lodato et al., 2014). Briefly, 1 μL of purified plasmid DNA (1 μg/μl for pCAG-tdTomato and 0.8 μg/μl for pCAG-PSD95.FingR-eGFP-CCR5TC) were mixed with 0.005% fast green in sterile PBS and was injected in utero into the lateral ventricle of CD1 embryos at E14.5. Five 40-V pulses of 50 ms were delivered at 1 s intervals in an appropriate orientation across the embryonic head using 1-cm-diameter platinum electrodes placed outside the uterus, using a CUY21EDIT square wave electroporator (Nepa Gene). Twenty-four hours after the surgery, pregnant females were injected with 5 μg of IL-6 or vehicle (saline solution). Injected embryos were collected for perfusion and confocal imaging at P21.
Drugs and Reagents
According to the type of experiment, the following reagents have been used: IL-1β, TNFα, INFγ, IL-6 (Peprotech), Poly(I:C) (Sigma-Aldrich), Galiellalactone (BioAustralis), CCG-63802 (Sigma-Aldrich), Stattic, Bicuculline, 6-Cyano-7-nitroquinoxaline-2,3-dione (CNQX), Tetrodotoxin (TTX), D-2-amino-5-phosphonovalerate (APV) (Tocris Bioscience).
Calcium imaging
Calcium imaging experiments were performed as previously described (Bedogni et al., 2016; Pozzi et al., 2013). Cultured neurons were loaded with the calcium sensitive dye Oregon Green 488 BAPTA 1-AM (Molecular Probes) for 1 h at 37°C in Neurobasal Medium and then imaged for calcium response. Electrical field stimulation was performed in KRH solution containing in mM: 125 NaCl; 5 KCl; 1,2 MgSO4; 1,2 KH2PO4; 25 HEPES; 6 Glucose; 2 CaCl2; pH 7,4.in the presence of CNQX 20 μM, APV 50 μM and Bicuculline 20 μM using a stimulation chamber (Warner Instruments, Hamden, CT). Electrical-evoked calcium transients were induced with a stimulus train of 40 stimuli (duration 1 msec; amplitude 90 mA) at 20Hz as previously reported (Pozzi et al., 2013), using a train generation unit (Digitimer Ltd, DG2A) connected to a stimulus isolation unit (SIU-102; Warner Instruments, Hamden, CT). Recording chambers were placed on the stage of an IX-71 inverted microscope (Olympus, Hamburg, Germany) equipped with an EMCCD (electron-multiplying CCD) camera (Quantem 512x512, Photometrics). Illumination was obtained using a light-emitting diode LED (Cairn research, Optoled Lite), with a 20X objective. Regions of interest (ROIs) of about 15-pixel area were drawn on the cell cytoplasm of virtually all the cells in the recorded field. About 20 cells for each Field Of View (FOV) and 3 FOV for each conditions. Time-lapse recording of calcium dynamics was performed with an acquisition rate of 5 Hz for 600seconds and offline analyzed with MetaFluor software (Molecular Devices). Calcium responses were measure as ΔF (Fmax-F0) compared to the baseline (F0). All values were normalized to WT neurons at the same developmental stage within the same experiment. Cumulative data were then analyzed through Kolmogorov-Smirnov statistic to verify non-parametric distribution.
Electrophysiology
Ex vivo acute hippocampal slices
C57BL6 male mice at P15 were deeply anesthetized with isofluorane at 4% by inhalation and decapitated. Brains were removed and placed in ice-cold solution containing the following (in millimolar): 87 NaCl, 21 NaHCO3, 1.25 NaH2PO4, 7 MgCl2, 0.5 CaCl2, 2.5 KCl, 25 D-glucose, and 7 sucrose, equilibrated with 95% O2 and 5% CO2 (pH 7.4). Coronal slices (300 μm thick) were cut with a VT1000S vibratome (Leica Microsystems) from medial Prefrontal Cortex (PFC). Slices were incubated at room temperature for at least 1 h, in the same solution as above, before being transferred to the recording chamber. During experiments, slices were superfused at 2.0 mL/min with artificial cerebrospinal fluid (ACSF) containing the following (in millimolar): 135 NaCl, 21 NaHCO3, 0.6 CaCl2, 3 KCl, 1.25 NaH2PO4, 1.8 MgSO4, and 10 D-glucose, aerated with 95% O2 and 5% CO2 (pH 7.4). Cells were examined with a BX51WI upright microscope (Olympus) equipped with a water immersion differential interference contrast (DIC) objective and an infrared (IR) camera (XM10r Olympus). Neurons were voltage (or current) clamped with a Multiclamp 700B patch-clamp amplifier (Molecular Devices, Union City, CA) at room temperature. Low-resistance micropipettes (2-3 MΩ) were pulled from borosilicate. The cell capacitance and series resistance were always compensated. Experiments in which series resistance did not remain below 10 MΩ (typically 5–8 MΩ) were discarded. Input resistance was generally close to 100-200 MΩ. Signals were low-pass filtered at 2 kHz, sampled at 10kHz and analyzed with Digidata 1440A (Molecular Devices). Recordings were made from cortical layer V pyramidal neurons. Excitatory and inhibitory synaptic basal transmission were recorded at −70 mV and +10 mV respectively in the presence of 1 μM TTX, using the following pipette internal solution (in mM): 138 Cs-gluconate, 2 NaCl,10 HEPES, 4 EGTA, 0.3 Tris-GTP and 4 Mg-ATP (pH 7.2).
In vitro primary hippocampal neurons
Patch-clamp recordings were performed in an extracellular solution with the following composition (in mM): 130 NaCl, 5 KCl, 1.2 KH2PO4, 1.2 MgSO4, 2 CaCl2, 25 HEPES, and 6 Glucose, pH 7.4, with glass pipettes of 4-6 MΩ as recording electrodes. mEPSCs were recorded in the presence of bicucullin (20 μM), APV (50 μM) and tetrodotoxin (TTX; 1 mM) using the following internal solution (in mM): 135 K-gluconate, 5 KCl, 2 MgCl2, 10 HEPES, 1 EGTA, 2 ATP, 0.5 GTP, pH 7.4. mIPSCs were recorded in the presence of 6-cyano-7-nitroquinoxaline-2,3-dione (CNQX; 20 μM), (2R)-amino-5-phosphonovaleric acid (APV; 50 μM) and TTX (1 mM) using the following internal solution (in mM): 68 K-gluconate, 68 KCl, 2 MgSO4, 20 HEPES, 2 ATP, 0.5 GTP, pH 7.2. Both mEPSCs and mIPSCs were recorded at −70 mV as holding potential. Short term plasticity was evaluated through paired whole-cell recording as previously described (Liu et al., 2014; Maximov et al., 2007) using the following internal solution (in mM): 135 K-gluconate, 5 KCl, MgCl2, 10 HEPES, 1 EGTA, 2 ATP, 0.5 GTP, and 10 QX-314, pH 7.4. Presynaptic stimulation was achieved through a bipolar electrode (FHC, Concentric bipolar electrode Cat# CBAEC75) placed at 100-150 mm from the recorded neuron with 0,9 mA, 1 msec current injection through a stimulus isolation unit (SIU-102; Warner Instruments, Hamden, CT). Electrical signals were amplified by a Multiclamp 200 B (Axon instruments), filtered at 5 kHz, digitized at 20 kHz with a DIGIDATA 1440 and stored with pClamp 10 (Axon instruments). The resting potential was calculated at I = 0 in current clamp configuration, whereas input resistance was calculated in voltage clamp configuration by using the slope of the I/V relationship of the steady state current measured at different hyperpolarizing voltage steps (from −100 to −70 mV). Only cells with an access resistance < 20 MΩ were considered for the analysis of mEPSCs and mIPSCs, and < 10 MΩ for the analysis of short-term plasticity. Access resistance was continuously monitored during the experiment and those cells in which access resistance was changed of more than 10% were rejected. Cells with a leak current above 100 pA were excluded from the analysis. The analysis of both mEPSC and mIPSC were performed with Mini analysis (Synaptosoft Inc., Fort Lee, NJ, USA) whereas the analysis of short-term plasticity was performed with Clampfit (Axon instruments).
Biochemistry
For total protein extraction, samples were homogenized using the following lysis buffer composed by 1% sodium dodecyl sulfate (SDS), 10mM HEPES at pH 7.4 and 2 mM EGTA and protein concentration was estimated using Bicinchoninic Acid Assay (BCA) kit (Thermo Fischer Scientific) as 20μg. Proteins were loaded with 2x Loading Buffer (100 mM Tris-HCl at pH 6.8; 4% SDS; 20% Glycerol; 200 mM 2-Mercaptoethanol, 2 mg Bromophenol-Blue) and fractionated by SDS-PAGE, then transferred to a nitrocellulose membrane using a transfer apparatus according to the manufacturer’s protocols (Bio-Rad). Membranes were stained with the following primary antibodies: mouse anti-STAT3 (Cell Signaling, 1:1000), rabbit anti-STAT3 P-Tyrosine 705 (Cell Signaling, 1:1000), mouse anti-STAT3 P-Serine 727 (Cell Signaling, 1:1000), rabbit anti-GAPDH (Synaptic System, 1:4000), mouse anti-PSD95 (UC Davis/NIH NeuroMab Facility, CA; 1:1000), guinea pig anti-VGLUT1 (Synaptic System, 1:1000), rabbit anti-Shank2/3 (Synaptic System, 1:1000), mouse anti-GAP43 (Millipore, 1:1000), rabbit anti-NFKB (Cell Signaling; 1:1000), rabbit anti-SNAP25 (Synaptic System, 1:1000), mouse anti-p65 (Cell Signaling; 1:1000). Immunodetection was performed with Clarity Western ECL Substrate (Bio Rab) and analyzed through Chemidoc apparatus via ImageLab software (Bio-Rab).
Immunofluorescence analysis
Hippocampal slices
Mice at P15 and P30 were deeply anesthetized with chloral hydrate (4%; 1 ml/100 g body weight, i.p.) and transcardially perfused with 4% paraformaldehyde (PFA). Post-fixed brains were collected and immunohistochemistry was performed on 50 μm hippocampal coronal sections with specific primary antibodies followed by incubation with the secondary antibodies. The following primary antibodies were used: guinea pig anti-VGLUT1 (1:1500; Synaptic Systems); mouse anti-V-gat (Synaptic Systems, 1:1000), rabbit anti-IBA (WAKO, 1:200), mouse anti-GFAP (Sigma-Aldrich, 1:400), guinea pig anti-NeuN (Synaptic System, 1:500), mouse anti-SATB2 (AbCam,1:100), rabbit anti-NeuroD2 (AbCam, 1:1500). Embryos’ brains (EB) were collected at GD16, 24 hours post mother injection, and post-fixed with PFA 4% for 16 hours. EB were embedded in 4% Low-Melting Agarose and 40 μm-thick slices were cut. Brain slices underwent immunofluorescence staining against mouse anti-STAT3 (Cell Signaling, 1:1000). Secondary antibodies conjugated with Alexa 488, Alexa-555, or Alexa-633 fluorophores (Invitrogen) were used. All slices were counterstained with Hoechst-33342 (ThermoFisher) and mounted with Fluorsave (Calbiochem, San Diego, CA, USA).66z. Images were examined by means of a Zeiss LSM800 and Leica Sp8 confocal microscope. For hippocampal slices analysis, single plane images were acquired in the stratum radiatum of the CA1 subfield of the hippocampus using 40x oil immersion lens with an additional electronic zoom factor of up to 2. Voxel size is 0.05x0.05um and optical slice is 1um. VGLUT and Vgat area were calculated as the total area of the positive puncta within a selected Region Of Interest (ROI), normalized to the total area of the ROI. At least four regions were analyzed for each section and three sections were used for each animal. The analyzed regions of one animal were averaged and considered as single data point. For cortical slices analysis, multiple plane images were acquired in the first oblique dendrite of somatosensory cortex neurons using the 63x oil immersion lens with an additional electronic zoom factor of 2. Voxel size is 0.09x0.09x0.3um and optical slice is 0,9 μm. The parameters of acquisition (laser power, pinhole, gain, offset) were kept constant among groups.
Whole brain images were taken with DMi8 inverted light microscope equipped with ACS APO 10x dry objective (Leica Microsystems, Solms,Germany). Image analyses were performed using Bitplane Imaris 7.4 software (Bitplane AG, Zurich, Switzerland) and Fiji-ImageJ software (NIH,Bethesda, MD, USA).
Hippocampal and cortical microglia morphology was assessed through the semi-automatic method 3DMorph (York et al., 2018), a MATLAB-based software (Mathworks, Natick MA, USA) which enables a three dimensional morphological analysis of skeletonized microglia present in tissue. Images were examined by means of a Leica Sp8 confocal microscope using a 40X oil immersion lens, Voxel size is 0.28x0.28x0.7um and optical slice is 1,03 μm. The parameters of acquisition (laser power, pinhole, gain, offset) were kept constant among groups.
In vitro primary hippocampal neurons
Neuronal cultures were fixed in 4% PFA, 4% sucrose, 20 mM NaOH and 5 mM MgCl2 in PBS, pH 7.4, for 8 minutes at room temperature (RT). Cultures were permeabilized and non-specific binding sites of proteins blocked with Goat Serum Dilution Buffer (GSDB; 15% goat serum, 0.3% Triton X-100, 450 mM NaCl, 20 mM phosphate buffer, pH 7.4) for 30 minutes. The following primary antibodies were used: guinea pig anti-VGLUT1 (Synaptic Systems, 1:1000), mouse anti-PSD95 (UC Davis/NIH NeuroMab Facility, CA, 1:800), mouse anti-ßeta III Tubulin (Promega Corporation, 1:800), rabbit anti-tubulin (Sigma-Aldrich, 1:80), rabbit anti-MAP2 (Millipore, 1:1000), mouse anti STAT3 (Cell Signaling, 1:1000), GEPHYRIN (Synaptic System, 1:500); VGAT (Synaptic System, 1: 500). Secondary antibodies conjugated with Alexa 488, Alexa-555, or Alexa-633 fluorophores (Invitrogen) were used. Roughly 20 images from each experimental condition/ independent experiment (neuronal culture) were analyzed. The operator - blind to the sample treatment - measured the number of pre- and postsynaptic positive juxtaposed puncta formed on one selected segment of the proximal dendrite for each image. The number of dendrites represents the number of neurons analyzed in at least 3-4 independent experiments. The average of all analyzed neurons in each independent experiment was considered for the statistics. Images were acquired using a Leica SP8I confocal microscope equipped with an ACS APO 40x or 63x oil immersion objective.
Nissl staining
Brains were perfused with 4% PFA and 50 μm thick coronal slices were obtained at the vibratome. Slices were mounted on charged coverslips and let dry overnight. They were then re-hydrated with an alcohol scale from 100% to water and subsequently stained for 5 minutes in a 0.1% cresyl violet solution. Afterward, slices were differentiated again in alcohol 95% for 5 minutes according to the intensity of the staining, de-hydrated in alcohol 100% and a subsequently fixed with a xylene-based medium. Images were taken at BX61VS Olympus microscope using a 10x/0,40 UPlanSApo objective.
Lentiviral infection
Lentiviral particles (> 108 TU/ml) were purchased from Vector Builder (Vector Builder Inc, USA). Lentivirus was designed using the following target sequences: IL6R-shRNA CGAAGCGTTTCACAGCTTAAA; Scrambled-shRNA CCTAAGGTTAAGTCGCCCTCG under U6 promoter. The vector also expresses EGFP under hPGK promoter to visualize transduced cells. Cultured neurons were infected with 7 MOI (multiplicity of infection) of lentiviral particles at 5 DIV and analyzed at 14 DIV.
ELISA
ELISA assay was performed on extracellular media collected from primary neurons at 7, 14 and 30 DIV and from confluent Raw264.7 cell cultures. Anti-mouse IL-6Rα ELISA Kit (R&D cat DY1830) was used according to the manufacturer’s protocol.
Magnetic resonance imaging
N = 16 mice (9 IL-6 and 7 vehicle control) underwent MRI to study the functional connectivity and white matter integrity of the entire brain. During the imaging sessions, the experimenters were blinded to the group. Data collection was performed on a Biospec 70/16 small animal MRI system (Bruker BioSpin) equipped with a cryogenic quadrature surface coil (Bruker BioSpin). For the detection of rs-fMRI we used a standard echo-echo gradient echo imaging sequence (GE-EPI, repetition time TR = 1 s, echo time TE = 15 ms, resolution in the plane RES = 0.22 × 0, 2 mm2, number of slices NS = 20, slice thickness ST = 0.4 mm, slice spacing SS = 0.1 mm, 900 volumes, sampling time = 15 min). In addition, diffusion-weighted images (DWI) were used to evaluate the structural integrity of the white matter (EPI spin echo multishot sequence, 4 segments, TR = 2 s, TE = 22 ms, RES = 0.2 × 0.2 mm2, NS = 28, ST = 0.4 mm, SS = 0 mm, values b = 0–1000 s / mm2, coding 94 directions, acquisition time = 9 min).
During MRI, the degree of anesthesia and the physiological parameters of the mouse were monitored according to a defined protocol to obtain a reliable measure of functional connectivity (Grandjean et al., 2014; Zerbi et al., 2015). Briefly, anesthesia was initiated with 4% isoflurane and the animals were intubated endotracheally and the tail vein was cannulated. The mice were placed on a compatible MRI base and artificially ventilated with 80 breaths / min, 1: 4 O2 / air ratio and 1.8 mL / h (CWE) flow. A bolus injection of medetomidine 0.04 mg / kg and pancuronium bromide 0.05 mg / kg was given and isoflurane was reduced to 1%. After 5 minutes, an infusion of medetomidine at 0.09 mg / kg / h and pancuronium bromide at 0.15 mg / kg / h were administered and the isoflurane was further reduced to 0.5%. The temperature of the animals was monitored using a rectal thermometer probe and kept in the cradle at 36.5°C ± 0.5 during measurements with a water heating system.
Resting-state fMRI
The datasets were preprocessed using an existing pipeline to eliminate unwanted time-series confusion, according to the guidelines of the Human Connectome project adapted to the mouse (Zerbi et al., 2015). In short, each rs-fMRI dataset was entered into MELODIC (Multivariate Exploratory Linear Optimized Decomposition of Independent Components; Beckmann and Smith, 2004) to perform an independent component analysis (ICA, number of components set to 60). This included the correction and regression of head movement and in-plane smoothing with a 0.3 × 0.3 mm kernel. We used FSL-FIX for the removal of the variance of artifact components. The artifact-corrected datasets were then band-pass filtered (0.01-0.25 Hz), normalized in a GE-EPI study-specific template, and then to the Allen Common Coordinate Framework Version (CCF, v3) with Advanced Normalization Tools (ANTs v2.1; http://picsl.upenn.edu/software/ants/). To further correct for differences in anesthesia dose, functional connectivity data were adjusted taking into account body weight as a covariate.
Diffusion MRI
For diffusion MRI, the preprocessing steps consisted of individual realignment of the diffusion images, followed by eddy current correction and tensor estimation as in Zerbi et al. (2013a). From the eigenvalues of the diffusion tensor, fractional anisotropy (FA), mean diffusivity (MD), and first eigenvalue (λ1) maps were calculated. The resulting volumes were spatially normalized to the Allen CCF template using linear affine and nonlinear elastic transformations in ANTs and thereafter FA, MD, and λ1 values were extracted from seven major white matter structures: anterior commissure, fimbria, corpus callosum, fornix, cingulum, internal capsule, and cerebral peduncle.
Behavioral analyses
Animals were kept under a light-dark cycle (12 light-12 dark) in a temperature and humidity controlled room. Room lights were low during all procedures. A camera was mounted above the arena and object exploration was tracked using a computer running the Smart Software (Panlab, Harvard Apparatus). Only males were used in these studies.
Open Field Analysis
For the open field, each subject was gently placed in the center of the open field and allowed to explore freely all the arena for 10 min. At the end, the animal was removed and the arena cleaned with 70% ethanol and dried before testing the next animal. Locomotor activity was indexed as the distance spent in center, periphery and total distance traveled.
Elevated plus maze
The Elevated Plus Maze (EPM) was conducted as previously described (Hagenbuch et al., 2006). Mice were allowed to freely explore the entire apparatus for 5 min. The percentage of time spent in the arms was scored as measure of anxiety-related behavior. The arm entry was defined as having all four paws into the arm of the EPM.
Object location Recognition and Novel Object Recognition test
The test was performed in the open-field apparatus. This test was used to assess short-time memory retention. Between trials, the objects and the box were cleaned with 70% ethanol. Mice were first habitued to an open field chamber by allowing free exploration of an empty chamber for 5 min. The Oject location and Novel object recognition test included three sessions. In the first session, two identical objects were placed in the testing arena and each mouse was allowed to explore the objects for 10 minutes to facilitate the familiarization. These objects presented similar textures, colors and sizes. One hour later, one of the identical objects was displaced and the mouse was placed back into the chamber and allowed to explore objects for 10 min (Object location Recognition phase). Lastly,1 hour later, the mouse was returned for 10 min in the chamber where a novel object replaced one of the 2 identical familiar objects (Novel Object Recognition Phase). The amount of time the mouse spent physically investigating each of the objects was manually determined for all the trials and was used to calculate the discrimination index.
Luciferase assay
To monitor the transcriptional activity of STAT3 cultured neurons were transduced using Cignal Lenti STAT3 reporter Kit (QIAGEN) at 3 DIV and exposed to IL-6 and Galiellalactone for 48 hours at 10 DIV. Neurons were then processed according to manufacturer’s instructions and Firefly luciferase activity was detected with Luciferase assay system (Promega) and Synergy H2 (Biotek).
Quantitative RT-PCR
Cultured neurons were homogenized prior to RNA extraction in 500 μL of TRI-reagent (Zymo research). Total RNA was isolated using the RNA Direct-Zol MiniPrep Isolation Kit (Zymo research) according to the manufacturer’s guidelines. The RNA was eluted in 25 μL DNase/RNase-free water, quantified using NANOdrop 2000c spectrophotometer (Thermo Fisher Scientific) for RNA concentration and 260/280 nm optical density ratios. Reverse transcription was performed using 1 μg RNA with a High Capacity cDNA RT kit (Applied Biosystems). Quantitative real-time polymerase chain reaction (qRT-PCR) was performed with either Sybr Green detection kit (SensiFAST SYBR Lo-ROX, Bioline) or TaqMan detection kit (TaqMan Fast Universal PCR Master Mix(2x), no AmpErase UNG, ThermoFisher) with RT-PCR Viia7 software system (Applied Biosystems) in a final volume of 10 μl. Each gene was subjected to at least duplicate measurements and data analyses were performed with the comparative ΔΔCT method. The RNA transcripts were normalized against gapdh and actin3 as indicated. The following Sybr oligos were used: gapdh Fw: TTCCAGAGGGGCCATCCACAG, Rv: GGTCACCAGGGCTGCCATTTG; actin Fw: GCCATCCTGCGTTCTGGA, Rv: GCTCTTCTCCAGGGAGGA; Rgs4 Fw: GTCGGAATACAGCGAGGAGAAC, Rv: GGAAGGATTGGTCAGGTCAAGATAG; Stat3 Fw: CCATGCTGAGCATCGAGCAGCTGACA; Rv: TCA CACAGATGAACTTGGTCTTCAGG. The following TaqMan primer were used: NOS2 Mm00440502_m1; IL6ra Mm01211445_m1; IL6st Mm00439665_m1; IL6 Mm00446190_m1; IL1a Mm00439620_m1; TGFb1 Mm03024053_m1; IL10 Mm00439616_m1; Mouse GAPD(GAPDH) Endogenous Control.
Fluorescence Activated Cell Sorting (FACS) analysis
The day after plating N2A were co-transfected according to three experimental conditions with the following plasmids: 1) pCDNA 3.1 EGFP; 2) pCDNA 3.1 EGFP + pCDNA 3.1 myc 768-STAT3 Y795E; 3) pCDNA 3.1 EGFP + pCDNA 3.1 myc 768-STAT3 Y705F and maintained for 6 hours in the transfection medium. After 24 hours, they were gently detached with Accutase solution (Sigma-Aldrich) for 3 minutes at 37°C, centrifuged at 500 rcf. for 10 minutes and then sorted out by means of BD FACS Melody cell sorter (BD, Biosciences). GFP positive (+) and GFP negative (-) cells were collected for each condition, lysed with TRI-Reagent and subsequently processed for total RNA extraction and qRT-PCR.
Single cell sequencing
Sample preparation
Embryonic hippocampi (Hps) form control embryos or upon IL-6 injection (n = 5 embryos per sample) were rapidly microdissected and pooled together in ice cold dissecting medium (HBSS supplemented with 9,9 mM HEPES pH 7,3) under microscopic control. Dissected Hps were settle down by gravity to aspirate the dissection medium and dissociated to obtain single cell suspension using Papain Dissociation System kit (Worthington, cat#LK003150) following the manufactured instructions. Dissociated Hps were finally centrifuged at 280 g for 5 minutes and resuspended in PBS −/− with 0.04% BSA (Sigma Aldrich). Next, 10 μL of single cells suspension was mixed with 10 μL of trypan blue and automatically counted using Countess 3 Automated Cell Counter (Invitrogen, cat#AMQAX2000).
Primary hippocampal neurons untreated and treated with IL-6 (10ng/ml at 1 DIV and 4 DIV) were collected at 5 DIV using Accutase solution (Sigma-Aldrich) and resuspended in 1ml of PBS −/− with 0.04% BSA (Sigma Aldrich), centrifuged at 450 rcf. for 7min and washed twice with PBS−/− with 0.04% BSA. After the second wash, cells were resuspended in 30 ul and counted using Countess 3 Automated Cell Counter (Invitrogen, cat#AMQAX2000.
For both samples, ∼5,000 cells were loaded into one channel of the Single Cell Chip A for each sample using the Single Cell 3′ v2 single cell reagent kit (10X Genomics) for Gel bead Emulsion generation into the Chromium system. Following capture and lysis, cDNA was synthesized and amplified for 14 cycles following the manufacturer’s protocol (10X Genomics). 50 ng of the amplified cDNA were then used for each sample to construct Illumina sequencing libraries. Sequencing was performed on the NextSeq500 Illumina sequencing platform following 10x Genomics instruction for reads generation.
Single cell mapping and clustering
Raw sequencing data (bcl-files) were converted to fastq files with Illumina bcl2fastq tool, integrated into the CellRanger (10X Genomics) suite (version 2.1.1). The CellRanger analysis pipeline was used to generate a digital gene expression matrix staring from raw data. Pre-build mouse genome (version mm10-1.2.0) was used as genome reference. CellRanger count module was used to map reads with default settings setting and sequence length set to r1-length = 26 and–r2-length = 50. At least 90,000 reads per cell were produced for primary hippocampal neurons and 50,000 reads/cells for the in vivo hippocampi. The raw digital gene expression matrix (UMI counts per gene per cell) was imported in R (https://www.R-project.org/) version 3.5.2 using Seurat R package (Butler et al., 2018). Briefly, UMI counts per gene per cell for each biological replicate was imported in Seurat. Initial quality control in each biological replicate was assessed, by filtering out cells meeting any of the following criteria: less than 200 or more than 10,000 unique genes expressed, more than 50,000 UMIs, or more than 15.0% of reads mapping to mitochondria (Figure S2C). Data was normalized through a global-scaling method, converted by a scale factor (10,000 by default) and log-transformed. Scaling the data and removing unwanted sources of variation was applied through ScaleData Seurat function. Detection of variable genes across the single cells in each sample was performed. The resulting gene list was used to perform a canonical correlation analysis (CCA) using the first 30 canonical vectors. After aligning subspaces, clustering was performed through FindClusters function, using the first 20 dimensions. Uniform Manifold Approximation and Projection (UMAP) dimensional reduction was computed with RunUMAP function.
For the single cell experiment on embryonic hippocampi, clusters were annotated based on markers available in the literature (Zhong et al., 2020). Marker genes for each cluster were defined with the function FindAllMarkers with parameters min.pct = 0.25 and test.use = wilcox.
For the single cell experiment on primary hippocampal neurons, cluster enrichment was determined by running AddModulescore Seurat function using top signature genes form the in vivo single cell experiment and additional markers from the literature (Cahoy et al., 2008; Cembrowski et al., 2016; Lein et al., 2007).
Promoter sequence analysis
The bioinformatic prediction for transcription factor binding sites in RGS4 promoter region was performed using JASPAR database (http://jaspar.genereg.net/) (Khan et al., 2018; Sandelin et al., 2004)
Single cell markers identification and differential expression
We identified markers specific to each cluster using FindAllMarkers Seurat function with the following settings (only.pos = TRUE, min.pct = 0.05 or 0.20, thresh.use = 0.05 or 0.10 respectively for in vitro and in vivo experiments). To identify differentially expressed genes within the same cluster in different experimental conditions and between different clusters in the same experimental condition, we used MAST (Finak et al., 2015) or Wilcoxon algorithms implemented in Seurat FindMarkers function with an FDR cut-off of 0.05 and a logfc.threshold = 0.10 (in vivo) or 0.2 (in vitro). Gene onthology analysis of biological processes (BP) enrichment was performed with clusterProfiler R package (Yu et al., 2012) and summarized with Revigo web server (Supek et al., 2011) to remove redundant GO:BP terms.
Quantification and statistical analysis
The numerical data shown in the figures are presented as means ± SEM. The normal distribution of experimental data was assessed using Kolmogorov Smirnov and Shapiro-Wilk normality tests. If not specifically indicated, to compare two normally distributed sample groups, the Student’s unpaired two-tailed t test was used. To compare two sample groups that were not normally distributed, we used Mann–Whitney’s non-parametric test. To compare more than two normally distributed sample groups, we used one ANOVA, followed by Tukey’s multiple comparisons test. To compare more than two groups that were not normally distributed, we used one One-way ANOVA on ranks followed by Dunn’s multiple comparison test. One sample t test or Wilcoxon Signed Rank Test were used in some experiments to analyze normally distributed or not normally distributed dataset, respectively. Statistical analysis was performed by using SigmaPlot (Systat), GraphPad (Prism) or OriginPro (OriginLab) software.
Acknowledgments
We thank Prof. Valeria Poli (Department of Molecular Biotechnology and Health Sciences, University of Turin, Italy) for kindly providing all plasmids coding for the phosphomimetic mutants of STAT3 and Dr. Marinos Kallikourdis for intellectual input and comments on the manuscript. This work was supported by PRIN (Ministero dell’Istruzione dell’Università e della Ricerca; 2017A9MK4R); FISM 2019/R-Single/032, The Ferring COVID-19 Investigational Grants in Reproductive Medicine and Maternal Health (RMMH), and Fondazione Cassa di Risparmio di Pisa "Studio traslazionale dell'infiammazione nell'invecchiamento" (to M.M.); Telethon Foundation GGP19226A (to D.P.); RF2018-12365280 and Cariplo Foundation 2019-1785 (to S.L.), and Cariplo Foundation 2017-0622 (to E.M.). We also thank the Monzino Foundation (Milano, Italy) for its generous gift of the Zeiss LSM800 confocal microscope to the Milan section of the Institute of Neuroscience.
Author contributions
F.M. performed and analyzed electrophysiological, biochemical and immunofluorescence experiments. G.D. performed and analyzed qPCR experiments. G.F. performed in vitro immunofluorescence experiments and analyses. S.M. performed the intracerebroventricular injections into embryos, in utero electroporation surgery and analyses, and in vivo immunofluorescence analyses. M.R. and F.M. performed the in vivo injections into pregnant mice. S.M., S.L., and D.P. performed, analyzed, and interpreted the single-cell sequencing data for the in vivo data. C.P. performed the single-cell sequencing experiment. P.K. and A.T. analyzed and interpreted the single-cell sequencing data. R.M. performed the ex vivo electrophysiological recordings. M. Markicevic, C.G., and V.Z. performed the functional connectivity experiments and data analyses. E.M. performed acquisition and analysis of the immunofluorescence experiments. M.M., D.P., and F.M. designed, analyzed, and interpreted the data. M.M. and D.P. conceived the study and wrote the manuscript.
Declaration of interests
The authors declare no competing interests.
Published: November 9, 2021
Footnotes
Supplemental information can be found online at https://doi.org/10.1016/j.immuni.2021.10.006.
Contributor Information
Michela Matteoli, Email: michela.matteoli@hunimed.eu.
Davide Pozzi, Email: davide.pozzi@humanitasresearch.it.
Supplemental information
Data and code availability
All datasets related to single-cell RNA sequencing have been deposited at GEO and are publicly available as of the date of publication, GEO: GSE180345. Accession numbers are listed in the Key resources table.
This paper does not report original code.
Any additional information required to reanalyze the data reported in this paper is available from the lead contact upon request. Raw data from Figures 1 and 5 and Figures S1, S2, S4, S5, S6, and S7 were deposited on Mendeley Data at https://doi.org/10.17632/5vpsd5d9zw.1
References
- Agostini M., Romeo F., Inoue S., Niklison-Chirou M.V., Elia A.J., Dinsdale D., Morone N., Knight R.A., Mak T.W., Melino G. Metabolic reprogramming during neuronal differentiation. Cell Death Differ. 2016;23:1502–1514. doi: 10.1038/cdd.2016.36. [DOI] [PMC free article] [PubMed] [Google Scholar]
- Ajram L.A., Horder J., Mendez M.A., Galanopoulos A., Brennan L.P., Wichers R.H., Robertson D.M., Murphy C.M., Zinkstok J., Ivin G., et al. Shifting brain inhibitory balance and connectivity of the prefrontal cortex of adults with autism spectrum disorder. Transl. Psychiatry. 2017;7:e1137. doi: 10.1038/tp.2017.104. [DOI] [PMC free article] [PubMed] [Google Scholar]
- Angevine J.B., Jr. Time of neuron origin in the hippocampal region. An autoradiographic study in the mouse. Exp. Neurol.Suppl. 1965;2:1–70. [PubMed] [Google Scholar]
- Aniszewska A., Chłodzińska N., Bartkowska K., Winnicka M.M., Turlejski K., Djavadian R.L. The expression of interleukin-6 and its receptor in various brain regions and their roles in exploratory behavior and stress responses. J. Neuroimmunol. 2015;284:1–9. doi: 10.1016/j.jneuroim.2015.05.001. [DOI] [PubMed] [Google Scholar]
- Balschun D., Wetzel W., Del Rey A., Pitossi F., Schneider H., Zuschratter W., Besedovsky H.O. Interleukin-6: a cytokine to forget. FASEB J. 2004;18:1788–1790. doi: 10.1096/fj.04-1625fje. [DOI] [PubMed] [Google Scholar]
- Bansal G., Druey K.M., Xie Z. R4 RGS proteins: regulation of G-protein signaling and beyond. Pharmacol. Ther. 2007;116:473–495. doi: 10.1016/j.pharmthera.2007.09.005. [DOI] [PMC free article] [PubMed] [Google Scholar]
- Barnabé-Heider F., Wasylnka J.A., Fernandes K.J., Porsche C., Sendtner M., Kaplan D.R., Miller F.D. Evidence that embryonic neurons regulate the onset of cortical gliogenesis via cardiotrophin-1. Neuron. 2005;48:253–265. doi: 10.1016/j.neuron.2005.08.037. [DOI] [PubMed] [Google Scholar]
- Bauer S., Kerr B.J., Patterson P.H. The neuropoietic cytokine family in development, plasticity, disease and injury. Nat. Rev. Neurosci. 2007;8:221–232. doi: 10.1038/nrn2054. [DOI] [PubMed] [Google Scholar]
- Bauman M.D., Iosif A.M., Smith S.E., Bregere C., Amaral D.G., Patterson P.H. Activation of the maternal immune system during pregnancy alters behavioral development of rhesus monkey offspring. Biol. Psychiatry. 2014;75:332–341. doi: 10.1016/j.biopsych.2013.06.025. [DOI] [PMC free article] [PubMed] [Google Scholar]
- Beckmann C.F., Smith S.M. Probabilistic independent component analysis for functional magnetic resonance imaging. IEEE Trans. Med. Imaging. 2004;23:137–152. doi: 10.1109/TMI.2003.822821. [DOI] [PubMed] [Google Scholar]
- Bedogni F., Cobolli Gigli C., Pozzi D., Rossi R.L., Scaramuzza L., Rossetti G., Pagani M., Kilstrup-Nielsen C., Matteoli M., Landsberger N. Defects During Mecp2 Null Embryonic Cortex Development Precede the Onset of Overt Neurological Symptoms. Cereb. Cortex. 2016;26:2517–2529. doi: 10.1093/cercor/bhv078. [DOI] [PubMed] [Google Scholar]
- Benedusi V., Martini E., Kallikourdis M., Villa A., Meda C., Maggi A. Ovariectomy shortens the life span of female mice. Oncotarget. 2015;6:10801–10811. doi: 10.18632/oncotarget.2984. [DOI] [PMC free article] [PubMed] [Google Scholar]
- Bergink V., Gibney S.M., Drexhage H.A. Autoimmunity, inflammation, and psychosis: a search for peripheral markers. Biol. Psychiatry. 2014;75:324–331. doi: 10.1016/j.biopsych.2013.09.037. [DOI] [PubMed] [Google Scholar]
- Berman D.M., Kozasa T., Gilman A.G. The GTPase-activating protein RGS4 stabilizes the transition state for nucleotide hydrolysis. J. Biol. Chem. 1996;271:27209–27212. doi: 10.1074/jbc.271.44.27209. [DOI] [PubMed] [Google Scholar]
- Berman D.M., Wilkie T.M., Gilman A.G. GAIP and RGS4 are GTPase-activating proteins for the Gi subfamily of G protein alpha subunits. Cell. 1996;86:445–452. doi: 10.1016/s0092-8674(00)80117-8. [DOI] [PubMed] [Google Scholar]
- Blazer L.L., Roman D.L., Chung A., Larsen M.J., Greedy B.M., Husbands S.M., Neubig R.R. Reversible, allosteric small-molecule inhibitors of regulator of G protein signaling proteins. Mol. Pharmacol. 2010;78:524–533. doi: 10.1124/mol.110.065128. [DOI] [PMC free article] [PubMed] [Google Scholar]
- Boulanger-Bertolus J., Pancaro C., Mashour G.A. Increasing Role of Maternal Immune Activation in Neurodevelopmental Disorders. Front. Behav. Neurosci. 2018;12:230. doi: 10.3389/fnbeh.2018.00230. [DOI] [PMC free article] [PubMed] [Google Scholar]
- Boulanger L.M. Immune proteins in brain development and synaptic plasticity. Neuron. 2009;64:93–109. doi: 10.1016/j.neuron.2009.09.001. [DOI] [PubMed] [Google Scholar]
- Buckholtz J.W., Meyer-Lindenberg A., Honea R.A., Straub R.E., Pezawas L., Egan M.F., Vakkalanka R., Kolachana B., Verchinski B.A., Sust S., et al. Allelic variation in RGS4 impacts functional and structural connectivity in the human brain. J. Neurosci. 2007;27:1584–1593. doi: 10.1523/JNEUROSCI.5112-06.2007. [DOI] [PMC free article] [PubMed] [Google Scholar]
- Butler A., Hoffman P., Smibert P., Papalexi E., Satija R. Integrating single-cell transcriptomic data across different conditions, technologies, and species. Nat. Biotechnol. 2018;36:411–420. doi: 10.1038/nbt.4096. [DOI] [PMC free article] [PubMed] [Google Scholar]
- Cafferty W.B., Gardiner N.J., Das P., Qiu J., McMahon S.B., Thompson S.W. Conditioning injury-induced spinal axon regeneration fails in interleukin-6 knock-out mice. J. Neurosci. 2004;24:4432–4443. doi: 10.1523/JNEUROSCI.2245-02.2004. [DOI] [PMC free article] [PubMed] [Google Scholar]
- Cahoy J.D., Emery B., Kaushal A., Foo L.C., Zamanian J.L., Christopherson K.S., Xing Y., Lubischer J.L., Krieg P.A., Krupenko S.A., et al. A transcriptome database for astrocytes, neurons, and oligodendrocytes: a new resource for understanding brain development and function. J. Neurosci. 2008;28:264–278. doi: 10.1523/JNEUROSCI.4178-07.2008. [DOI] [PMC free article] [PubMed] [Google Scholar]
- Campbell I.L., Erta M., Lim S.L., Frausto R., May U., Rose-John S., Scheller J., Hidalgo J. Trans-signaling is a dominant mechanism for the pathogenic actions of interleukin-6 in the brain. J. Neurosci. 2014;34:2503–2513. doi: 10.1523/JNEUROSCI.2830-13.2014. [DOI] [PMC free article] [PubMed] [Google Scholar]
- Cembrowski M.S., Wang L., Sugino K., Shields B.C., Spruston N. Hipposeq: a comprehensive RNA-seq database of gene expression in hippocampal principal neurons. eLife. 2016;5:e14997. doi: 10.7554/eLife.14997. [DOI] [PMC free article] [PubMed] [Google Scholar]
- Chao H.T., Zoghbi H.Y., Rosenmund C. MeCP2 controls excitatory synaptic strength by regulating glutamatergic synapse number. Neuron. 2007;56:58–65. doi: 10.1016/j.neuron.2007.08.018. [DOI] [PMC free article] [PubMed] [Google Scholar]
- Cheng Y.C., Scotting P.J., Hsu L.S., Lin S.J., Shih H.Y., Hsieh F.Y., Wu H.L., Tsao C.L., Shen C.J. Zebrafish rgs4 is essential for motility and axonogenesis mediated by Akt signaling. Cell. Mol. Life Sci. 2013;70:935–950. doi: 10.1007/s00018-012-1178-z. [DOI] [PMC free article] [PubMed] [Google Scholar]
- Choi G.B., Yim Y.S., Wong H., Kim S., Kim H., Kim S.V., Hoeffer C.A., Littman D.R., Huh J.R. The maternal interleukin-17a pathway in mice promotes autism-like phenotypes in offspring. Science. 2016;351:933–939. doi: 10.1126/science.aad0314. [DOI] [PMC free article] [PubMed] [Google Scholar]
- Chowdari K.V., Mirnics K., Semwal P., Wood J., Lawrence E., Bhatia T., Deshpande S.N., B K T., Ferrell R.E., Middleton F.A., et al. Association and linkage analyses of RGS4 polymorphisms in schizophrenia. Hum. Mol. Genet. 2002;11:1373–1380. doi: 10.1093/hmg/11.12.1373. [DOI] [PubMed] [Google Scholar]
- Chung C.D., Liao J., Liu B., Rao X., Jay P., Berta P., Shuai K. Specific inhibition of Stat3 signal transduction by PIAS3. Science. 1997;278:1803–1805. doi: 10.1126/science.278.5344.1803. [DOI] [PubMed] [Google Scholar]
- Chung J., Uchida E., Grammer T.C., Blenis J. STAT3 serine phosphorylation by ERK-dependent and -independent pathways negatively modulates its tyrosine phosphorylation. Mol. Cell. Biol. 1997;17:6508–6516. doi: 10.1128/mcb.17.11.6508. [DOI] [PMC free article] [PubMed] [Google Scholar]
- Cline H. Synaptogenesis: a balancing act between excitation and inhibition. Curr. Biol. 2005;15:R203–R205. doi: 10.1016/j.cub.2005.03.010. [DOI] [PubMed] [Google Scholar]
- Corradini I., Focchi E., Rasile M., Morini R., Desiato G., Tomasoni R., Lizier M., Ghirardini E., Fesce R., Morone D., et al. Maternal Immune Activation Delays Excitatory-to-Inhibitory Gamma-Aminobutyric Acid Switch in Offspring. Biol. Psychiatry. 2018;83:680–691. doi: 10.1016/j.biopsych.2017.09.030. [DOI] [PubMed] [Google Scholar]
- Courchesne E., Pierce K., Schumann C.M., Redcay E., Buckwalter J.A., Kennedy D.P., Morgan J. Mapping early brain development in autism. Neuron. 2007;56:399–413. doi: 10.1016/j.neuron.2007.10.016. [DOI] [PubMed] [Google Scholar]
- Dahlgren J., Samuelsson A.M., Jansson T., Holmäng A. Interleukin-6 in the maternal circulation reaches the rat fetus in mid-gestation. Pediatr. Res. 2006;60:147–151. doi: 10.1203/01.pdr.0000230026.74139.18. [DOI] [PubMed] [Google Scholar]
- Dame J.B., Juul S.E. The distribution of receptors for the pro-inflammatory cytokines interleukin (IL)-6 and IL-8 in the developing human fetus. Early Hum. Dev. 2000;58:25–39. doi: 10.1016/s0378-3782(00)00064-5. [DOI] [PubMed] [Google Scholar]
- Dean B., Boer S., Gibbons A., Money T., Scarr E. Recent advances in postmortem pathology and neurochemistry in schizophrenia. Curr. Opin. Psychiatry. 2009;22:154–160. doi: 10.1097/YCO.0b013e328323d52e. [DOI] [PubMed] [Google Scholar]
- Deco G., Ponce-Alvarez A., Hagmann P., Romani G.L., Mantini D., Corbetta M. How local excitation-inhibition ratio impacts the whole brain dynamics. J. Neurosci. 2014;34:7886–7898. doi: 10.1523/JNEUROSCI.5068-13.2014. [DOI] [PMC free article] [PubMed] [Google Scholar]
- Deverman B.E., Patterson P.H. Cytokines and CNS development. Neuron. 2009;64:61–78. doi: 10.1016/j.neuron.2009.09.002. [DOI] [PubMed] [Google Scholar]
- Durand C.M., Betancur C., Boeckers T.M., Bockmann J., Chaste P., Fauchereau F., Nygren G., Rastam M., Gillberg I.C., Anckarsäter H., et al. Mutations in the gene encoding the synaptic scaffolding protein SHANK3 are associated with autism spectrum disorders. Nat. Genet. 2007;39:25–27. doi: 10.1038/ng1933. [DOI] [PMC free article] [PubMed] [Google Scholar]
- Erdely H.A., Tamminga C.A., Roberts R.C., Vogel M.W. Regional alterations in RGS4 protein in schizophrenia. Synapse. 2006;59:472–479. doi: 10.1002/syn.20265. [DOI] [PubMed] [Google Scholar]
- Erta M., Quintana A., Hidalgo J. Interleukin-6, a major cytokine in the central nervous system. Int. J. Biol. Sci. 2012;8:1254–1266. doi: 10.7150/ijbs.4679. [DOI] [PMC free article] [PubMed] [Google Scholar]
- Estes M.L., McAllister A.K. Maternal immune activation: Implications for neuropsychiatric disorders. Science. 2016;353:772–777. doi: 10.1126/science.aag3194. [DOI] [PMC free article] [PubMed] [Google Scholar]
- Fang X.X., Jiang X.L., Han X.H., Peng Y.P., Qiu Y.H. Neuroprotection of interleukin-6 against NMDA-induced neurotoxicity is mediated by JAK/STAT3, MAPK/ERK, and PI3K/AKT signaling pathways. Cell. Mol. Neurobiol. 2013;33:241–251. doi: 10.1007/s10571-012-9891-6. [DOI] [PMC free article] [PubMed] [Google Scholar]
- Filipello F., Morini R., Corradini I., Zerbi V., Canzi A., Michalski B., Erreni M., Markicevic M., Starvaggi-Cucuzza C., Otero K., et al. The Microglial Innate Immune Receptor TREM2 Is Required for Synapse Elimination and Normal Brain Connectivity. Immunity. 2018;48:979–991.e8. doi: 10.1016/j.immuni.2018.04.016. [DOI] [PubMed] [Google Scholar]
- Filippini N., MacIntosh B.J., Hough M.G., Goodwin G.M., Frisoni G.B., Smith S.M., Matthews P.M., Beckmann C.F., Mackay C.E. Distinct patterns of brain activity in young carriers of the APOE-epsilon4 allele. Proc. Natl. Acad. Sci. USA. 2009;106:7209–7214. doi: 10.1073/pnas.0811879106. [DOI] [PMC free article] [PubMed] [Google Scholar]
- Finak, G., McDavid, A., Yajima, M., Deng, J., Gersuk, V., Shalek, A.K., Slichter, C.K., Miller, H.W., McElrath, M.J., Prlic, M., et al. (2015). MAST: a flexible statistical framework for assessing transcriptional changes and characterizing heterogeneity in single-cell RNA sequencing data. Genome Biol 16, 278.As attached file, please find the new version of the references with the missing citation. [DOI] [PMC free article] [PubMed]
- Finlay B.L., Darlington R.B. Linked regularities in the development and evolution of mammalian brains. Science. 1995;268:1578–1584. doi: 10.1126/science.7777856. [DOI] [PubMed] [Google Scholar]
- Fontana C., Marasca F., Provitera L., Mancinelli S., Pesenti N., Sinha S., Passera S., Abrignani S., Mosca F., Lodato S., et al. Early maternal care restores LINE-1 methylation and enhances neurodevelopment in preterm infants. BMC Med. 2021;19:42. doi: 10.1186/s12916-020-01896-0. [DOI] [PMC free article] [PubMed] [Google Scholar]
- Frankle W.G., Lerma J., Laruelle M. The synaptic hypothesis of schizophrenia. Neuron. 2003;39:205–216. doi: 10.1016/s0896-6273(03)00423-9. [DOI] [PubMed] [Google Scholar]
- Gadient R.A., Otten U. Differential expression of interleukin-6 (IL-6) and interleukin-6 receptor (IL-6R) mRNAs in rat hypothalamus. Neurosci. Lett. 1993;153:13–16. doi: 10.1016/0304-3940(93)90065-s. [DOI] [PubMed] [Google Scholar]
- Gadient R.A., Otten U. Expression of interleukin-6 (IL-6) and interleukin-6 receptor (IL-6R) mRNAs in rat brain during postnatal development. Brain Res. 1994;637:10–14. doi: 10.1016/0006-8993(94)91211-4. [DOI] [PubMed] [Google Scholar]
- Gadient R.A., Otten U. Postnatal expression of interleukin-6 (IL-6) and IL-6 receptor (IL-6R) mRNAs in rat sympathetic and sensory ganglia. Brain Res. 1996;724:41–46. doi: 10.1016/0006-8993(96)00264-8. [DOI] [PubMed] [Google Scholar]
- Gallagher D., Norman A.A., Woodard C.L., Yang G., Gauthier-Fisher A., Fujitani M., Vessey J.P., Cancino G.I., Sachewsky N., Woltjen K., et al. Transient maternal IL-6 mediates long-lasting changes in neural stem cell pools by deregulating an endogenous self-renewal pathway. Cell Stem Cell. 2013;13:564–576. doi: 10.1016/j.stem.2013.10.002. [DOI] [PubMed] [Google Scholar]
- Garetto S., Sardi C., Martini E., Roselli G., Morone D., Angioni R., Cianciotti B.C., Trovato A.E., Franchina D.G., Castino G.F., et al. Tailored chemokine receptor modification improves homing of adoptive therapy T cells in a spontaneous tumor model. Oncotarget. 2016;7:43010–43026. doi: 10.18632/oncotarget.9280. [DOI] [PMC free article] [PubMed] [Google Scholar]
- Gatto C.L., Broadie K. Genetic controls balancing excitatory and inhibitory synaptogenesis in neurodevelopmental disorder models. Front. Synaptic Neurosci. 2010;2:4. doi: 10.3389/fnsyn.2010.00004. [DOI] [PMC free article] [PubMed] [Google Scholar]
- Gerber K.J., Squires K.E., Hepler J.R. Roles for Regulator of G Protein Signaling Proteins in Synaptic Signaling and Plasticity. Mol. Pharmacol. 2016;89:273–286. doi: 10.1124/mol.115.102210. [DOI] [PMC free article] [PubMed] [Google Scholar]
- Giovanoli S., Engler H., Engler A., Richetto J., Feldon J., Riva M.A., Schedlowski M., Meyer U. Preventive effects of minocycline in a neurodevelopmental two-hit model with relevance to schizophrenia. Transl. Psychiatry. 2016;6:e772. doi: 10.1038/tp.2016.38. [DOI] [PMC free article] [PubMed] [Google Scholar]
- Glausier J.R., Lewis D.A. Dendritic spine pathology in schizophrenia. Neuroscience. 2013;251:90–107. doi: 10.1016/j.neuroscience.2012.04.044. [DOI] [PMC free article] [PubMed] [Google Scholar]
- Grabrucker A.M. Environmental factors in autism. Front. Psychiatry. 2013;3:118. doi: 10.3389/fpsyt.2012.00118. [DOI] [PMC free article] [PubMed] [Google Scholar]
- Grandjean J., Schroeter A., Batata I., Rudin M. Optimization of anesthesia protocol for resting-state fMRI in mice based on differential effects of anesthetics on functional connectivity patterns. Neuroimage. 2014;102:838–847. doi: 10.1016/j.neuroimage.2014.08.043. [DOI] [PubMed] [Google Scholar]
- Hagenbuch N., Feldon J., Yee B.K. Use of the elevated plus-maze test with opaque or transparent walls in the detection of mouse strain differences and the anxiolytic effects of diazepam. Behav. Pharmacol. 2006;17:31–41. doi: 10.1097/01.fbp.0000189811.77049.3e. [DOI] [PubMed] [Google Scholar]
- Harris K.D., Hochgerner H., Skene N.G., Magno L., Katona L., Bengtsson Gonzales C., Somogyi P., Kessaris N., Linnarsson S., Hjerling-Leffler J. Classes and continua of hippocampal CA1 inhibitory neurons revealed by single-cell transcriptomics. PLoS Biol. 2018;16:e2006387. doi: 10.1371/journal.pbio.2006387. [DOI] [PMC free article] [PubMed] [Google Scholar]
- Heinrich P.C., Behrmann I., Haan S., Hermanns H.M., Müller-Newen G., Schaper F. Principles of interleukin (IL)-6-type cytokine signalling and its regulation. Biochem. J. 2003;374:1–20. doi: 10.1042/BJ20030407. [DOI] [PMC free article] [PubMed] [Google Scholar]
- Hepler J.R., Berman D.M., Gilman A.G., Kozasa T. RGS4 and GAIP are GTPase-activating proteins for Gq alpha and block activation of phospholipase C beta by gamma-thio-GTP-Gq alpha. Proc. Natl. Acad. Sci. USA. 1997;94:428–432. doi: 10.1073/pnas.94.2.428. [DOI] [PMC free article] [PubMed] [Google Scholar]
- Hsiao E.Y., Patterson P.H. Activation of the maternal immune system induces endocrine changes in the placenta via IL-6. Brain Behav. Immun. 2011;25:604–615. doi: 10.1016/j.bbi.2010.12.017. [DOI] [PMC free article] [PubMed] [Google Scholar]
- Hunter C.A., Jones S.A. IL-6 as a keystone cytokine in health and disease. Nat. Immunol. 2015;16:448–457. doi: 10.1038/ni.3153. [DOI] [PubMed] [Google Scholar]
- Huttenlocher P.R., Dabholkar A.S. Regional differences in synaptogenesis in human cerebral cortex. J. Comp. Neurol. 1997;387:167–178. doi: 10.1002/(sici)1096-9861(19971020)387:2<167::aid-cne1>3.0.co;2-z. [DOI] [PubMed] [Google Scholar]
- Iidaka T., Kogata T., Mano Y., Komeda H. Thalamocortical Hyperconnectivity and Amygdala-Cortical Hypoconnectivity in Male Patients With Autism Spectrum Disorder. Front. Psychiatry. 2019;10:252. doi: 10.3389/fpsyt.2019.00252. [DOI] [PMC free article] [PubMed] [Google Scholar]
- Jiang S., Li C., McRae G., Lykken E., Sevilla J., Liu S.Q., Wan Y., Li Q.J. MeCP2 reinforces STAT3 signaling and the generation of effector CD4+ T cells by promoting miR-124-mediated suppression of SOCS5. Sci. Signal. 2014;7:ra25. doi: 10.1126/scisignal.2004824. [DOI] [PMC free article] [PubMed] [Google Scholar]
- Jones S.A., Horiuchi S., Topley N., Yamamoto N., Fuller G.M. The soluble interleukin 6 receptor: mechanisms of production and implications in disease. FASEB J. 2001;15:43–58. doi: 10.1096/fj.99-1003rev. [DOI] [PubMed] [Google Scholar]
- Jones S.A., Hunter C.A. Is IL-6 a key cytokine target for therapy in COVID-19? Nat. Rev. Immunol. 2021;21:337–339. doi: 10.1038/s41577-021-00553-8. [DOI] [PMC free article] [PubMed] [Google Scholar]
- Jones S.A., Scheller J., Rose-John S. Therapeutic strategies for the clinical blockade of IL-6/gp130 signaling. J. Clin. Invest. 2011;121:3375–3383. doi: 10.1172/JCI57158. [DOI] [PMC free article] [PubMed] [Google Scholar]
- Jostock T., Müllberg J., Ozbek S., Atreya R., Blinn G., Voltz N., Fischer M., Neurath M.F., Rose-John S. Soluble gp130 is the natural inhibitor of soluble interleukin-6 receptor transsignaling responses. Eur. J. Biochem. 2001;268:160–167. doi: 10.1046/j.1432-1327.2001.01867.x. [DOI] [PubMed] [Google Scholar]
- Kallikourdis M. T cell responses to tumor: how dominant assumptions on immune activity led to a neglect of pathological functions, and how evolutionary considerations can help identify testable hypotheses for improving immunotherapy. Cancer Immunol. Immunother. 2018;67:989–998. doi: 10.1007/s00262-017-2113-9. [DOI] [PMC free article] [PubMed] [Google Scholar]
- Khan A., Fornes O., Stigliani A., Gheorghe M., Castro-Mondragon J.A., van der Lee R., Bessy A., Chèneby J., Kulkarni S.R., Tan G., et al. JASPAR 2018: update of the open-access database of transcription factor binding profiles and its web framework. Nucleic Acids Res. 2018;46(D1):D1284. doi: 10.1093/nar/gkx1188. [DOI] [PMC free article] [PubMed] [Google Scholar]
- Kim S., Kim H., Yim Y.S., Ha S., Atarashi K., Tan T.G., Longman R.S., Honda K., Littman D.R., Choi G.B., Huh J.R. Maternal gut bacteria promote neurodevelopmental abnormalities in mouse offspring. Nature. 2017;549:528–532. doi: 10.1038/nature23910. [DOI] [PMC free article] [PubMed] [Google Scholar]
- Knuesel I., Chicha L., Britschgi M., Schobel S.A., Bodmer M., Hellings J.A., Toovey S., Prinssen E.P. Maternal immune activation and abnormal brain development across CNS disorders. Nat. Rev. Neurol. 2014;10:643–660. doi: 10.1038/nrneurol.2014.187. [DOI] [PubMed] [Google Scholar]
- Konopaske G.T., Lange N., Coyle J.T., Benes F.M. Prefrontal cortical dendritic spine pathology in schizophrenia and bipolar disorder. JAMA Psychiatry. 2014;71:1323–1331. doi: 10.1001/jamapsychiatry.2014.1582. [DOI] [PMC free article] [PubMed] [Google Scholar]
- Kraakman M.J., Kammoun H.L., Allen T.L., Deswaerte V., Henstridge D.C., Estevez E., Matthews V.B., Neill B., White D.A., Murphy A.J., et al. Blocking IL-6 trans-signaling prevents high-fat diet-induced adipose tissue macrophage recruitment but does not improve insulin resistance. Cell Metab. 2015;21:403–416. doi: 10.1016/j.cmet.2015.02.006. [DOI] [PubMed] [Google Scholar]
- Lee J., Chung C., Ha S., Lee D., Kim D.Y., Kim H., Kim E. Shank3-mutant mice lacking exon 9 show altered excitation/inhibition balance, enhanced rearing, and spatial memory deficit. Front. Cell. Neurosci. 2015;9:94. doi: 10.3389/fncel.2015.00094. [DOI] [PMC free article] [PubMed] [Google Scholar]
- Leibinger M., Andreadaki A., Diekmann H., Fischer D. Neuronal STAT3 activation is essential for CNTF- and inflammatory stimulation-induced CNS axon regeneration. Cell Death Dis. 2013;4:e805. doi: 10.1038/cddis.2013.310. [DOI] [PMC free article] [PubMed] [Google Scholar]
- Leibinger M., Müller A., Gobrecht P., Diekmann H., Andreadaki A., Fischer D. Interleukin-6 contributes to CNS axon regeneration upon inflammatory stimulation. Cell Death Dis. 2013;4:e609. doi: 10.1038/cddis.2013.126. [DOI] [PMC free article] [PubMed] [Google Scholar]
- Lein E.S., Hawrylycz M.J., Ao N., Ayres M., Bensinger A., Bernard A., Boe A.F., Boguski M.S., Brockway K.S., Byrnes E.J., et al. Genome-wide atlas of gene expression in the adult mouse brain. Nature. 2007;445:168–176. doi: 10.1038/nature05453. [DOI] [PubMed] [Google Scholar]
- Levitt P., Ebert P., Mirnics K., Nimgaonkar V.L., Lewis D.A. Making the case for a candidate vulnerability gene in schizophrenia: Convergent evidence for regulator of G-protein signaling 4 (RGS4) Biol. Psychiatry. 2006;60:534–537. doi: 10.1016/j.biopsych.2006.04.028. [DOI] [PubMed] [Google Scholar]
- Li X., Chauhan A., Sheikh A.M., Patil S., Chauhan V., Li X.M., Ji L., Brown T., Malik M. Elevated immune response in the brain of autistic patients. J. Neuroimmunol. 2009;207:111–116. doi: 10.1016/j.jneuroim.2008.12.002. [DOI] [PMC free article] [PubMed] [Google Scholar]
- Lim A.I., McFadden T., Link V.M., Han S.J., Karlsson R.M., Stacy A., Farley T.K., Lima-Junior D.S., Harrison O.J., Desai J.V., et al. Prenatal maternal infection promotes tissue-specific immunity and inflammation in offspring. Science. 2021;373:eabf3002. doi: 10.1126/science.abf3002. [DOI] [PubMed] [Google Scholar]
- Lim C.P., Cao X. Serine phosphorylation and negative regulation of Stat3 by JNK. J. Biol. Chem. 1999;274:31055–31061. doi: 10.1074/jbc.274.43.31055. [DOI] [PubMed] [Google Scholar]
- Lipina T.V., Zai C., Hlousek D., Roder J.C., Wong A.H. Maternal immune activation during gestation interacts with Disc1 point mutation to exacerbate schizophrenia-related behaviors in mice. J. Neurosci. 2013;33:7654–7666. doi: 10.1523/JNEUROSCI.0091-13.2013. [DOI] [PMC free article] [PubMed] [Google Scholar]
- Lisman J. Excitation, inhibition, local oscillations, or large-scale loops: what causes the symptoms of schizophrenia? Curr. Opin. Neurobiol. 2012;22:537–544. doi: 10.1016/j.conb.2011.10.018. [DOI] [PMC free article] [PubMed] [Google Scholar]
- Liu H., Bai H., Hui E., Yang L., Evans C.S., Wang Z., Kwon S.E., Chapman E.R. Synaptotagmin 7 functions as a Ca2+-sensor for synaptic vesicle replenishment. Elife. 2014;3:e01524. doi: 10.7554/eLife.01524. [DOI] [PMC free article] [PubMed] [Google Scholar]
- Lodato S., Arlotta P. Generating neuronal diversity in the mammalian cerebral cortex. Annu. Rev. Cell Dev. Biol. 2015;31:699–720. doi: 10.1146/annurev-cellbio-100814-125353. [DOI] [PMC free article] [PubMed] [Google Scholar]
- Lodato S., Molyneaux B.J., Zuccaro E., Goff L.A., Chen H.H., Yuan W., Meleski A., Takahashi E., Mahony S., Rinn J.L., et al. Gene co-regulation by Fezf2 selects neurotransmitter identity and connectivity of corticospinal neurons. Nat. Neurosci. 2014;17:1046–1054. doi: 10.1038/nn.3757. [DOI] [PMC free article] [PubMed] [Google Scholar]
- Lu B., Wang K.H., Nose A. Molecular mechanisms underlying neural circuit formation. Curr. Opin. Neurobiol. 2009;19:162–167. doi: 10.1016/j.conb.2009.04.004. [DOI] [PMC free article] [PubMed] [Google Scholar]
- Malkova N.V., Yu C.Z., Hsiao E.Y., Moore M.J., Patterson P.H. Maternal immune activation yields offspring displaying mouse versions of the three core symptoms of autism. Brain Behav. Immun. 2012;26:607–616. doi: 10.1016/j.bbi.2012.01.011. [DOI] [PMC free article] [PubMed] [Google Scholar]
- Mancinelli S., Lodato S. Decoding neuronal diversity in the developing cerebral cortex: from single cells to functional networks. Curr. Opin. Neurobiol. 2018;53:146–155. doi: 10.1016/j.conb.2018.08.001. [DOI] [PubMed] [Google Scholar]
- Maritano D., Sugrue M.L., Tininini S., Dewilde S., Strobl B., Fu X., Murray-Tait V., Chiarle R., Poli V. The STAT3 isoforms alpha and beta have unique and specific functions. Nat. Immunol. 2004;5:401–409. doi: 10.1038/ni1052. [DOI] [PubMed] [Google Scholar]
- Markicevic M., Fulcher B.D., Lewis C., Helmchen F., Rudin M., Zerbi V., Wenderoth N. Cortical Excitation:Inhibition Imbalance Causes Abnormal Brain Network Dynamics as Observed in Neurodevelopmental Disorders. Cereb. Cortex. 2020;30:4922–4937. doi: 10.1093/cercor/bhaa084. [DOI] [PMC free article] [PubMed] [Google Scholar]
- Matteoli M., Verderio C., Krawzeski K., Mundigl O., Coco S., Fumagalli G., De Camilli P. Mechanisms of synaptogenesis in hippocampal neurons in primary culture. J. Physiol. Paris. 1995;89:51–55. doi: 10.1016/0928-4257(96)80551-1. [DOI] [PubMed] [Google Scholar]
- Maximov A., Pang Z.P., Tervo D.G., Südhof T.C. Monitoring synaptic transmission in primary neuronal cultures using local extracellular stimulation. J. Neurosci. Methods. 2007;161:75–87. doi: 10.1016/j.jneumeth.2006.10.009. [DOI] [PubMed] [Google Scholar]
- McAfoose J., Baune B.T. Evidence for a cytokine model of cognitive function. Neurosci. Biobehav. Rev. 2009;33:355–366. doi: 10.1016/j.neubiorev.2008.10.005. [DOI] [PubMed] [Google Scholar]
- McAllister A.K. Dynamic aspects of CNS synapse formation. Annu. Rev. Neurosci. 2007;30:425–450. doi: 10.1146/annurev.neuro.29.051605.112830. [DOI] [PMC free article] [PubMed] [Google Scholar]
- Melom J.E., Littleton J.T. Synapse development in health and disease. Curr. Opin. Genet. Dev. 2011;21:256–261. doi: 10.1016/j.gde.2011.01.002. [DOI] [PubMed] [Google Scholar]
- Missault S., Van den Eynde K., Vanden Berghe W., Fransen E., Weeren A., Timmermans J.P., Kumar-Singh S., Dedeurwaerdere S. The risk for behavioural deficits is determined by the maternal immune response to prenatal immune challenge in a neurodevelopmental model. Brain Behav. Immun. 2014;42:138–146. doi: 10.1016/j.bbi.2014.06.013. [DOI] [PubMed] [Google Scholar]
- Monje M.L., Toda H., Palmer T.D. Inflammatory blockade restores adult hippocampal neurogenesis. Science. 2003;302:1760–1765. doi: 10.1126/science.1088417. [DOI] [PubMed] [Google Scholar]
- Moore J.B., June C.H. Cytokine release syndrome in severe COVID-19. Science. 2020;368:473–474. doi: 10.1126/science.abb8925. [DOI] [PubMed] [Google Scholar]
- Munno D.W., Prince D.J., Syed N.I. Synapse number and synaptic efficacy are regulated by presynaptic cAMP and protein kinase A. J. Neurosci. 2003;23:4146–4155. doi: 10.1523/JNEUROSCI.23-10-04146.2003. [DOI] [PMC free article] [PubMed] [Google Scholar]
- Munoz-Suano A., Kallikourdis M., Sarris M., Betz A.G. Regulatory T cells protect from autoimmune arthritis during pregnancy. J. Autoimmun. 2012;38:J103–J108. doi: 10.1016/j.jaut.2011.09.007. [DOI] [PMC free article] [PubMed] [Google Scholar]
- Murase S., Kim E., Lin L., Hoffman D.A., McKay R.D. Loss of signal transducer and activator of transcription 3 (STAT3) signaling during elevated activity causes vulnerability in hippocampal neurons. J. Neurosci. 2012;32:15511–15520. doi: 10.1523/JNEUROSCI.2940-12.2012. [DOI] [PMC free article] [PubMed] [Google Scholar]
- Nelson S.B., Valakh V. Excitatory/Inhibitory Balance and Circuit Homeostasis in Autism Spectrum Disorders. Neuron. 2015;87:684–698. doi: 10.1016/j.neuron.2015.07.033. [DOI] [PMC free article] [PubMed] [Google Scholar]
- Ni Y.G., Gold S.J., Iredale P.A., Terwilliger R.Z., Duman R.S., Nestler E.J. Region-specific regulation of RGS4 (Regulator of G-protein-signaling protein type 4) in brain by stress and glucocorticoids: in vivo and in vitro studies. J. Neurosci. 1999;19:3674–3680. doi: 10.1523/JNEUROSCI.19-10-03674.1999. [DOI] [PMC free article] [PubMed] [Google Scholar]
- Nicolas C.S., Peineau S., Amici M., Csaba Z., Fafouri A., Javalet C., Collett V.J., Hildebrandt L., Seaton G., Choi S.L., et al. The Jak/STAT pathway is involved in synaptic plasticity. Neuron. 2012;73:374–390. doi: 10.1016/j.neuron.2011.11.024. [DOI] [PMC free article] [PubMed] [Google Scholar]
- Nomoto S., Adachi K., Yang L.X., Hirata Y., Muraguchi S., Kiuchi K. Distribution of RGS4 mRNA in mouse brain shown by in situ hybridization. Biochem. Biophys. Res. Commun. 1997;241:281–287. doi: 10.1006/bbrc.1997.7802. [DOI] [PubMed] [Google Scholar]
- O’Donnell C., Gonçalves J.T., Portera-Cailliau C., Sejnowski T.J. Beyond excitation/inhibition imbalance in multidimensional models of neural circuit changes in brain disorders. eLife. 2017;6:e26724. doi: 10.7554/eLife.26724. [DOI] [PMC free article] [PubMed] [Google Scholar]
- Onore C., Careaga M., Ashwood P. The role of immune dysfunction in the pathophysiology of autism. Brain Behav. Immun. 2012;26:383–392. doi: 10.1016/j.bbi.2011.08.007. [DOI] [PMC free article] [PubMed] [Google Scholar]
- Pagani M., Bertero A., Liska A., Galbusera A., Sabbioni M., Barsotti N., Colenbier N., Marinazzo D., Scattoni M.L., Pasqualetti M., Gozzi A. Deletion of Autism Risk Gene Shank3 Disrupts Prefrontal Connectivity. J. Neurosci. 2019;39:5299–5310. doi: 10.1523/JNEUROSCI.2529-18.2019. [DOI] [PMC free article] [PubMed] [Google Scholar]
- Pallaki P., Georganta E.M., Serafimidis I., Papakonstantinou M.P., Papanikolaou V., Koutloglou S., Papadimitriou E., Agalou A., Tserga A., Simeonof A., et al. A novel regulatory role of RGS4 in STAT5B activation, neurite outgrowth and neuronal differentiation. Neuropharmacology. 2017;117:408–421. doi: 10.1016/j.neuropharm.2017.02.012. [DOI] [PubMed] [Google Scholar]
- Park K.W., Nozell S.E., Benveniste E.N. Protective role of STAT3 in NMDA and glutamate-induced neuronal death: negative regulatory effect of SOCS3. PLoS ONE. 2012;7:e50874. doi: 10.1371/journal.pone.0050874. [DOI] [PMC free article] [PubMed] [Google Scholar]
- Paspalas C.D., Selemon L.D., Arnsten A.F. Mapping the regulator of G protein signaling 4 (RGS4): presynaptic and postsynaptic substrates for neuroregulation in prefrontal cortex. Cereb. Cortex. 2009;19:2145–2155. doi: 10.1093/cercor/bhn235. [DOI] [PMC free article] [PubMed] [Google Scholar]
- Pelkey K.A., Chittajallu R., Craig M.T., Tricoire L., Wester J.C., McBain C.J. Hippocampal GABAergic Inhibitory Interneurons. Physiol. Rev. 2017;97:1619–1747. doi: 10.1152/physrev.00007.2017. [DOI] [PMC free article] [PubMed] [Google Scholar]
- Penzes P., Cahill M.E., Jones K.A., VanLeeuwen J.E., Woolfrey K.M. Dendritic spine pathology in neuropsychiatric disorders. Nat. Neurosci. 2011;14:285–293. doi: 10.1038/nn.2741. [DOI] [PMC free article] [PubMed] [Google Scholar]
- Pieraut S., Lucas O., Sangari S., Sar C., Boudes M., Bouffi C., Noel D., Scamps F. An autocrine neuronal interleukin-6 loop mediates chloride accumulation and NKCC1 phosphorylation in axotomized sensory neurons. J. Neurosci. 2011;31:13516–13526. doi: 10.1523/JNEUROSCI.3382-11.2011. [DOI] [PMC free article] [PubMed] [Google Scholar]
- Potvin S., Stip E., Sepehry A.A., Gendron A., Bah R., Kouassi E. Inflammatory cytokine alterations in schizophrenia: a systematic quantitative review. Biol. Psychiatry. 2008;63:801–808. doi: 10.1016/j.biopsych.2007.09.024. [DOI] [PubMed] [Google Scholar]
- Pozzi D., Lignani G., Ferrea E., Contestabile A., Paonessa F., D’Alessandro R., Lippiello P., Boido D., Fassio A., Meldolesi J., et al. REST/NRSF-mediated intrinsic homeostasis protects neuronal networks from hyperexcitability. EMBO J. 2013;32:2994–3007. doi: 10.1038/emboj.2013.231. [DOI] [PMC free article] [PubMed] [Google Scholar]
- Reemst K., Noctor S.C., Lucassen P.J., Hol E.M. The Indispensable Roles of Microglia and Astrocytes during Brain Development. Front. Hum. Neurosci. 2016;10:566. doi: 10.3389/fnhum.2016.00566. [DOI] [PMC free article] [PubMed] [Google Scholar]
- Rothaug M., Becker-Pauly C., Rose-John S. The role of interleukin-6 signaling in nervous tissue. Biochim. Biophys. Acta. 2016;1863(6 Pt A):1218–1227. doi: 10.1016/j.bbamcr.2016.03.018. [DOI] [PubMed] [Google Scholar]
- Rudolph M.D., Graham A.M., Feczko E., Miranda-Dominguez O., Rasmussen J.M., Nardos R., Entringer S., Wadhwa P.D., Buss C., Fair D.A. Maternal IL-6 during pregnancy can be estimated from newborn brain connectivity and predicts future working memory in offspring. Nat. Neurosci. 2018;21:765–772. doi: 10.1038/s41593-018-0128-y. [DOI] [PMC free article] [PubMed] [Google Scholar]
- Sala C., Piëch V., Wilson N.R., Passafaro M., Liu G., Sheng M. Regulation of dendritic spine morphology and synaptic function by Shank and Homer. Neuron. 2001;31:115–130. doi: 10.1016/s0896-6273(01)00339-7. [DOI] [PubMed] [Google Scholar]
- Sandelin A., Alkema W., Engström P., Wasserman W.W., Lenhard B. JASPAR: an open-access database for eukaryotic transcription factor binding profiles. Nucleic Acids Res. 2004;32:D91–D94. doi: 10.1093/nar/gkh012. [DOI] [PMC free article] [PubMed] [Google Scholar]
- Sando R., Südhof T.C. Latrophilin GPCR signaling mediates synapse formation. eLife. 2021;10:e65717. doi: 10.7554/eLife.65717. [DOI] [PMC free article] [PubMed] [Google Scholar]
- Sawada M., Itoh Y., Suzumura A., Marunouchi T. Expression of cytokine receptors in cultured neuronal and glial cells. Neurosci. Lett. 1993;160:131–134. doi: 10.1016/0304-3940(93)90396-3. [DOI] [PubMed] [Google Scholar]
- Schumacher N., Meyer D., Mauermann A., von der Heyde J., Wolf J., Schwarz J., Knittler K., Murphy G., Michalek M., Garbers C., et al. Shedding of Endogenous Interleukin-6 Receptor (IL-6R) Is Governed by A Disintegrin and Metalloproteinase (ADAM) Proteases while a Full-length IL-6R Isoform Localizes to Circulating Microvesicles. J. Biol. Chem. 2015;290:26059–26071. doi: 10.1074/jbc.M115.649509. [DOI] [PMC free article] [PubMed] [Google Scholar]
- Schust J., Sperl B., Hollis A., Mayer T.U., Berg T. Stattic: a small-molecule inhibitor of STAT3 activation and dimerization. Chem. Biol. 2006;13:1235–1242. doi: 10.1016/j.chembiol.2006.09.018. [DOI] [PubMed] [Google Scholar]
- Schwarz E. A gene-based review of RGS4 as a putative risk gene for psychiatric illness. American journal of medical genetics. Am. J. Med. Genet. B Neuropsychiatr. Genet. 2018;177:267–273. doi: 10.1002/ajmg.b.32547. [DOI] [PubMed] [Google Scholar]
- Shelly M., Lim B.K., Cancedda L., Heilshorn S.C., Gao H., Poo M.M. Local and long-range reciprocal regulation of cAMP and cGMP in axon/dendrite formation. Science. 2010;327:547–552. doi: 10.1126/science.1179735. [DOI] [PubMed] [Google Scholar]
- Shen K., Scheiffele P. Genetics and cell biology of building specific synaptic connectivity. Annu. Rev. Neurosci. 2010;33:473–507. doi: 10.1146/annurev.neuro.051508.135302. [DOI] [PMC free article] [PubMed] [Google Scholar]
- Shin Yim Y., Park A., Berrios J., Lafourcade M., Pascual L.M., Soares N., Yeon Kim J., Kim S., Kim H., Waisman A., et al. Reversing behavioural abnormalities in mice exposed to maternal inflammation. Nature. 2017;549:482–487. doi: 10.1038/nature23909. [DOI] [PMC free article] [PubMed] [Google Scholar]
- Shirts B.H., Nimgaonkar V. The genes for schizophrenia: finally a breakthrough? Curr. Psychiatry Rep. 2004;6:303–312. doi: 10.1007/s11920-004-0081-1. [DOI] [PubMed] [Google Scholar]
- Smith S.E., Li J., Garbett K., Mirnics K., Patterson P.H. Maternal immune activation alters fetal brain development through interleukin-6. J. Neurosci. 2007;27:10695–10702. doi: 10.1523/JNEUROSCI.2178-07.2007. [DOI] [PMC free article] [PubMed] [Google Scholar]
- Sohal V.S., Rubenstein J.L.R. Excitation-inhibition balance as a framework for investigating mechanisms in neuropsychiatric disorders. Mol. Psychiatry. 2019;24:1248–1257. doi: 10.1038/s41380-019-0426-0. [DOI] [PMC free article] [PubMed] [Google Scholar]
- Spann M.N., Monk C., Scheinost D., Peterson B.S. Maternal Immune Activation During the Third Trimester Is Associated with Neonatal Functional Connectivity of the Salience Network and Fetal to Toddler Behavior. J. Neurosci. 2018;38:2877–2886. doi: 10.1523/JNEUROSCI.2272-17.2018. [DOI] [PMC free article] [PubMed] [Google Scholar]
- Supek F., Bošnjak M., Škunca N., Šmuc T. REVIGO summarizes and visualizes long lists of gene ontology terms. PLoS ONE. 2011;6:e21800. doi: 10.1371/journal.pone.0021800. [DOI] [PMC free article] [PubMed] [Google Scholar]
- Supekar K., Uddin L.Q., Khouzam A., Phillips J., Gaillard W.D., Kenworthy L.E., Yerys B.E., Vaidya C.J., Menon V. Brain hyperconnectivity in children with autism and its links to social deficits. Cell Rep. 2013;5:738–747. doi: 10.1016/j.celrep.2013.10.001. [DOI] [PMC free article] [PubMed] [Google Scholar]
- Takeda K., Noguchi K., Shi W., Tanaka T., Matsumoto M., Yoshida N., Kishimoto T., Akira S. Targeted disruption of the mouse Stat3 gene leads to early embryonic lethality. Proc. Natl. Acad. Sci. USA. 1997;94:3801–3804. doi: 10.1073/pnas.94.8.3801. [DOI] [PMC free article] [PubMed] [Google Scholar]
- Talkowski M.E., Seltman H., Bassett A.S., Brzustowicz L.M., Chen X., Chowdari K.V., Collier D.A., Cordeiro Q., Corvin A.P., Deshpande S.N., et al. Evaluation of a susceptibility gene for schizophrenia: genotype based meta-analysis of RGS4 polymorphisms from thirteen independent samples. Biol. Psychiatry. 2006;60:152–162. doi: 10.1016/j.biopsych.2006.02.015. [DOI] [PMC free article] [PubMed] [Google Scholar]
- Timper K., Denson J.L., Steculorum S.M., Heilinger C., Engström-Ruud L., Wunderlich C.M., Rose-John S., Wunderlich F.T., Brüning J.C. IL-6 Improves Energy and Glucose Homeostasis in Obesity via Enhanced Central IL-6 trans-Signaling. Cell Rep. 2017;19:267–280. doi: 10.1016/j.celrep.2017.03.043. [DOI] [PubMed] [Google Scholar]
- Tomassy G.S., Lodato S., Trayes-Gibson Z., Arlotta P. Development and regeneration of projection neuron subtypes of the cerebral cortex. Sci. Prog. 2010;93:151–169. doi: 10.3184/003685010X12705764469952. [DOI] [PMC free article] [PubMed] [Google Scholar]
- Urbán N., Guillemot F. Neurogenesis in the embryonic and adult brain: same regulators, different roles. Front. Cell. Neurosci. 2014;8:396. doi: 10.3389/fncel.2014.00396. [DOI] [PMC free article] [PubMed] [Google Scholar]
- Vallières L., Campbell I.L., Gage F.H., Sawchenko P.E. Reduced hippocampal neurogenesis in adult transgenic mice with chronic astrocytic production of interleukin-6. J. Neurosci. 2002;22:486–492. doi: 10.1523/JNEUROSCI.22-02-00486.2002. [DOI] [PMC free article] [PubMed] [Google Scholar]
- Velazquez-Salinas L., Verdugo-Rodriguez A., Rodriguez L.L., Borca M.V. The Role of Interleukin 6 During Viral Infections. Front. Microbiol. 2019;10:1057. doi: 10.3389/fmicb.2019.01057. [DOI] [PMC free article] [PubMed] [Google Scholar]
- Vereyken E.J., Bajova H., Chow S., de Graan P.N., Gruol D.L. Chronic interleukin-6 alters the level of synaptic proteins in hippocampus in culture and in vivo. Eur. J. Neurosci. 2007;25:3605–3616. doi: 10.1111/j.1460-9568.2007.05615.x. [DOI] [PubMed] [Google Scholar]
- Wallenius V., Wallenius K., Ahrén B., Rudling M., Carlsten H., Dickson S.L., Ohlsson C., Jansson J.O. Interleukin-6-deficient mice develop mature-onset obesity. Nat. Med. 2002;8:75–79. doi: 10.1038/nm0102-75. [DOI] [PubMed] [Google Scholar]
- Wastnedge E.A.N., Reynolds R.M., van Boeckel S.R., Stock S.J., Denison F.C., Maybin J.A., Critchley H.O.D. Pregnancy and COVID-19. Physiol. Rev. 2021;101:303–318. doi: 10.1152/physrev.00024.2020. [DOI] [PMC free article] [PubMed] [Google Scholar]
- Weidler M., Rether J., Anke T., Erkel G. Inhibition of interleukin-6 signaling by galiellalactone. FEBS Lett. 2000;484:1–6. doi: 10.1016/s0014-5793(00)02115-3. [DOI] [PubMed] [Google Scholar]
- Wen Z., Zhong Z., Darnell J.E., Jr. Maximal activation of transcription by Stat1 and Stat3 requires both tyrosine and serine phosphorylation. Cell. 1995;82:241–250. doi: 10.1016/0092-8674(95)90311-9. [DOI] [PubMed] [Google Scholar]
- Wierenga C.J., Walsh M.F., Turrigiano G.G. Temporal regulation of the expression locus of homeostatic plasticity. J. Neurophysiol. 2006;96:2127–2133. doi: 10.1152/jn.00107.2006. [DOI] [PubMed] [Google Scholar]
- Williams M.E., de Wit J., Ghosh A. Molecular mechanisms of synaptic specificity in developing neural circuits. Neuron. 2010;68:9–18. doi: 10.1016/j.neuron.2010.09.007. [DOI] [PMC free article] [PubMed] [Google Scholar]
- Willis E.F., MacDonald K.P.A., Nguyen Q.H., Garrido A.L., Gillespie E.R., Harley S.B.R., Bartlett P.F., Schroder W.A., Yates A.G., Anthony D.C., et al. Repopulating Microglia Promote Brain Repair in an IL-6-Dependent Manner. Cell. 2020;180:833–846.e16. doi: 10.1016/j.cell.2020.02.013. [DOI] [PubMed] [Google Scholar]
- Xiong Q., Oviedo H.V., Trotman L.C., Zador A.M. PTEN regulation of local and long-range connections in mouse auditory cortex. J. Neurosci. 2012;32:1643–1652. doi: 10.1523/JNEUROSCI.4480-11.2012. [DOI] [PMC free article] [PubMed] [Google Scholar]
- York E.M., LeDue J.M., Bernier L.P., MacVicar B.A. 3DMorph Automatic Analysis of Microglial Morphology in Three Dimensions from Ex Vivo and In Vivo Imaging. eNeuro. 2018;5 doi: 10.1523/ENEURO.0266-18.2018. ENEURO.0266-18.2018. [DOI] [PMC free article] [PubMed] [Google Scholar]
- Yu G., Wang L.G., Han Y., He Q.Y. clusterProfiler: an R package for comparing biological themes among gene clusters. OMICS. 2012;16:284–287. doi: 10.1089/omi.2011.0118. [DOI] [PMC free article] [PubMed] [Google Scholar]
- Yu H., Pardoll D., Jove R. STATs in cancer inflammation and immunity: a leading role for STAT3. Nat. Rev. Cancer. 2009;9:798–809. doi: 10.1038/nrc2734. [DOI] [PMC free article] [PubMed] [Google Scholar]
- Zaslavsky K., Zhang W.B., McCready F.P., Rodrigues D.C., Deneault E., Loo C., Zhao M., Ross P.J., El Hajjar J., Romm A., et al. SHANK2 mutations associated with autism spectrum disorder cause hyperconnectivity of human neurons. Nat. Neurosci. 2019;22:556–564. doi: 10.1038/s41593-019-0365-8. [DOI] [PMC free article] [PubMed] [Google Scholar]
- Zerbi V., Grandjean J., Rudin M., Wenderoth N. Mapping the mouse brain with rs-fMRI: An optimized pipeline for functional network identification. Neuroimage. 2015;123:11–21. doi: 10.1016/j.neuroimage.2015.07.090. [DOI] [PubMed] [Google Scholar]
- Zerbi V., Ielacqua G.D., Markicevic M., Haberl M.G., Ellisman M.H. Dysfunctional Autism Risk Genes Cause Circuit-Specific Connectivity Deficits With Distinct Developmental Trajectories. Cereb. Cortex. 2018;28:2495–2506. doi: 10.1093/cercor/bhy046. [DOI] [PMC free article] [PubMed] [Google Scholar]
- Zerbi V., Jansen D., Dederen P.J., Veltien A., Hamans B., Liu Y., Heerschap A., Kiliaan A.J. Microvascular cerebral blood volume changes in aging APP(swe)/PS1(dE9) AD mouse model: a voxel-wise approach. Brain Struct. Funct. 2013;218:1085–1098. doi: 10.1007/s00429-012-0448-8. [DOI] [PubMed] [Google Scholar]
- Zerbi V., Kleinnijenhuis M., Fang X., Jansen D., Veltien A., Van Asten J., Timmer N., Dederen P.J., Kiliaan A.J., Heerschap A. Gray and white matter degeneration revealed by diffusion in an Alzheimer mouse model. Neurobiol. Aging. 2013;34:1440–1450. doi: 10.1016/j.neurobiolaging.2012.11.017. [DOI] [PubMed] [Google Scholar]
- Zerbi V., Markicevic M., Gasparini F., Schroeter A., Rudin M., Wenderoth N. Inhibiting mGluR5 activity by AFQ056/Mavoglurant rescues circuit-specific functional connectivity in Fmr1 knockout mice. Neuroimage. 2019;191:392–402. doi: 10.1016/j.neuroimage.2019.02.051. [DOI] [PubMed] [Google Scholar]
- Zhang M., Ergin V., Lin L., Stork C., Chen L., Zheng S. Axonogenesis Is Coordinated by Neuron-Specific Alternative Splicing Programming and Splicing Regulator PTBP2. Neuron. 2019;101:690–706.e10. doi: 10.1016/j.neuron.2019.01.022. [DOI] [PMC free article] [PubMed] [Google Scholar]
- Zhang Z., Ye M., Li Q., You Y., Yu H., Ma Y., Mei L., Sun X., Wang L., Yue W., et al. The Schizophrenia Susceptibility Gene OPCML Regulates Spine Maturation and Cognitive Behaviors through Eph-Cofilin Signaling. Cell Rep. 2019;29:49–61.e7. doi: 10.1016/j.celrep.2019.08.091. [DOI] [PubMed] [Google Scholar]
- Zheng X., Boyer L., Jin M., Mertens J., Kim Y., Ma L., Ma L., Hamm M., Gage F.H., Hunter T. Metabolic reprogramming during neuronal differentiation from aerobic glycolysis to neuronal oxidative phosphorylation. eLife. 2016;5:e13374. doi: 10.7554/eLife.13374. [DOI] [PMC free article] [PubMed] [Google Scholar]
- Zhong S., Ding W., Sun L., Lu Y., Dong H., Fan X., Liu Z., Chen R., Zhang S., Ma Q., et al. Decoding the development of the human hippocampus. Nature. 2020;577:531–536. doi: 10.1038/s41586-019-1917-5. [DOI] [PubMed] [Google Scholar]
- Zhou F., Yu T., Du R., Fan G., Liu Y., Liu Z., Xiang J., Wang Y., Song B., Gu X., et al. Clinical course and risk factors for mortality of adult inpatients with COVID-19 in Wuhan, China: a retrospective cohort study. Lancet. 2020;395:1054–1062. doi: 10.1016/S0140-6736(20)30566-3. [DOI] [PMC free article] [PubMed] [Google Scholar]
- Zhou Y., Sharma J., Ke Q., Landman R., Yuan J., Chen H., Hayden D.S., Fisher J.W., 3rd, Jiang M., Menegas W., et al. Atypical behaviour and connectivity in SHANK3-mutant macaques. Nature. 2019;570:326–331. doi: 10.1038/s41586-019-1278-0. [DOI] [PubMed] [Google Scholar]
- Zuccaro E., Murek V., Kim K., Chen H.-H., Mancinelli S., Oyler-Castrillo P., Jiménez-Barrón L.T., Gerhardinger C., Brown J.R., Byrnes A., et al. Human-specific enrichment of schizophrenia risk-genes in callosal neurons of the developing neocortex. bioRxiv. 2021 doi: 10.1101/2021.09.10.459747. [DOI] [Google Scholar]
Associated Data
This section collects any data citations, data availability statements, or supplementary materials included in this article.
Supplementary Materials
Data Availability Statement
All datasets related to single-cell RNA sequencing have been deposited at GEO and are publicly available as of the date of publication, GEO: GSE180345. Accession numbers are listed in the Key resources table.
This paper does not report original code.
Any additional information required to reanalyze the data reported in this paper is available from the lead contact upon request. Raw data from Figures 1 and 5 and Figures S1, S2, S4, S5, S6, and S7 were deposited on Mendeley Data at https://doi.org/10.17632/5vpsd5d9zw.1