

Abstract
Purpose
Primary open‐angle glaucoma (POAG) has been reported to occur more frequently in Africans, and to follow a more severe course compared to Europeans. We aimed to describe characteristics of POAG presentation and treatment across three ethnic groups from Africa and one from Europe.
Methods
We ascertained 151 POAG patients from South African Coloured (SAC) and 94 South African Black (SAB) ethnicity from a university hospital in South Africa. In Tanzania, 310 patients were recruited from a university hospital and a referral hospital. In the Netherlands, 241 patients of European ancestry were included. All patients were over 35 years old and had undergone an extensive ophthalmic examination. Patients were diagnosed according to the ISGEO criteria. A biogeographic ancestry analysis was performed to estimate the proportion of genetic African ancestry (GAA).
Results
The biogeographic ancestry analysis showed that the median proportion of GAA was 97.6% in Tanzanian, 100% in SAB, 34.2% in SAC and 1.5% in Dutch participants. Clinical characteristics at presentation for Tanzanians, SAB, SAC and Dutch participants, respectively: mean age: 63, 57, 66, 70 years (p < 0.001); visual acuity in the worse eye: 1.78, 1.78, 0.3, 0.3 LogMAR (p < 0.001); maximum intraocular pressure of both eyes: 36, 34, 29, 29 mmHg (p anova < 0.001); maximum vertical cup to disc ratio (VCDR) of both eyes: 0.90, 0.90, 0.84, 0.83 (p < 0.001); mean central corneal thickness: 506, 487, 511, 528 μm (p < 0.001). Fourteen percent of Tanzanian patients presented with blindness (<3/60 Snellen) in the better eye in contrast to only 1% in the Dutch.
Conclusion
In this multi‐ethnic comparative study, Sub‐Saharan Africans present at a younger age with lower visual acuity, higher IOP, larger VCDR, than SAC and Dutch participants. This indicates the more progressive and destructive course in Sub‐Saharan Africans.
Keywords: Africa, Europe, glaucoma, primary open‐angle glaucoma, South Africa, Tanzania
Introduction
Glaucoma, a heterogeneous group of eye disorders leading to neurodegeneration of the optic nerve, is a leading cause of irreversible blindness in the world. Various epidemiologic studies have demonstrated that primary open‐angle glaucoma (POAG) prevalence is the highest in persons from sub‐Saharan African (SSA) ancestry. In 2015, there were an estimated 10 million African people suffering from POAG, compared to 58 million people worldwide (Kapetanakis et al. 2016). People from SSA ancestry are three times more likely to develop POAG than Europeans (Tham et al. 2014). The prevalence of POAG is not only higher in the Africa‐derived population, blindness is also four times more frequent in African glaucoma patients compared to Western Europeans (Kyari et al. 2013). Known risk factors to explain the poor visual prognosis in these patients are as follows: little disease awareness, poor adherence to treatment and reluctance to the acceptance of surgery. Factors causing a delay in adequate glaucoma treatment are limited affordability, accessibility and availability of eye care and medication. These socio‐economic and socio‐geographic conditions may explain a part of the poor visual prognosis in people from SSA ancestry, but an earlier onset and more severe disease course have also been implicated as possible risk factors in POAG (Wilensky et al. 1978; Martin et al. 1985; Wilson et al. 1985).
In this study, we evaluated the ethnic risk factor for POAG and the influence of a poor healthcare system in developing countries on the visual prognosis in POAG. We compared the clinical characteristics of POAG presentation across three ethnic groups from SSA (one from Tanzania and two from South Africa) ancestry and one European population (the Netherlands).
Methods
Study population
Genetics in glaucoma patients of African descent (GIGA) study
The GIGA study is a case‐control study comprising open‐angle glaucoma patients and healthy subjects from South Africa and Tanzania. The study was conducted in a clinical setting and participants were ascertained at the ophthalmology clinics of the Groote Schuur Hospital in Cape Town, South Africa and from two hospitals in Tanzania: Muhimbili National Hospital and CCBRT Disability Hospital in Dar es Salaam. In all hospitals, the study was incorporated in the daily clinical routine and participants were recruited consecutively from the outpatient department (general and glaucoma clinics). Participants were examined by a local glaucoma specialist for eligibility. In total, 697 patients met the inclusion criteria of the study. Inclusion criteria were as follows: participants of South African Black (SAB), admixed South African Coloured (SAC; Adhikari 2005) and Tanzanian descent, over 35 years of age, and diagnosed with POAG according to the International Society of Geographical and Epidemiological Ophthalmology (ISGEO) classification (Foster et al. 2002). All other types of glaucoma, including secondary causes or narrow/closed angle glaucoma were excluded. Control subjects that were simultaneously recruited have not been analysed in the current study.
All participants provided written informed consent in accordance with the ethical standards as stated in the Declaration of Helsinki. The study protocol for the GIGA study was approved by the Institutional review boards of the Erasmus MC, Muhimbili University of Health and Allied Sciences, and the University of Cape Town. Additionally, the Medical Research Coordination Committee of the Tanzania National Institute for Medical Research (NIMR) accepted the study protocol.
Groningen longitudinal glaucoma study (GLGS)
A sample of 241 white European ancestry POAG cases was drawn from the Groningen Longitudinal Glaucoma Study (GLGS), a prospective cohort study performed in a clinical setting. The objectives, methods, rationale and study design have been described earlier (Heeg et al. 2005). Briefly, the GLGS is an institutional review board‐approved observational prospective follow‐up study of 875 patients with established or suspect glaucoma who visited the glaucoma outpatient service of the University Medical Center Groningen between July 1, 2000 and June 30, 2001 and who provided informed consent, in accordance with the declaration of Helsinki. The study included conventional perimetry, frequency doubling technique perimetry (FDT; Carl Zeiss Meditec AG, Jena, Germany) and laser polarimetry (GDx; Laser Diagnostic Technologies, San Diego, CA). Out of the initial 875 patients, 452 were classified as having glaucoma (including primary and secondary open angle and angle closure glaucoma). Of these 452 patients with glaucoma, the disease in 372 of them was classified by using standard automated perimetry [Humphrey Field Analyzer (HFA); Carl Zeiss Meditec Inc., Dublin, CA, USA]. The Goldmann perimeter (Haag Streit AG, Bern, Switzerland) was used in 80 patients, who were excluded from this analysis. For the aim of the current study, only European ancestry POAG cases diagnosed according to ISGEO Category 1 diagnosis were included in the analysis, leaving 241 patients.
Estimation of genetic ancestry
To determine the proportion of genetic African ancestry in the GIGA study participants, all POAG patients were genotyped using either Illumina HumanOmniExpressExome or the Illumina HumanOmni2.5Exome beadchip. The full procedures of this analysis have been described earlier (Bonnemaijer et al. 2017). In brief, the genotypes of the GIGA samples were merged with reference populations from the 1000 Genomes project phase 3. Unlinked single nucleotide polymorphisms were selected and used for biographic ancestry estimation using the program admixture (v 1.23) for K = 3 putative ancestral populations (African, European and Asian) (Alexander et al. 2009).
For the GLGS cohort, admixture (v 1.3) was used to estimate the ancestry components (Alexander et al. 2009). This cohort was genotyped using Global Screening Array Beadchip and its samples were merged with reference populations from the 1000 Genomes project phase 3. The procedure to calculate the biographic ancestry was similar to the methods applied in the GIGA study, as described above.
Ophthalmic examination in the GIGA study
The complete eye examination in GIGA included visual acuity (VA) by Snellen or Tumbling E chart at 6 m with and without refractive correction, intraocular pressure (IOP) measurement with Goldmann applanation tonometry, slit‐lamp examination including peripheral anterior chamber depth assessment by the Van Herick method, indirect gonioscopy, fundoscopy for optic nerve head examination and digital fundus photography centred on the optic nerve by means of a Canon CF‐60DSi (Canon Inc, Tokio, Japan) fundus camera (South Africa) or Optomed Smartscope® M5 EY3 (Optomed Ltd, Oulu, Finland) handheld fundus camera (Tanzania).
Central corneal thickness (CCT) was measured after topical instillation of anaesthesia with an ultrasound pachymeter. In South Africa, 10 readings were automatically captured in both eyes with an A‐scan/pachymeter OcuScan RxP (Alcon Laboratories, Inc., Ft. Worth, TX, USA). In Tanzania, the handheld ultrasonic pachymeter Palmscan® P2000FP (Micro Medical Devices Inc, Calabasas, CA, USA) was used and five readings were taken manually in both eyes. As the intra‐individual variance was small, and to conform with the CCT measurement methods applied in GLGS these values were averaged.
Visual field testing was performed, VA permitting, with either the Sita Fast strategy (Humphrey Field Analyzer (HFA) 24‐2, Carl Zeiss Meditec, Inc., Dublin, CA, USA) or fast threshold strategy (Medmont M700 perimeter, Medmont, Camberwell, Victoria, Australia Studio and Optopol PTS 1000, Optopol Technology, Zawiercie, Poland). A definite visual field defect consistent with glaucoma was defined if the glaucoma hemifield test graded ‘outside normal limits’ or if a cluster of three contiguous points was observed at the 5% level of the pattern deviation plot, including at least one of these points < 1%. Visual field defects were not attributed to glaucoma in the presence of media opacities or non‐glaucomatous disease that could explain the visual field abnormality.
All relevant clinical data relating to the ophthalmic history, course of POAG, presence of other types of glaucoma, treatment and any eye operations were collected and recorded from the medical charts. Lastly, a questionnaire was filled out by an English/Kiswahili speaking interviewer covering demographic data, self‐reported ethnicity, medication, family history and medical history.
Ophthalmic examination in GLGS
The complete eye examination in GLGS included a VA by Snellen with and without refractive correction, IOP measurement with Goldmann applanation tonometry, slit‐lamp examination including gonioscopy, and fundoscopy for optic nerve head (ONH) examination. The ONH was described by using the VCDR as long as the rim was uninterrupted; if interrupted the ONH classified as having a notch (interrupted either inferiorly or superiorly) or (sub) total excavation (interrupted both inferiorly or superiorly). The CCT was measured with an ultrasound pachymeter (Tomey SP‐3000; Tomey Ltd, Nagoya, Japan) after the topical instillation of an anaesthetic eye drop. The standard white on white HFA 30–2 Sita Fast algorithm was used for perimetric testing (Carl Zeiss Meditec Inc.).
Classification of a definite visual field defect consistent with glaucoma was defined as in the GIGA study (see aforementioned criteria). Patients with a reproducible visual field defect in at least one eye were classified as glaucoma patients. The first test, however, was left out of consideration because of any learning effects. Therefore, at least three visual fields were required for the diagnosis of glaucoma.
Inclusion criteria
All patients (GIGA + GLGS) were categorized as glaucomatous according to the ISGEO classification for open‐angle glaucoma (Foster et al. 2002). In GIGA, detailed grading of the ONH was performed by one general ophthalmologist (AAT) and one glaucoma specialist (HGL). They independently interpreted fundus images and visual field results while being masked to other clinical information. In case of any discrepancy between the two graders, adjudication was solved by consensus. If no consensus was reached, participants were excluded. In GLGS, all visual fields were assessed by two independent graders, being a general ophthalmologist (GPH) and a glaucoma specialist (NMJ). Any discrepancies were discussed and solved by consensus. The ONH was assessed clinically by one of three glaucoma experts (NMJ, LJB, PH; for further details, see Heeg et al 2005). The original visual field and ONH classifications were integrated into ISGEO classification for the current study.
Category 1 or 2 ISGEO criteria were required for the diagnosis of glaucoma. The highest level of evidence (Category 1 diagnosis) requires a definite visual field defect, as mentioned above, and loss of the neuroretinal rim with a VCDR ≥ 0.7, or VCDR asymmetry ≥ 0.2 (both values represented the 97.5th percentile for the normal population (Buhrmann et al. 2000; Wolfs et al. 2000; Rotchford et al. 2003). Category 2 diagnosis requires a severely damaged ONH in the absence of a visual field test, that is, a VCDR ≥ 0.8 or VCDR asymmetry ≥ 0.3 (both values determined by the 99.5th percentile for the normal population (Buhrmann et al. 2000; Wolfs et al. 2000; Rotchford et al. 2003). In addition, patients with POAG demonstrated an open angle on gonioscopy.
Data analysis
Two time points play a role in our study: the time at which the patient presented with glaucoma at one of the recruitment hospitals, further referred to as ‘presentation’ and the time at which the patient was included in the study further referred to as ‘inclusion’. To describe the mode of presentation, data on age at presentation, IOP, VCDR and visual acuity were collected from the medical charts going back to the timepoint the patient was newly diagnosed with POAG. At inclusion additional information was recorded,that is age at inclusion, CCT, family history, medical history (Diabetes mellitus, cardiovascular disease) and the medical file was reviewed to collect information on glaucoma surgeries and treatment that has taken place in the time interval from presentation to inclusion. In some cases, presentation and inclusion coincided. In the GIGA study 298 (53.7%) patients and in the GLGS 67 (27.8%) patients were included in the study within one year from presentation. For IOP and VCDR the maximum value of both eyes was used in the analysis. For CCT the average of both eyes was taken.
Statistical analysis
Quantitative differences measured on a continuous scale between ethnic groups were analysed by one‐way analysis of variance (anova) and when reported statistically significant followed up with a Tukey’s D post hoc test. For variables in which the homogeneity of variance assumption between the groups was violated, a Welch’s anova test was conducted. Statistically significant Welch anova results were followed up by a Games–Howell post‐hoc test. Variables that did not follow a parametric distribution were analysed by Kruskal–Wallis H test. The medians of the Kruskal–Wallis H test were interpreted when the distributions were similar for all ethnic groups. Interquartile ranges are reported as first to third quartile defined by the Tukey hinge method. Statistical analysis was performed with spss Statistics 24 (SPSS, Chicago, IL, USA) and rstudio (RStudio: Integrated Development Environment for R. RStudio, PBC, Boston, MA URL http://www.rstudio.com/).
Results
Of the 743 glaucoma patients enrolled in the GIGA study, 555 patients met the ISGEO criteria (Category 1 diagnosis: 230 patients; Category 2 diagnosis: 325 patients) after review of fundus photos and visual field results, and these 555 were included in the current analysis. They comprised of 310 Tanzanian, 94 South African black (SAB) and 151 South African Coloured (SAC) POAG patients. For the GLGS, all 241 included subjects had an ISGEO Category 1 diagnosis. We assessed the proportion of genetic African ancestry among the GIGA patients. The median proportion of genetic African ancestry was similar in the Tanzanian and SAB groups (97.6% and 100% respectively) but was greatly reduced in the SAC group (34.2%), as was to be expected from an admixed population. In the Dutch patients from GLGS, the median proportion of genetic European ancestry was 97.4% and the African ancestry was 1.5%.
Clinical characteristics of POAG presentation
The clinical characteristics of POAG presentation (i.e. the time the patient presented at the hospital and was diagnosed with POAG) in Tanzanians, SAB, SAC and the Dutch are presented in Table 1. The mean age was statically significant different between the four ethnic groups (p < 0.001) and ranged from 57.0 years in SAB patients to 69.7 years in the Dutch (Fig. 1A). In particular Tanzanian and SAB patients presented at younger age compared to SAC and Dutch patients. The maximal IOP of both eyes was the highest in the Tanzanian group (36.2 mmHg) and the IOP was statically significantly higher in Tanzanian and SAB compared to SAC and the Dutch (Fig. 1B). The maximal VCDR of both eyes was statistically significant different between the four ethnic groups (p < 0.001) and ranged from 0.80 in SAC and Dutch patients to 0.90 in Tanzanian and SAB patients (Fig. 1C). Tanzanians (1.78 LogMar) and SAB (1.78 LogMar) patients had a statistically significantly worse visual acuity in the worse‐seeing eye than the SAC (0.30 LogMar) and Dutch (0.30 LogMar) patients (Fig. 1E). The visual acuity in the better‐seeing eye was statically significant higher in the Dutch (0.00 LogMar) than in the three African ancestral groups (Fig. 1F). To eliminate bias due to other causes of reduced vision we executed a sensitivity analysis by excluding all subjects with an additional diagnosis that might have affected their visual acuity (e.g cataract) or had a cataract operation between presentation and inclusion in the study. For Tanzanian and SAC patients, the median visual acuity in the worse‐seeing eye did not change after excluding probable other causes of vision loss (being 1.78 LogMar (IQR 0.5–2.5) and 0.3 LogMar (IQR 0.2–0.6), respectively). After excluding other probable causes of vision loss in the SAB and Dutch group, the median visual acuity in the worse‐seeing eye at presentation improved to 0.89 LogMar (IQR 0.3–2.5; not significant) and 0.2 LogMar (IQR 0.0–0.3; p < 0.05), respectively. The mean visual acuity in the better‐seeing eye did not change after excluding other causes of vision loss. Binocular blindness at presentation, defined by WHO criteria as a VA < 3/60 in the better eye, was reported in 13.5% of Tanzanian, 18.1 % in SAB, 4.1% in SAC and 1.7% in Dutch patients. The proportion of binocular blindness at presentation was distributed equally among male and female patients in all ethnic groups (p > 0.05). Older age at presentation was associated with higher odds of binocular blindness in Tanzanian (OR = 1.45/10 year increase in age, 95%CI = 1.06–1.98, p = 0.02) and SAB (OR = 1.80/10 year increase in age, 95%CI = 1.13–2.89, p = 0.02). Monocular blindness at presentation was reported in 51.6% of Tanzanian, 48.9 % in SAB, 24.5% in SAC and 16.2% in Dutch patients. The central corneal thickness was statically significantly thinner in the African groups than in the Dutch (p ≤ 0.001; Fig. 1G) and thinnest in the SAB (487µm; Table 1).
Table 1.
Clinical characteristics
| Clinical and demographic characteristics |
Tanzanian N = 310 |
South African Black N = 94 |
South African Coloured N = 151 |
Dutch N = 241 |
P‐value |
|---|---|---|---|---|---|
| Year of presentation, median (IQR) | 2013 (2012 ‐ 2014) | 2010.50 (2006 ‐ 2013) | 2011 (2005‐ 2013) | 1999 (1998 −2001) | |
| Age at presentation, mean (years) ± SD | 62.7 ± 11.0 | 57.0 ± 12.0 | 65.7 ± 10.0 | 69.7 ± 11.7 |
F* (3, 312.155) = 31.255 p < 0.001 |
| Female, % (n) | 36.8 (114) | 51.1 (48) | 55.6 (84) | 44.8 (108) | <0.001 † |
| IOP at presentation (mmHg), maximal OU ± SD | 36.2 ± 11.1 | 34.4 ± 11.6 | 29.1 ± 10.0 | 29.3 ± 8.4 |
F* (3, 303.081) = 29.185 p < 0.001 |
| VCDR at presentation, maximal OU ± SD | 0.90 ± 0.12 | 0.90 ± 0.11 | 0.84 ± 0.13 | 0.83 ± 0.16 |
F* (3, 304.748) = 15.327 p < 0.001 |
| Visual acuity (LogMar) at presentation in worse eye, median (IQR) | 1.8 (0.5–2.5) | 1.8 (0.3–2.5) | 0.3 (0.2–1.8) | 0.3 (0.1–0.7) |
p < 0.001 |
| Visual acuity (LogMar) at presentation in better eye, median (IQR) | 0.3 (0.2–0.8) | 0.2 (0.2–0.6) | 0.2 (0.2–0.3) | 0.0 (0.0–0.2) |
p < 0.001 |
| CCT, mean(µm) OU ± SD | 506.2 ± 33.8 | 487.1 ± 38.4 | 510.7 ± 34.7 | 528.1 ± 40.0 |
F § (3, 509) = 20.171 p < 0.001 |
| Family history of glaucoma, % (n) ¶ | 28.4 (88) | 17.0 (16) | 17.2 (26) | 20.7 (43) | 0.015 † |
| Diabetes mellitus, % (n) ¶ | 11.6 (36) | 18.1 (17) | 33.1 (50) | 13.7(33) | <0.001 † |
| Cardiovascular disease, % (n) ¶ | 31.3 (97) | 62.8 (59) | 64.9 (98) | 53.3 (126) | <0.001 † |
IQR = interquartile range; OU = both eyes; SD = standard deviation.
p‐value obtained from a one‐way Welch anova.
p‐value obtained from a chi‐square test.
p‐value obtained from a Kruskall–Wallis H test.
p‐value obtained from a one‐way anova.
¶ Parameters were assessed at inclusion in the study, the mean age (± SD) at inclusion was: Tanzanian 63.5(10.8); South African Black 61.5 (11.2); South African Coloured 70.5 (10.3) and Dutch 71.6 (11.4) years.
Fig. 1.
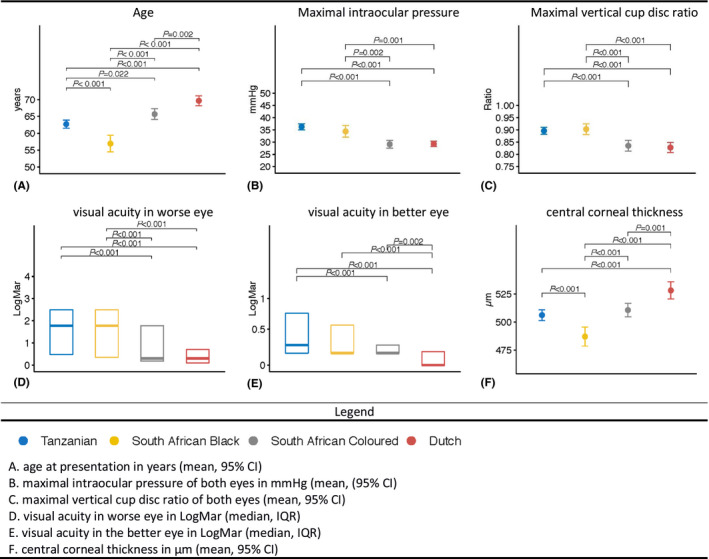
Clinical characteristics at presentation. (A) age at presentation in years (mean, 95% CI). (B) maximal intraocular pressure of both eyes in mmHg (mean, (95% CI). (C) maximal vertical cup disc ratio of both eyes (mean, 95% CI). (D) visual acuity in worse eye in LogMar (median, IQR). € visual acuity in the better eye in LogMar (median, IQR). (F) central corneal thickness in μm (mean, 95% CI).
A questionnaire assessment was performed at the inclusion in the studies to evaluate demographic characteristics and heritable risk of glaucoma (Table 1). Reported first‐degree family history of glaucoma ranged from 17% in the SAB to 28% in the Tanzanian group (p < 0.05). The self‐reported prevalence of diabetes mellitus was the highest in SAC (33.1%). Adjustments for potential confounding by age and sex showed that the difference in prevalence of diabetes mellitus between SAC and Tanzanian and between SAC and the Dutch was statistically significant after multiple testing correction (ORSAC vs. TZ = 3.98, 95%CI = 2.40–6.62, p < 0.001; ORSAC vs. DUT = 3.27, 95%CI = 1.93–5.43, p < 0.001). Cardiovascular disease prevalence was also the highest in SAC patients followed by SAB and the Dutch. Tanzanians had a significantly lower prevalence compared to the other groups when adjusting for age, sex and multiple testing (ORTZ vs. SAB = 0.25, 95%CI = 0.15–0.41, p < 0.001; ORTZ vs. SAC = 0.32, 95%CI = 0.21–0.50, p < 0.001; ORTZ vs. DUT = 0.56, 95%CI = 0.39–0.81, p = 0.003). Adjustments for age and sex also indicated a statistically significant higher cardiovascular disease prevalence in SAB compared to the Dutch (OR = 2.30, 95%CI = 1.36–3.90, p = 0.02).
Glaucoma surgery in Sub‐Saharan Africa
Next, we examined the frequency of different types of surgical interventions for glaucoma that had been performed between presentation and inclusion among African groups. As the incidence of glaucoma surgery may depends on the follow‐up duration, we calculated the time intervals between presentation and inclusion. Median time from presentation to inclusion was 0.3 year (IQR 0.01–1.2) in Tanzanian, 3.1 years (IQR 0.7–8.4) in SAB, 2.9 years (IQR 0.8–8.1) in SAC.
Laser trabeculoplasty was only performed in one SAC patient that had received Argon laser trabeculoplasty. Trabeculectomy (TE) had been more frequently performed in the Tanzanians (37.1% of patients; n = 145 eyes) followed by SAB (33% of patients, n = 44 eyes) and SAC (21.9% of patients, n = 42 eyes). Taking into account the time interval between presentation and inclusion, the incidence rate of TE was 0.76 per person‐year in Tanzanians, 0.11 TE per person‐year in SAB and 0.06 per person‐year in the SAC. The median time from presentation to TE was 53 days (IQR 18–211) in Tanzanian, 300 days (IQR 105–967) in SAB and 314 days (IQR 150–984) in SAC patients. TE combined with phacoemulsification, so‐called phacotrabeculectomy had also been performed in Tanzanians, as well as in SAC patients. Among the Tanzanian patients that had undergone a TE, 26.1% (n = 33 eyes) had had a combined procedure, whereas in the SAC patients, only 9.1% (n = 4 eyes) of patients that had undergone a TE had had a combined procedure. Different types of adjunctive antimetabolites had been used in the African groups during the TE procedures. A total of 231 eyes had undergone a TE in the African groups, of which 37 eyes had undergone combined phacotrabeculectomy. 5‐fluorouracil had been used in 43% (n = 99) of eyes, whereas mitomycin‐C had been used in 36% (n = 84) of eyes and beta‐radiation had been applied in 3% (n = 7) of eyes. The differences between the types of antimetabolites that had been used among the African groups have been displayed in Fig. 2.
Fig. 2.
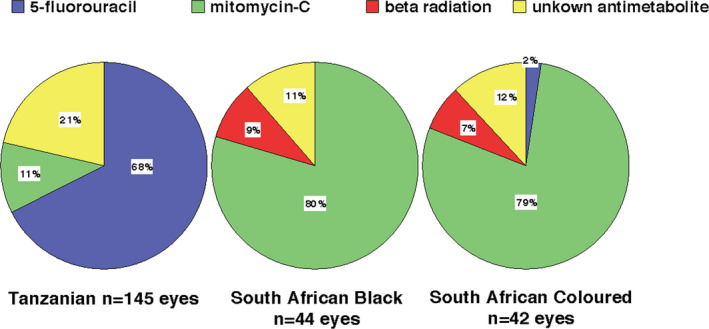
Antimetabolite use during trabeculectomy procedures.
Discussion
This study compared clinical and demographic characteristics of POAG presentation in sub‐Saharan African populations with a European population. We found that Tanzanian and SAB patients presented at a younger age than the Dutch (7–13 years earlier), and in a more advanced disease stage (VCDR 0.9) compared to Dutch patients. The IOP was 5–7 mmHg higher and the CCT was more than 20 µm thinner in the Tanzanian and SAB groups than in the Dutch. The presenting visual acuity in the better‐seeing eye was approximately 15 ETDRS letters (0.3 LogMar units) lower in the Tanzanian group than in the Dutch group; 14% of Tanzanian patients presented with blindness in the better‐seeing eye in contrast to 1% in the Dutch. These data emphasize the severe presentation of POAG in SSA at middle age.
The relatively younger age at presentation in Tanzanian and SAB and the more structural and functional damage of the optic nerve head implicates that the disease has an earlier age of onset and runs a more severe course in African patients. Also, thinner CCT affects Goldmann applanation tonometry readings and leads to an underestimation of IOP. Our data supports other studies, that the CCT in SSA populations is thinner than in Europeans (SAB: 487 µm, Dutch: 528 µm, p < 0.001). We therefore conclude that the differences in IOP between Tanzanian, SAB and Dutch patients are probably even higher than noted due to differences in CCT.
The higher IOP might have a more destructive effect on the optic nerve head in African populations. Studies have suggested that larger optic disc diameters may be associated with increased vulnerability to pressure‐induced deformation (Bellezza et al. 2000; Burgoyne et al. 2005). Investigation into ethnic differences in the anatomy of the optic nerve head showed larger optic discs in African individuals (Girkin et al. 2010). In this context, the higher presenting IOP observed in the African populations may have a potentially more damaging effect on the optic nerve head. However, clinical studies could not validate this hypothesis (Jonas et al. 2004; Zangwill et al. 2005).
Our study found a higher VCDR at presentation in the African derived populations compared to SAC and Dutch participants, suggesting more advanced glaucomatous damage in the prior. As VCDR measurements are dependent on disc size (Garway‐Heath et al. 1998), ethnic differences in disc size should ideally be taken into consideration when interpreting VCDR between ethnic groups. As measurements of the optic disc size were not available, we compared the VCDR to the normal distribution of VCDR in the population using reference distributions of Tanzania (Buhrmann et al. 2000), South Africa (Rotchford et al. 2003) and the Netherlands (Wolfs et al. 2000). VCDR readings exceeding the 97.5th percentile are generally considered abnormal. The mean of the VCDR values recorded at presentation in this study surpassed the 97.5th percentile threshold in the normal population indicating that the values were deviant from the normal population.
Several epidemiological studies have debated that diabetes mellitus (DM) may be a risk factor for POAG (Song et al. 2016). The recent rise in life expectancy and changes in lifestyle have contributed to a shift in disease patterns and increasing burden of non‐communicable diseases like DM in SSA. In our study, we observed DM prevalence ranging from 12% in Tanzanian POAG patients to 33% in SAC POAG patients. These numbers do certainly not entail a causal relationship. Conflicting evidence exists whether POAG and diabetes are related however a relative recent meta‐analysis showed a significant association between POAG and diabetes considering data from different study designs (Zhao et al. 2015). Given the rising prevalence of DM in people of SSA (Atun et al. 2017), POAG evaluation should be warranted in DM patients.
In Tanzanian and SAB patients, the majority had already been monocular blind at presentation (~50%) while only 16% of the Dutch presented with monocular blindness. Monocular blindness may seem to be the trigger for seeking care in healthcare‐deprived regions, however it is striking that 14% of POAG patients in Tanzania visited the clinic for the first time when already binocularly blind. This delay further supports the burden of poor access to healthcare facilities which includes long travel distances, poor financial status but also lack of awareness of implications of the disease. The latter has been supported by several African studies assessing awareness levels in glaucoma patients (Tenkir et al. 2010; Lewallen et al. 2011). In particular studies that examined awareness in the general rural communities of Osun State in Nigeria and a peri‐urban community of Abokobi in Ghana found that, despite the high prevalence of the disease in West Africa, only 16% and 39% of participants respectively had heard of the disease before (Adegbehingbe & Bisiriyu 2008; De‐Gaulle & Dako‐Gyeke 2016). In contrast, in Australia where glaucoma is less frequent, awareness levels are much higher: 73% of respondents had heard of the disease before (Livingston et al. 1995). Another factor that should not be omitted in evaluating patient delay is the impact of the traditional healers who can play a pivotal role in the postponement to seek medical care. And above all ophthalmologists, optometrists and assistant medical officers of ophthalmology (AMOO) are scarce and medical instruments and the access to medication can be challenging. Interestingly, also in the Dutch population, 1% of POAG presented with binocular blindness. This indicates that an asymptomatic chronic disease may lead to patient delay even when the aforementioned healthcare restrictions are not present (Rossetti et al. 2015). Thus, health care deprivation and socio‐economic status seem in all populations independent risk factors for late presentation of POAG.
This study also observed differences in surgical treatment strategies among African groups. TE was performed in over one third of Tanzanians and SAB. In particular Tanzanian patients underwent TE more rapidly after initial diagnosis (median 53 days) compared to SAB and SAC. The more limited healthcare settings in Tanzania with less availability, accessibility and affordability of topical medication compared to South Africa may lead to an earlier surgical intervention instead of medical treatment. Also, the lifelong use of topical medication is not feasible in most developing countries. Another aspect is the treatment delay in Tanzanian patients, who usually seek eye care only when at least one eye has already been blinded. A pragmatic approach by swift surgical intervention may in these cases be a solution to prevent complete blindness. However, studies have shown that acceptance of TE in Tanzania is poor even when provided for free (Quigley et al. 2000). A possible reason for this is that TE will not help in visual recovery, and therefore compares poorly with cataract surgery in terms of patients’ perception (Bowman & Kirupananthan 2006). Moreover, TE will inevitably lead to visual loss at the short term due to associated cataract development. Studies from South Africa and Tanzania have suggested that combining TE with cataract surgery so‐called phacotrabeculectomy favours TE in practices where post‐operative follow‐up is inadequate and acceptance of glaucoma surgery is poor (Gous & Roux 1995; Bowman et al. 2010). Although TE has been advocated as first line treatment in African glaucoma, excessive scarring which may compromise the filter function is frequently seen in people of African origin (Taubenslag & Kammer 2016).Antimetabolites like 5‐fluorouacil (5‐FU) and Mitomycin‐C (MMC) are commonly applied during TE and phacotrabeculectomy to prevent scarring. In our study, there were remarkable differences in the frequency of 5‐FU and MMC use between Tanzania and South Africa. In Tanzania 68% of procedures used intraoperative 5‐FU while in South Africa 80% of TE’s used MMC. MMC may be more effective in lowering IOP compared to 5‐FU, but is also associated with higher rates of complications, in particular bleb leaks, cyst formation and hypotony (Singh et al. 1997). Also, MMC is more expensive and needs to be kept refrigerated to maintain efficacy for up to 2 weeks in contrast to 5‐FU, which can be stored at room temperature for several months. These latter two reasons may favour 5‐FU in low‐income countries with unstable electricity supply. Another anti‐scarring agent which has been used in glaucoma surgery for many years is beta radiation. This device has a working life over 20 years and involves minimal maintenance making this an attractive choice for healthcare settings with insufficient drugs supply and technical support. In our study, only 8% of TE/PT procedures in South Africa used beta radiation as adjunctive agent. A study from Tanzania investigated the use of beta radiation in PT and found comparable IOP control in the beta radiation group compared to the 5‐FU group (Dhalla et al. 2016). Although beta radiation seems a good alternative to 5‐FU and MMC, importing radioactive material in African countries may come with additional logistical burden making antimetabolites more easily available. A striking observation was that none of the African patients was offered selective laser trabeculoplasty. A recent trial showed that SLT is an effective first line treatment in lowering IOP for at least 3 years providing superior IOP stability, at lower costs compared to eye drops (Gazzard et al. 2019). Other studies have shown comparable effectiveness of SLT in African derived patients (30–40% reduction in IOP; Realini et al. 2018). In SSA where many POAG patients are unable to sustain on topical IOP lowering medication, SLT may be a viable and cost‐effective solution for treating POAG. However, its therapeutic range in clinic is considered lower compared to TE, as IOP in SSA POAG patients is high, it may be insufficient on its own in achieving IOP at levels to prevent glaucoma progression.
Limitations of the study are the differences in health resource settings between Europe and Africa that may have introduced bias to the stage of POAG presentation. In the Netherlands, opticians and optometrists are trained to early detect risk factors for POAG in particularly high IOP. This may have led to earlier referral of POAG patients, however even with this surveillance taken into account the Dutch POAG patients presented 7–12 years later than SAB and Tanzanians respectively in a less severe stage. Another aspect is that the data presented here is collected in a retrospective manner, data regarding presentation were extracted from the medical charts, hence these data had been recorded by various clinicians. Also only POAG patients that met the ISGEO criteria were included omitting less advanced glaucoma cases, this selection may have biased the results. Moreover, in GLGS all patients were visual field confirmed (ISGEO 1) cases while in GIGA visual field testing was unfeasible in the majority of the patients, therefore a more strict structural criterion (ISGEO 2) needed to be fulfilled for inclusion. As structural and functional glaucomatous changes are not interchangeable the heterogeneity in inclusion criteria may have introduced selection bias towards higher VCDR at presentation in the GIGA study. An additional limitation is that the populations were not recruited in the same time frame. The GLGS cohort had been recruited at the turn of the millennium while the African patients had been recruited approximately 1 decade later.
In conclusion, the present study reinforces the notion that POAG patients of African descent have a more severe presentation compared to patients from European descent; South African Coloured patients (African, Asian, European admixed) have a similar mode of presentation as Europeans. Our study shows that aside from health care inequalities, that might mediate the severity at presentation, Sub‐Saharan African POAG patients present at a younger age in a much more advanced disease stage with a higher IOP. This indicates that the disease is more progressive and destructive in Africans. Awareness of these disease characteristics is important in first‐ and second‐line glaucoma care. Pathophysiologic pathways have yet to be discovered to explain the higher disease load in Africans. Large genetic studies are on their way.
Neema Kanyaro, Department of Ophthalmology Muhimbili University of Health and Allies Sciences, Dar es Salaam, Tanzania.
Cyprian Ntomoka, Department of Ophthalmology, Comprehensive Community Based Rehabilitation in Tanzania (CCBRT) Hospital, Dar Es Salaam, Tanzania.
Julius J. Massaga, National Institute for Medical Research (NIMR), Dar es Salaam, Tanzania.
Joyce K. Ikungura, National Institute for Medical Research (NIMR), Dar es Salaam, Tanzania.
Angelina Ampong, Department of Ophthalmology, Komfo Anokye Teaching Hospital, Kumasi, Ghana.
Doreen Nelson‐Ayifah, Department of Ophthalmology, Komfo Anokye Teaching Hospital, Kumasi, Ghana Kwame Nkrumah University of Science and Technology, Kumasi, Ghana.
Sjoerd Driessen, Department of Ophthalmology and Epidemiology, Erasmus MC, Rotterdam, The Netherlands.
Stichting Combined Ophthalmic Research Rotterdam (CORR), BrightFocus Foundation, Algemene Nederlandse Vereniging ter Voorkoming van blindheid, Landelijke Stichting voor Blinden en Slechtzienden, Stichting Beheer het Schild, Prof. dr. Henkes stichting, Rotterdamse Stichting Blindenbelangen, Stichting Glaucoomfonds. European Union Horizon 2020 research and innovation programme under the Marie Skłodowska‐Curie grant agreement No. 675033 (EGRET plus).
The authors thank all the GIGA study participants for their cooperation. We gratefully acknowledge Suzanne van Schaik, Milou van Bruchem, Hannah Hardjosantoso, Katinka Snoek, Chawan Amin, Vicky Hokken, Corina Brussee, Hilda Roothaert and all ophthalmologist, residents and nurses of the Ophthalmology departments from the Groote Schuur Hospital, Muhimbili National Hospital and CCBRT for their continuous efforts in the recruitment of participants. The GIGA study is supported by grants from Combined Ophthalmic Research Rotterdam, The Netherlands; BrightFocus Foundation (G2015084), USA; UitZicht grant No 2014‐22 and 2015‐32 (Algemene Nederlandse Vereniging ter Voorkoming van Blindheid, The Netherlands; Landelijke Stichting voor Blinden en Slechtzienden, The Netherlands; Stichting Beheer Het Schild, The Netherlands; Stichting Glaucoomfonds, The Netherlands); Prof. Dr. Henkes stichting, The Netherlands; Rotterdamse Stichting Blindenbelangen, The Netherlands.
The GLGS is supported by the Dutch Health Care Insurance Council (CVZ) through the Department of Medical Technology Assessment (MTA) of the University Hospital Groningen, the Netherlands. N.M. Jansonius received the funding for this study from the European Union Horizon 2020 research and innovation programme under the Marie Skłodowska‐Curie grant agreement No. 675033 (EGRET plus).
References
- Adegbehingbe BO & Bisiriyu LA (2008): Knowledge, attitudes, and self care practices associated with glaucoma among hospital workers in Ile‐Ife, Osun State, Nigeria. Tanzan J Health Res 10: 240–245. [DOI] [PubMed] [Google Scholar]
- Adhikari M (2005): Not White Enough, Not Black Enough: Racial Identity in the South African Coloured Community. Athens, OH: Ohio University Press. [Google Scholar]
- Alexander DH, Novembre J & Lange K (2009): Fast model‐based estimation of ancestry in unrelated individuals. Genome Res 19: 1655–1664. [DOI] [PMC free article] [PubMed] [Google Scholar]
- Atun R, Davies JI, Gale EAM et al. (2017): Diabetes in sub‐Saharan Africa: from clinical care to health policy. Lancet Diabetes Endocrinol 5: 622–667. [DOI] [PubMed] [Google Scholar]
- Bellezza AJ, Hart RT & Burgoyne CF (2000): The optic nerve head as a biomechanical structure: initial finite element modeling. Invest Ophthalmol Vis Sci 41: 2991–3000. [PubMed] [Google Scholar]
- Bonnemaijer PWM, Cook C, Nag A, Hammond CJ, van Duijn CM, Lemij HG, Klaver CCW & Thiadens A (2017): Genetic African ancestry is associated with central corneal thickness and intraocular pressure in primary open‐angle glaucoma. Invest Ophthalmol Vis Sci 58: 3172–3180. [DOI] [PubMed] [Google Scholar]
- Bowman RJ, Hay A, Wood ML & Murdoch IE (2010): Combined cataract and trabeculectomy surgery for advanced glaucoma in East Africa; visual and intra‐ocular pressure outcomes. Eye (Lond) 24: 573–577. [DOI] [PubMed] [Google Scholar]
- Bowman RJ & Kirupananthan S (2006): How to manage a patient with glaucoma in Africa. Community Eye Health 19: 38–39. [PMC free article] [PubMed] [Google Scholar]
- Buhrmann RR, Quigley HA, Barron Y, West SK, Oliva MS & Mmbaga BB (2000): Prevalence of glaucoma in a rural East African population. Invest Ophthalmol Vis Sci 41: 40–48. [PubMed] [Google Scholar]
- Burgoyne CF, Downs JC, Bellezza AJ, Suh JK & Hart RT (2005): The optic nerve head as a biomechanical structure: a new paradigm for understanding the role of IOP‐related stress and strain in the pathophysiology of glaucomatous optic nerve head damage. Prog Retin Eye Res 24: 39–73. [DOI] [PubMed] [Google Scholar]
- De‐Gaulle VF & Dako‐Gyeke P (2016): Glaucoma awareness, knowledge, perception of risk and eye screening behaviour among residents of Abokobi, Ghana. BMC Ophthalmol 16: 204. [DOI] [PMC free article] [PubMed] [Google Scholar]
- Dhalla K, Cousens S, Bowman R, Wood M & Murdoch I (2016): Is beta radiation better than 5 flurouracil as an adjunct for trabeculectomy surgery when combined with cataract surgery? A randomised controlled trial. PLoS One 11: e0161674. [DOI] [PMC free article] [PubMed] [Google Scholar]
- Foster PJ, Buhrmann R, Quigley HA & Johnson GJ (2002): The definition and classification of glaucoma in prevalence surveys. Br J Ophthalmol 86: 238–242. [DOI] [PMC free article] [PubMed] [Google Scholar]
- Garway‐Heath DF, Ruben ST, Viswanathan A & Hitchings RA (1998): Vertical cup/disc ratio in relation to optic disc size: its value in the assessment of the glaucoma suspect. Br J Ophthalmol 82: 1118–1124. [DOI] [PMC free article] [PubMed] [Google Scholar]
- Gazzard G, Konstantakopoulou E, Garway‐Heath D et al. (2019): Selective laser trabeculoplasty versus eye drops for first‐line treatment of ocular hypertension and glaucoma (LiGHT): a multicentre randomised controlled trial. Lancet 393: 1505–1516. [DOI] [PMC free article] [PubMed] [Google Scholar]
- Girkin CA, Sample PA, Liebmann JM et al. (2010): African Descent and Glaucoma Evaluation Study (ADAGES): II. Ancestry differences in optic disc, retinal nerve fiber layer, and macular structure in healthy subjects. Arch Ophthalmol 128: 541–550. [DOI] [PMC free article] [PubMed] [Google Scholar]
- Gous PN & Roux P (1995): Preliminary report of sutureless phacotrabeculectomy through a modified self‐sealing scleral tunnel incision. J Cataract Refract Surg 21: 160–169. [DOI] [PubMed] [Google Scholar]
- Heeg GP, Blanksma LJ, Hardus PL & Jansonius NM (2005): The Groningen Longitudinal Glaucoma Study. I. Baseline sensitivity and specificity of the frequency doubling perimeter and the GDx nerve fibre analyser. Acta Ophthalmol Scand 83: 46–52. [DOI] [PubMed] [Google Scholar]
- Jonas JB, Martus P, Horn FK, Junemann A, Korth M & Budde WM (2004): Predictive factors of the optic nerve head for development or progression of glaucomatous visual field loss. Invest Ophthalmol Vis Sci 45: 2613–2618. [DOI] [PubMed] [Google Scholar]
- Kapetanakis VV, Chan MP, Foster PJ, Cook DG, Owen CG & Rudnicka AR (2016): Global variations and time trends in the prevalence of primary open angle glaucoma (POAG): a systematic review and meta‐analysis. Br J Ophthalmol 100: 86–93. [DOI] [PMC free article] [PubMed] [Google Scholar]
- Kyari F, Abdull MM, Bastawrous A, Gilbert CE & Faal H (2013): Epidemiology of glaucoma in sub‐saharan Africa: prevalence, incidence and risk factors. Middle East Afr J Ophthalmol 20: 111–125. [DOI] [PMC free article] [PubMed] [Google Scholar]
- Lewallen S, Hassan HG, Al Attas AH & Courtright P (2011): A population‐based study of care‐seeking behavior in rural Tanzanians with glaucoma blindness. J Glaucoma 20: 361–365. [DOI] [PubMed] [Google Scholar]
- Livingston PM, Lee SE, De Paola C, Carson CA, Guest CS & Taylor HR (1995): Knowledge of glaucoma, and its relationship to self‐care practices, in a population sample. Aust N Z J Ophthalmol 23: 37–41. [DOI] [PubMed] [Google Scholar]
- Martin MJ, Sommer A, Gold EB & Diamond EL (1985): Race and primary open‐angle glaucoma. Am J Ophthalmol 99: 383–387. [DOI] [PubMed] [Google Scholar]
- Quigley HA, Buhrmann RR, West SK, Isseme I, Scudder M & Oliva MS (2000): Long term results of glaucoma surgery among participants in an east African population survey. Br J Ophthalmol 84: 860–864. [DOI] [PMC free article] [PubMed] [Google Scholar]
- Realini T, Olawoye O, Kizor‐Akaraiwe N, Manji S & Sit A (2018): The rationale for selective laser trabeculoplasty in Africa. Asia Pac J Ophthalmol (Phila) 7: 387–393. [DOI] [PubMed] [Google Scholar]
- Rossetti L, Digiuni M, Montesano G et al. (2015): Blindness and glaucoma: a multicenter data review from 7 academic eye clinics. PLoS One 10: e0136632. [DOI] [PMC free article] [PubMed] [Google Scholar]
- Rotchford AP, Kirwan JF, Muller MA, Johnson GJ & Roux P (2003): Temba glaucoma study: a population‐based cross‐sectional survey in urban South Africa. Ophthalmology 110: 376–382. [DOI] [PubMed] [Google Scholar]
- Singh K, Egbert PR, Byrd S, Budenz DL, Williams AS, Decker JH & Dadzie P (1997): Trabeculectomy with intraoperative 5‐fluorouracil vs mitomycin C. Am J Ophthalmol 123: 48–53. [DOI] [PubMed] [Google Scholar]
- Song BJ, Aiello LP & Pasquale LR (2016): Presence and risk factors for glaucoma in patients with diabetes. Curr Diab Rep 16: 124. [DOI] [PMC free article] [PubMed] [Google Scholar]
- Taubenslag KJ & Kammer JA (2016): Outcomes disparities between black and white populations in the surgical management of glaucoma. Semin Ophthalmol 31: 385–393. [DOI] [PubMed] [Google Scholar]
- Tenkir A, Solomon B & Deribew A (2010): Glaucoma awareness among people attending ophthalmic outreach services in Southwestern Ethiopia. BMC Ophthalmol 10: 17. [DOI] [PMC free article] [PubMed] [Google Scholar]
- Tham YC, Li X, Wong TY, Quigley HA, Aung T & Cheng CY (2014): Global prevalence of glaucoma and projections of glaucoma burden through 2040: a systematic review and meta‐analysis. Ophthalmology 121: 2081–2090. [DOI] [PubMed] [Google Scholar]
- Wilensky JT, Gandhi N & Pan T (1978): Racial influences in open‐angle glaucoma. Ann Ophthalmol 10: 1398–1402. [PubMed] [Google Scholar]
- Wilson R, Richardson TM, Hertzmark E & Grant WM (1985): Race as a risk factor for progressive glaucomatous damage. Ann Ophthalmol 17: 653–659. [PubMed] [Google Scholar]
- Wolfs RC, Borger PH, Ramrattan RS et al. (2000): Changing views on open‐angle glaucoma: definitions and prevalences–The Rotterdam Study. Invest Ophthalmol Vis Sci 41: 3309–3321. [PubMed] [Google Scholar]
- Zangwill LM, Weinreb RN, Beiser JA et al. (2005): Baseline topographic optic disc measurements are associated with the development of primary open‐angle glaucoma: the Confocal Scanning Laser Ophthalmoscopy Ancillary Study to the Ocular Hypertension Treatment Study. Arch Ophthalmol 123: 1188–1197. [DOI] [PubMed] [Google Scholar]
- Zhao D, Cho J, Kim MH, Friedman DS & Guallar E (2015): Diabetes, fasting glucose, and the risk of glaucoma: a meta‐analysis. Ophthalmology 122: 72–78. [DOI] [PubMed] [Google Scholar]