

Abstract
The impact of healthy aging on molecular programming of immune cells is poorly understood. Here, we report comprehensive characterization of healthy aging in human classical monocytes, with a focus on epigenomic, transcriptomic, and proteomic alterations, as well as the corresponding proteomic and metabolomic data for plasma, using healthy cohorts of 20 young and 20 older males (~27 and ~64 years old on average). For each individual, we performed eRRBS-based DNA methylation profiling, which allowed us to identify a set of age-associated differentially methylated regions (DMRs) – a novel, cell-type specific signature of aging in DNA methylome. Hypermethylation events were associated with H3K27me3 in the CpG islands near promoters of lowly-expressed genes, while hypomethylated DMRs were enriched in H3K4me1 marked regions and associated with age-related increase of expression of the corresponding genes, providing a link between DNA methylation and age-associated transcriptional changes in primary human cells.
INTRODUCTION
Advanced age, even in healthy individuals, is accompanied by progressive decline of cognitive, metabolic and physiological abilities, and can enhance susceptibility to neurodegenerative, cardiovascular, and chronic inflammatory diseases1,2. Operationally, it is often difficult to determine whether age-associated signatures reflect changes of individual cells or changes in cell type abundances, especially when performing whole tissue transcriptional or epigenetic characterization. And even despite a large amount of clinical and epidemiological data3–7, we understand very little about the nature of age-associated changes in specific primary cell populations of healthy individuals, particularly with respect to age-associated alterations of the epigenetic landscape. To address this question directly, we focused on classical CD14+CD16− monocytes, as they are homogeneous, easily accessible, and relatively abundant in blood, which permits multi-omics profiling of these cells obtained from a single blood draw. Epigenetic aging can manifest in two key aspects: via age-associated changes in chromatin modifications and in DNA methylation. Robustness of the connection between aging and DNA methylation has been well acknowledged8–12, yet despite the large number of studies, cell specific regions of age-associated DNA methylation/demethylation have not been reported to date. Previous studies have been predominantly using DNA methylation arrays which detect changes of a predefined set of distant solitary cytosines across the genome4. This design prevents identification of differentially methylated regions (DMRs), which are expected to be more biologically relevant compared to changes in single isolated CpG sites.
In this study, we used parallel multi-omics approaches to characterize intracellular states and extracellular environments of monocytes along healthy aging. To allow for simultaneous identification of continuous age-associated DNA methylation regions and corresponding chromatin context, we utilized enhanced Reduced Representation Bisulfite Sequencing (eRRBS) coupled with the Ultra-Low-Input ChIP-Sequencing (ULI-ChIP-seq)13 approach to profile chromatin modifications from limited input material. Our approach led to identification of more than a thousand DMRs, which could not be achieved via methylation arrays technology. We found no evidence of large-scale remodeling of chromatin modification landscape along the healthy aging yet revealed distinct chromatin features that were characteristic of age-associated DNA hyper- and hypomethylated regions. Integration of the obtained DMR signatures with transcriptional data highlighted connection between age-associated transcriptional alterations and hypomethylated DMRs, while hypermethylated DMRs were not readily associated with transcriptional changes. Together with parallel profiling of plasma proteins and unbiased metabolic profiling from the same individuals, the compendium of data collected in this work comprises a comprehensive aging data resource obtained under stringent inclusion criteria. Easily accessible visualization and exploration of all data from this study are available online at https://artyomovlab.wustl.edu/aging/.
RESULTS
Study design, cohort characteristics, and systemic age-associated changes
It has been described that genetic factors, race, sex, body-mass and lifestyles can significantly affect the outcomes of human studies focused on various aspects of aging6,7,9,14,15. Here, we used stringent inclusion criteria to eliminate the effect of confounding variables such as inherited genetic traits, sex, environmental stressors and inflammatory disorders16,17. Blood was collected from healthy young (24-30 y.o.; n=20) and old (57-70 y. o.; n=20) Caucasian males. All donors were non-smokers, with a healthy body-mass ratio (BMI<30) and self-reported absence of underlying inflammatory conditions, acute viral infections, and cancer (Figure 1A; Supplementary Table 1). All plasma cytokines measured by a bioplex assay were within normal ranges18 (Extended Data 1A; Supplementary Table 2), confirming that our selection process was sufficiently stringent and excluded underlying inflammatory conditions in both young and old participants19–21. One cytokine that stood out was IL-8 that was strongly statistically increased with age even for the considered cohort size (Extended Data 1A). Complete blood counts (CBCs) and differential analysis of whole blood (Figure 1B, Extended Data 1B; Supplementary Table 1) showed a significant decrease in red blood cell (RBCs) counts with age, consistent with previous reports22. Total white blood cell (WBC) counts were similar between the young and old cohorts but we saw significant changes in WBC differentials: total lymphocyte counts decreased with age, while myeloid cell counts were higher, consistent with previously described age-associated shift towards the myeloid lineage23 (Figure 1B, Extended Data 1B).
Figure 1: Integrated multiomics profiling of healthy aging: study design overview.
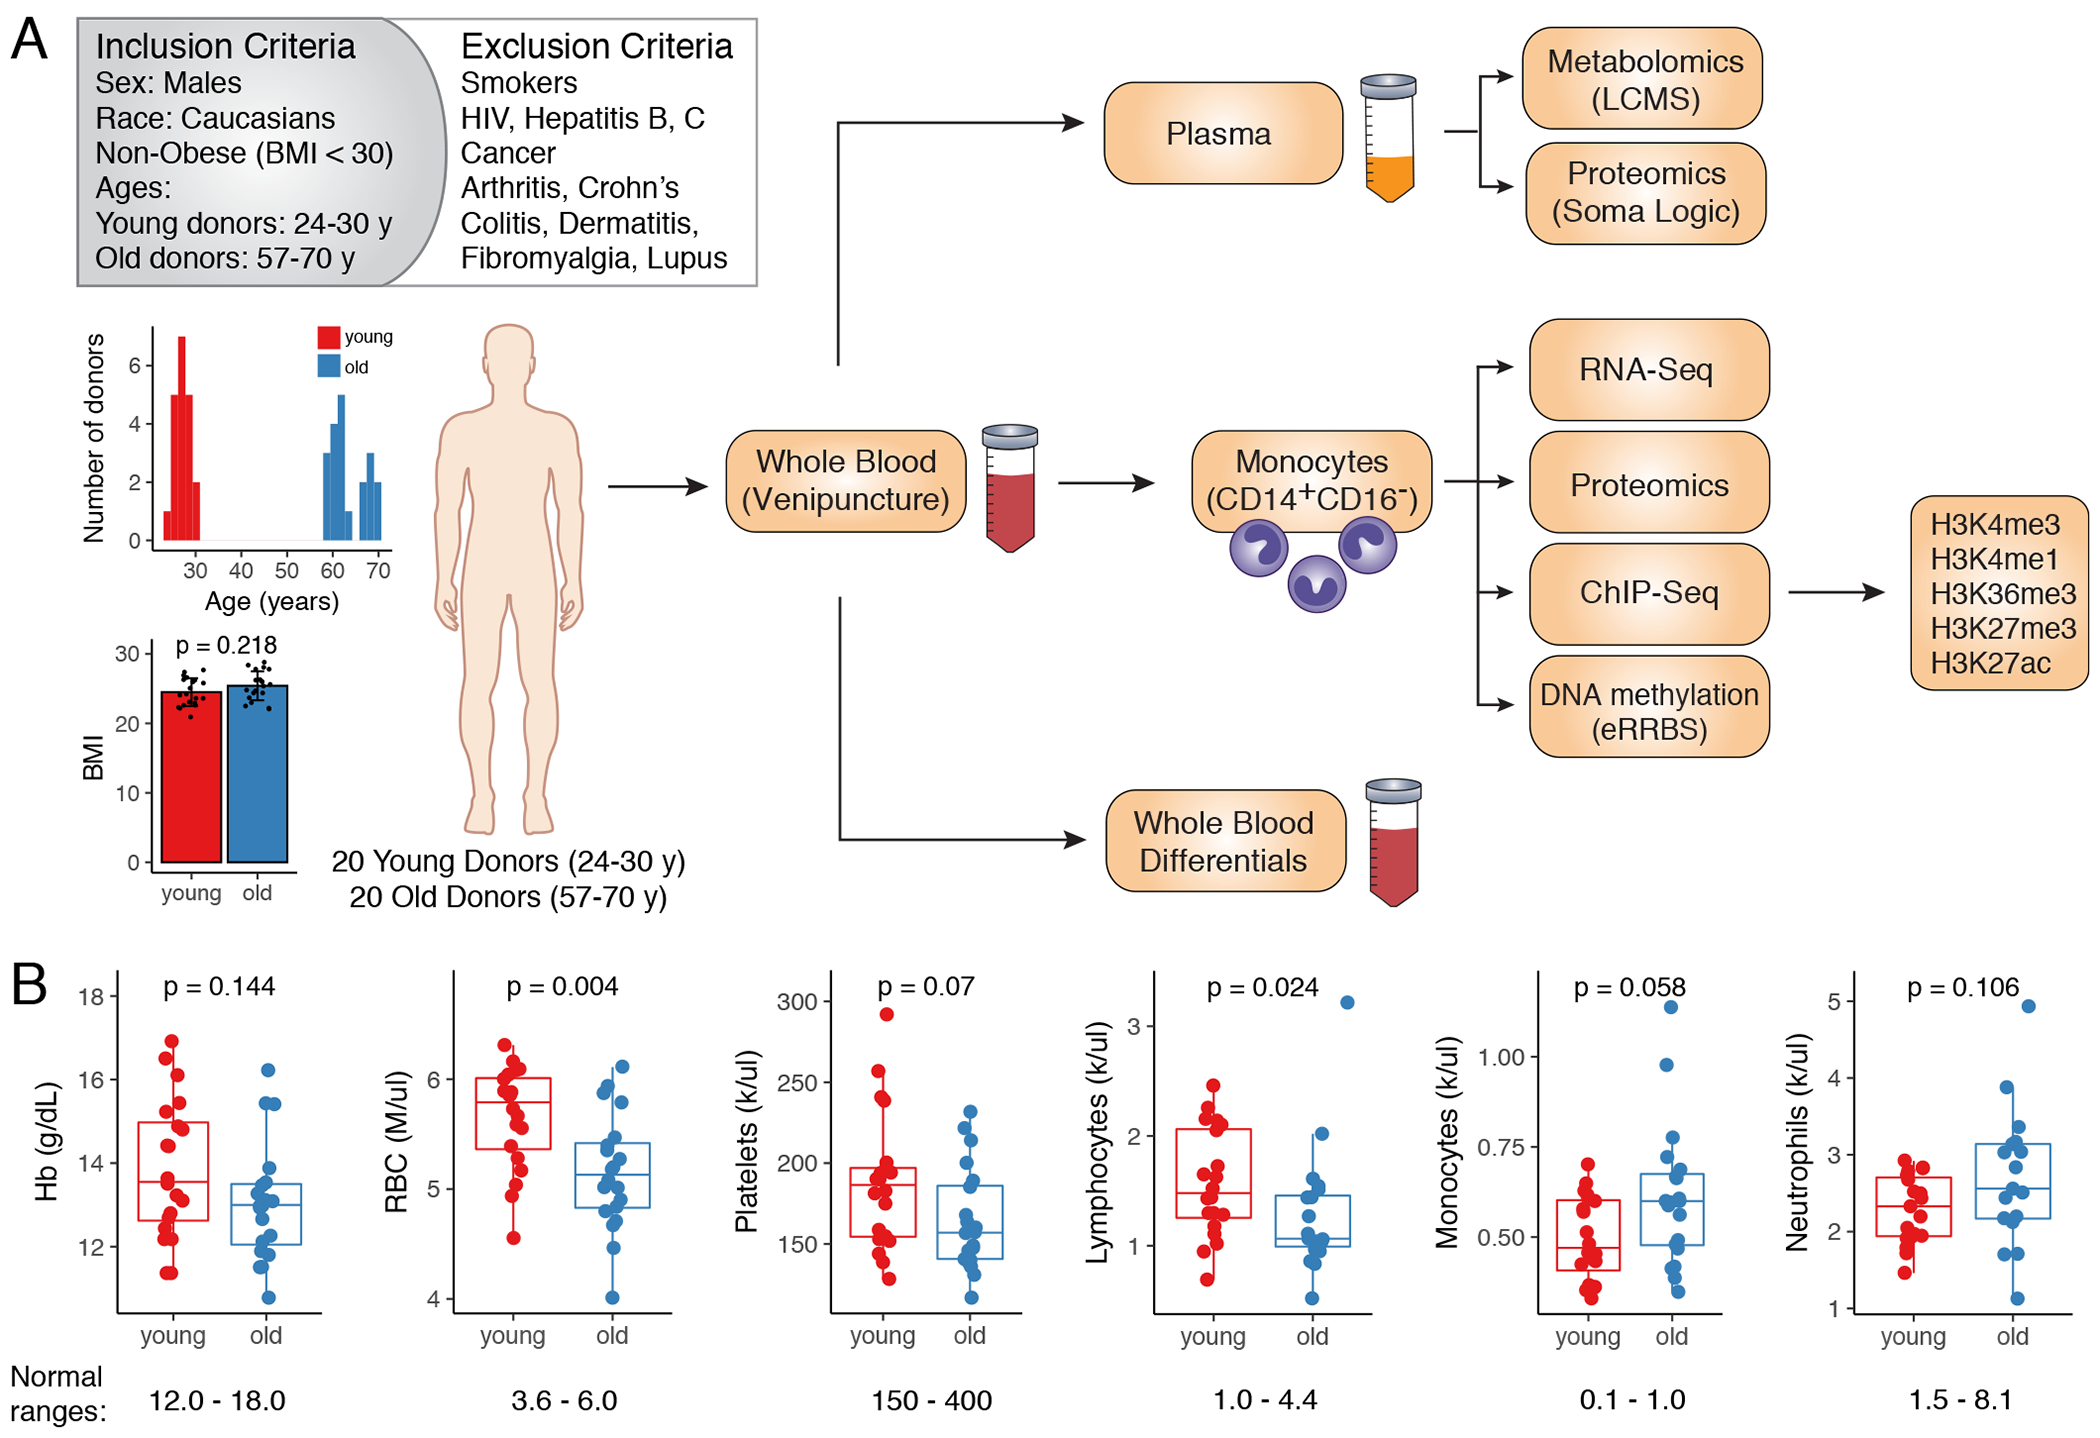
(A) Overview of selection criteria and study design. Histogram represents distribution of ages amongst young (n=20) and old (n=20) donors. BMIs of donors are show as mean ± S.D. P-value was calculated using two-sided Mann-Whitney U test. (B) Blood differentials obtained by Hemavet. Normal ranges are shown below the boxplots. Statistical differences between groups were estimated using two-sided Mann-Whitney U test. The lower and upper hinges of all boxplots represent the 25th and 75th percentiles. Horizontal bars show median value. Whiskers extend to the values that are no further than 1.5*IQR from either upper or lower hinge. IQR stands for inter-quartile range, which is the difference between the 75th and 25th percentiles.
To characterize the differences in the environment that bathes circulating monocytes, we performed proteomic and metabolomic profiling of plasma (Extended Data 2 and 3). PCA and hierarchical clustering revealed moderate separation between the two cohorts for both datasets (Extended Data 2A–2B and 3A–3B). Statistical testing resulted in 39 significantly different metabolites (FDR < 0.05; Extended Data 2C; Supplementary Table 3) and 53 significantly different proteins (FDR < 0.05; Extended Data 3C; Supplementary Table 4). Overall, age-associated protein signature corroborated a recently published reports by the Ferrucci group24,25, e.g. sclerostin (SOST) and growth differentiation factor 15 (GDF15) were among the most distinct proteins, and we additionally validated them and three other targets by ELISA (Extended Data 3D; Supplementary Table 5). Metabolomic data analysis showed a dramatic decrease in sex steroid levels for the older population, consistent with previous publications26 (Extended Data 2D–2E). Altogether, pathway analysis identified statistically significant age-associated changes in 15 metabolic pathways (Extended Data 2F–2G). Finally, for correlation analysis between proteomic and metabolomics datasets we focused on age-associated proteins and discovered that some plasma metabolites were co-regulated with protein markers only in the old group (Extended Data 3E). For instance, GDF15 and NOTCH 1, both strongly associated with age, were highly correlated with cystine and glucuronate in the old cohort but not in the young (Extended Data 3F. Overall, the plasma profiling data validated our recruitment criteria as well as confirmed and expanded previously known systemic features of aging. We next aimed to understand intracellular determinants of aging by focusing on CD14+CD16− monocytes.
Protein levels change substantially while transcripts levels are more robust during healthy aging
To explore intracellular signatures, we profiled pure CD14+CD16− monocytes (>98% purity; Extended Data 4A) from young and old individuals using deep RNA-sequencing (Supplementary Table 6). PCA of these data showed no clear separation of old and young transcriptomes and differential expression analysis revealed few significantly changing genes (Figures 2A–2B; Supplementary Table 7). One possible reason for this could be that cohort sizes in our study were limiting the power to detect changes of small absolute magnitude. Thus, we re-analyzed a large publicly available dataset generated as a part of the MESA study, which profiled purified monocyte samples from over 1,200 donors between the ages of 44 and 83 years27,28. Consistent with the initial report28, we identified 4,549 statistically significant differentially expressed genes (Figure 2C; Supplementary Table 8A). Yet, fold changes of gene expression between middle-aged and old MESA donors were very small – most changes being around 1% of the average expression level of the corresponding gene (Figure 2D). Our down-sampling simulation showed that to detect changes of this magnitude one requires a dataset with at least ~100 donors per group (Extended Data 4B). Therefore, we conclude that both our and public data demonstrated the relative stability of transcriptional landscape in human monocytes characterized by small magnitude age-associated changes.
Figure 2: Healthy aging in monocytes: very low magnitude transcriptional changes and distinct proteome alterations.
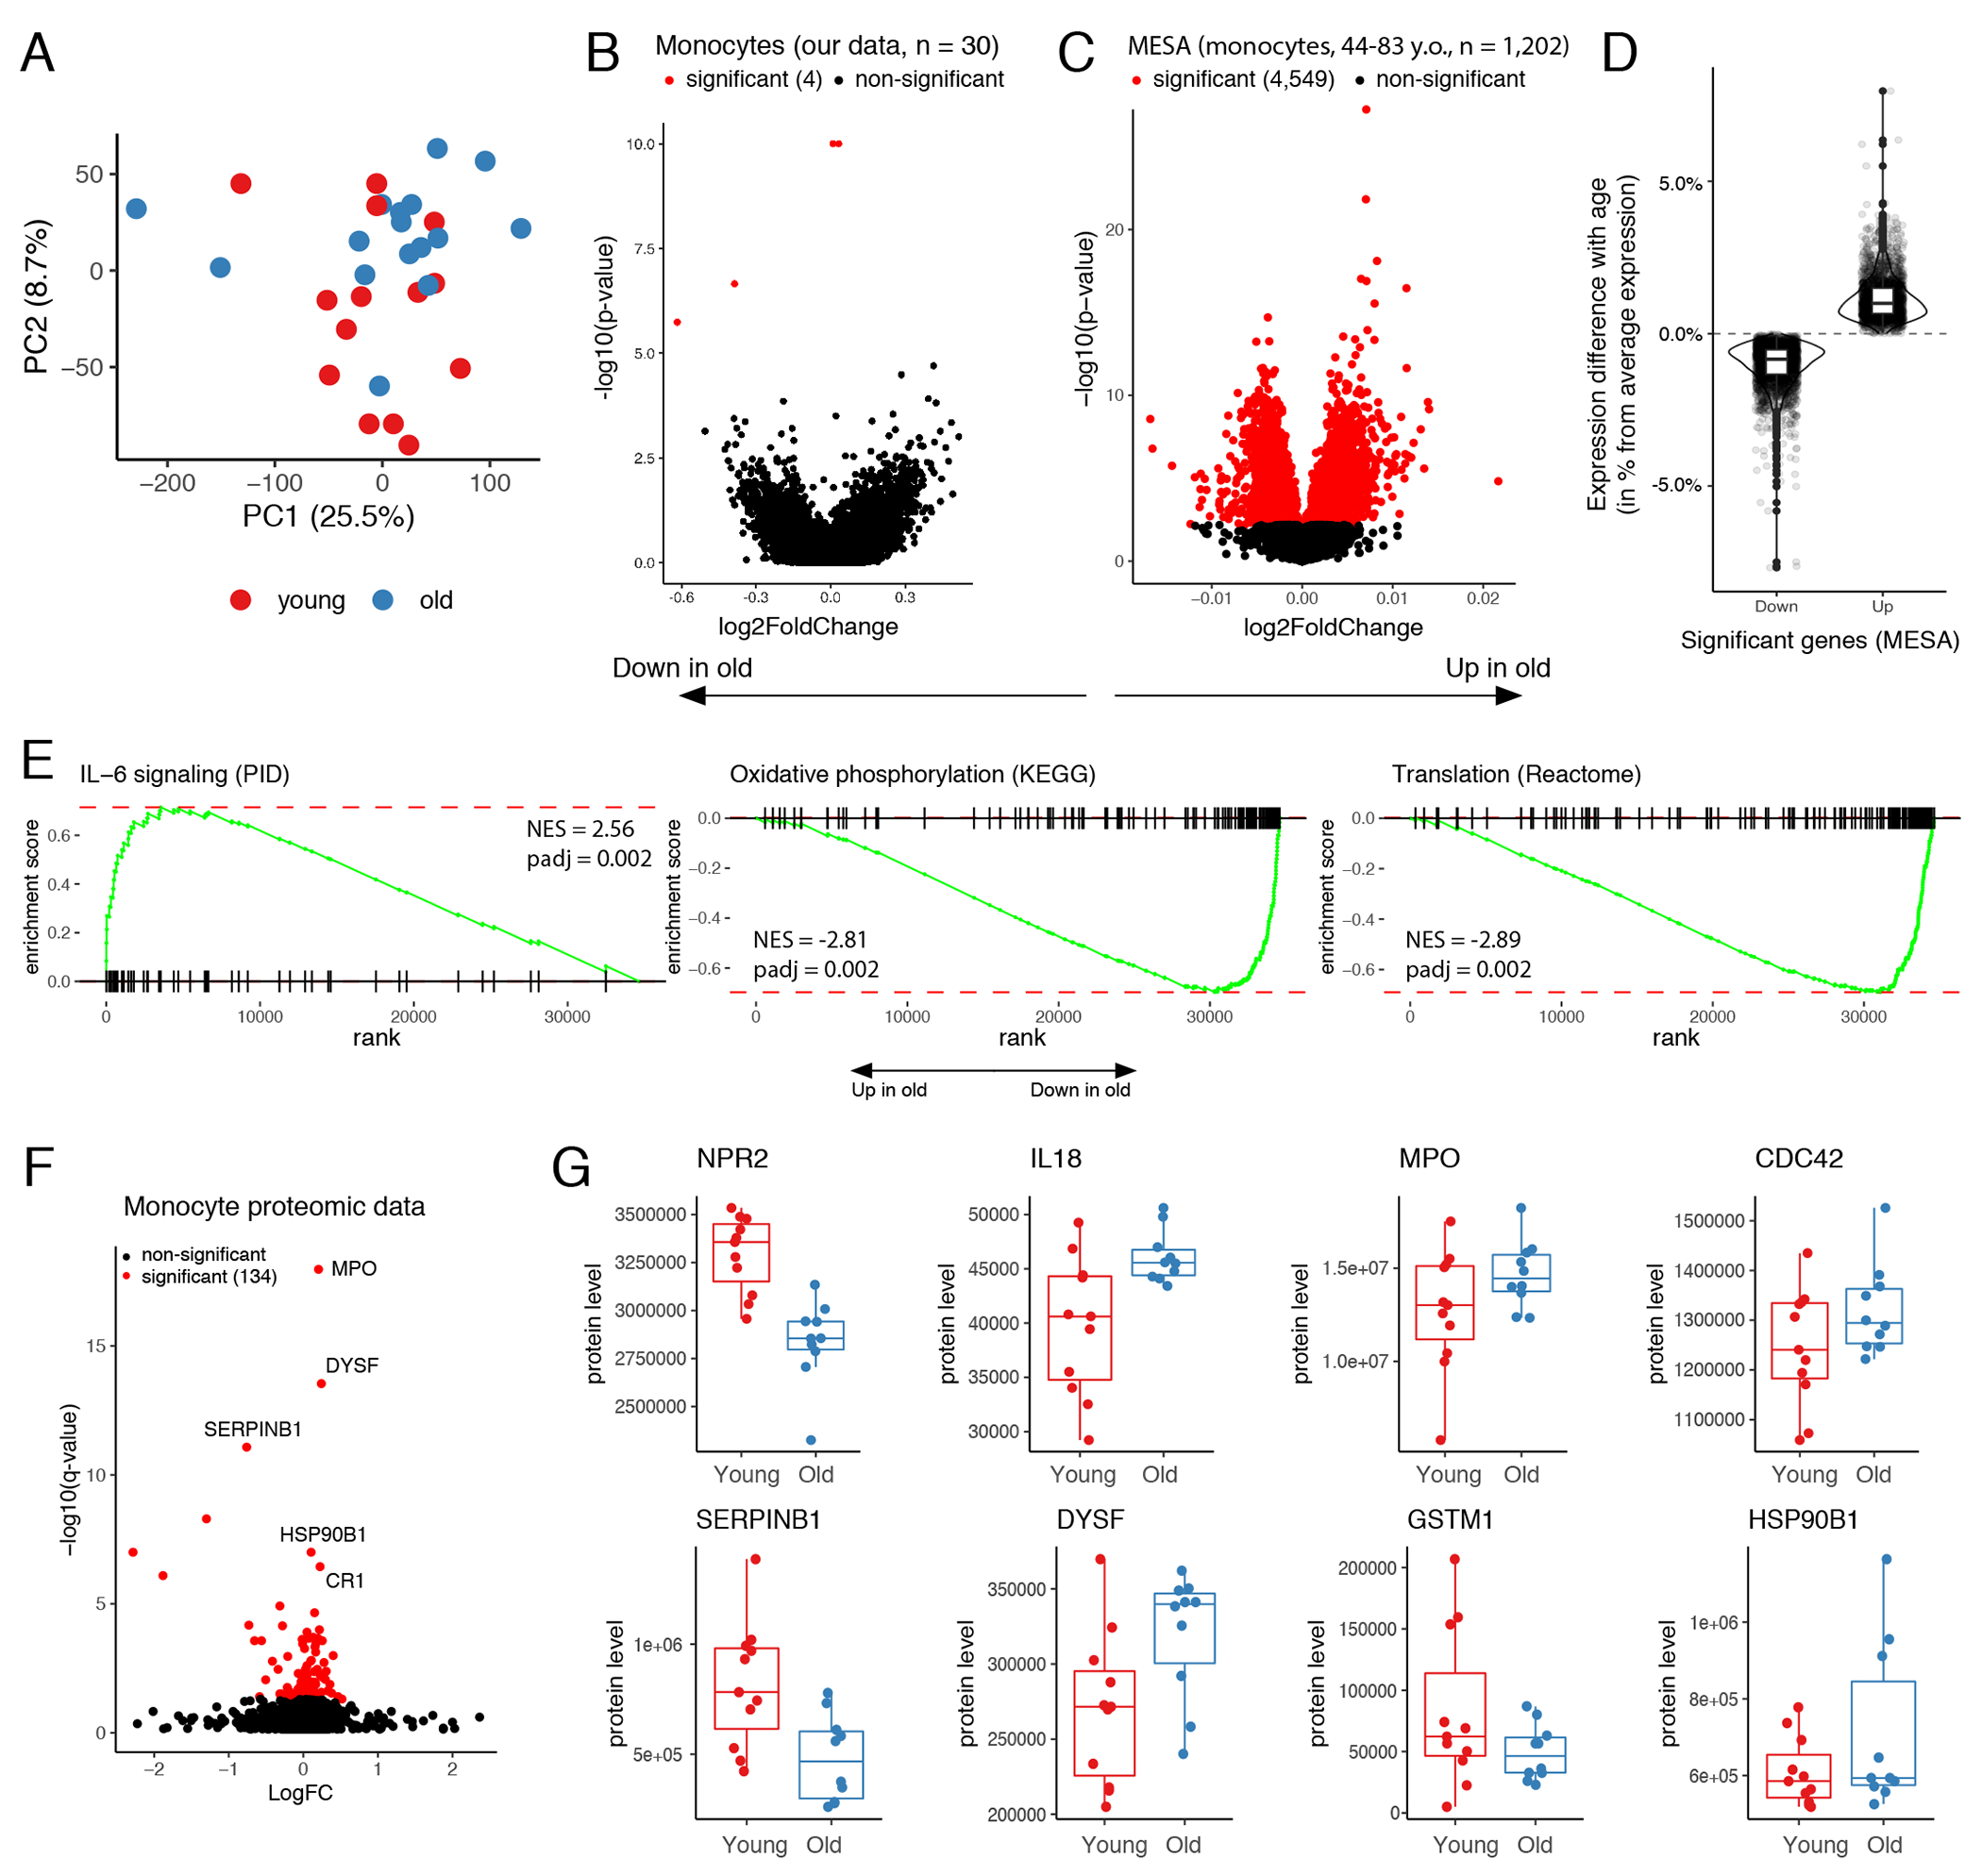
(A) PCA of normalized expression levels estimated by RNA-seq. Each dot represents a donor. (B) Volcano plot depicts results of differential analysis. Each dot represents a gene. P-values and logFC were calculated by two-sided Wald test using DeSeq2 package. Significant genes were selected after correction for multiple testing by Benjamini–Hochberg method. (C) Volcano plot shows differential expression results for MESA transcriptomic data for 1,202 human monocyte samples (GSE56045). P-values and logFC calculated by Limma package (two-sided test). Significant genes were selected after correction for multiple testing using Benjamini–Hochberg method. (D) Difference in mean expression between the most extreme MESA age groups (top and bottom 10% quantile) was presented as percent from average expression level of the corresponding gene across all donors. Only significant up-(n=2,101) and down-regulated (n=2,448) genes were included. (E) GSEA enrichment curves illustrate examples of pathways significantly regulated with advancing age in MESA data. P-values are one-sided and adjusted for multiple testing by Benjamini–Hochberg method. (F) Volcano plot shows result of monocyte proteome differential analysis. Each dot represents a protein. Significance was estimated by two-sided paired t-test. Multiple testing correction was performed as described in Storey et al.64. See methods for details. (G) Examples of age-dependent monocyte proteins: comparison between young (n=11) and old (n=10) groups. In panels (D) and (G), the lower and upper hinges of all boxplots represent the 25th and 75th percentiles. Horizontal bars show median value. Whiskers extend to the values that are no further than 1.5*IQR from either upper or lower hinge. IQR stands for inter-quartile range, which is the difference between the 75th and 25th percentiles.
We identified a number of pathways significantly altered with age (Supplementary Table 8B), including increase in cytokine signaling pathways, a decrease in oxidative phosphorylation pathway, and decrease in multiple protein translation pathways (Figure 2E, Extended Data 4C). The latter led us to an idea that more profound changes between age groups might be present at the level of proteome. Therefore, we subjected monocytes to proteomic profiling, which detected significant age-associated changes in 134 proteins (Figures 2F–2G; Supplementary Table 9). We found an increase in protein levels of natriuretic peptide receptor (NPR2), cytokine interleukin 18 (IL-18), myeloperoxidase (MPO), and toll-like receptor chaperon heat shock protein 90 beta family member 1 (HSP90B1) in the older cohort, suggesting that baseline condition of monocytes might be skewed towards more pro-inflammatory state in older individuals. Analysis of age-associated changes in gene expression corresponding to the significant proteins revealed that majority of the identified protein level alterations could not be explained by a shift in expression, suggesting age-associated disturbance of post-transcriptional regulation (Extended Data 4F).
The difference in monocytes’ proteome suggested that despite similarity of their transcriptional profiles old and young monocytes might respond differently to activating stimuli. We tested this hypothesis using lipopolysaccharide (LPS) stimulation of monocytes from young (n=7) and old donors (n=7), and macrophages in vitro differentiated from these monocytes. We collected and sequenced RNA from these four groups of samples (Extended Data 4D; Supplementary Table 10). While we observed known transcriptional signatures of monocyte differentiation and activation, we again could not detect any significant changes between activated cells from different age groups (Extended Data 4E). Similar to baseline monocyte profiling, this does not necessarily imply the absence of the age-associated changes but indicates that their absolute magnitude is likely low and requires bigger cohorts to be detected. Taken together, our data show that transcriptional profiles of monocytes do not change considerably along the healthy aging, while larger magnitudes of changes are observed on the protein level.
Identification of differentially methylated regions (DMRs) associated with healthy aging
A number of studies establish robust relationship between age and DNA methylation using DNA methylation arrays in various cell types or whole tissues8,9,11. These observations were underscored by the development of DNA methylation-based algorithms for age prediction10,29–34. Yet, DNA methylation array technology is limited in ability to find dedicated regions undergoing age-related DNA methylation or demethylation. Here, we used enhanced reduced representation bisulfite sequencing (eRRBS)35, which allows for identification of continuous regions by sequencing many closely located cytosines, providing deeper insight into the DNA methylation landscape. Individual eRRBS libraries for each sample were sequenced at 70±10 million reads depth (Extended Data 5A, Supplementary Table 11) and yielded ~3 million well-covered CpGs (with mean coverage ≥10 reads across all samples). This coverage represents ~10% of all CpGs in the human genome, including 24,127 CpG islands (84% of all islands, Figure 3A). To understand global age-associated changes in methylation profiles, we first compared average levels of cytosine methylation within donors of the two age groups (Figures 3B–3D). While no difference was observed in overall methylation of CpGs outside of the CpG islands, methylation within the CpG islands significantly increased in older donors (Figure 3B). This result is concordant with a previous data showing that CpG islands tend to gain methylation with age11,36,37. Another global change that we confirmed was increased variability in DNA methylation levels with age4,38–40 (Figure 3E). Finally, we have obtained highly consistent results for the two age groups using both Horvath32 and Hannum31 models, even though a number cytosines had to be imputed in order to use these approaches (Extended Data 5B).
Figure 3: RRBS sequencing reveals robust continuous regions of age-associated DNA hyper- and hypomethylation (up and down DMRs).
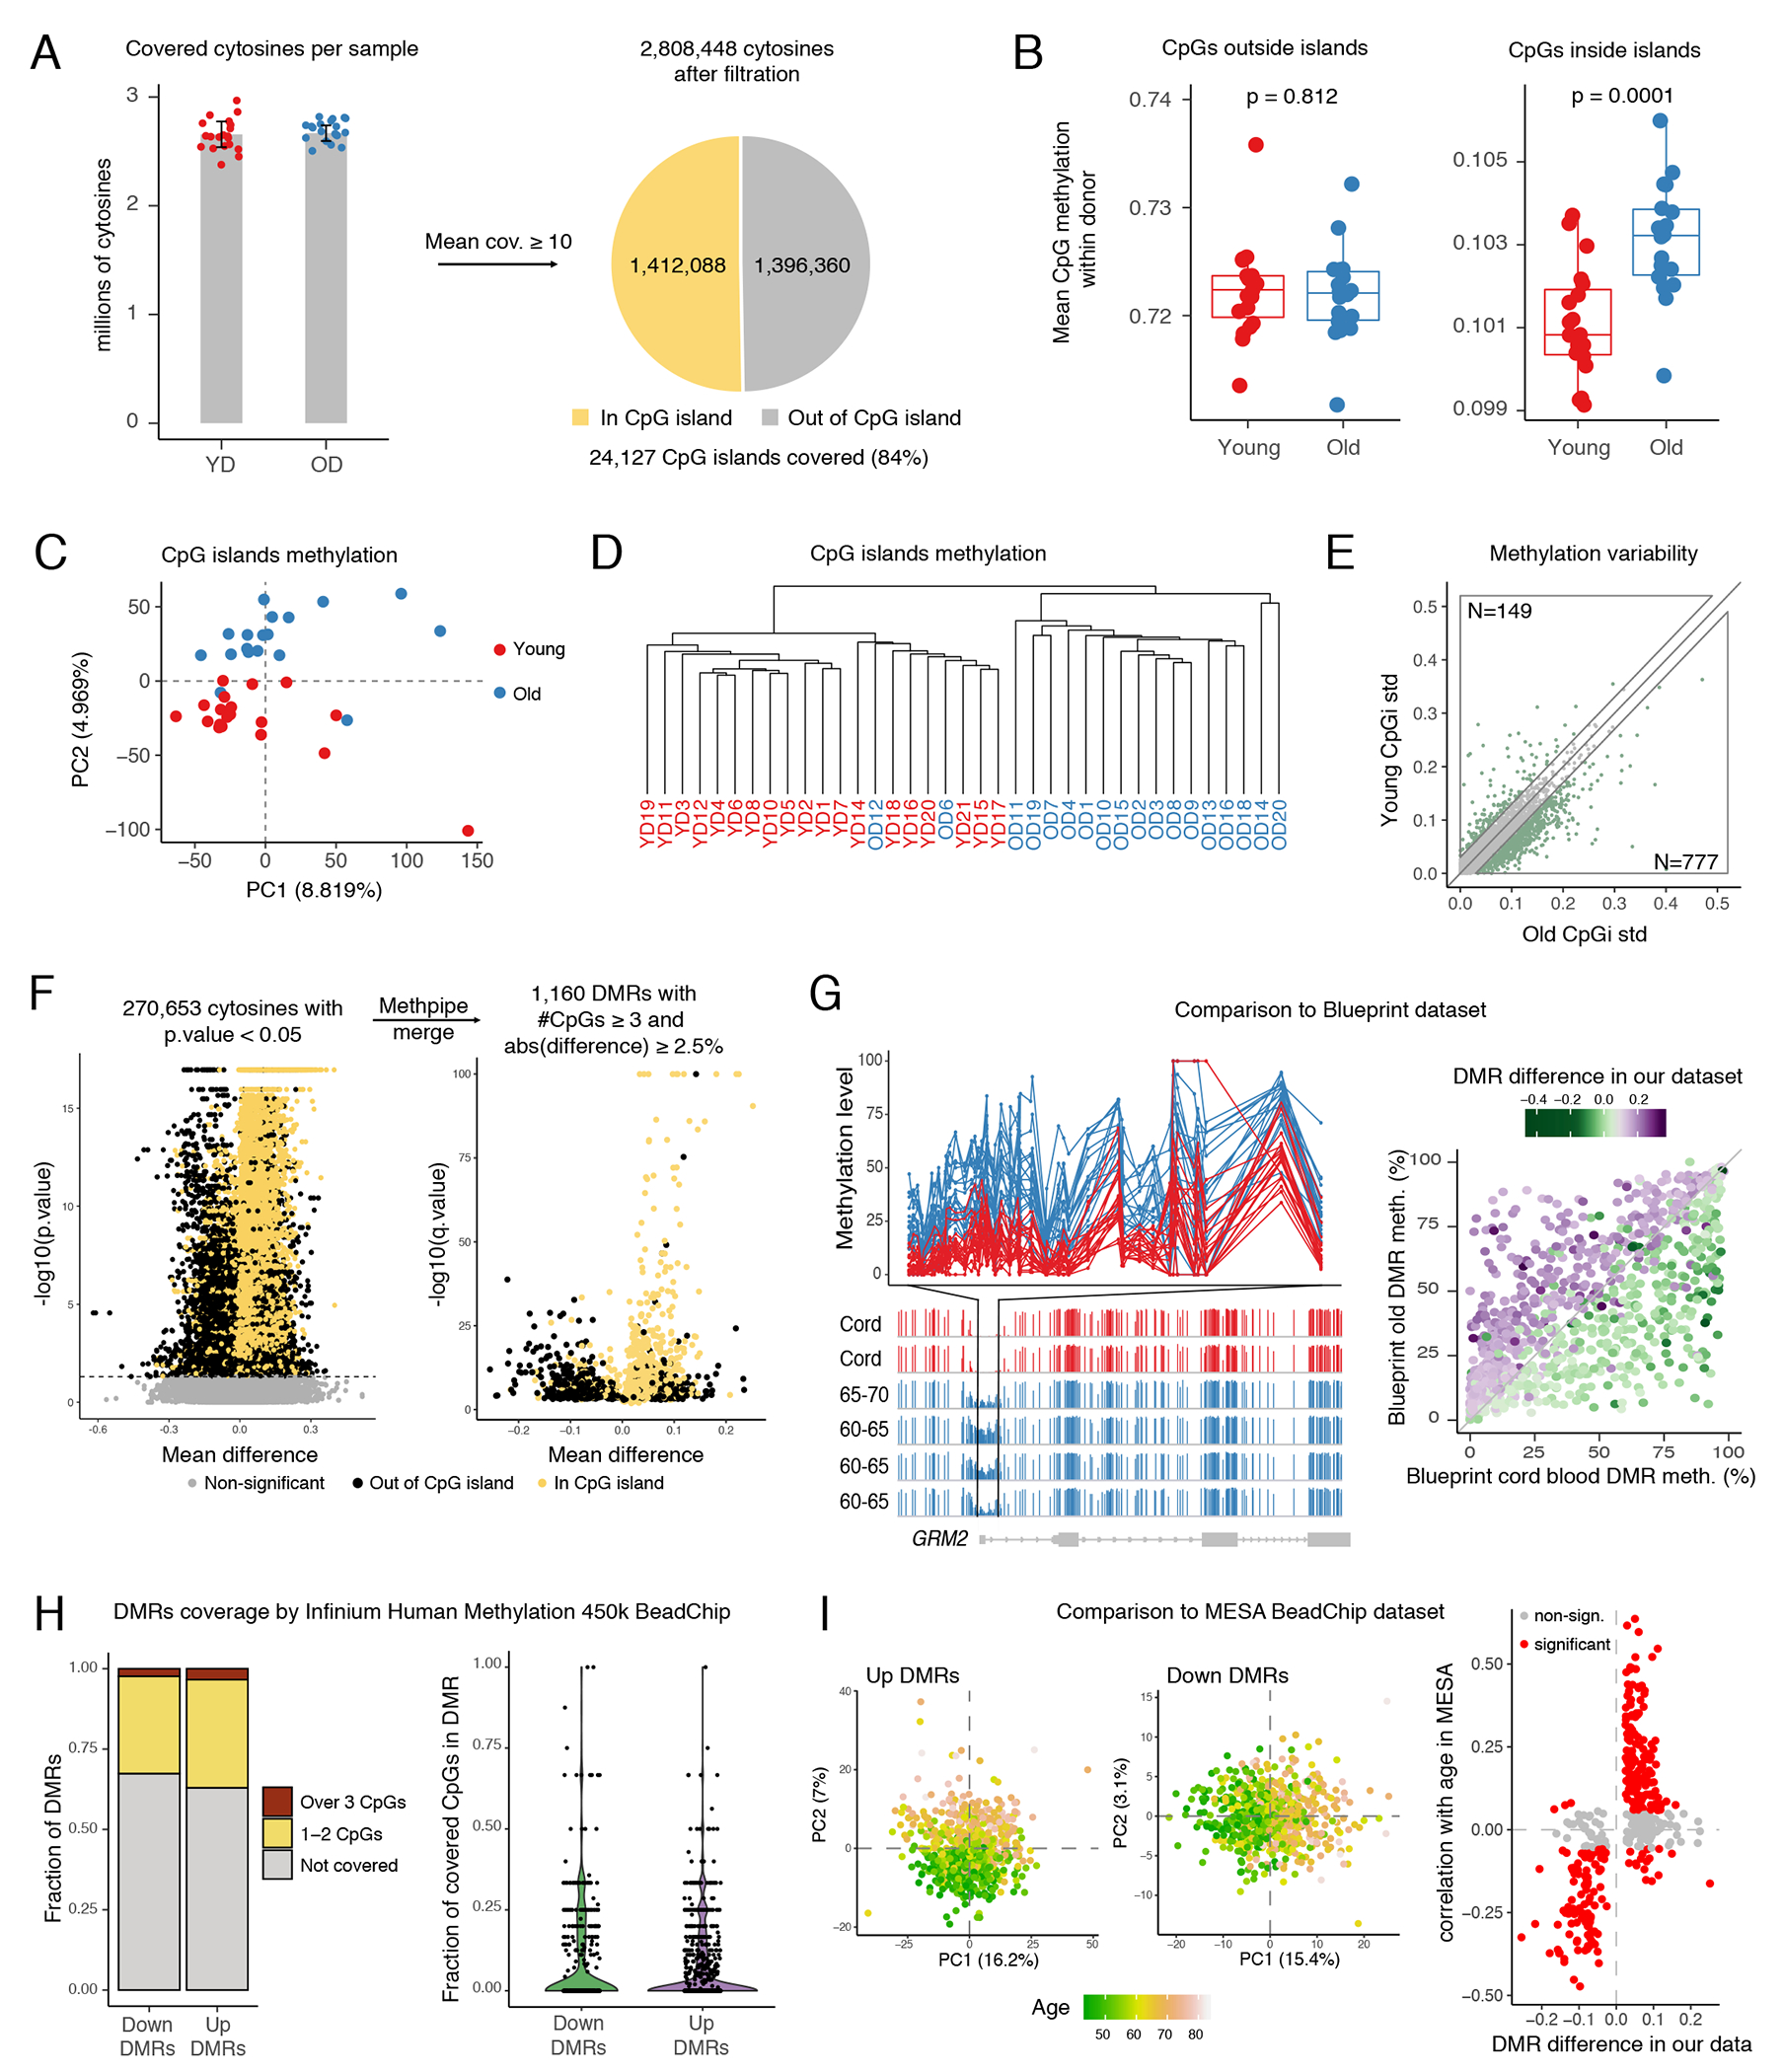
(A) Number of covered cytosines in the cohorts. Error bars present SD, their centers represent mean number of covered CpGs across the cohorts. (B) Comparison of global methylation levels between young (n=19) and old (n=18) donors. Each dot represents mean methylation of all cytosines outside (left) or inside (right) CpG islands in one sample. P-values were determined by 2-way ANOVA. The lower and upper hinges of all boxplots represent the 25th and 75th percentiles. Horizontal bars show median value. Whiskers extend to the values that are no further than 1.5*IQR from either upper or lower hinge. IQR stands for inter-quartile range, which is the difference between the 75th and 25th percentiles. (C) PCA of scaled CpG island methylation levels. Each dot represents a sample. (D) Dendrogram produced by unsupervised hierarchical clustering of all samples. Each sample described as a vector of CpG island methylation levels. Clustering using Ward algorithm and Manhattan distance as distance metric. (E) The scatter plot represents the standard deviation (std) of every CpG island within old (x axis) and young (y axis) cohorts. Upper (top left) and lower (bottom right) areas highlight islands having higher variability in young and old cohorts respectively. Numbers of both are shown. (F) Detection of DMRs. Each dot represents a CpG and a DMR on the left and right volcano plots respectively. P-values and methylation differences (average(old)-average(young)) were calculated using MethPipe toolkit (two-sided test). Consecutive significant cytosines were merged into DMRs using Methpipe (right volcano plot). DMR p-values were calculated by Fisher method and adjusted by Benjamini–Hochberg method. (G) Comparison to Blueprint dataset. Left: example of DMR in GRM2 promoter. Upper panel shows methylation level (in percent, y axis) of each cytosine inside the DMR defined by our data, x axis represents position in genome. Lines represent young and old donors. Bottom panel shows Blueprint WGBS tracks in the corresponding region for classical monocytes from cord blood (n=2) and old donors (n=4, 60-70 y. o.); y axis represents cytosine methylation levels. Right panel: each dot represents one DMR detected in our dataset. Dots above diagonal gain methylation with age according to the Blueprint dataset, dots below – lose it. (H) Summary of DMR coverage in methylation array. On the right panel each dot represents a single DMR. (I) Comparison to MESA dataset. Left: PCA of up and down DMR methylation levels in MESA dataset. Each dot represents a sample. Right: Spearman correlation of DMR methylation and age was calculate for all DMRs using MESA dataset. Each dot represents a DMR.
eRRBS, as opposed to widespread DNA methylation array technology, allows for identification of differentially methylated regions (DMRs) composed of multiple concordantly changing cytosines, which is more likely to identify biologically relevant regions. We used the MethPipe pipeline41 to perform a genome-wide comparison of the methylomes between the two groups, which yielded 1,160 DMRs (Figure 3F; Supplementary Table 12). Approximately half of the regions were hypermethylated with age and were significantly enriched in CpG islands (Figure 3F, Extended Data 5C), consistent with our observations on the global level (Figure 3B). Other regions lost methylation with age and were typically located outside the CpG islands. These findings indicated the presence of multiple demethylation events that accompanied healthy human aging and were equally as characteristic as a gain of methylation in CpG islands.
Next, we sought to establish robustness of the identified region-based signature by analyzing the behavior of these regions in publicly available datasets. Two whole genome bisulfate sequencing (WGBS) datasets focused on aging of immune cells were published previously36,42,43. In both cases group sizes were limited to 1 or 2 samples per group which precluded statistically-sound discovery of aging signature based on these data. However, the datasets could still be used for validation of aging DMRs identified from our data. First, we compared detected DMRs from our dataset to the dataset for purified classical monocytes from cord blood (n=2) and from venous blood from old donors (n=4, age 60-70 y.o.) available from the Blueprint consortium42,43. We find that methylation changes in the DMRs that we identified were highly consistent with differences in the same regions observed in Blueprint dataset. For instance, a DMR located within the GRM2 promoter encompassed 50 CpGs and showed significant difference in average methylation between cohorts in our data (Figure 3G, upper panel) as well as in WGBS data from Blueprint Consortium (Figure 3G, lower panel). High reproducibility was also a case when all DMRs were considered: we found that the changes in DMRs were consistent (Figure 3G) and highly correlated (Extended Data 5D) between our and Blueprint datasets. Similar results were obtained when we compared our signature against previously published WGBS samples from a newborn and a 103-year-old centenarian36 (Extended Data 5E).
Lastly, we compared our signature to the MESA dataset4,27 generated using DNA methylation arrays (Extended Data 5F). Out of 1,160 DMRs, only a minute fraction had 3 or more CpG covered in a widely used Infinium 450k methylation array (used in MESA study), meaning that the signature that we identified could not have been found using array-based profiling techniques (Figure 3H). Still, even despite technological differences, PCAs on cytosines located within the DMRs showed a very clear separation by age in MESA data (Figure 3I, left panel). Methylation of the most cytosines located inside DMRs significantly correlated with donor age, and the directionality of the age-associated methylation changes in the MESA dataset matched differences observed in our dataset (Figure 3I, right panel). Thus, here we report a novel set of age-associated differentially methylated regions and validate the robustness of this signature across different studies.
Age-related loss and gain of methylation follow distinct chromatin clues
To understand relationship between identified age-associated changes in methylation patterns and other chromatin features, we focused on the next layer of epigenetic regulation and characterized five post-translational modifications of histone 3 (H3) tails (H3K4me3, H3K4me1, H3K27ac, H3K27me3, H3K36me3) for monocytes from young and old groups (Figures 4A–4B; Supplementary Table 13). To generate data for histone modifications for each donor, we optimized the Ultra-Low-Input ChIP-seq protocol13. While the ULI-ChIP-seq allows for robust peak calling within individual samples, the data obtained by this method are considerably more variable between samples when compared to classical ChIP-seq approaches13 (Extended Data 6A–6B). To address this limitation, we developed a new computational approach, called SPAN, inspired by a semi-supervised method described by Hocking et al.44 (Figure 4A, Extended Data 7; Supplementary Information). Peaks called by SPAN were significantly more consistent than output of classical peak callers, as shown in Extended Data 6 by various quality control metrics. We also evaluated overlap between consensus peaks and existing ChromHMM annotation for CD14+ monocytes to show that generated chromatin profiles agreed with established functional roles of the profiled histone marks45 (Figure 4C).
Figure 4: Distinct chromatin signatures of up and down age-associated DMRs.
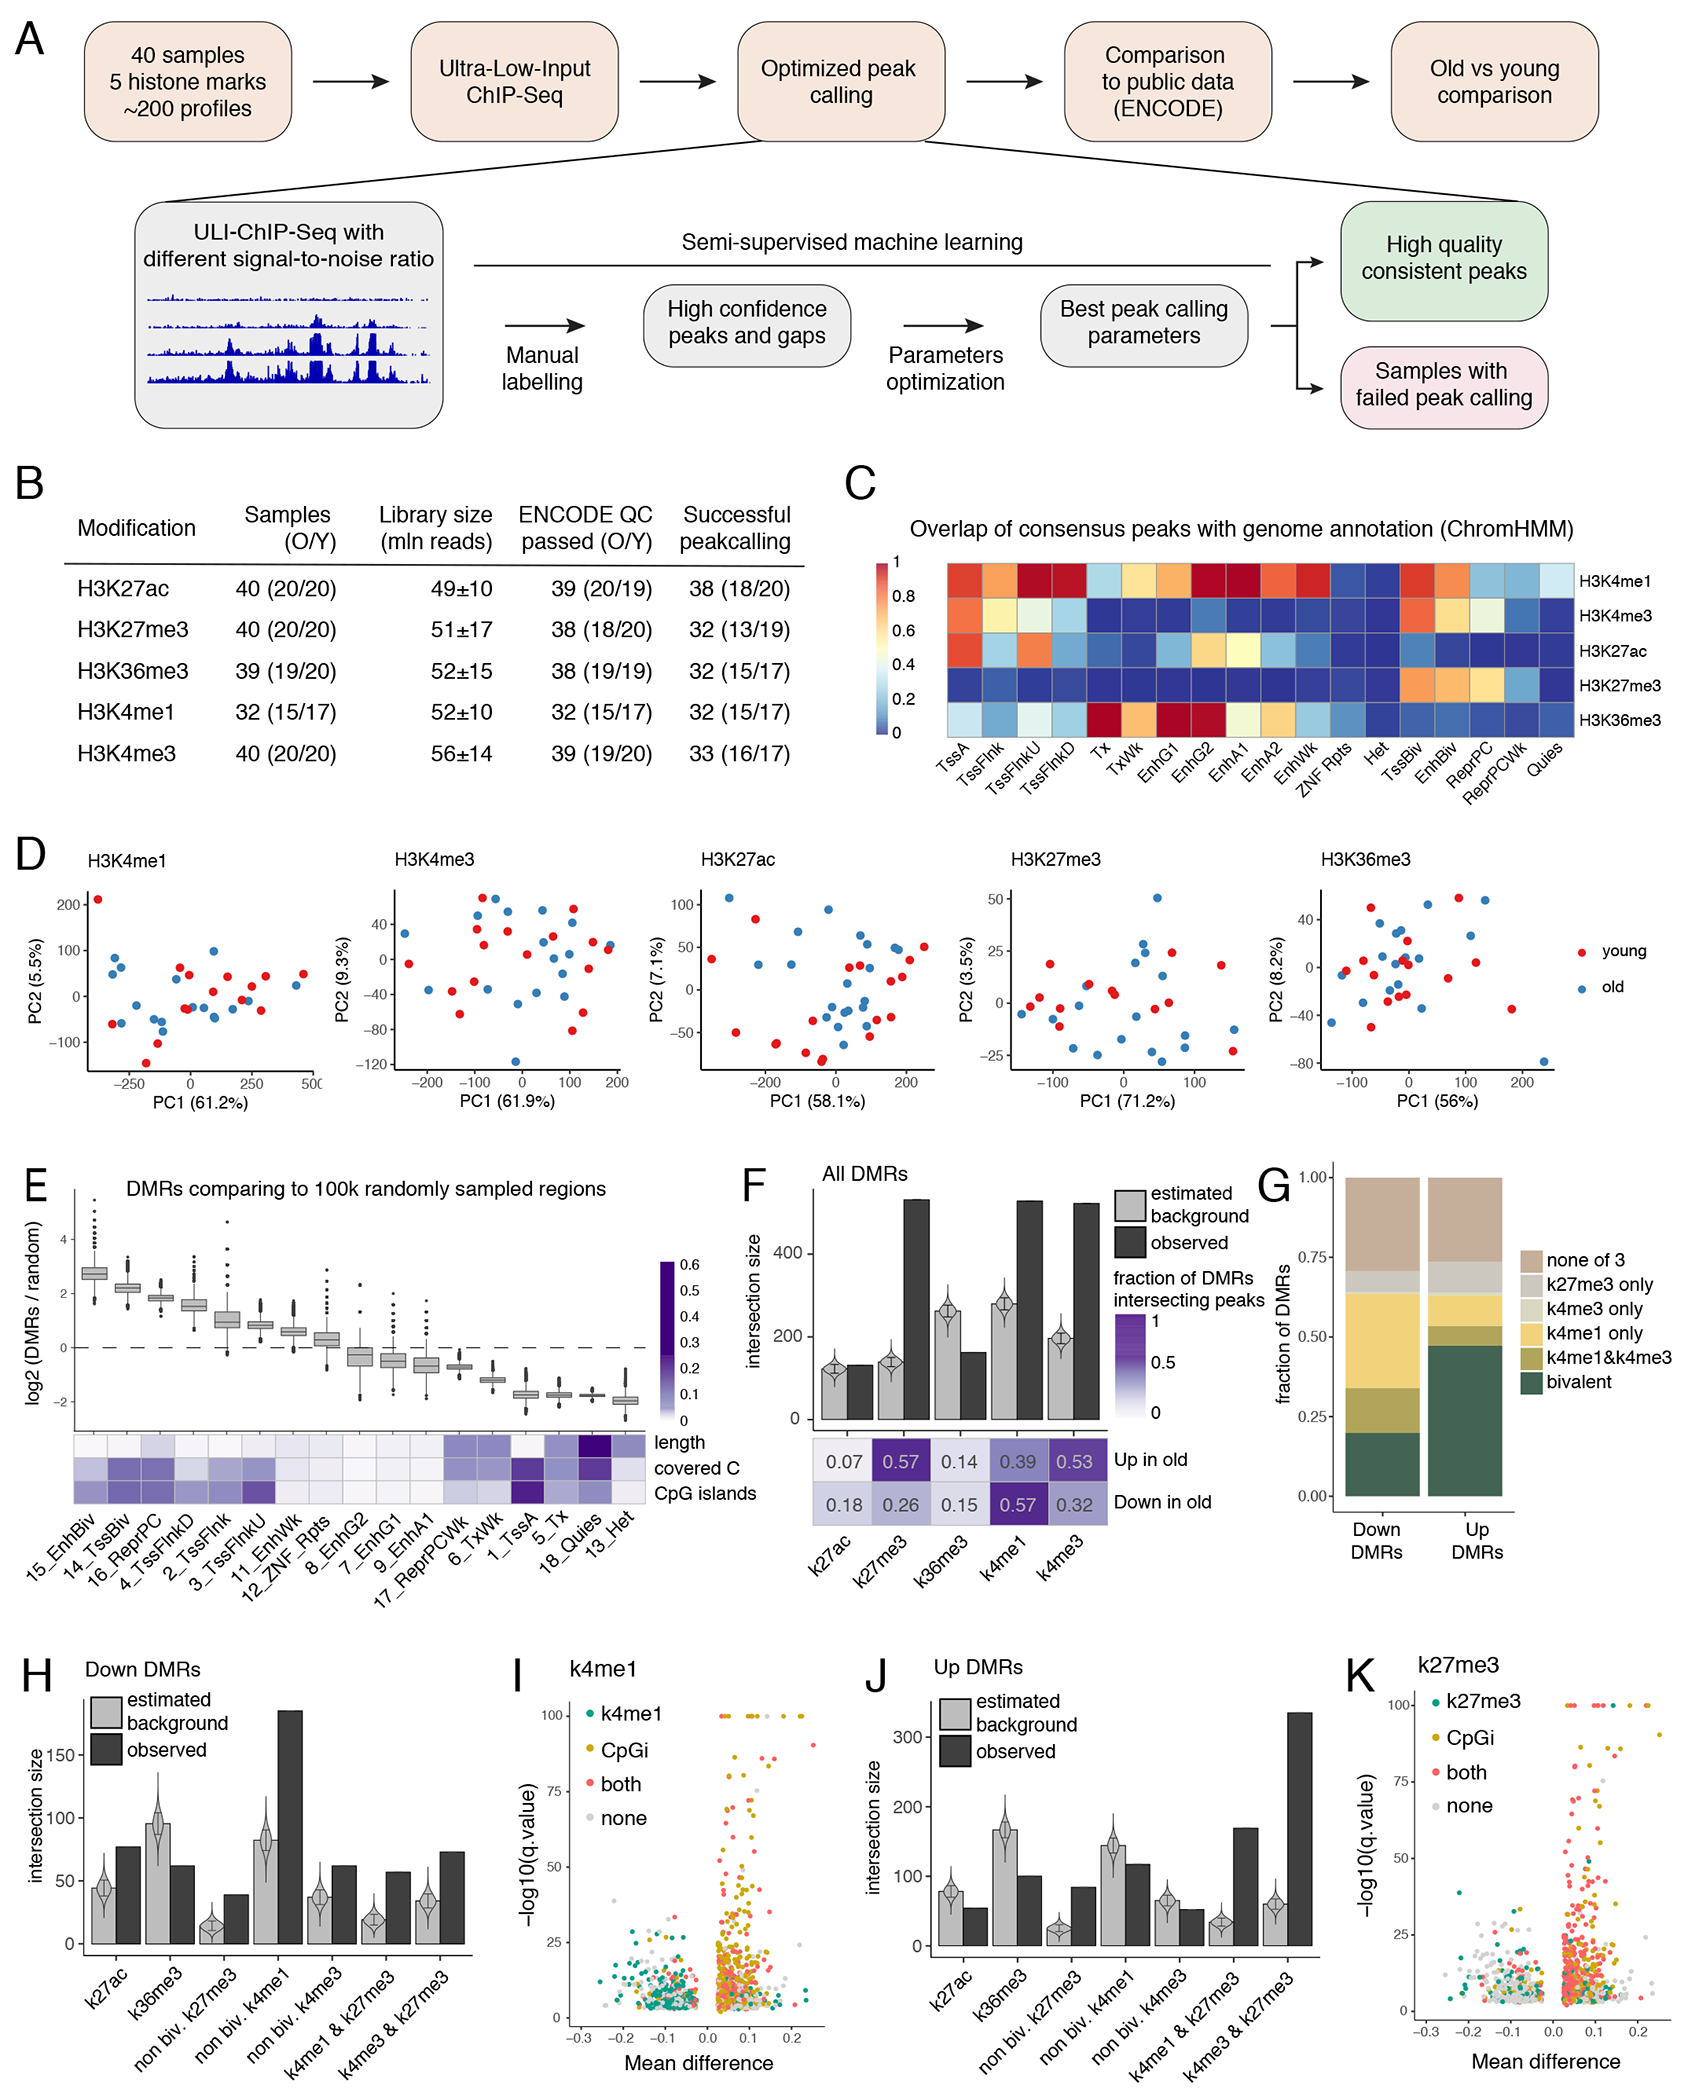
(A) Overview of chromatin profiling and processing approach based on semi-supervised machine learning. (B) ChIP-seq data QC for each chromatin mark. (C) SPAN weak consensus peaks (union of peaks confirmed by at least two samples) overlap with ENCODE 18-states ChromHMM markup for CD14+ monocytes. Overlap of ChromHMM state with histone mark is shown (overlap of column with row). (D) PCA of library depth normalized coverage in weak consensus peaks. Each dot represents a sample. (E) Enrichment of DMRs in chromatin state segments from ENCODE ChromHMM partition. Upper: boxplots represent log2 of fold change between real number of DMRs intersecting each chromatin state and expected number of intersections estimated by n=100,000 random sampling from genome regions covered in the eRRBS methylation profiling. The lower and upper hinges of all boxplots represent the 25th and 75th percentiles. Horizontal bars show median value. Whiskers extend to the values that are no further than 1.5*IQR from either upper or lower hinge. IQR stands for inter-quartile range, which is the difference between the 75th and 25th percentiles. Dots represent outliers. Bottom: heatmap shows general statistics for each chromatin state. Values are normalized within rows. (F) Enrichment of all DMRs against genome regions marked by 5 profiled histone modifications defined by weak consensus. Real number of DMRs intersecting at least one peak from the corresponding mark weak consensus was compared to the simulated intersections (n=100,000) estimated as in 4E. Error bars present SD, their centers represent mean expected intersection estimated as in 4E. Violin plots show distribution of simulated intersection sizes. Heatmap below shows fraction of hyper- and hypo-methylated DMRs that co-localize with corresponding histone modification. (G) Bar plot represents fractions of the hyper- and hypomethylated DMRs that are marked by different combinations of H3K4me3, H3K4me1 or H3K27me3. Bivalent state refers to regions that are marked by H3K27me3 and either H3K4me3 or H3K4me1. (H) Analyses as in 4F for hypomethylated DMRs only including histone modifications combinations. Non-bivalent H3K4me1 and H3K4me3 refers to regions that lack H3K27me3 mark. In the same manner, non-bivalent H3K27me3 lack both H3K4me1 and H3K4me3. Error bars present SD. (I) Volcano plot as in Figure 3F, colored in accord with DMR intersection with CpG islands and H3K4me1. (J) Same as 4H but for hypermethylated regions. (K) Volcano plot as described in 4I for CpG islands and H3K27me3.
Having ensured accurate peak calling, we investigated the age-associated changes in our datasets. PCA plots for each of the histone marks (Figure 4D) showed an absence of global differences between the two cohorts. We used a number of differential ChIP-seq tools, which detected either no differences or a small number of differences that were not reproducible between the tools and were not confirmed by visual inspection (Supplementary Figure 1). Next, we sought to leverage the multi-omics nature of our dataset and asked if chromatin landscape relates to identified age-associated DMRs. We started by comparing DMRs from our data set (Figure 3) to genomic annotation defined by ENCODE chromHMM for CD14+ monocytes (Figure 4E, Extended Data 8A–8B) and found that DMRs were highly enriched in bivalent states and Polycomb-repressed regions. Conversely, heterochromatin and quiescent states were significantly unlikely to host a DMR. Enrichment analysis of DMRs against consensus peak sets revealed overrepresentation of DMRs in regions marked with H3K27me3, H3K4me3, and H3K4me1 modifications (Figure 4F), with distinct characteristics for up and down DMRs (Figure 4G). Indeed, hypomethylated DMRs (down DMRs) showed the highest enrichment in non-bivalent H3K4me1-marked regions (Figure 4H). These regions were usually located outside the CpG islands (Figure 4I, left half of volcano plot), and the overall H3K4me1 signal was significantly higher in hypomethylated regions (Extended Data 8C). On the contrary, hypermethylated DMRs (up DMRs) typically co-localized with H3K27me3-marked CpG islands (Figures 4J–4K, right half of volcano plot). General H3K27me3 levels were significantly higher in hypermethylated regions compared to hypomethylated regions (Extended Data 8C; see Extended Data 8C–8D for the remaining chromatin marks). Overall, our data demonstrate that despite the evident age-related re-organization of DNA methylation, the histone modifications H3K4me3, H3K4me1, H3K27ac, H3K27me3, H3K36me3 are stable and do not undergo drastic re-arrangement with age in the basal state. At the same time, age-associated changes in DNA methylation are enriched within specific chromatin features, distinct for up and down DMRs.
DNA hypomethylation is directly linked to age-associated transcriptional changes
Significant fractions of both up and down DMRs were located in gene promoters (~60% and ~40% respectively, Figure 5A). Therefore, we wanted to evaluate regulatory potential of identified regions and their impact on expression level of the corresponding genes. Strikingly, while genes with hypomethylated promoters obeyed regular distribution of gene expression, genes with hypermethylated promoters were either not expressed or expressed at low levels in all samples (Figure 5B). This lack of expression of genes with hypermethylated regions (up DMRs) in their promoters is consistent with the abundance of repressive H3K27me3 mark in up DMRs (Figure 4K). These observations also suggested that hypomethylated DMRs were more likely to have a functional impact on gene expression than hypermethylated DMR. Specifically, we reasoned that age-related hypermethylation of promoters associated with up DMRs could only further decrease expression of the corresponding genes that are already lowly expressed, indicating unlikely functional consequences of this decrease. However, genes with promoters that lose DNA methylation with age (down DMRs) would increase their expression levels, indicating possible functional impact of these regions (Figure 5C, left panel). To test this hypothesis, we determined whether genes with hypo- or hypermethylated DMR intersecting their promoter region ([−10kb; +3kb] around TSS) were significantly enriched within up- or downregulated genes derived from highly-powered MESA transcriptomic dataset (Figure 2C). Strikingly, GSEA analysis indeed showed that hypomethylated DMRs were significantly upregulated with age in MESA cohort, while no significant enrichment was observed for genes with hypermethylated promoter regions (Figure 5C, right panel).
Figure 5: Distinct influence of up and down DMRs on gene expression.
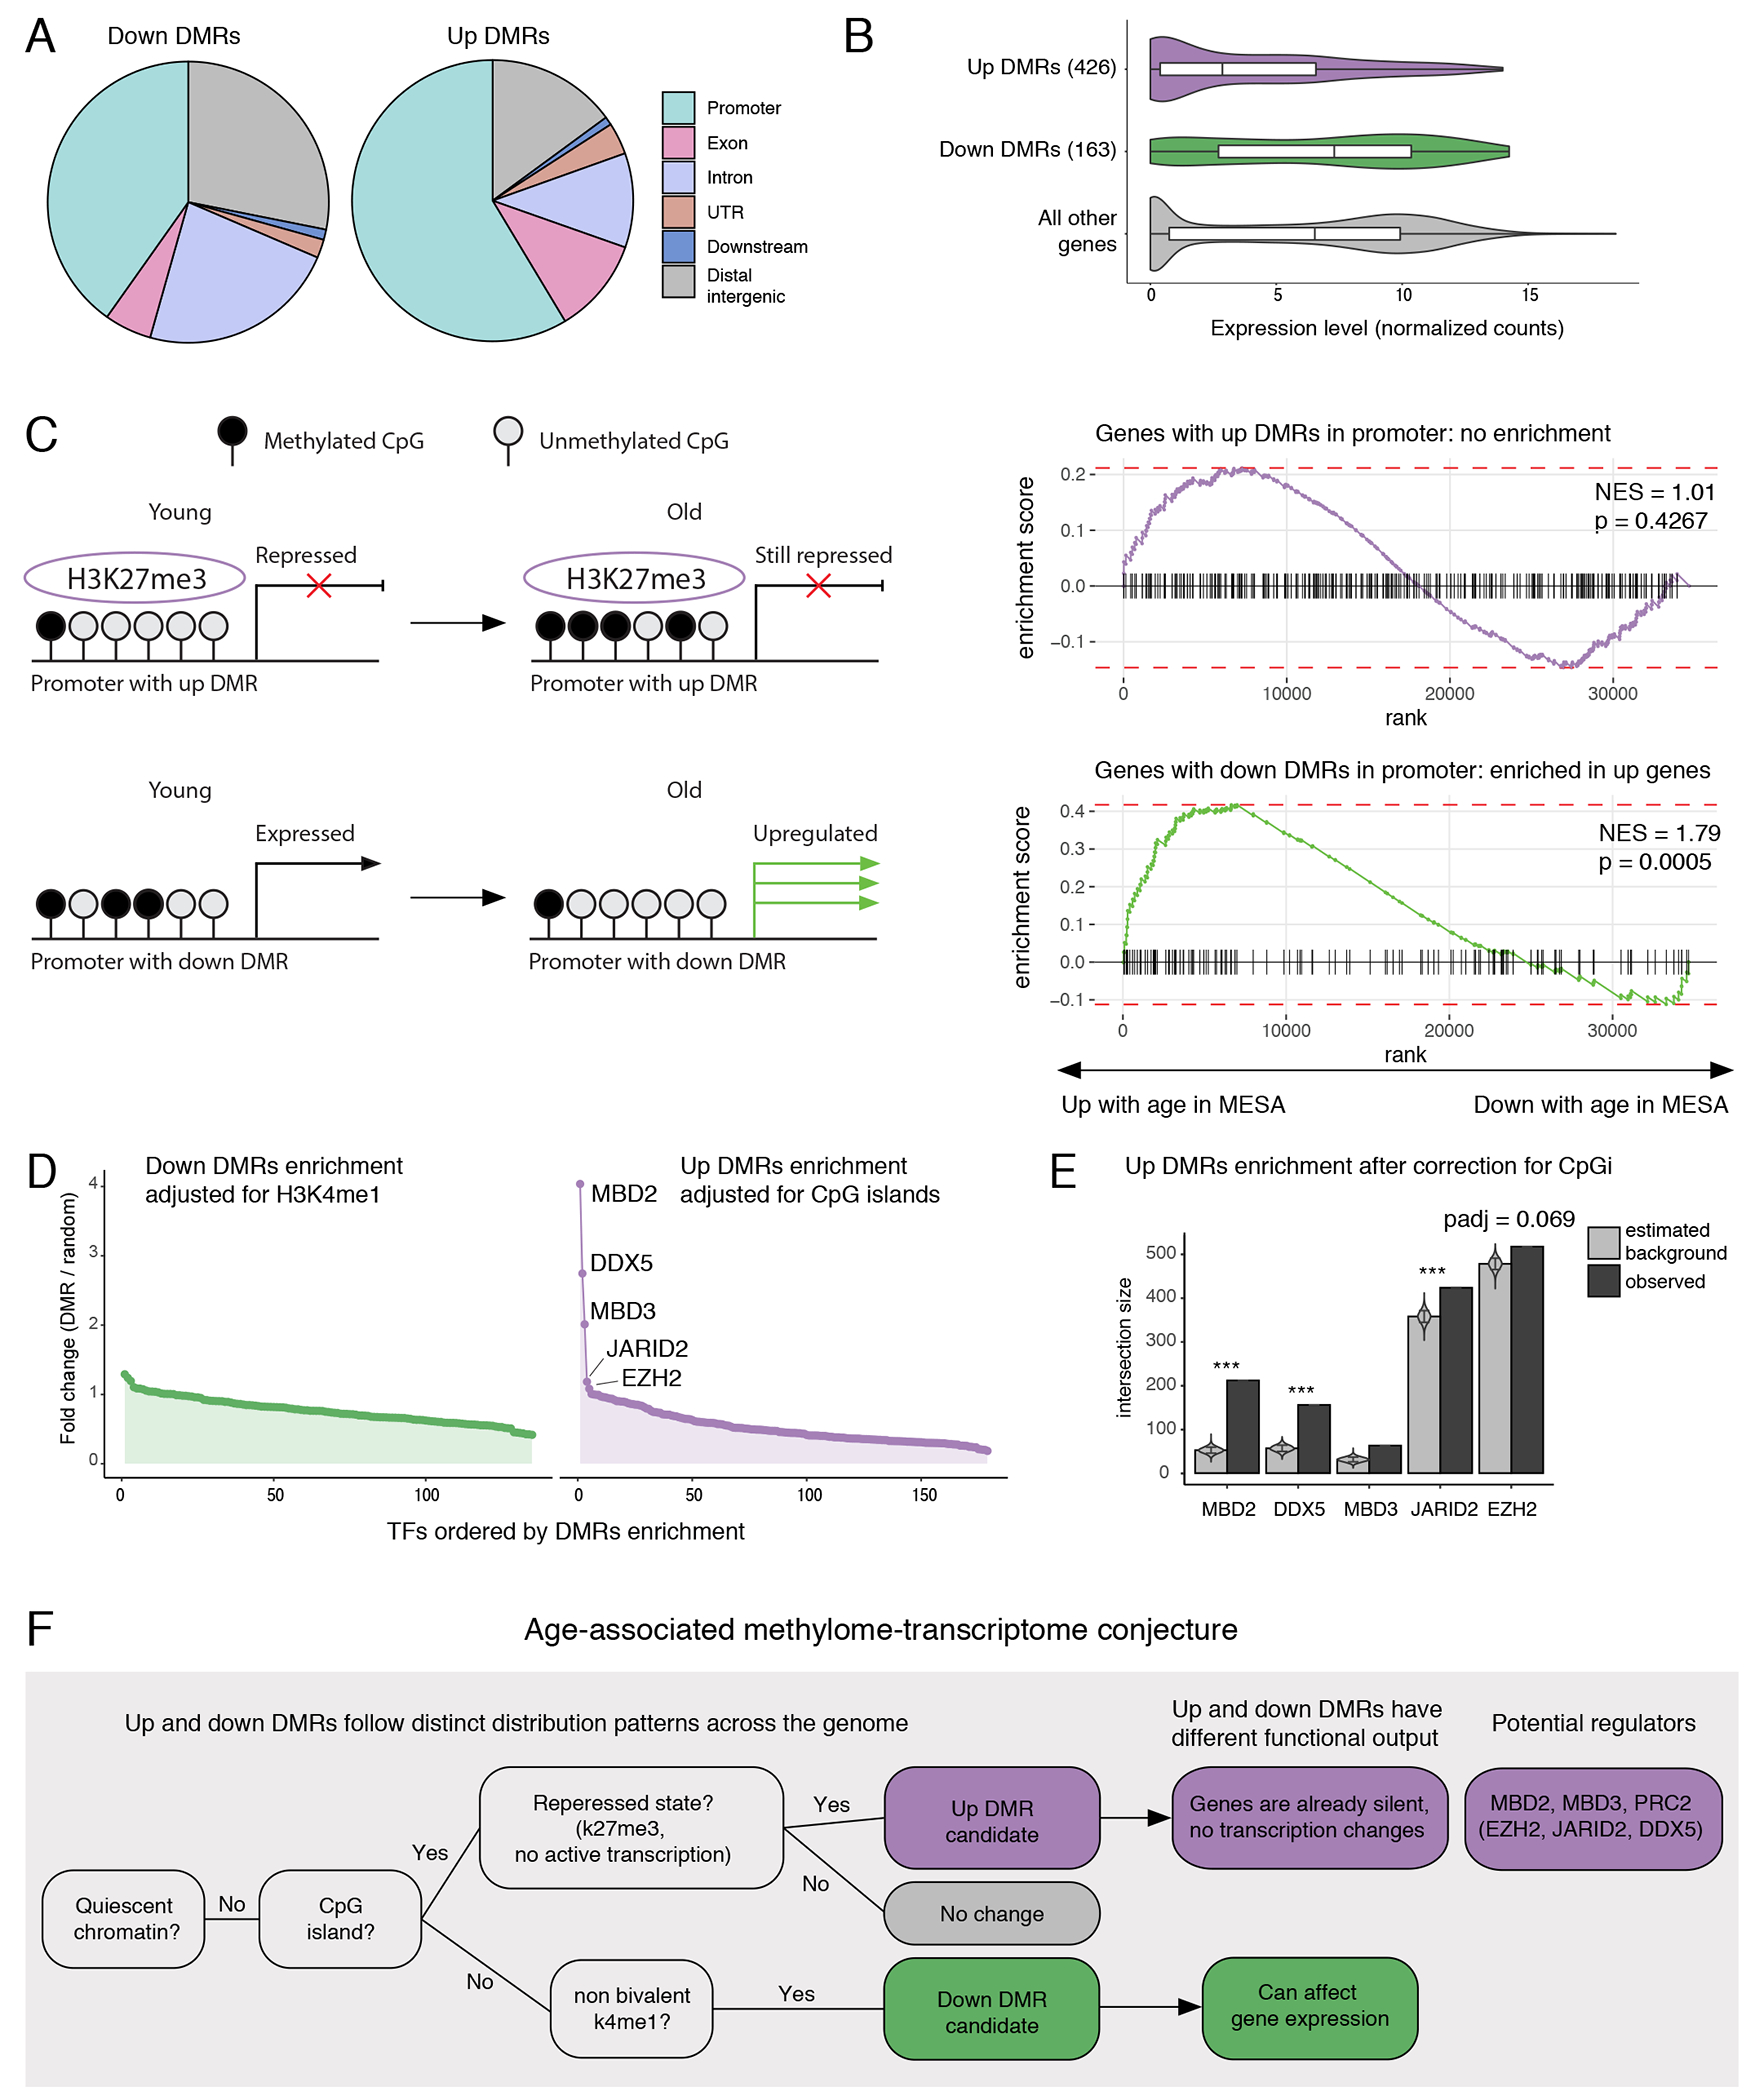
(A) Pie charts summarize location of hypomethylated (down DMRs, left) and hypermethylated (up DMRs, right) and DMRs in genome with respect to gene annotation. Promoter was defined as [−10kb; +3kb] around TSS. (B) Violin plots compare normalized expression levels of genes with hypomethylated regions within promoters (n=163), hypermethylated regions within promoters (n=426) and no methylation changes in promoters (n=19,363). Promoter was defined as in 5A. The lower and upper hinges of all boxplots represent the 25th and 75th percentiles. Horizontal bars show median value. Whiskers extend to the values that are no further than 1.5*IQR from either upper or lower hinge. IQR stands for inter-quartile range, which is the difference between the 75th and 25th percentiles. (C) Left: schematic summary of DMR regulatory outcomes hypothesis. Right: GSEA enrichment curves against MESA dataset for genes associated with up and down DMRs as in 5A. P-values are one-sided. (D) Enrichment of DMRs in transcription factors (TFs) binding sites annotated by ReMap. Each dot represents a TF. (E) Top 5 TF enrichment hits for up DMRs. Barplots compare simulated (n=10,000) and real intersections between DMRs and TF binding sites as in 4F (one-sided test, adjustment for multiple testing by Benjamini-Hochberg method). *** represents adjusted p-value < 0.001. (F) Proposed model of age-associated alterations in DNA methylation and consequent transcriptional changes.
Next, we wanted to ask if up and down DMRs tended to co-localize with any specific transcription factors. We performed enrichment analysis comparing DMRs to binding sites of 485 transcription factors annotated by the ReMap atlas, while adjusting for the local chromatin structures in order to filter out transcription factors that were inherently associated with CpG islands or H3K4me1 sites (Methods)46,47. We identified four transcription factors significantly co-localized with up DMRs after adjustment for CpG islands (Figure 5D; Supplementary Table 14). Among them, JARID2, DDX5 are known to be associated with Polycomb Repressive Complex 2 (PRC2), which is consistent with co-localization of up DMRs with H3K27me3 mark. But surprisingly, we also identified two novel transcription factors from one family – MBD2 and MBD3, that had not been linked to age-related DNA hypermethylation previously (Figure 5E). All detected proteins were highly expressed in monocytes (Extended Data 8E), making them strong candidates for potential regulators of age-associated DNA methylation gain.
Together with enrichment of the DMRs in the specific chromatic signatures, these comparisons highlighted a distinct regulation as well as functional importance of the DMRs identified in our analysis. We propose the following hypothesis to describe the relationship between age-related DNA methylation, its regulation, and its physiological impact on cellular function (Figure 5F). Hypermethylated regions are enriched within CpG islands and are often characterized by bivalent signal. These regions are associated with silent genes, and, consequently, their hypermethylation has little impact on the already absent expression. In contrast, hypomethylated regions are generally outside of CpG islands and enriched in regions marked by H3K4me1 alone. Hypomethylated DMRs are associated with age-related upregulation of their corresponding genes.
Up and down DMRs behave distinctly in different physiological and clinical contexts
Next, we investigated behavior of up and down DMRs in a variety of physiological and clinical settings related to aging. Since most of the public datasets were generated using DNA methylation array technology, we were able to retrieve methylation levels of only a fraction of DMRs in this analysis, as discussed above (Figure 3H). Nevertheless, we found that average methylation level of cytosines from up and down DMRs that were covered by the array was able to accurately capture the difference between young and old twin pairs48 (Figure 6A). Furthermore, this metric correlated significantly with age of donors from MESA dataset (Figure 6B, p-value < 0.001 for both), indicating that methylation of these regions continued to change with age even in a population that was older than our studied cohort. However, the behavior of up and down DMRs was different when we looked at the data from bulk brain tissue of a healthy aging cohort49: average methylation of up DMRs was still associated with age, down DMRs failed to show significant correlation with age (Figure 6C). While more comprehensive analysis of various cell types and tissues is required to make a solid conclusion, this observation suggests differential tissue/cell type specificity of up and down DMRs.
Figure 6: Up and down DMRs behave differently in various pathological contexts.
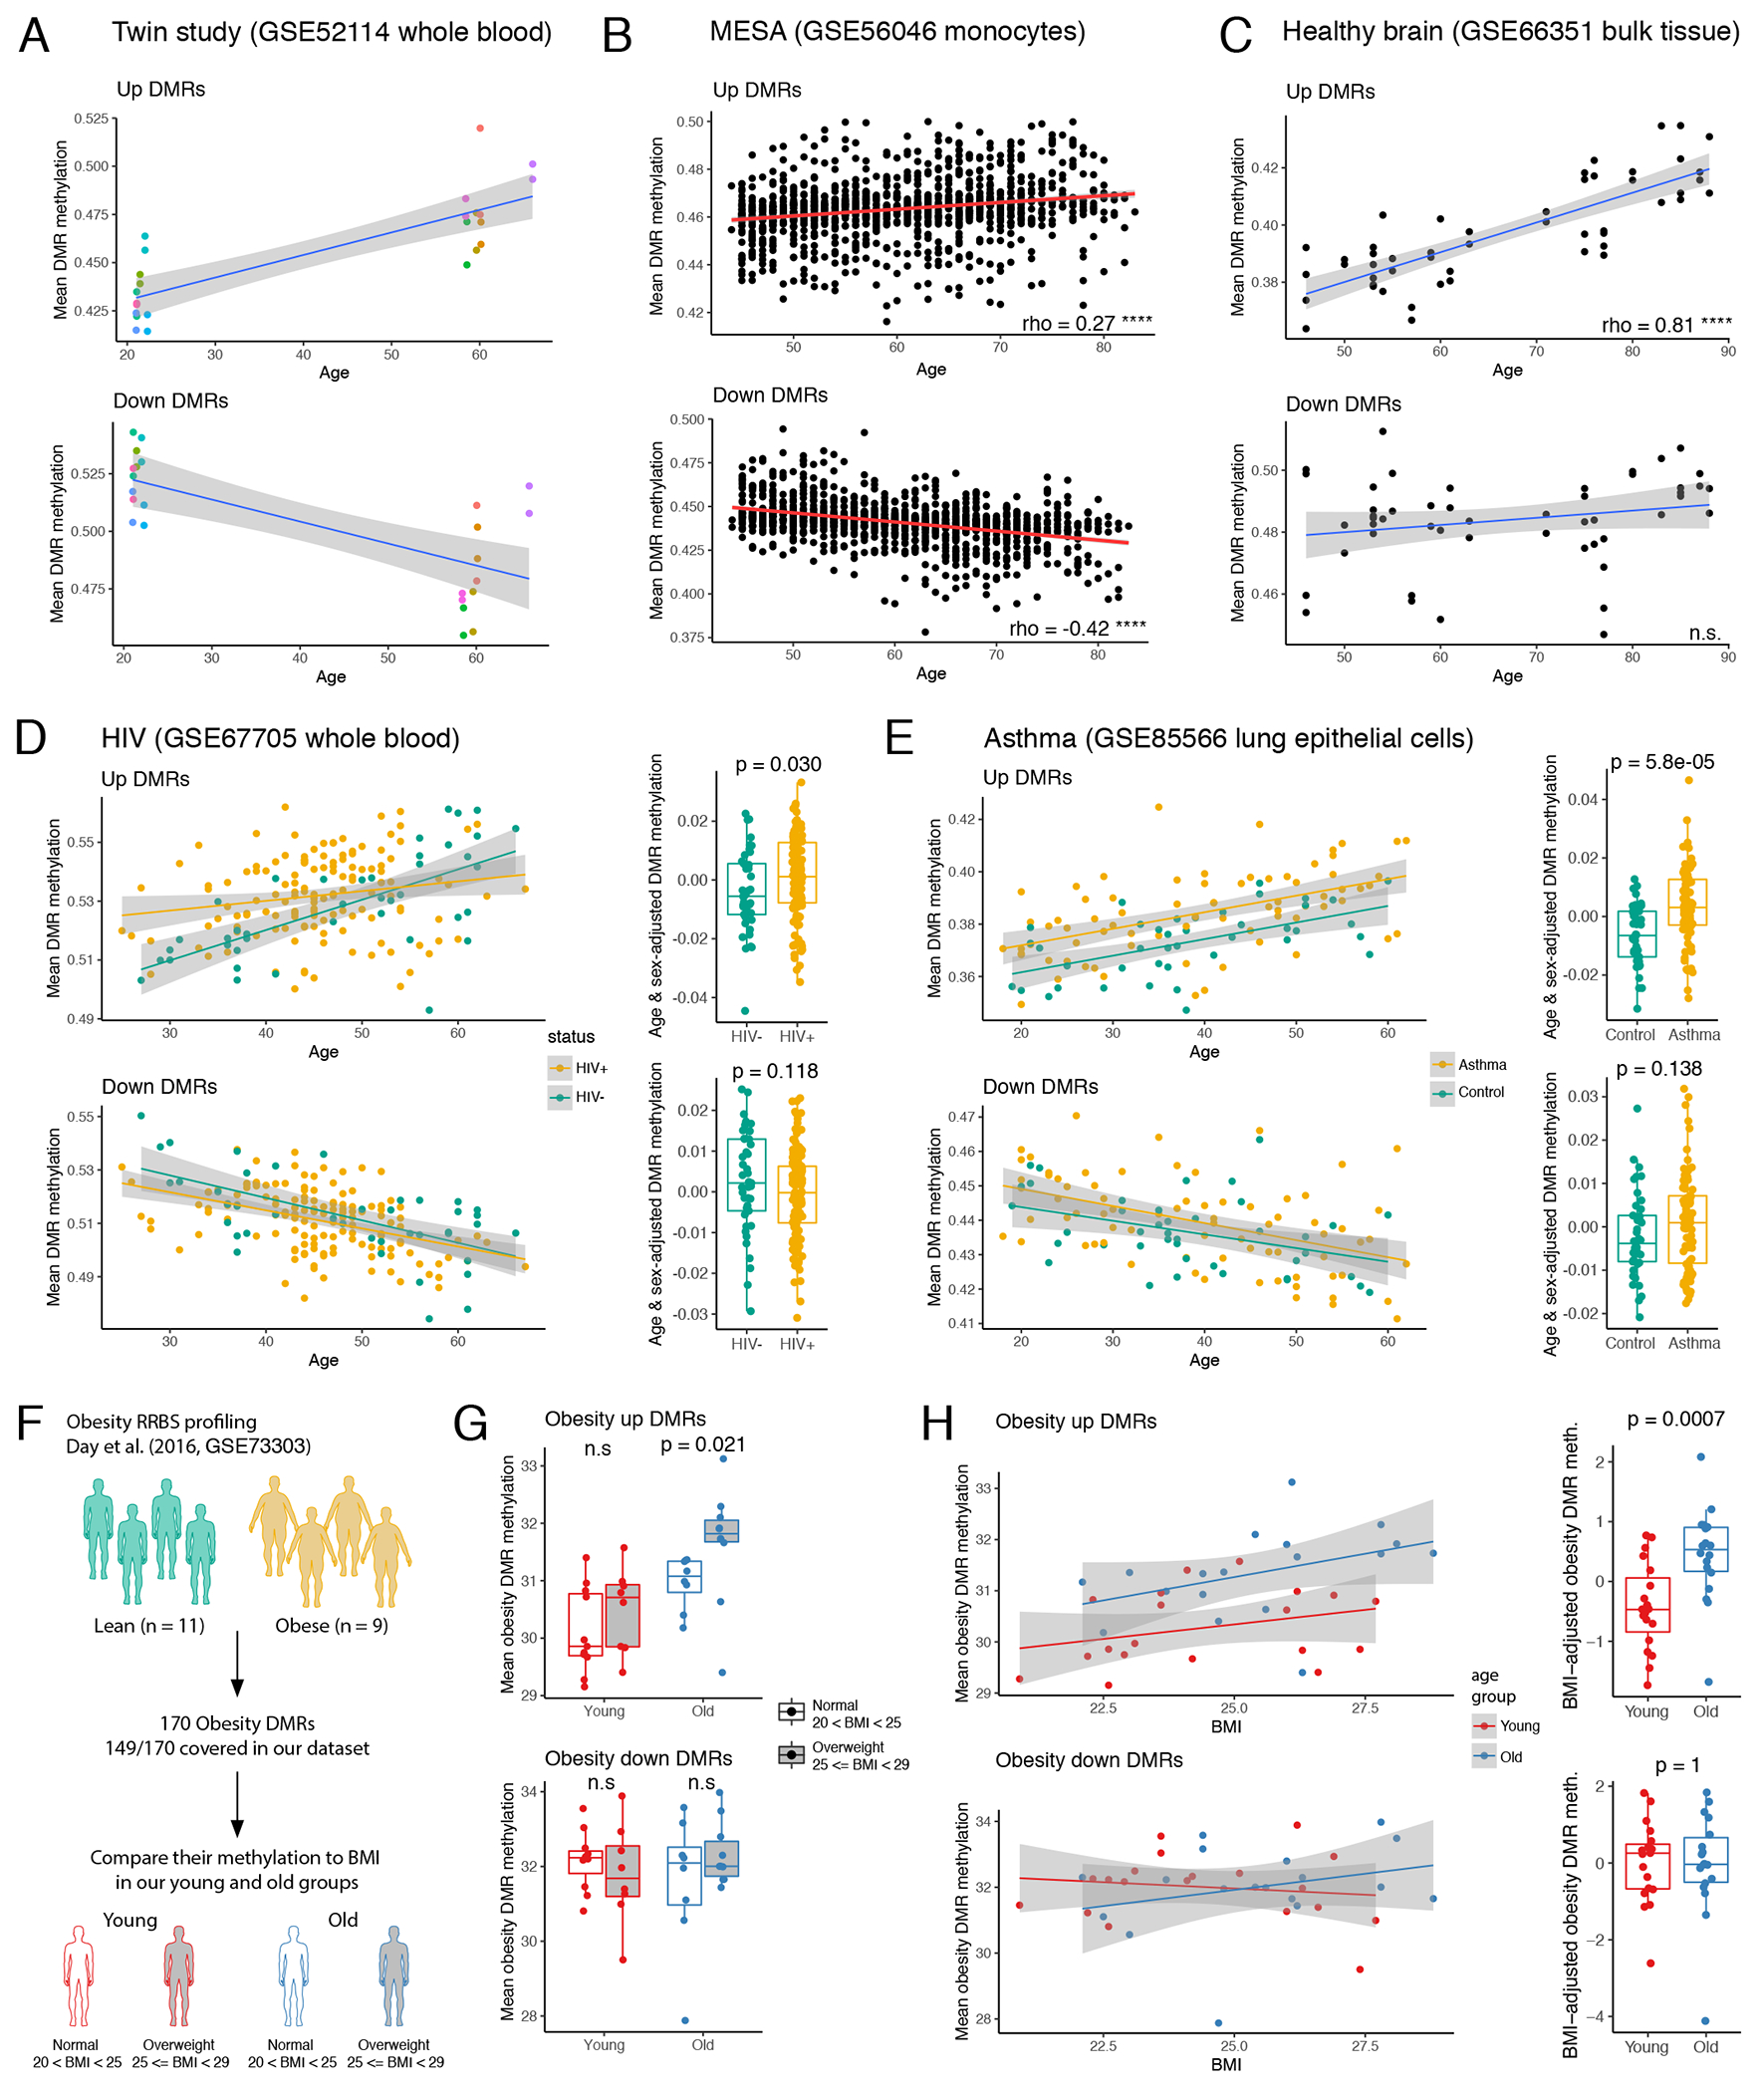
(A) Methylation of CpGs that resided in up or down DMR and were profiled by methylation array was averaged for each donor and plotted against donor age. Each dot represents one donor from a twin study (color indicates a pair of twins). (B) Mean methylation of up and down DMRs as in 6A for samples from (B) MESA cohort and (C) bulk brain from healthy donors. Spearman correlation coefficient is shown for both. **** indicates p-value < 2.2.e-16, n.s. = nonsignificant correlation. (D) Left: plot as 6A for HIV positive and negative donors. Right: comparison of age- and sex-adjusted DMR mean methylation between HIV positive (n=139) and negative (n=41) donors. Each dot represents one donor. P-values calculated using two-sided Mann-Whitney U test. (E) Same as 6D for asthma cases (n=74) and controls (n=41). (F) Scheme of analysis of established previously obesity DMRs in our aging cohort. (G) Mean methylation of obesity DMRs in our cohort: young lean (n=11), young overweight (n=8), old lean (n=8), and old overweight (n= 10). P-value was calculated using two-sided Mann-Whitney U test. (H) Left: mean methylation of obesity DMRs in our donors plotted against donors BMI. Each dot represents one donor. Right: comparison of BMI-adjusted obesity DMR mean methylation between young (n=19) and old donors (n=18). P-values calculated using two-sided Mann-Whitney U test. Shaded error band in panels (A), (C)-(E), and (H) represents SE. In panels (D), (E), (G), and (H), the lower and upper hinges of all boxplots represent the 25th and 75th percentiles. Horizontal bars show median value. Whiskers extend to the values that are no further than 1.5*IQR from either upper or lower hinge. IQR stands for inter-quartile range, which is the difference between the 75th and 25th percentiles.
To test whether up and down DMRs were relevant for the phenotype of accelerated aging, we compared DMR methylation in HIV positive donors and matching controls50. Strikingly, while age was robustly associated with both up and down DMRs, age acceleration in HIV individuals was evident only for hypermethylated up DMRs (Figure 6D, left). Comparison of age- and sex-adjusted levels of mean methylation allowed to quantify this difference, confirming that up DMRs were more methylated in HIV patients irrespective of donors age (Figure 6D, right). Further analysis of published clinical phenotypes revealed novel association with age acceleration: we find that methylome of lungs of asthma patients demonstrate age acceleration in the similar manner as observed for HIV patients (Figure 6E). To our knowledge, this is the first report of epigenetic clock acceleration driven by asthma. Notably, we did not observe any age acceleration or delay in either brain or blood of Alzheimer’s disease patients (Extended Data 9A).
Next, we asked whether changes in DNA methylation driven by lifestyle choices were also affected by age. We focused on obesity and smoking phenotypes due to available RRBS data for these features that enabled investigation of corresponding signature in our dataset. Smoking51 did not demonstrate any connection with age-associated DMRs (Extended Data 9C). However, comparing signatures of obesity reported by Day et al.52 to our dataset, we were able to observe a non-trivial relationship between DNA methylation, aging and BMI. Based on their RRBS data, Day and co-authors identified 170 obesity DMRs that were well covered in our eRRBS data (Figure 6F). Importantly, obesity and age-associated DMRs were distinct sets of genomic regions, and no change in methylation in age-associated DMRs between lean and obese groups was observed (Extended Data 9B). Next, we looked at the obesity-associated DMRs and leveraged variability of BMI in our cohort to compare it to our data. Even though none of our donors were obese, we saw consistent increase in mean methylation of obesity up DMRs in overweight group, but only in case of older donors (Figure 6G). Consistently, when mean methylation of obesity-associated up and down DMRs was plotted against BMI, it was evident that obesity up DMRs were significantly more methylated in the older donors from our cohort (Figure 6H). This suggests that methylome of healthy young individuals is more robust to small variations in lifestyle (e.g. weight change), while in old individuals even mild BMI differences can impact the DNA methylome.
Hypomethylated regions are genetically linked to a number of conditions
Lastly, we compared age-associated DMRs against medical and population genetic databases, such as UK Biobank. We evaluated overrepresentation of DMRs in sets of single nucleotide polymorphisms (SNPs) linked to 34 clinical phenotypes through genome-wide associated studies (GWAS). While overall distribution of DMRs across the chromosomes was fairly random, we found DMRs to be significantly enriched in four sets of SNPs (Figures 7A–7B). Only down DMRs showed enrichment in physiological phenotypes (Figure 7B), which was consistent with our previous observation that hypomethylated regions had more functional potential in contrast to hypermethylated DMRs, associated with predominantly silent genes. Specifically, down DMRs were significantly overrepresented in SNPs associated with asthma, level of glycated hemoglobin (Hb), total protein in blood, and multiple sclerosis (MS). Majority of SNPs associated with significant phenotypes were located within human leukocyte antigen (HLA) locus on 6th chromosome (Figures 7C–7D). This genomic region contains multiple genes regulating immune response, including genes that encode antigen processing and presentation complexes. We confirmed statistically significant enrichment of down but not up DMRs in HLA locus by random simulations (Figure 7E). One of down DMRs resided directly in an exon of HLA-DQB1 gene, encoding a part of MHC class II complex (Figure 7F). Therefore, age-associated changes in DNA methylation have potential to alter antigen presentation by monocytes and monocyte-derived macrophages.
Figure 7: Down DMRs are enriched in genetic susceptibilities loci for asthma, MS, glycated Hb, and total protein.
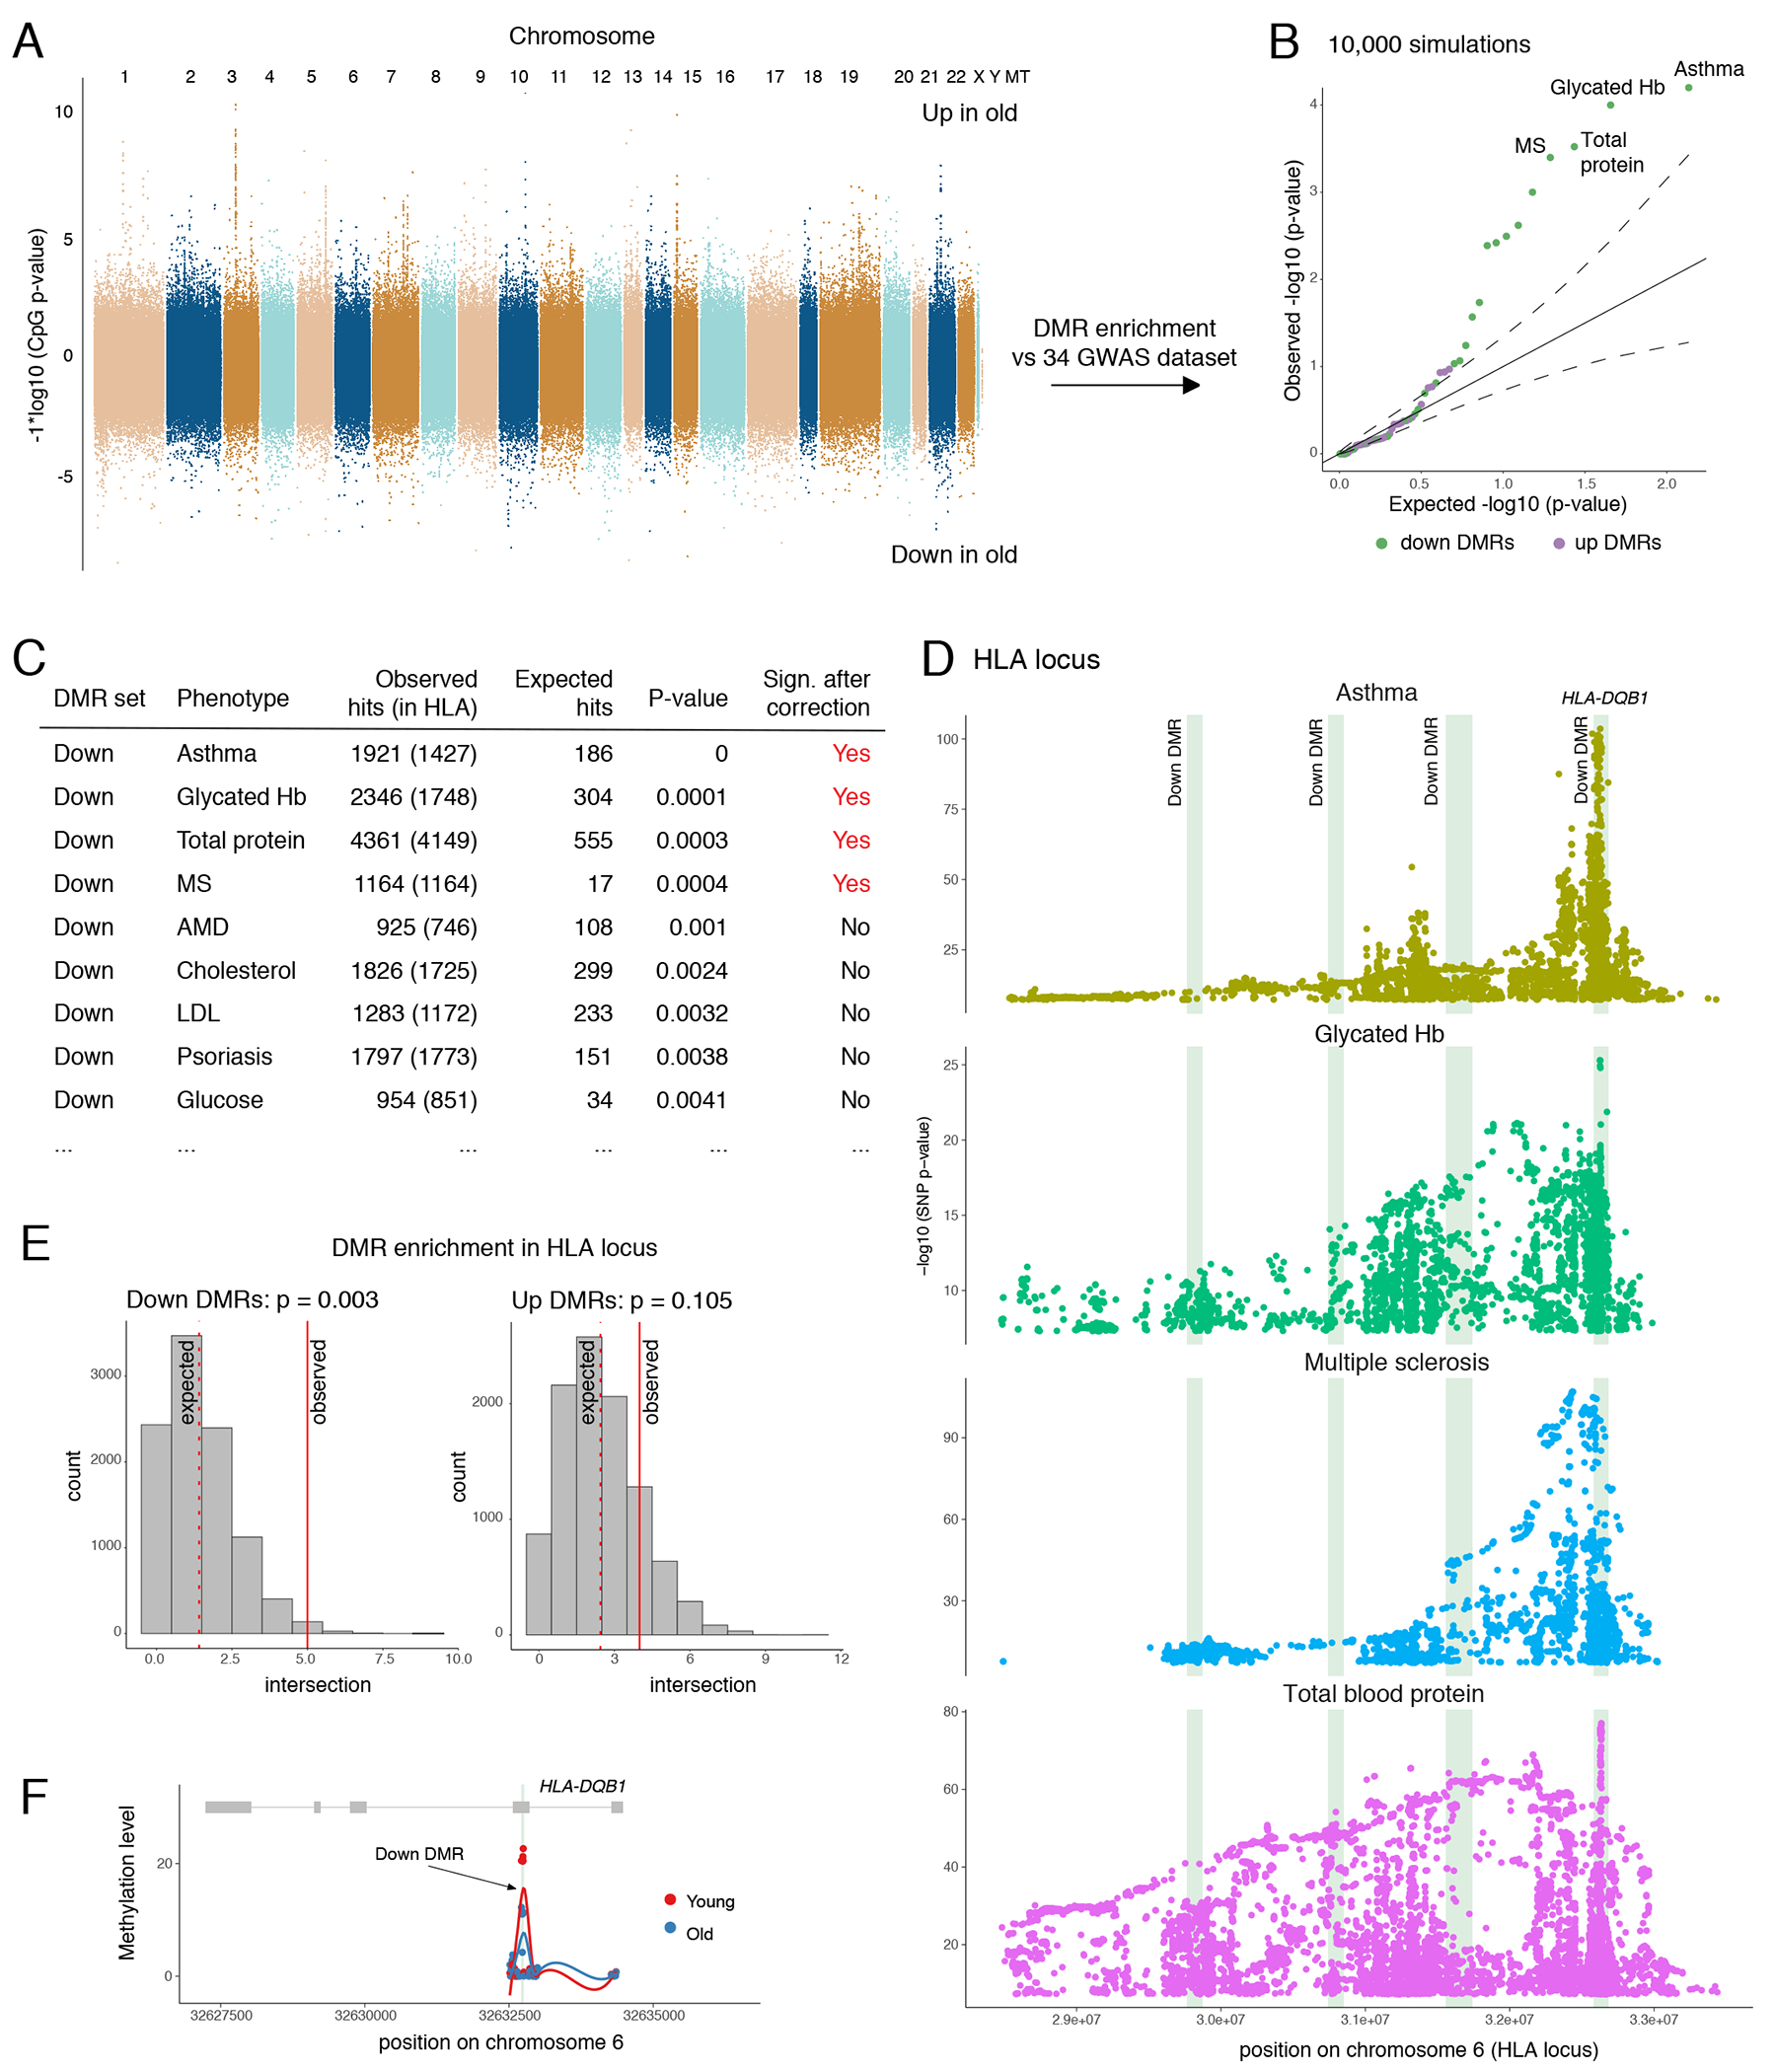
(A) Manhattan plot of chromosomal locations and corresponding −log10(p-values) for CpGs compared between old and young donors as in Figure 3F. (B) Quantile-quantile plot for DMR enrichment analysis against GWAS datasets. Each dot represents a phenotype compared against down or up DMRs. (C) Top hits of DMR enrichment analysis. (D) Manhattan plots of SNPs associated with significant phenotypes and located within HLA locus. Green vertical bars highlight down DMRs located in this locus. (E) Enrichment of DMRs in HLA locus. Histogram shows distribution of simulated intersection sizes (10,000 random simulations). (F) Visualization of DMR intersecting HLA-DQB1 exon. Each dot represents a CpG, green vertical bar highlights the DMR. P-values in panels (B), (C), and (E) are calculated by one-sided enrichment test as described in methods. P-values in panel (D) retrieved from GWAS catalog.
DISCUSSION
We generated and analyzed data describing transcriptomic, proteomic, and epigenetic changes in human CD14+CD16− monocytes during physiological aging using a stringently selected healthy male cohort. We show that in the absence of other inflammatory conditions, aged monocytes are associated with cell intrinsic alterations in DNA methylation patterns yet are not associated with any dramatic rearrangements in their transcriptional or chromatin profiles for five common chromatin marks (H3K4me3, H3K27me3, H3K4me1, H3K27ac, and H3K36me3). This result is consistent with the absence of a global change in the abundance of various histone modifications in monocytes that was recently shown using CyTOF38. Importantly, co-analysis of our data with the MESA transcriptional dataset that includes 1,200 monocyte samples28 showed that while transcriptional differences definitely accompanied aging, their magnitude was very small and required high statistical power to be detected, at least in the case of classical monocytes. It is feasible that larger cohort studies might also uncover statistically significant differences in histone modifications between ages, yet it is fair to conclude that the absolute magnitude of such changes would likely be very moderate. Furthermore, age is known to be sex-dysmorphic53, suggesting that more profound changes could be identified between female cohorts by future studies.
Utilization of next generation sequencing-based technology (eRRBS) allowed us to establish a pattern of age-associated changes in DNA methylation and define differentially methylated regions that change with age. In contrast to previous studies that focused on DNA methylation array data and, therefore, identified sets of single-standing CpGs associated with age4, we identified age-associated regions that represented concordant changes across multiple neighboring cytosines. This strategy yielded highly robust and physiologically relevant regions as shown by their ability to clearly capture age-specific variations in multiple independent published datasets (Figures 3 and 6). We found that hypo- and hypermethylation regions were nearly equally frequent in our data and that they differed significantly in their genomic locations, chromatin profiles and relation to the transcriptional activity. Hypermethylated regions were found to be strongly associated with H3K27me3-marked CpG islands residing in promoters of silenced genes. This pattern matches a previously proposed hypothesis that Polycomb is involved in age-associated hypermethylation54,55. In addition, we identified MBD2 and MBD3 as new putative regulatory candidates strongly associated with up DMRs. We found hypomethylated DMRs to be highly enriched in non-bivalent regions carrying the H3K4me1 mark, consistent with comparison of mesenchymal stem cells age-associated signature versus cell line ChIP-seq data48. This observation might suggest indirect regulatory function of down DMRs and provide a new insight into possible mechanisms of age-associated methylation loss that are yet to be revealed. Unlike CpG islands, the H3K4me1 modification mark sites that often co-localize with cell type specific regulatory regions56. Accordingly, this suggests that down DMR might be more cell type specific. Altogether, these observations underscore the existence of orthogonal processes (global and cell-type specific) establishing age-related DNA methylation patterns as well as the importance of profiling pure cell populations.
Most importantly, hypo- and hypermethylated DMRs also exhibited a striking difference in their regulatory impact on transcriptional activity of the associated genes. While genes associated with hypomethylated regions showed a normal expression level distribution, hypermethylated regions were predominantly linked to repressed genes. Accordingly, since methylation gain would only lead to further decrease in transcription, we observed no downstream transcriptional effect of the hypermethylated regions. The hypomethylated regions, however, showed significant enrichment among the genes upregulated with age as defined through re-analysis of data from the large independent cohort (MESA). This observation establishes the functional output of age-associated hypomethylation of DNA, proposes that these down DMRs have a more direct effect on the transcriptional state of the cell, and explains the mechanism behind upregulation of a subset of age-related genes. With respect to age-associated hypermethylation of already silenced genes, this process can serve as a protective mechanism that allows cells to avoid tumorigenic transformation57.
Enrichment of identified hypomethylated DMRs among functionally important regions further underscores their regulatory potential. We observed overrepresentation of down DMRs in HLA region, suggesting effect of methylation changes on antigen presentation. This enrichment also drives significant intersection of down DMRs with SNPs associated with asthma, multiple sclerosis, and other phenotypes. Gradual nature of age-associated changes of DNA methylation might explain why diseases such as multiple sclerosis and adult onset asthma develop later in life. Interestingly, in case of asthma, only half of SNP-DMR intersections were explained by demethylation of HLA locus, revealing more robust link between DNA methylation and the disease. We also showed for the first time that asthma was associated with acceleration of methylation clock in lung epithelial cells. Surprisingly, down DMRs were not sensitive to this acceleration, suggesting that asthma itself does not drive changes in methylation of down DMRs, but age-related loss of methylation in these regions can affect expression of genes linked to asthma by GWAS.
Overall, we propose a model that separates and characterizes two distinct types of DNA methylation changes and dissects their input into age-associated alterations of cellular state. As next steps, it will be important to understand the functional drivers that control age-associated loss and gain of DNA methylation as well as the higher-level physiological consequences of these changes.
METHODS
Detailed protocols and computational methods are also available in Supplementary Information and on the website https://artyomovlab.wustl.edu/aging/methods.html.
Ethics Statement
All human studies were approved by the Washington University in St. Louis School of Medicine Institutional Review Board (IRB-201604138). Written informed consent was obtained from all participants. Healthy, Caucasian, non-obese (BMI under 30) males were enrolled in the study in two groups (Figure 1A). Young donors between 24 - 30 years (n=20) and old non-frail donors between 57 - 70 years (n=20) of age were included. Using a screening questionnaire, subjects were asked about lifestyle and health issues. Subjects with any previous history of cancer, inflammatory conditions (rheumatoid arthritis, Crohn’s disease, colitis, dermatitis, fibromyalgia or lupus) or infections (HIV, hepatitis B, C) were excluded. Smokers were also excluded. Blood (~100ml) was collected by venous puncture in the morning (8 – 10 a.m.) after overnight fasting. Some of the older donors self-reported blood pressure alterations/medication, which was not considered as a reason for exclusion.
Complete blood profiles (CBCs) and monocyte isolation
Briefly, venous blood was collected in Sodium-Heparin vacutainers. CBCs and blood cell differentials were determined using a Hemavet 950FS analyzer within 2 hours of blood draw. Plasma and blood cells were separated using Histopaque-1077 according to the manufacturer’s protocol (SIGMA). Briefly, whole blood was diluted 1:1 with sterile DPBS-2mM EDTA and overlaid (30ml) on to 10ml of Histopaque-1077. Gradients were centrifuged at 500xg for 30 minutes. The upper phase containing plasma was carefully aspirated and stored at −80°C until further use. Peripheral blood mononuclear cells (PBMCs) were isolated and CD16+ cells were depleted using anti-human CD16 Milteyni magnetic beads using manufacturer’s protocol. After CD16 depletion, CD14+ monocytes were purified using anti-human CD14 magnetic beads (Milteyni). Purity (>98%) was determined by flow cytometry (Extended Data 4A) and cells were either cryopreserved in Cryostor preservation media or snap frozen and stored at −80°C. The detailed protocol is available on the website.
Flow cytometry
Purified monocytes were incubated with human Fc block and then stained with anti-human CD14 (BD Biosciences #347493, Clone MΦP9, LOT 6022603) and CD16 (BD Biosciences #561310, Clone B73.1, LOT 6074532) antibodies. Data were collected on FACS Canto (BD Biosciences, San Jose, CA) or Cytek-modified FACScan (BD Biosciences and Cytek Development, Fremont, CA) instruments and analyzed with FlowJo (Tree Star, Ashland, OR).
Bioplex and ELISA
Plasma was profiled using Mesoscale V-plex pro-inflammatory panel I human kit (IFN-γ, IL-1β, IL-2, IL-4, IL-6, IL-8, IL-10, IL-12p70, IL-13, TNF-α) and statistical differences in data obtained were determined by two-sided Mann-Whitney U test. ELISA kits were used to determine GDF-15, Sclerostin (RnD), Osteomodulin (Aviva), Notch1 (Thermofisher), and sCD86 (Abcam) as per manufacturer’s instructions.
Plasma Profiling: metabolomics
For each donor 250μL of frozen plasma was shipped on dry ice to Metabolon (http://www.metabolon.com) for Liquid Chromatography-Tandem Mass Spectroscopy (LC-MS). 734 peaks were annotated. Pre-processing was performed by Metabolon: peaks were quantified using area-under-the-curve and each compound was corrected in run-day blocks by registering the medians to equal one and normalizing each data point proportionately (termed the “block correction”) to correct variation resulting from instrument interday tuning differences. YD20 was excluded from the analysis as an outlier based on PCA. Significant differences in metabolites between cohorts were determined using two-sided Mann-Whitney U test. P-values were adjusted for multiple testing using the Benjamini-Hochberg method. Pathway annotation was provided by Metabolon. For each pathway collective statistical significance was determined by comparing mean log2FC of pathway members to zero using a one sample two-sided Mann-Whitney U test. P-values were adjusted for multiple testing using the Benjamini-Hochberg method. Significance threshold was set to 0.05 in for all comparisons.
Plasma Profiling: proteomics
For each donor 500μL of frozen plasma was shipped on dry ice to the GTAC core facility at Washington University in St. Louis for high-density protein expression analysis via SomaScan assay58. Profiles for ~1,300 analytes were acquired. Pre-processing was performed by GTAC core facility at Washington University in St. Louis: raw RFU measurements for every SOMAmer reagent were normalized subsequently with hybridization normalization, plate scaling, median scaling, and calibrator normalization and transformed in log2 scale. Differential analysis was done for young vs. old groups using quantile-normalized data for all 40 samples. For differential analysis, functions lmFit and eBayes from the Limma package (v3.34.5)59 were used. P-values were adjusted for multiple testing using the Benjamini-Hochberg method.
Correlation analysis (Extended Data 3E) used significant plasma proteins and all profiled plasma metabolites that had non-zero variance. Pheatmaps of absolute values of Spearman correlation coefficients were plotted using Pheatmap R package (v1.0.12).
RNA-Seq data: young versus old monocytes
Total RNA was isolated from snap frozen monocyte pellets using Qiagen’s RNeasy Mini Kit according to the manufacturer’s protocol. RNA concentration and integrity were assessed by Agilent 2200 Tape Station. RNA samples were submitted to BGI (Hong Kong, China) for long non-coding RNA sequencing and small RNA sequencing. After library construction, paired-end 100 base pair reads were generated on the DNBseq platform.
Fastq files for each sample were aligned to the hg19 genome (Gencode, release 28) using STAR (v2.6.1b) with the following parameters: STAR --genomeDir $GENOME_DIR --readFilesIn $WORK_DIR/$FILE_1 $WORK_DIR/$FILE_2 --runThreadN 8 --readFilesCommand zcat --outFilterMultimapNmax 15 --outFilterMismatchNmax 6 --outReadsUnmapped Fastx --outSAMstrandField intronMotif --outSAMtype BAM SortedByCoordinate outFileNamePrefix ./$58. Quality control for each sample was performed by FastQC (v0.11.3) and Picard tools (v2.18.4). Quantification was done using htseq-count function from HTSeq framework (v0.9.1): htseq-count -f bam -r pos -s no -t exon $BAM $ANNOTATION > $OUTPUT.
Raw counts were normalized prior to PCA via getVarianceStabilizedData function from DeSeq2 package (v1.24.0). Differential expression analysis was done using DESeq function from DeSeq2 with default settings. Following design was used in the analysis: gene ~ age + batch + PC1 + PC2 + PC3. PC1, PC2, and PC3 are three main principle components explaining genetic variability in the cohort60. Genotype data was retrieved from ChIP-seq raw reads as described in Supplementary Information and Supplementary Figure 2. Significance threshold was set to adjusted P-value < 0.05.
Publicly available transcriptional data
Transcriptomic dataset for MESA cohort was re-analysed28. GSE56045 contains normalized expression values for purified human monocytes. Differential analysis was performed using Limma package (v3.34.5). We accounted for cofounding variables by including chip and race-gender-site parameters into model design: gene ~ age + chip + race-gender-site. Age was used as continuous variable, no separation into age groups was performed. P-values were adjusted for multiple testing using Benjamini & Hochberg method. Significance threshold was set to FDR < 0.05. Gene set enrichment analysis via fgsea R package61 (v1.10.0) was used to identify significantly altered pathways and plot enrichment curves.
RNA-Seq data: differentiation and stimulation of monocytes
Differentiation of primary human CD14+CD16− monocytes into resting macrophages occurred after 7 days of culture in RPMI media supplemented with 11 mM glucose, 2 mM glutamine and 10% fetal calf serum in the presence of 50 ng/ml of M-CSF (Peprotech, cat# 300-25). 5 × 10⁵ CD14+CD16− monocytes or 2.5 × 10⁵ resting macrophages were activated with 10 ng/ml of lipopolysaccharides (LPS) from E. coli (Sigma, O111:B4) or mock for 24 hr.
RNA was isolated from monocytes and macrophages using AllPrep DNA/RNA Mini Kit (Qiagen, cat# 80204) and treated with RNAse-free DNAse (Qiagen, cat# 79254). Libraries were prepared as described previously62. Briefly, cDNA was synthesized using custom oligo(dT) primers with a barcoded adaptor-linker sequence (CCTACACGACGCTCTTCCGATCT-XXXXXXXX-T15). Barcoded cDNA was pooled together based on ActB qPCR values and the RNA-DNA hybrids were degraded by consecutive acid-alkali treatment. A second sequencing linker (AGATCGGAAGAGCACACGTCTG) was ligated via T4 ligase (NEB), followed by clean up with SPRI beads (Beckman-Coulter). The libraries were amplified by 12 cycles of PCR and cleaned up with SPRI beads, yielding strand-specific RNA-seq libraries. Data were sequenced via HiSeq 2500 40 bp x 10 bp paired-end sequencing.
Files obtained from the sequencing center were demultiplexed using fastq-multx tool. Fastq files for each sample were aligned to the hg19 genome (Gencode, release 28) using STAR (v2.6.1b) with the following parameters: STAR --genomeDir $GENOME_DIR --readFilesIn $WORK_DIR/$FILE --runThreadN 8 --outFilterMultimapNmax 15 --outFilterMismatchNmax 6 --outReadsUnmapped Fastx --outSAMstrandField intronMotif --outSAMtype BAM sortedByCoordinate --outFileNamePrefix ./$58. Quality control for each sample was performed by FastQC (v0.11.3) and Picard tools (v2.18.4). Aligned reads were quantified using a HTSeq-based quant3p script63 (available at https://github.com/ctlab/quant3p) to account for specifics of 3’ sequencing: higher dependency on good 3’ annotation and lower level of sequence specificity close to 3’ end. DESeq2 (v1.24.0) was used for analysis of differential gene expression.
Monocyte proteomic data
For monocyte proteomic analysis we used an independent cohort of donors that was recruited using the same inclusion criteria as in the rest of the study (n=11 samples per group). For each donor, snap frozen monocytes (1x10^6) were shipped on dry ice to Biognosys for protein extraction and LC-MS analysis. Details of Biognosys Discovery protein profiling pipeline (HRM ID+ mass spectrometry) can be found on their website (https://biognosys.com/technology/#discovery-proteomics). On average, 5,580 proteins were quantified per sample. In total, 5,804 proteins represented by 74,348 peptides were quantified across all samples. Statistical assessment was performed by Biognosys (Supplementary Table 9D. In brief, for each protein the fold change of each peptide ion variant was estimated as average abundance of peptide ion variant across biological replicates in old group / average abundance of peptide ion variant across biological replicates in young group. The values then were log-transformed and fold changes of all peptides belonging to the same proteins were compared to zero using two-sided paired t-test. Multiple testing correction was performed as described in Storey et al.64 We removed MHC proteins from the analysis due to high similarity between the variants that could not be accurately resolved using this data. For visualization purposes (Figure 2G) we used protein intensities estimated as an average of the top three peptides for each protein (Supplementary Table 9E.
Monocyte eRRBS data acquisition
Genomic DNA was extracted from snap frozen monocyte pellets (1-2 million cells) using the Qiagen’s all prep RNA/DNA extraction kit as per manufacturer’s instructions. Fragment size was confirmed by Agilent Tape Station to be >40 kb with no significant degradation. 1μg of genomic DNA was submitted to the Epigenomics Core at Weill Cornell Medicine for eRRBS library prep and sequencing.
Monocyte eRRBS data analysis: initial processing, QC and filtration
Initial processing of raw data was performed by Cornell Epigenomics Core according to the standard pipeline described in35. Average conversion rate was higher than 99.75% for all samples and sequencing depth varied between 80,359,782 and 58,727,376 reads per sample (Extended Data 5A, Supplementary Table 11). The eRRBS protocol mainly focuses on CpG-rich regions so only a fraction of the entire genome was covered. Therefore, while cytosines in CpG, CHH and CHG contexts were present in the dataset, only cytosines in the context of CpG were well-covered across the majority of samples. Thus, we focused on DNA methylation in CpGs only (Extended Data 5G. Overall, 20,077,756 CpGs were covered in at least one sample. More than 500,000 cytosines were covered with at least 10 reads in each of samples, in accord with field standards (Figure 3A)35. We removed all cytosines with insufficient coverage: average coverage across all 40 samples was required to be greater than or equal to 10 reads. 2,808,448 CpG cytosines remained in the analysis after filtration (we refer to this set as “covered CpG cytosines”, and all the downstream analysis used only these cytosines). Overall, for approximately 84% CpG islands at least one cytosine in CpG context was covered in the experiment. CpG island annotation was downloaded using UCSC Table Browser for hg1965.
Exploratory data analysis was performed to verify data quality and remove outliers that had skewed methylation patterns compared to the majority of the donors. PCA revealed 3 samples that were distinct from the entire set of donors (Extended Data 5H). This was further confirmed by analysis of methylation distribution and hierarchical clustering (Extended Data 5I–5J). These samples (1 young donor and 2 old donors) were removed from further analysis. Methylation data was acquired in two separate batches with similar library preparation protocols (10 young and 10 old in each batch). Therefore, we account for a possible batch effect (Extended Data 5K) in all the following analysis.
To apply Hannum31 and Horvath32 methylation clock models, methylation levels of non-covered in our dataset CpGs were imputed as an average methylation within [−100kb; +100kb] window around a CpG. Methylation was set to zero if imputation was not possible (no CpGs were covered in the window.)
Monocyte eRRBS data analysis: CpG islands methylation analysis
To investigate global changes in the methylome, we averaged methylation levels of all cytosines in CpG context inside and outside CpG islands for each donor (Figure 3B). 2-way ANOVA (~ age + batch) was used to calculate p-values. The mean methylation level of each CpG island refers to a mean of methylation levels of all covered cytosines within the island. PCA on the centered and scaled values and hierarchical clustering via Ward algorithm with Manhattan distances were performed for visualization purposes (Figures 3C–3D). To compare CpG island variability between two age groups we calculated the standard deviation of mean methylation level for each CpG island within young and old cohorts (Figures 3E). Two-sided Wilcoxon paired rank-sum test was used to calculate p-values.
Monocyte eRRBS data analysis: differential methylation analysis
We used the Methpipe pipeline (v3.4.3) to find differentially methylated regions (DMRs)41. Initial per-donor methylation files were converted to Methpipe methcount format and merged into a proportion table using merge-methcounts function. Design table included intercept, age and batch. For each cytosine linear model was fit by radmeth regression function (radmeth regression -factor age -o OUTPUT_CYTO DESIGN_TBL PROP_TBL), significance combining and adjustment for multiple testing was performed by radmeth adjust command (radmeth adjust -bins 1:50:1 OUTPUT_CYTO > ADJ_CYTO). Significantly different cytosines were merged into regions by radmeth merge (radmeth merge -p 0.05 ADJ_CYTO > DMRS). Resulting regions were subjected to further filtration: number of cytosines within the region ≥ 3 and absolute value of difference ≥ 0.025.
For each DMR, a combined p-value was calculated by Fisher method (function fisher.method from BisRNA R package66 v0.2.2) from Methpipe p-values for cytosines located within the region. Combined p-values were used for visualization purposes only (volcano plots, Figures 3F, 4I and 4K). Resulting DMRs were annotated using ChIPseeker package67 (v1.20.0). A promoter was defined as [−10kb; +3kb] relative to TSS. To find DMRs that intersect CpG islands we used bedtools2 (v2.25.0) intersect function68,69.
Monocyte eRRBS data analysis: comparison to public datasets
Publicly available Blueprint dataset EGAD00001002523 was used for DMRs validation42,43. Methylation signal in BigWig format is downloaded from Blueprint online portal for classical CD14+CD16− monocytes from cord blood (n=2) and old donors (n=4, 60-70 y. o.). Bedtools2 (v2.25.0) map function was used to calculate mean methylation level for each DMR in Blueprint samples (bedtools map -a DMRS.bed -b BP_SAMPLE.bedGraph -c 4 -o mean)68,69. IGV (v2.3.72) was used for BigWig-file visualization (Figure 3G)70,71.
WGBS data for cord blood and a 103 y.o. centenarian previously published by Heyn et al.36 was downloaded from GEO database (GSE31263) in BED format. DMR methylation (Extended Data 5E) was estimated as mean methylation of all CpGs residing inside DMR and covered in WGBS sample.
Methylation profile for MESA cohort was downloaded from GEO database (GSE56046). M-values were transformed into beta-values by m2beta function from lumi package72 (v2.26.4). Batch effect stemming from chip and race-gender-site variables was removed by ComBat function from sva package (v3.22.0). For Figure 3I we used only methylation levels of CpGs residing within DMRs. In Figure 3I (right) methylation level of each DMR in MESA was estimated as mean methylation of all CpGs profiled by the array that reside within corresponding DMRs (for most DMRs data for only one CpG was available). Spearman correlation between DMR methylation and donor age was calculated.
Ultra-Low input ChIP-Seq (ULI-ChIP)
Aliquots of 100,000 CD14+CD16− monocytes were thawed on ice for 5 minutes then immediately resuspended in 20μL of EZ Nuclei Isolation Buffer (Sigma-Aldrich), and incubated for 5 minutes on ice. Samples were digested using 2 UnitμL MNase in 20μL MNase Digestion Buffer (NEB) for 5 minutes at 37°C. Reactions were stopped by the addition of 10mM EDTA and 0.1% Trition / 0.1% Deoxycholate (final concentration). Isolated chromatin was incubated on ice for 15 minutes, followed by vortexing on a medium setting for 30 seconds. The volume was adjusted to 200μL with Complete IP Buffer (20mM Tris-HCL pH 8.0, 2mM EDTA, 150mM NaCl, 0.1% Triton X-100, 10mM Sodium Butyrate, 1x Protease Inhibitor Cocktail, 1mM PMSF), and incubated for 1 hour at 4°C on a gentle rocking platform. 10% of the total chromatin was removed to assess digestion efficiency and to use as an input control.
Chromatin for immunoprecipitation was pre-cleared using Protein A Dynabeads (Invitrogen) for 1 – 4 hours at 4°C and subjected to IP overnight at 4°C (0.3 μg H3K27me3 Millipore 07-449; 0.05 μg H3K27AC Abcam ab4729; 0.03 μg H3K4me3 Abcam ab8580; 0.2 μg H3K4me1 Abcam ab8895; 0.1 μg H3K36me3 Abcam ab9050). Bead-chromatin complexes were washed using low-salt wash buffer (0.1% SDS, 1% Trition X-100, 2mM EDTA, 20mM Tris pH 8.0, 150mM NaCl, 1x Protease Inhibitor Cocktail, 10mM Sodium Butyrate), high-salt wash buffer (0.1% SDS, 1% Trition X-100, 2mM EDTA, 20mM Tris pH 8.0, 500mM NaCl, 1x Protease Inhibitor Cocktail, 10mM Sodium Butyrate). Chromatin was eluted from the beads using elution buffer (1% SDS, 100mM NaHCO3) by shaking for 1 hour at 65°C. DNA was then purified by phenol-chloroform extraction using Maxtract tubes (Qiagen), and ethanol precipitated overnight. Immunoprecipitated DNA was prepared for sequencing on the Illumina platform using the NEBNext ChIP-Seq Library Prep Master Mix Set using modified Illumina TruSeq adapters.
ULI-CHIP-Seq peak calling
ULI-ChIP-Seq data pre-processing consisted of the following steps: (1) QC of raw reads including reads quality, length, duplication rate, GC-content; (2) alignment of the raw reads to human genome build hg19; (3) visual inspection of tracks.
Reads quality control (step 1) showed high quality of the data: read length was 51bp, average duplication level was less than 20%, GC content was about 47%, and average library size was ~50 million reads for all the modifications (Figure 4B). Full QC of the raw data is available in the Supplementary Table 13. Distinct nucleotide sequence was overrepresented in the first 5 bp of the reads in all ULI-ChIP-seq libraries, which was an artifact of the ULI-ChIP-Seq protocol. Therefore, first 5 bp were clipped during alignment step. Reads were aligned on the hg19 reference genome using bowtie (v1.1.1), only uniquely mapped reads were used in the downstream analysis. For details see Supplementary Information. ULI-ChIP-Seq data processing pipeline is available on GitHub: https://github.com/JetBrains-Research/washu
While almost all the libraries passed QC, signal to noise ratio varied considerably within the cohort (Extended Data 6A), which is a known issue of the ULI-ChIP-seq data. This variation made application of the “golden standard” peak caller Macs2 (v2.1.1) and SICER (v1.1) not feasible in case of our dataset (Extended Data 6B). To overcome this problem, we developed a novel semi-supervised peak calling algorithm SPAN, based on the idea proposed by Hocking et al44. SPAN preprocesses each sample separately to train underlying statistical model. Next, peak calling parameters are optimized individually for each sample based on a single manually-created markup. Detailed description of SPAN is available in Supplementary Information. SPAN can be applied to both ultra-low-input and conventional ChIP-seq datasets, which was shown using several publicly available datasets (see Supplementary Information). We used SPAN to analyze data for 191 ULI-ChIP-seq experiments that passed initial QC (Figure 4B). The number of peaks called by SPAN was significantly more consistent for different donors compared to traditional peak calling approaches (Extended Data 6D), which was further supported by improved overlap between peaks for each pair of donors (Extended Data 6C and 6E). Each dot in Extended Data 6E indicates a fraction of overlapping peaks between two samples, with ~400 such dots making up the value for each bar. This representation allows direct comparison of peak calling consistency between available methods and illustrates improvements achieved by SPAN (Extended Data 6F–6G), which can also be seen from a directional overlap between all the samples, histone modifications, and donors (Extended Data 6H). To ensure that SPAN does not introduce unforeseen artifacts, the resulting peaks were compared to the peaks identified for CD14+ monocytes in the ENCODE project using conventional ChIP-sequencing73 (Extended Data 6I). In comparison with data from ENCODE we used only male samples (GSM1102782, GSM1102785, GSM1102788, GSM1102793, GSM1102797). For consistency, we took raw data and applied our processing pipeline using the same labels that were generated for ULI-ChIP-Seq data (validity of the markup was confirmed by visual exploration).
Differential ChIP-Seq analysis
To describe age-associated changes in histone code, we performed a differential analysis of the ChIP-seq data between young and old cohorts. First, we performed PCA on signal normalized to libraries depth (RPM) in weak consensus peaks. Second, we ran differential analysis tools, described in 74: DiffBind (v2.4.8), MACS2 bdgdiff (v2.1.1) and diffReps (v1.55.6). We also added ChlPDiff (version from March 27, 2008) to the comparison. Since Macs2 bdgdiff does not support replicated data we pooled samples into a single BAM file. Single pooled control for all young and old samples was used with all tools. See Supplementary Information for exact setting used for differential analysis.
Integration methods: overrepresentation analysis
We used the ENCODE 18 states chromHMM annotation (ENCSR907LCD, CD14+ monocytes) for overrepresentation analysis. Since our data was generated using eRRBS technology, only a fraction of the genome was covered, and we had to account for incomplete background in our analysis. First, a BED file with all covered regions was generated by merging filtered CpGs located closer than read length (50bp) and expanding regions to be not shorter than read length. Next, bedtools2 (v2.25.0) function shuffle was used to simulate 100,000 sets of non-overlapping regions with length distribution that matched DMRs one and located within the covered fraction of the genome. For each state we calculated the real number of DMRs intersecting the state as well as intersection size with each simulated set (bedtools intersect -a RegionSet -b chromHMMState -u). The expected size of intersection for each state was estimated as the mean of simulated intersection sizes. Corresponding fold change (DMRs / random) was defined as (real intersection / expected intersection). Significance of over- and under-representation for each chromHMM state was calculated as (number of simulated sets with intersection higher than real / 100,000) and (number of simulated sets with intersection lower than real / 100,000), respectively (Extended Data 5C). Benjamini & Hochberg method was used to adjust for multiple testing.
Overrepresentation analysis against peaksets was performed similarly. Weak consensuses (peaks confirmed by at least 2 samples) for each histone modification profiled in our study were used in this analysis.
PCA of chromHMM states was performed similarly to PCA of CpG islands mean methylation (described in eRRBS methods section): mean methylation level of each region refers to a mean of methylation levels of all covered cytosines within the region. Values were centered and scaled for PCA (Extended Data 8B).
Integration methods: comparison of ChIP-seq signal
ChIP-seq signal intensities in DMRs were estimated using DiffBind package (v2.4.8). We used counts = dba.count(dba(sampleSheet = sheet), fragmentSize = 125, bRemoveDuplicates = TRUE), counts = dbs.count(counts, peaks=NULL, score=DBA_SCORE_TMM_MINUS_FULL), tmm normalized = dba.peakset(k27ac counts, bRetrieve = TRUE, DataType = DBA_DATA_FRAME) commands to retrieve TMM-normalized signal values for DMRs. A two-sided Mann-Whitney U test was performed to calculate p-value between hypo- and hypermethylated DMRs.
Integration methods: DMR-associated expression patters and enrichment in MESA transcriptomic data
To characterize expression of genes associated with changing methylation we selected all genes with DMRs located in their promoters ([−10kb; +3kb] around TSS, see description of the annotation procedure above). Raw counts were generated for our RNA-seq dataset by HTSeq as described above. Gene expression levels for all gene were log-transformed (log2(1 + raw count)) and quantile normalized.
Same sets of genes were used to perform GSEA using ranked list obtained for MESA transcriptional dataset (see details above). Genes were ordered based on t-statistics generated by limma. 10,000 permutations were performed to evaluate significance via fgsea package61 (v1.10.0).
Integration methods: TF binding sites overrepresentation analysis
Binding sites of 485 transcription factors were obtained from ReMap 2018 (v1.2) website (http://pedagogix-tagc.univ-mrs.fr/remap/index.php?page=download). Hg19 merged peak files were downloaded. General workflow of the overrepresentation analysis is described above. To account for enrichment of up DMRs in CpG islands we used only covered regions that intersect a CpG island to simulate 10,000 random up DMRs. Similarly, for down DMR analysis covered regions that intersect H3K4me1 weak consensus peak were used as background to generate 10,000 random down DMRs.
Integration with public data (Figure 6)
First, we investigated behavior of up and down DMRs in several DNA methylation array-based datasets. Mean methylation level of up or down DMRs was estimated for each sample in a public dataset as an average of all CpGs covered in the dataset that reside within the corresponding set of DMRs. Spearman correlation coefficients between DMR mean methylation and donors age were calculated when applicable. We fit methylation ~ age + sex model using lm and took residuals to estimate age and sex-adjusted DMR methylation. Two-sided Mann-Whitney U test was used to calculate p-values.
We explored seven public datasets generated using DNA methylation arrays:
Twin study dataset48 (GSE52114). Probe methylation values were used as provided in GEO.
MESA dataset4,27 (GSE56046). See details of data processing above.
Bulk brain tissue dataset (GSE66351). Original study49 was focused on Alzheimer’s disease, so we filtered out all affected individuals from the dataset and kept only a cohort of healthy controls. We used data from bulk brain tissue and removed one sample (GSM2808945) as an outlier based on PCA.
HIV dataset50 (GSE67705). We used whole blood data in our analysis. Following sample were excluded as outliers based on PCA: METI-24, METI-1, METI-8, CHAR23, CHAR123, CHAR86.
Alzheimer’s disease glia and neurons dataset49 (GSE66351). Two samples younger than 20 were removed from the analysis as outliers (all other donors were over 60 y.o. in both cohorts).
Second, we compared our data to RRBS-based datasets that focused on obesity and smoking.
170 obesity DMRs were acquired from supplementary table 3 of the original study52. 149 obesity DMRs had at least one CpG covered in our data. Mean methylation of up and down obesity DMRs was calculated for all our donors as an average methylation of all CpGs from obesity up/down DMRs that were covered in our data (Figures 6G–6H). BMI-adjusted methylation of obesity DMRs was calculated by fitting methylation ~ BMI model and taking residuals. P-values were calculated using two-sided Mann-Whitney U test.
Obesity data was downloaded from GEO (GSE73303). Mean methylation of aging DMRs was estimated as described for array datasets (Extended Data 9B). Three samples were excluded as outliers based on PCA: GSM1890526_T10_Obese, GSM1890518_T06_Lean, GSM 1890521_T16_Lean.
Smoking DMRs were defined by Wan et al.51 (supplementary table 4).
Integration with GWAS data (Figure 7)
GWAS summary statistics of 34 phenotypes produced by large consortia studies were obtained (Neale lab analysis of UK Biobank, http://www.nealelab.is/blog/2017/7/19/rapid-gwas-of-thousands-of-phenotypes-for-337000-samples-in-the-uk-biobank), only variants with association p-values below 5e-8 were included. Overrepresentation analysis based on 10,000 random up and down DMRs is described above. Here DMRs were additionally flanked by 50kb on each side. With total 68 comparison (34 for up DMRs + 34 for down DMRs), significance threshold was set to 0.05 / 68 = 7.4e-4.
Data visualization
In all figures the lower and upper hinges of all boxplots represent the 25th and 75th percentiles. Horizontal bars show median value. Whiskers extend to the values that are no further than 1.5*IQR from either upper or lower hinge. IQR stands for inter-quartile range, which is the difference between the 75th and 25th percentiles.
For all PCAs percentage of variance explained by principal components is shown in brackets.
Other statistical methods and details
Two-sided Mann-Whitney U test was used to calculate p-values in Figures 1A, 1B, 6D, 6E, 6G, 6H, and Extended Data 1A, 1B, 3D (bottom row), 5B, 8C, 9. 2-way ANOVA was used to calculate p-values in Figure 3B. Two-sided Mann-Whitney U test with Benjamini–Hochberg correction for multiple testing was used to determine significant pathways in Extended Data 2F.
Sample size was not determined a priori. We did not focus on a specific effect-size and performed a discovery study, including all available samples that passed QC into analysis. To our knowledge, a comparative epigenetic human study of this scale has not been previously undertaken. We discuss potential limitations of our sample size in Results and Discussion sections. Specifically, we show that large cohorts are required for detection of low-degree changes in expression levels (Extended Data 4B).
For high-throughput data generation samples were randomized between batches to account for possible batch-effect. Stringent inclusion criteria were set to account for other possible confounding variables. Reproducibility of the identified trends was shown using publicly available data from cohorts of different demographics, showing independence of the identified signatures from potential confounding variables. All data acquisition was performed blinded to types of individual samples.
Extended Data
Extended Data Fig. 1. Cell counts and cytokine profiles.
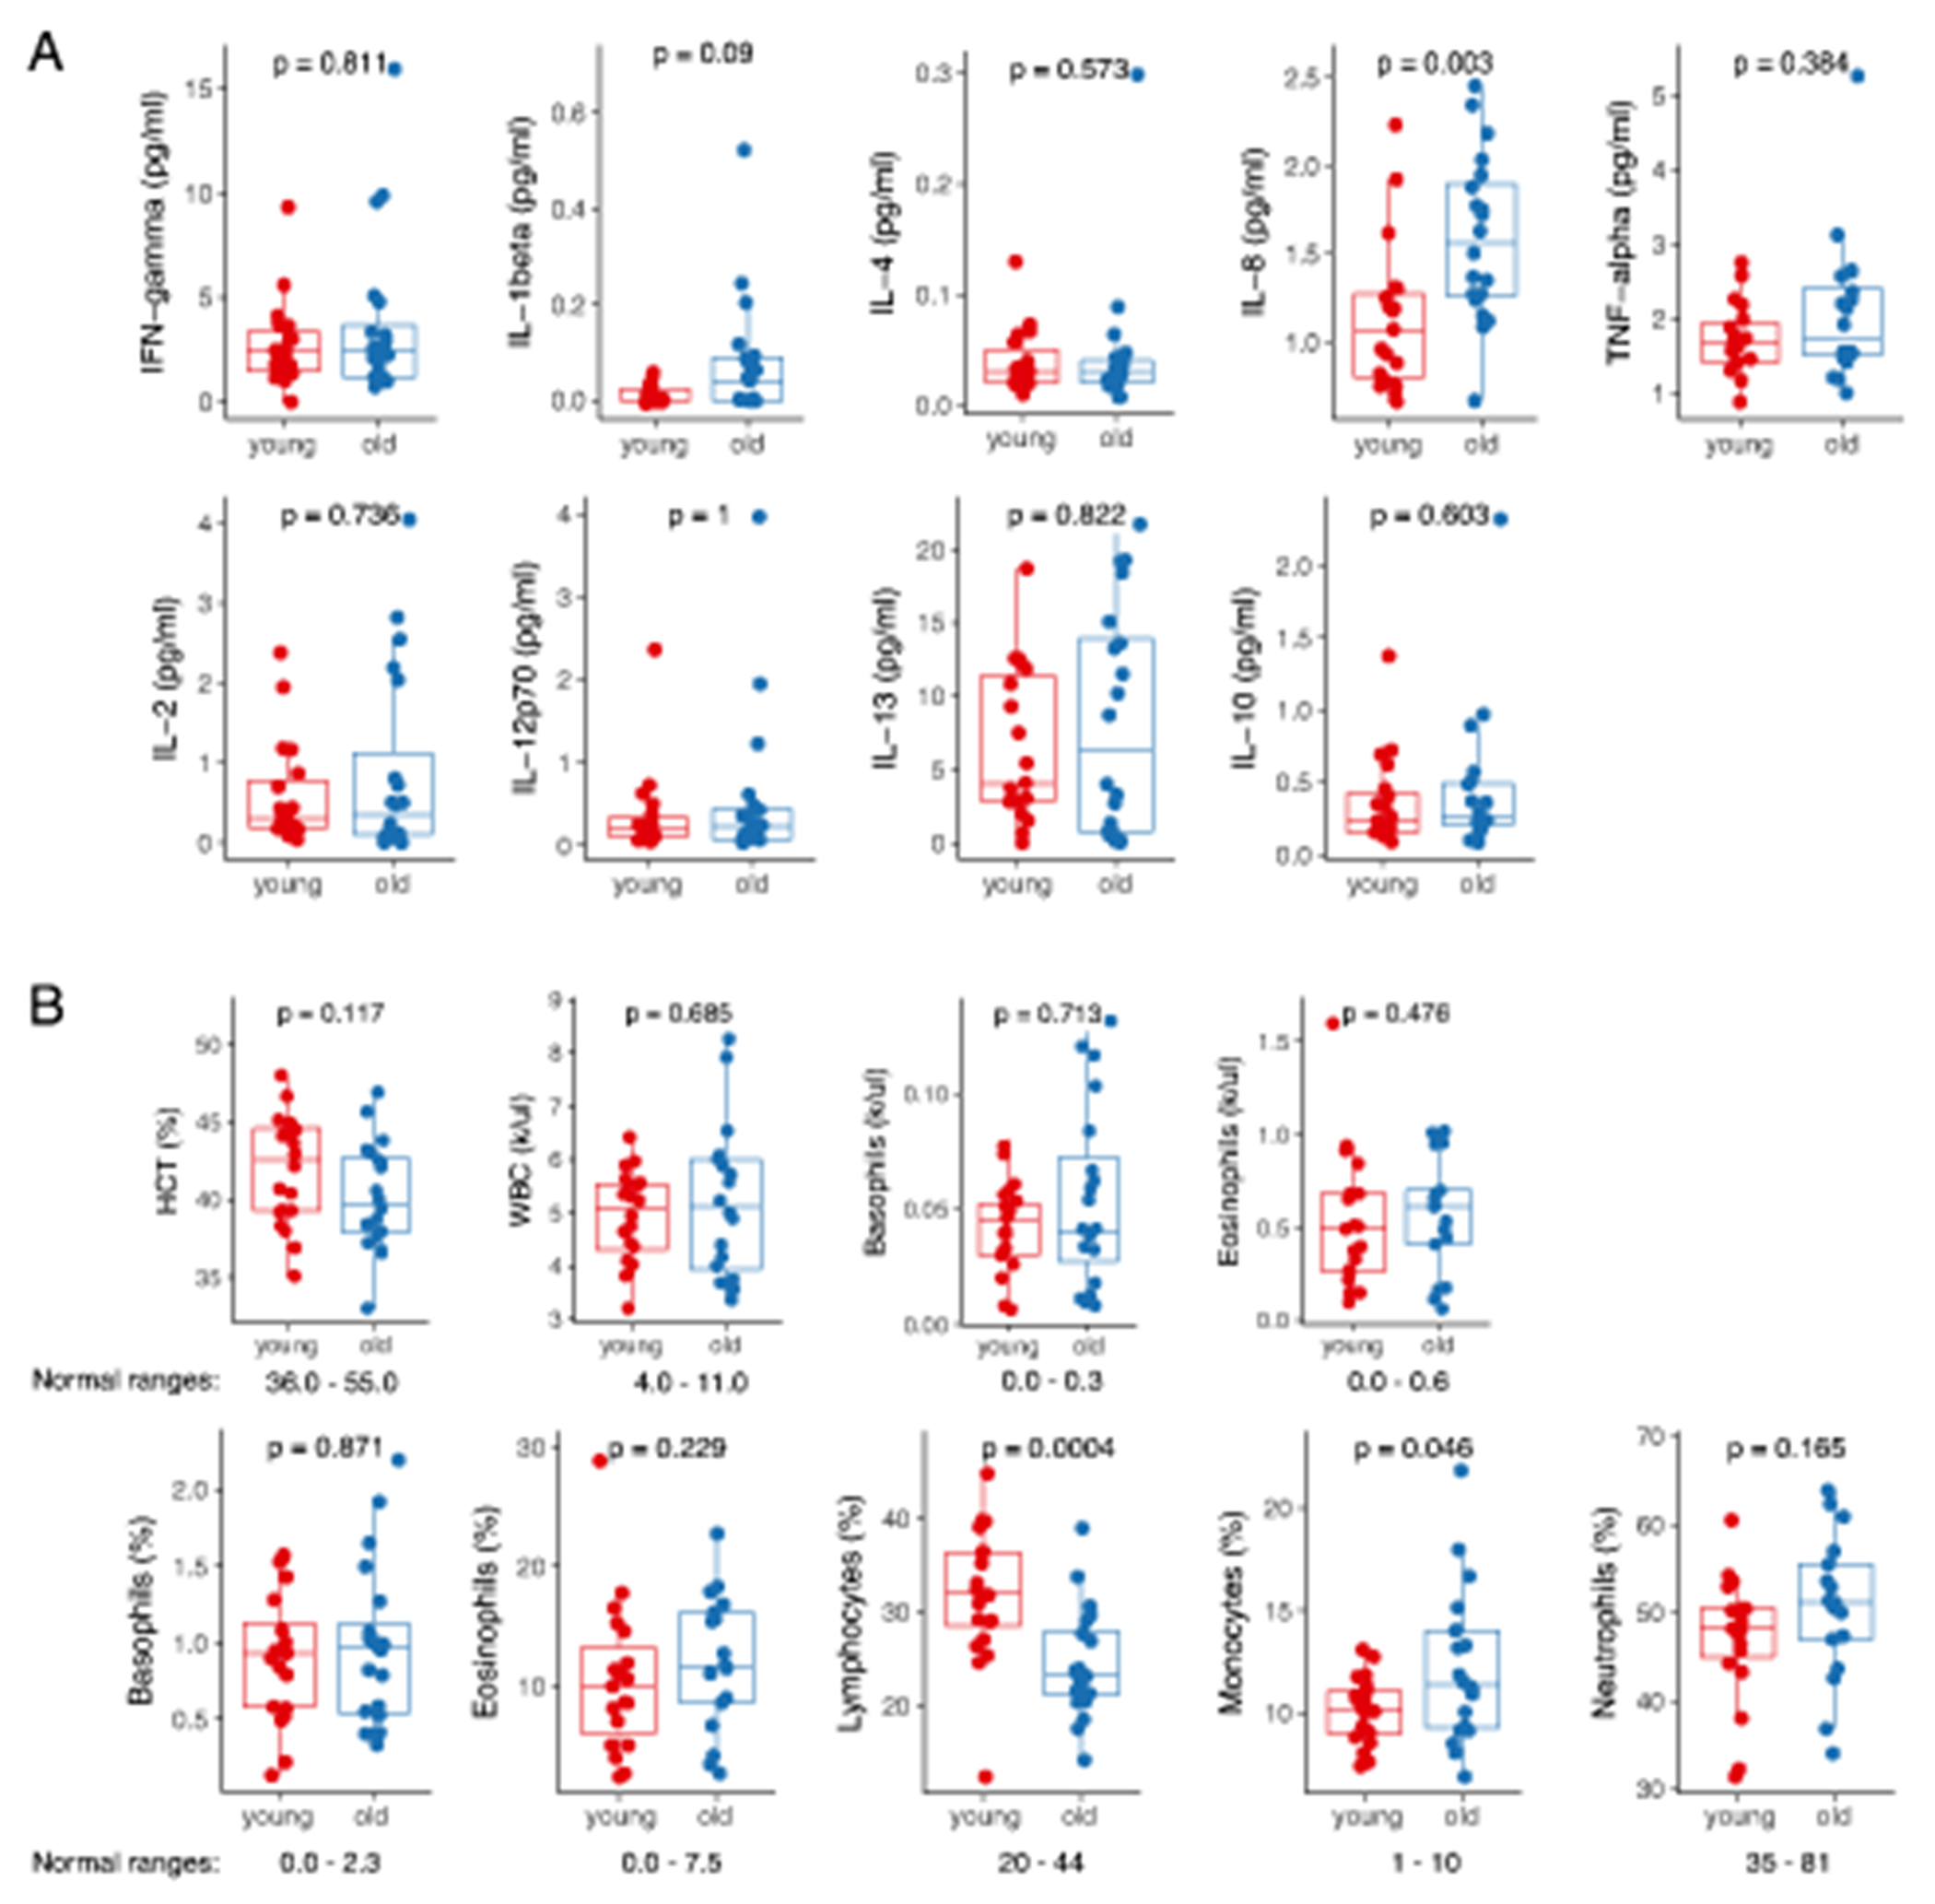
(A) Blood cytokine levels measured by bioplex assay and (B) blood differentials obtained using Hemavet in young (n=20) and old (n=20) cohorts. Normal ranges for humans are shown below the boxplots. P-values for all comparisons were calculated using two-sided Mann-Whitney U test. In both panels, the lower and upper hinges of all boxplots represent the 25th and 75th percentiles. Horizontal bars show median value. Whiskers extend to the values that are no further than 1.5*IQR from either upper or lower hinge. IQR stands for inter-quartile range, which is the difference between the 75th and 25th percentiles.
Extended Data Fig. 2. Metabolomic profile of plasma.
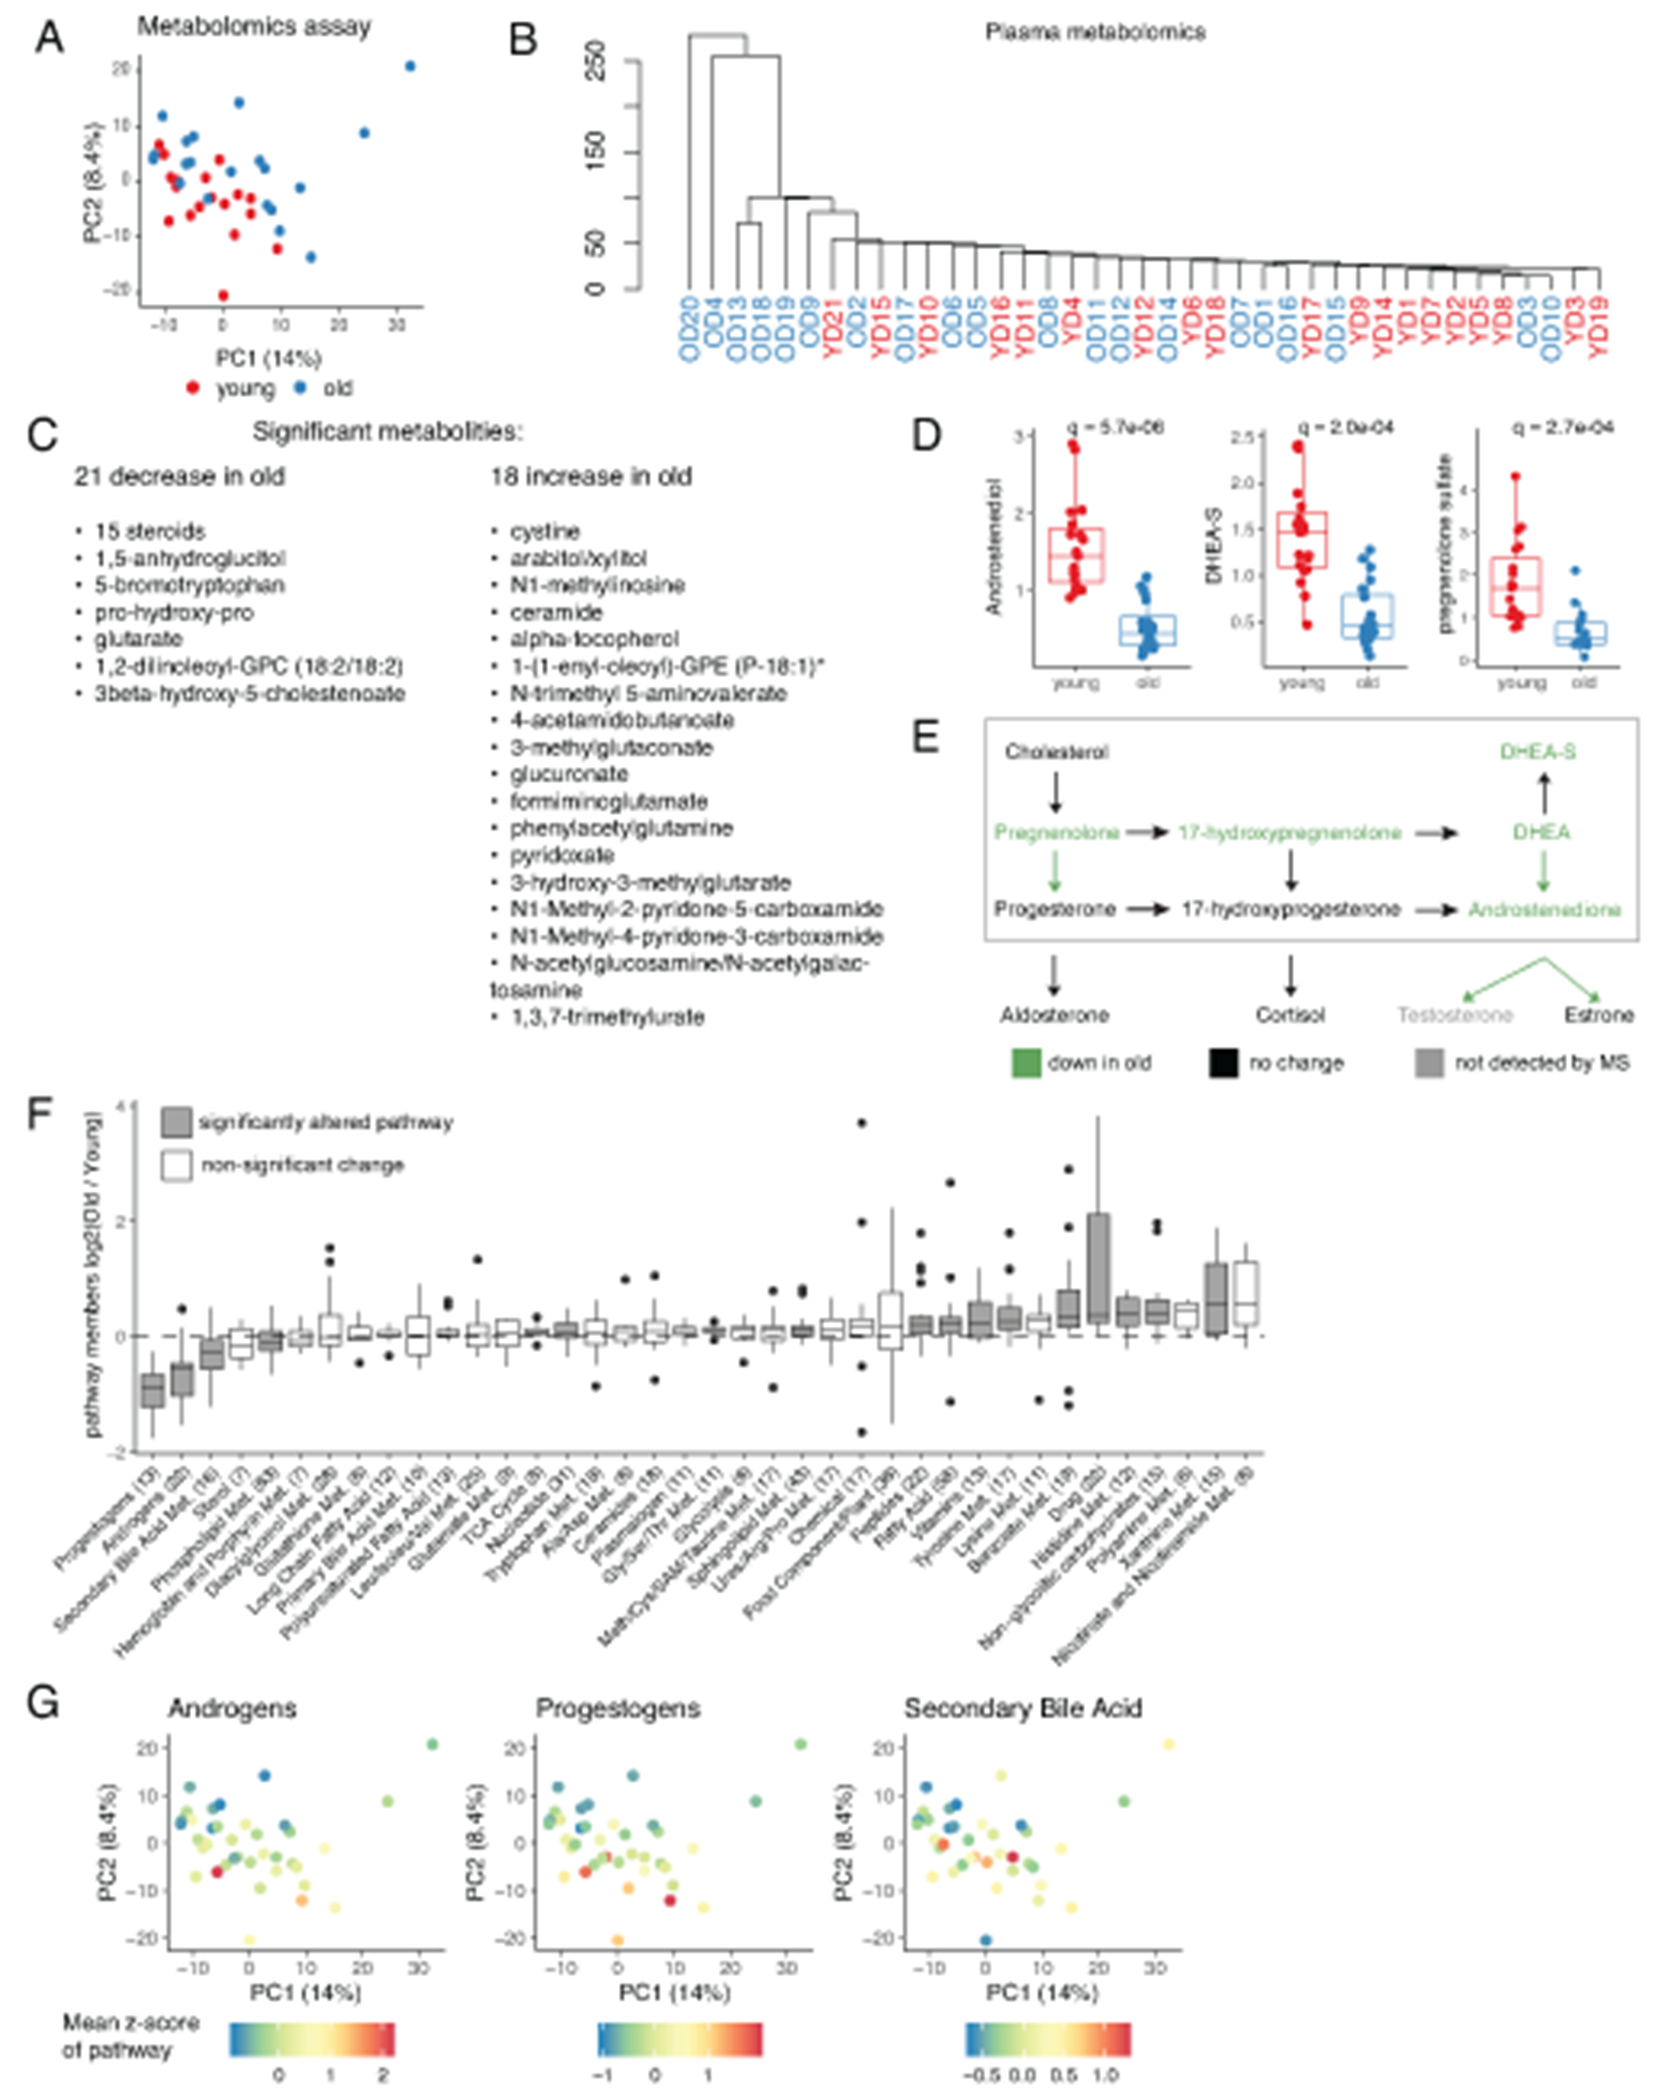
(A) PCA of standardized levels of metabolites in plasma. Each dot represents a donor. (B) Dendrogram produced by unsupervised hierarchical clustering of metabolic data. Clustering using average algorithm and Euclidian distance as the distance metric. (C) List of significantly different metabolites. (D) Selected differentially regulated metabolites from sex steroids synthesis pathway in young (n=20) and old (n=20) cohorts. Statistical analyses by two-sided Mann-Whitney U test with Benjamini–Hochberg correction for multiple testing. (E) Schema of sex steroids synthesis. (F) Pathway analysis of metabolic data. Each boxplot summarizes log2FC of all members of the corresponding pathway. Pathways with mean log2FC significantly different from zero are highlighted (two-sided Mann-Whitney U test and Benjamini-Hochberg correction for multiple testing). Dots represent outliers. N for each pathway is shown in brackets. (G) PCA as in Extended Data 2A. Z-scores were calculated for all metabolites. For each sample, color of the dot represents averaged z-scores of all metabolites belonging to the pathway. In panels (D) and (F), the lower and upper hinges of all boxplots represent the 25th and 75th percentiles. Horizontal bars show median value. Whiskers extend to the values that are no further than 1.5*IQR from either upper or lower hinge. IQR stands for inter-quartile range, which is the difference between the 75th and 25th percentiles.
Extended Data Fig. 3. Proteomic profile of plasma (Somascan).
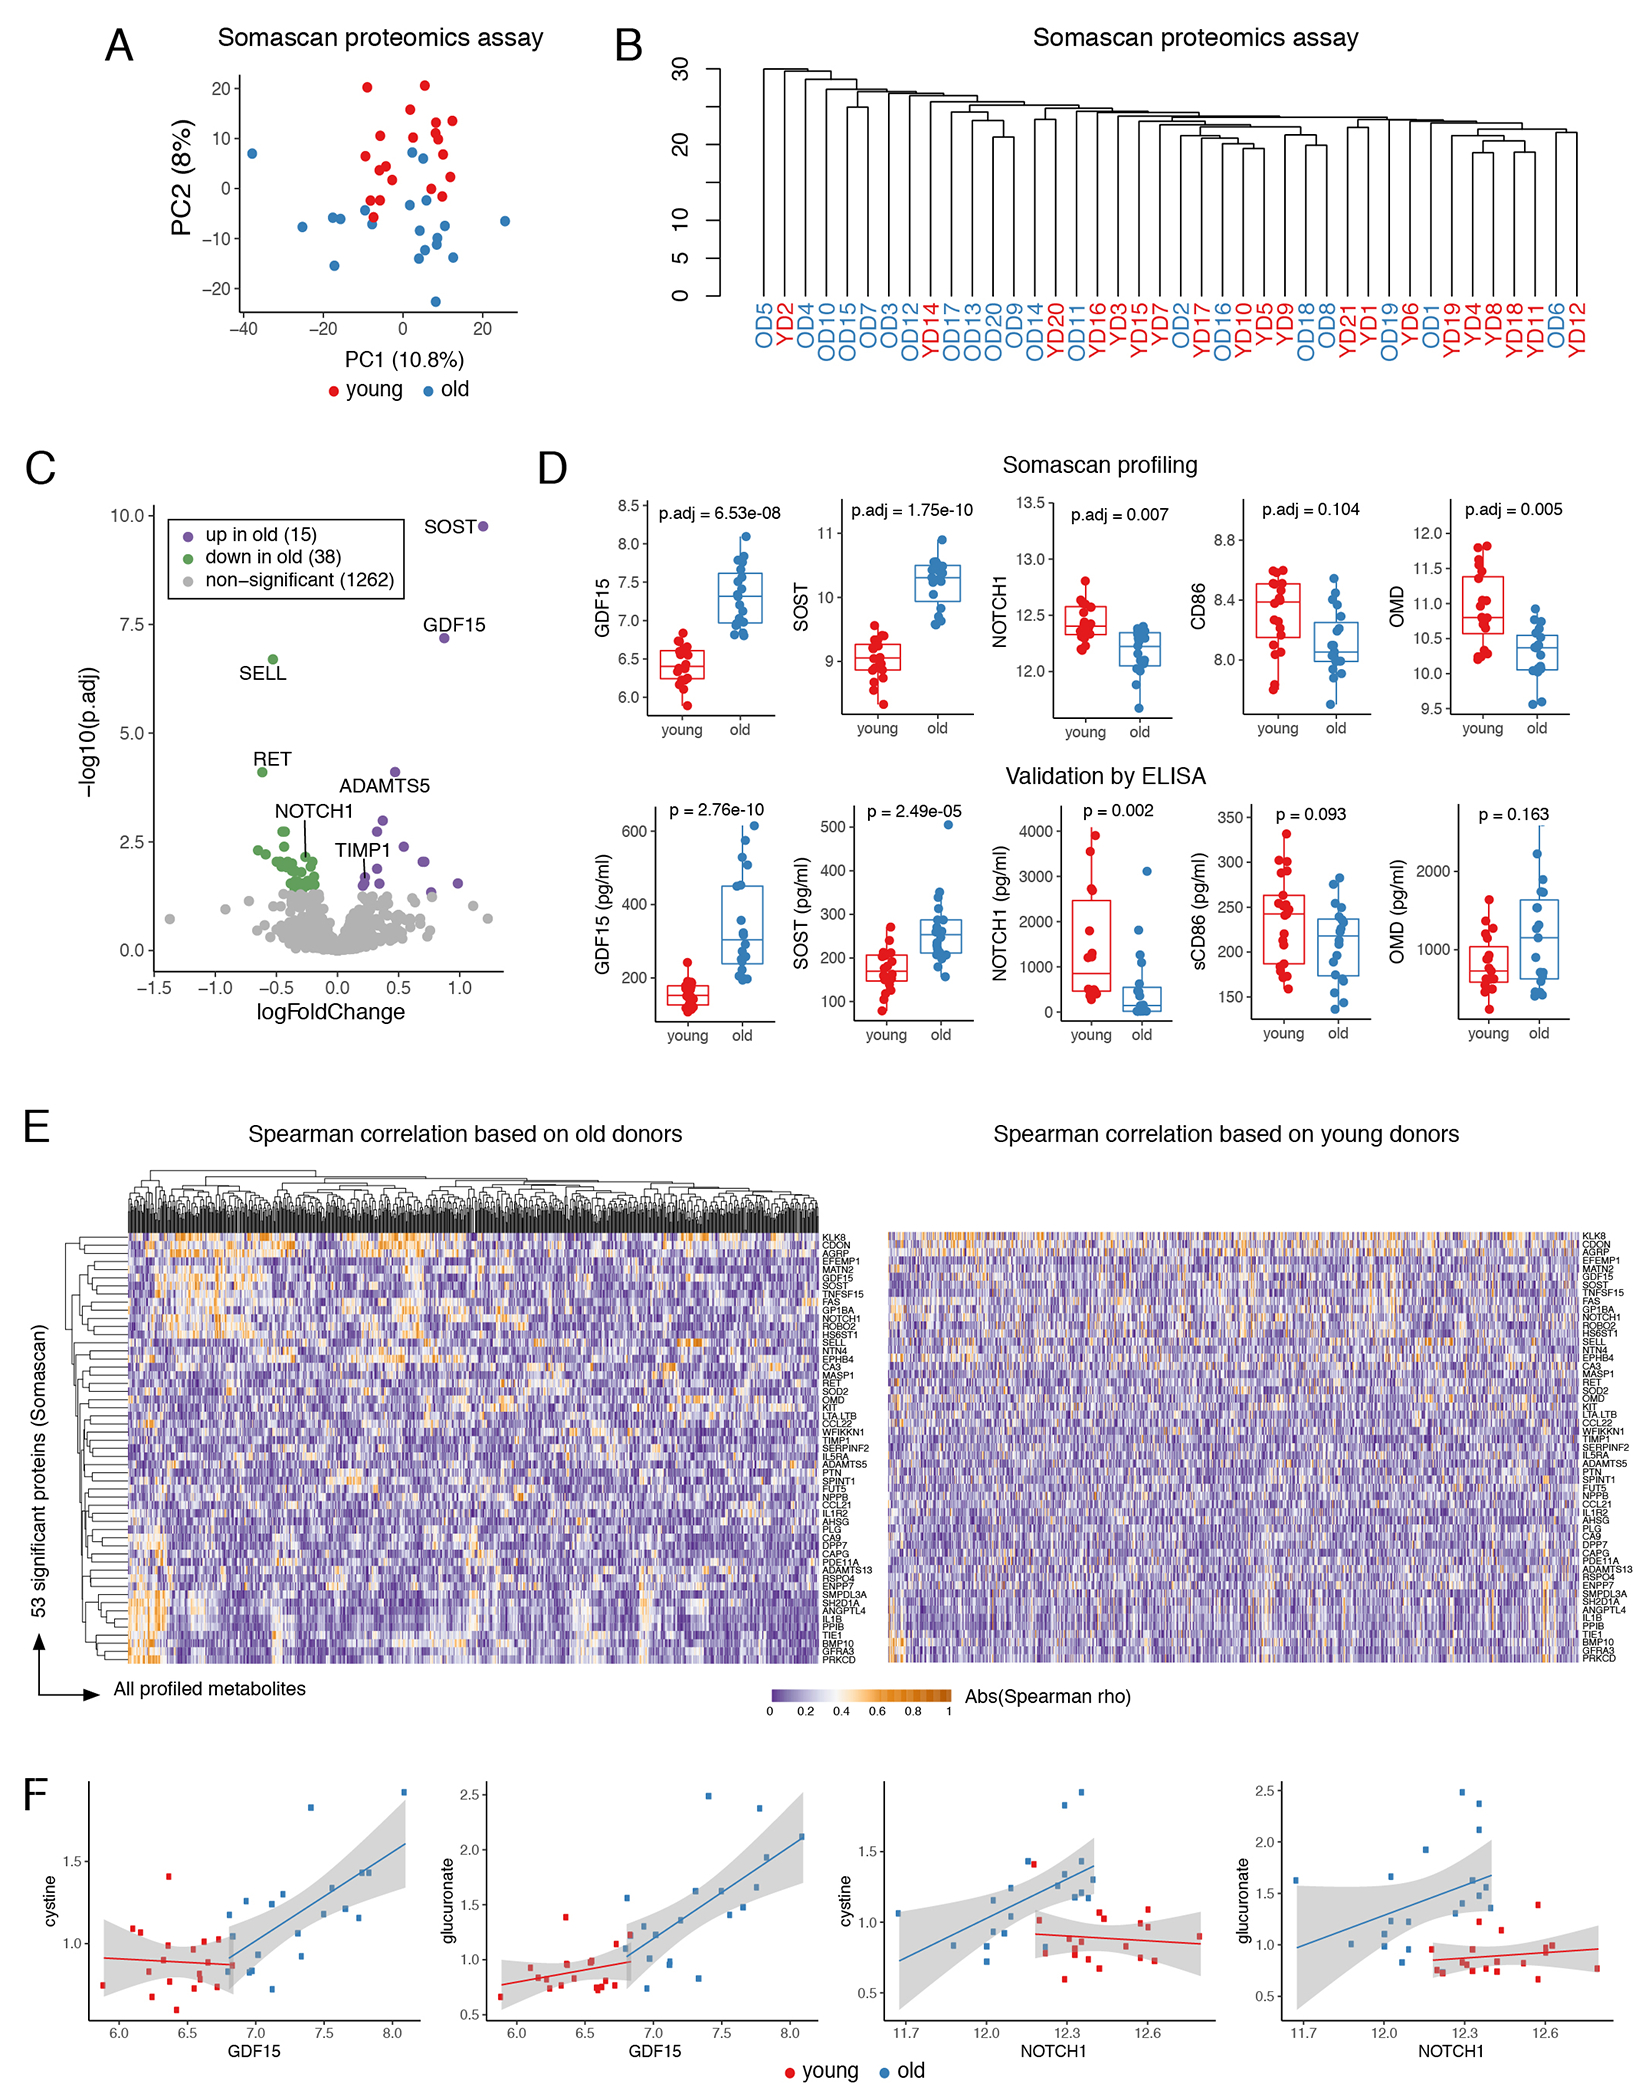
(A) PCA of standardized proteins levels in plasma (Somascan). Each dot represents a donor. (B) Dendrogram produced by unsupervised hierarchical clustering of Somascan data. Clustering using average algorithm and Euclidian distance as the distance metric. (C) Differential analysis results for plasma proteomic profile: volcano plot. Each dot represents a protein. P-values and logFC were calculated by two-sided test from Limma package and adjusted by Benjamini—Hochberg method. (D) ELISA validation of selected proteins in young (n=20) and old (n=20) cohorts. Adjusted p-values for Somascan results (as in (C)) are shown in the top panel and ELISA validation of the same targets are shown below. ELISA p-values were calculated using two-sided Mann-Whitney U test. The lower and upper hinges of all boxplots represent the 25th and 75th percentiles. Horizontal bars show median value. Whiskers extend to the values that are no further than 1.5*IQR from either upper or lower hinge. IQR stands for inter-quartile range, which is the difference between the 75th and 25th percentiles. (E) Heatmap representation of absolute values of Spearman’s correlation coefficients (rho) between plasma proteins (rows) and plasma metabolites (columns) calculated within old (left panel) and young (right panel) cohorts. Clustering of old cohort rows and columns was done using complete algorithm and Euclidian distance as a metric. Order of rows and columns in young cohort heatmap matches order established for the old cohort. (F) Each point represents a donor. Smoothing was done by lm function separately in young and old groups, shaded error bands represent SE.
Extended Data Fig. 4. Monocyte transcriptome and proteome.
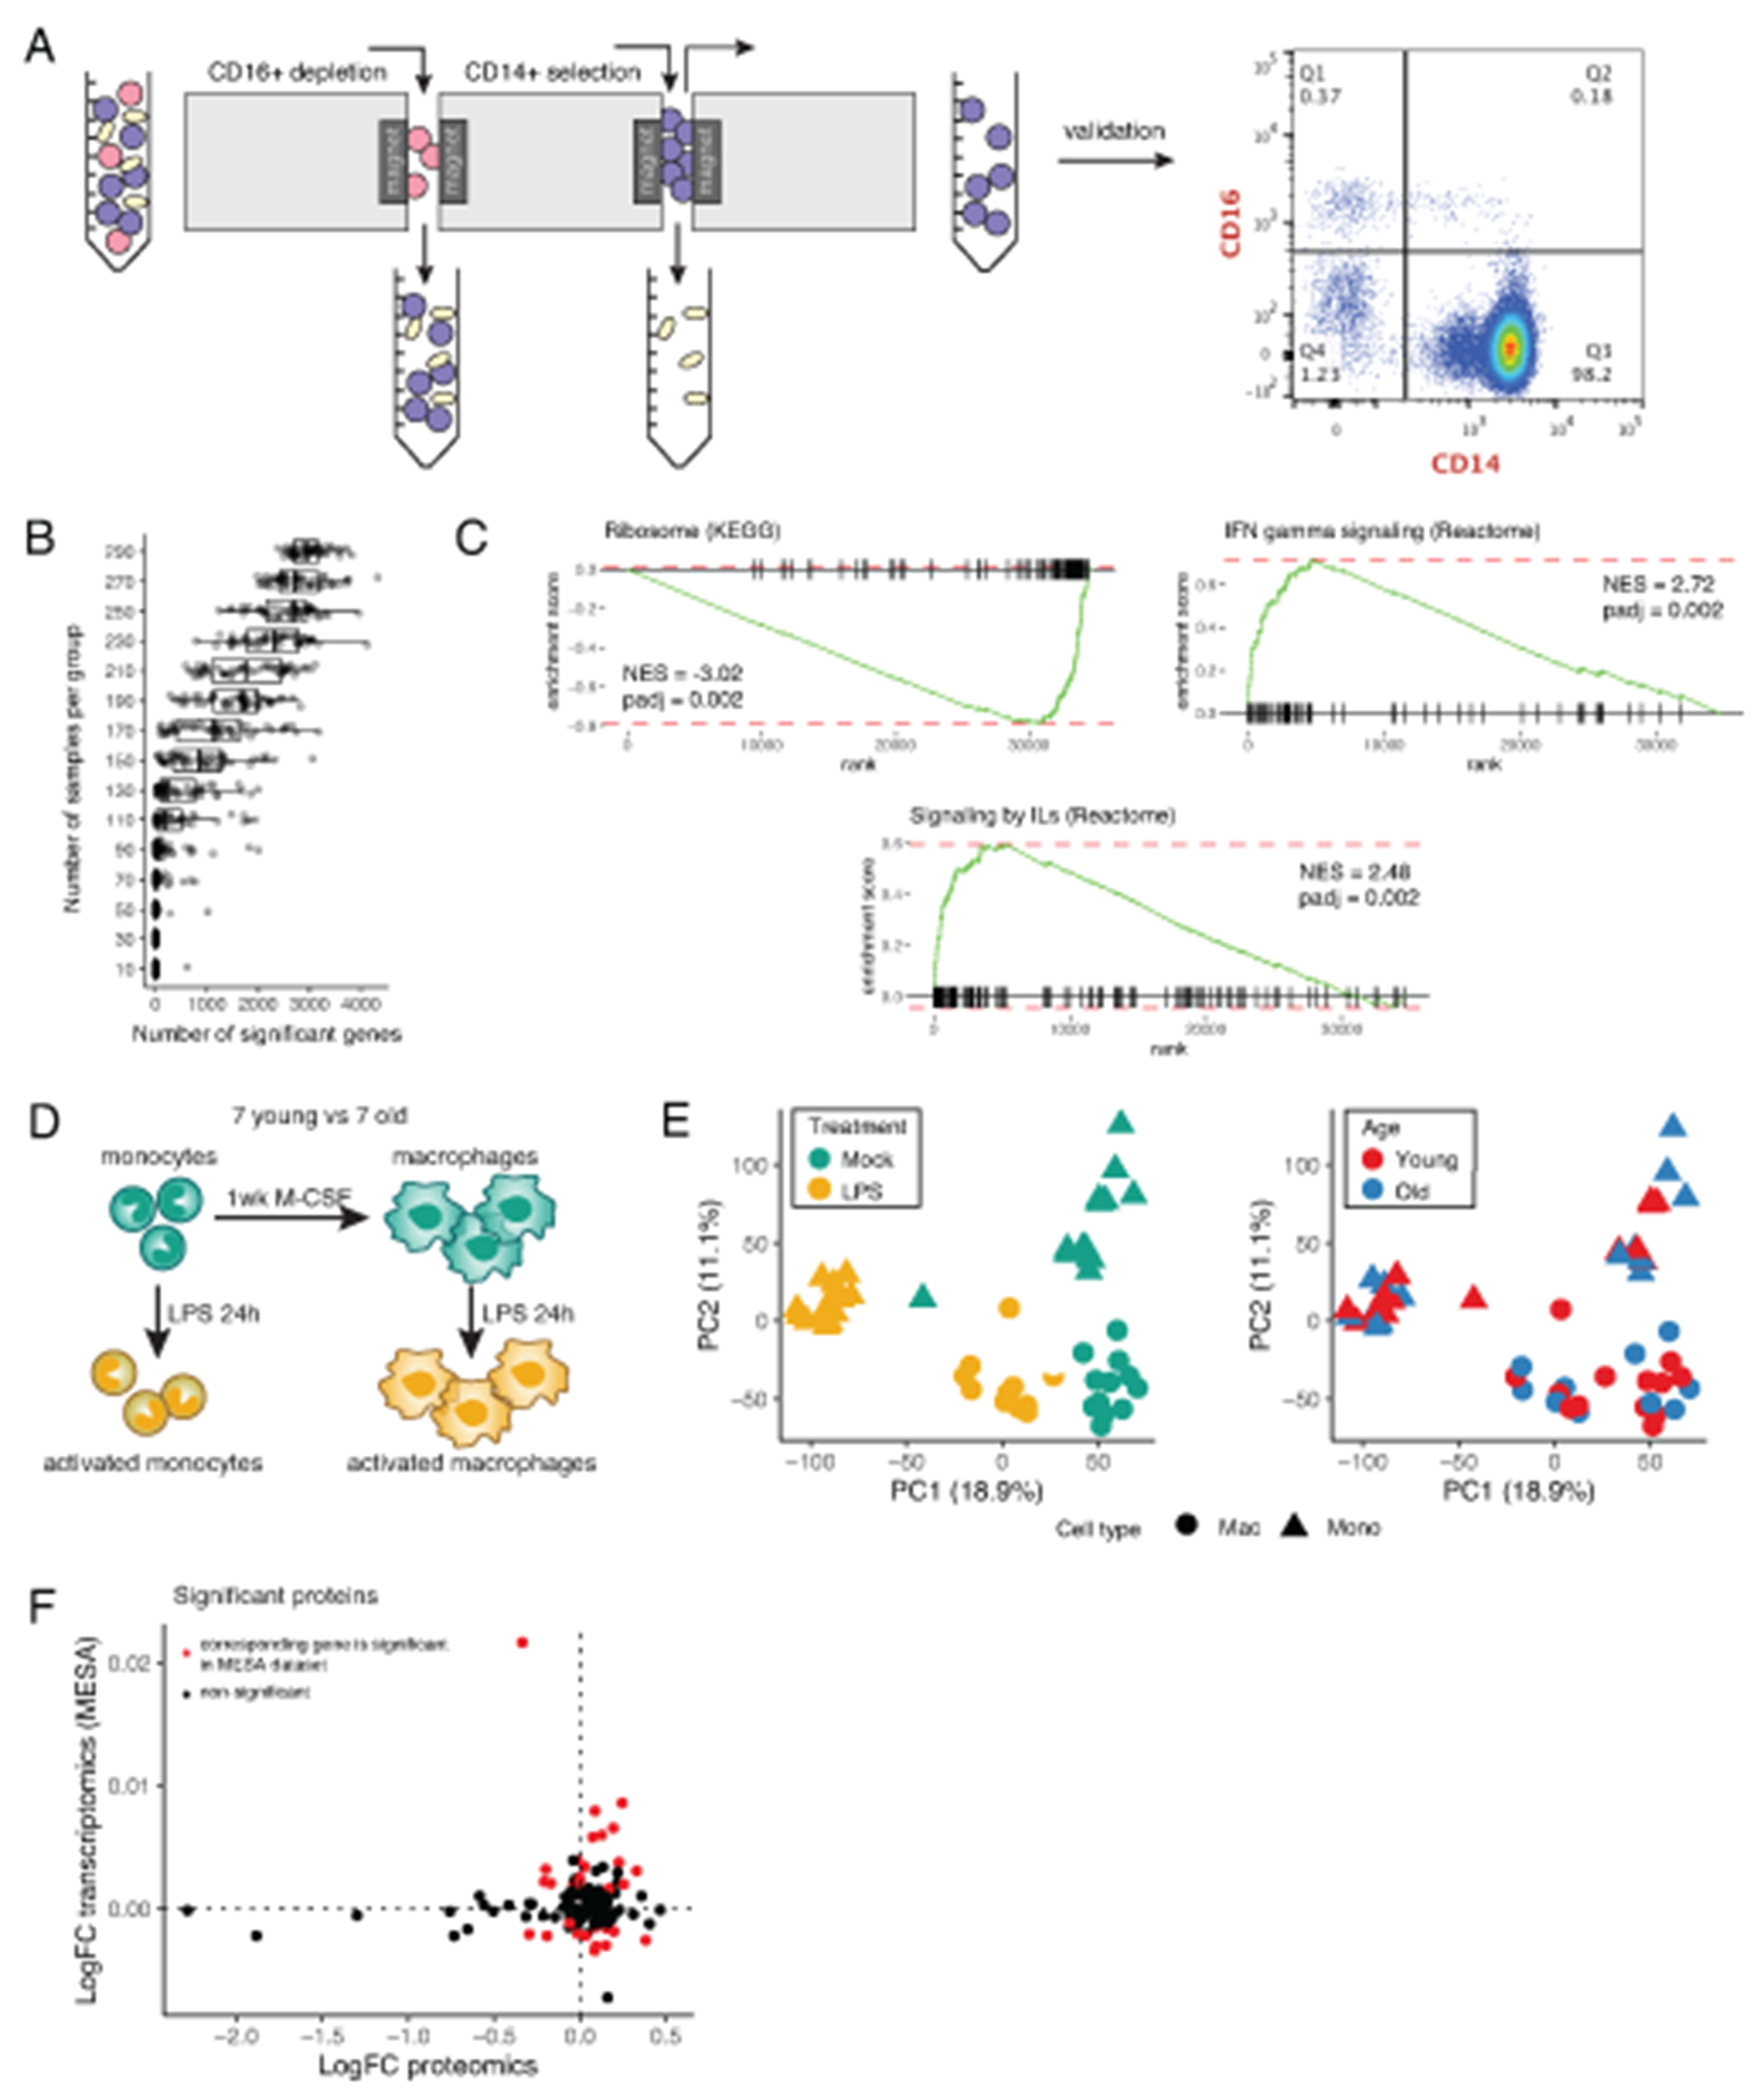
(A) Left panel: schematic representation of CD14+CD16-monocytes isolation using magnetic beads. Right panel: flow cytometry validation and estimation of purity. (B) Number of significant genes detected after downsampling MESA dataset (youngest and oldest 25%). Downsampling was repeated n=50 times for each group size. The lower and upper hinges of all boxplots represent the 25th and 75th percentiles. Horizontal bars show median value. Whiskers extend to the values that are no further than 1.5*IQR from either upper or lower hinge. IQR stands for inter-quartile range, which is the difference between the 75th and 25th percentiles. (C) GSEA enrichment curves illustrate pathways that significantly change with age in MESA dataset. P-values are one-sided and corrected by Benjamini-Hochberg method. (D) Monocytes were differentiated into macrophages by one-week incubation with M-CSF. Both cell types were stimulated by LPS for 24 hours. (E) PCA of normalized expression levels estimated by RNA-seq for monocyte differentiation and activation experiment. (F) Each dot represents a monocyte protein significantly different between age groups. LogFC proteomics (x axis) as in Figure 2F, LogFC transcriptomics as in Figure 2C.
Extended Data Fig. 5. RRBS quality control and monocyte methylome.
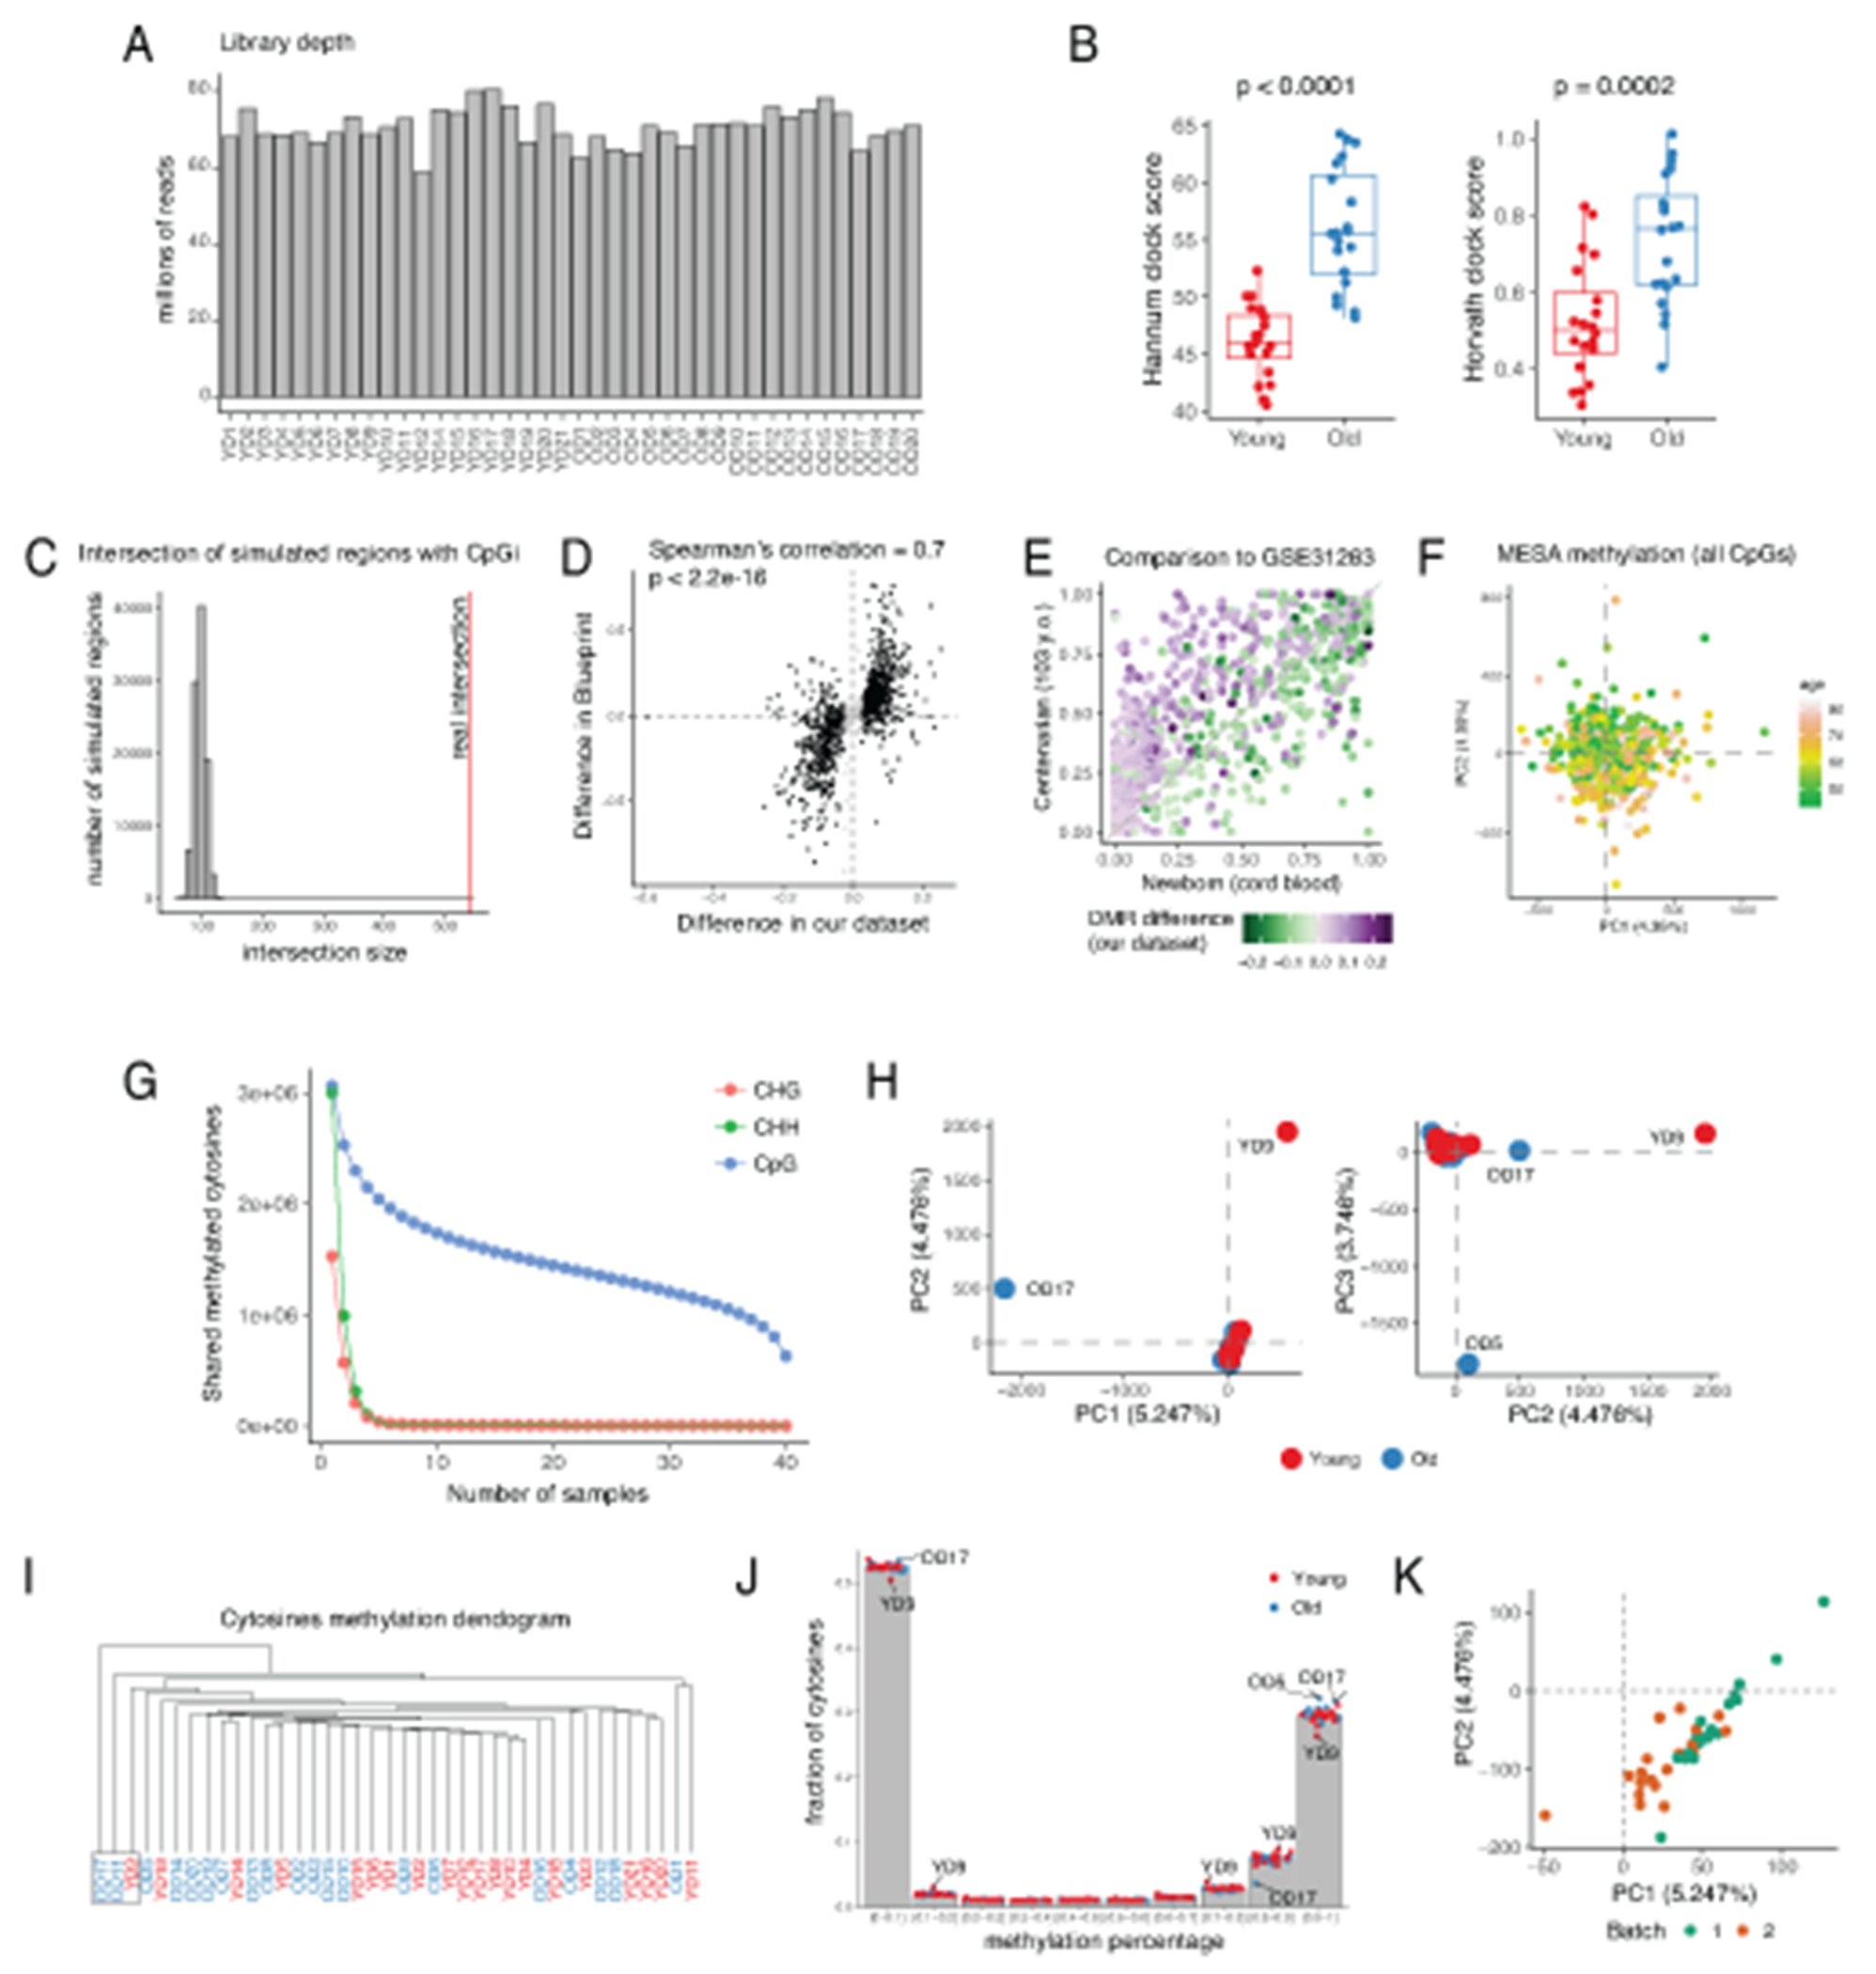
(A) Library depth for each sample. (B) Hannum and Horvath methylation clocks for old (n=20) and young (n=20) groups. Methylation levels of CpGs that were used in the model but were not covered in our eRRBS data were imputed using mean methylation of [−100kb; +100kb] region around the CpG. CpG methylation was set to zero if imputation was not possible. P-values were calculated using two-sided Mann-Whitney U test. The lower and upper hinges of all boxplots represent the 25th and 75th percentiles. Horizontal bars show median value. Whiskers extend to the values that are no further than 1.5*IQR from either upper or lower hinge. IQR stands for inter-quartile range, which is the difference between the 75th and 25th percentiles. (C) Enrichment of DMRs in CpG islands. Histogram shows distribution of simulated intersection sizes (n=100,000 random simulations). (D) Comparison to Blueprint dataset. Each dot represents one DMR detected in our dataset. X axis — difference between old and young cohorts in our dataset, Y axis — difference between old donors and cord blood from Blueprint. (E) Plot as in right panel of Figure 3G for a newborn vs centenarian WGBS dataset (GSE31263). (F) PCA on MESA data as in Figure 3I using all cytosines profiled by DNA methylation array. (G) Number of methylated (methylation level > 0) cytosines in CpG, CHG and CHH context shared by one to 40 samples. (H) PCA of CpGs methylation levels from old and young groups. Each dot represents a sample. (I) Dendrogram produced by unsupervised hierarchical clustering of the samples. Each sample described as a vector of CpG methylation levels. Clustering using Ward algorithm and Manhattan distance as the distance metric. Outliers are labelled. (J) Distribution of CpG methylation levels. For each segment fractions of CpGs with corresponding methylation level in each sample are shown by dots. Bar shows average fraction of CpG across all samples. Outlying samples are labelled. (K) PCA of CpGs methylation levels. Outliers (OD11, OD17, YD9) were excluded.
Extended Data Fig. 6. ULI-ChIP-seq processing and quality control.
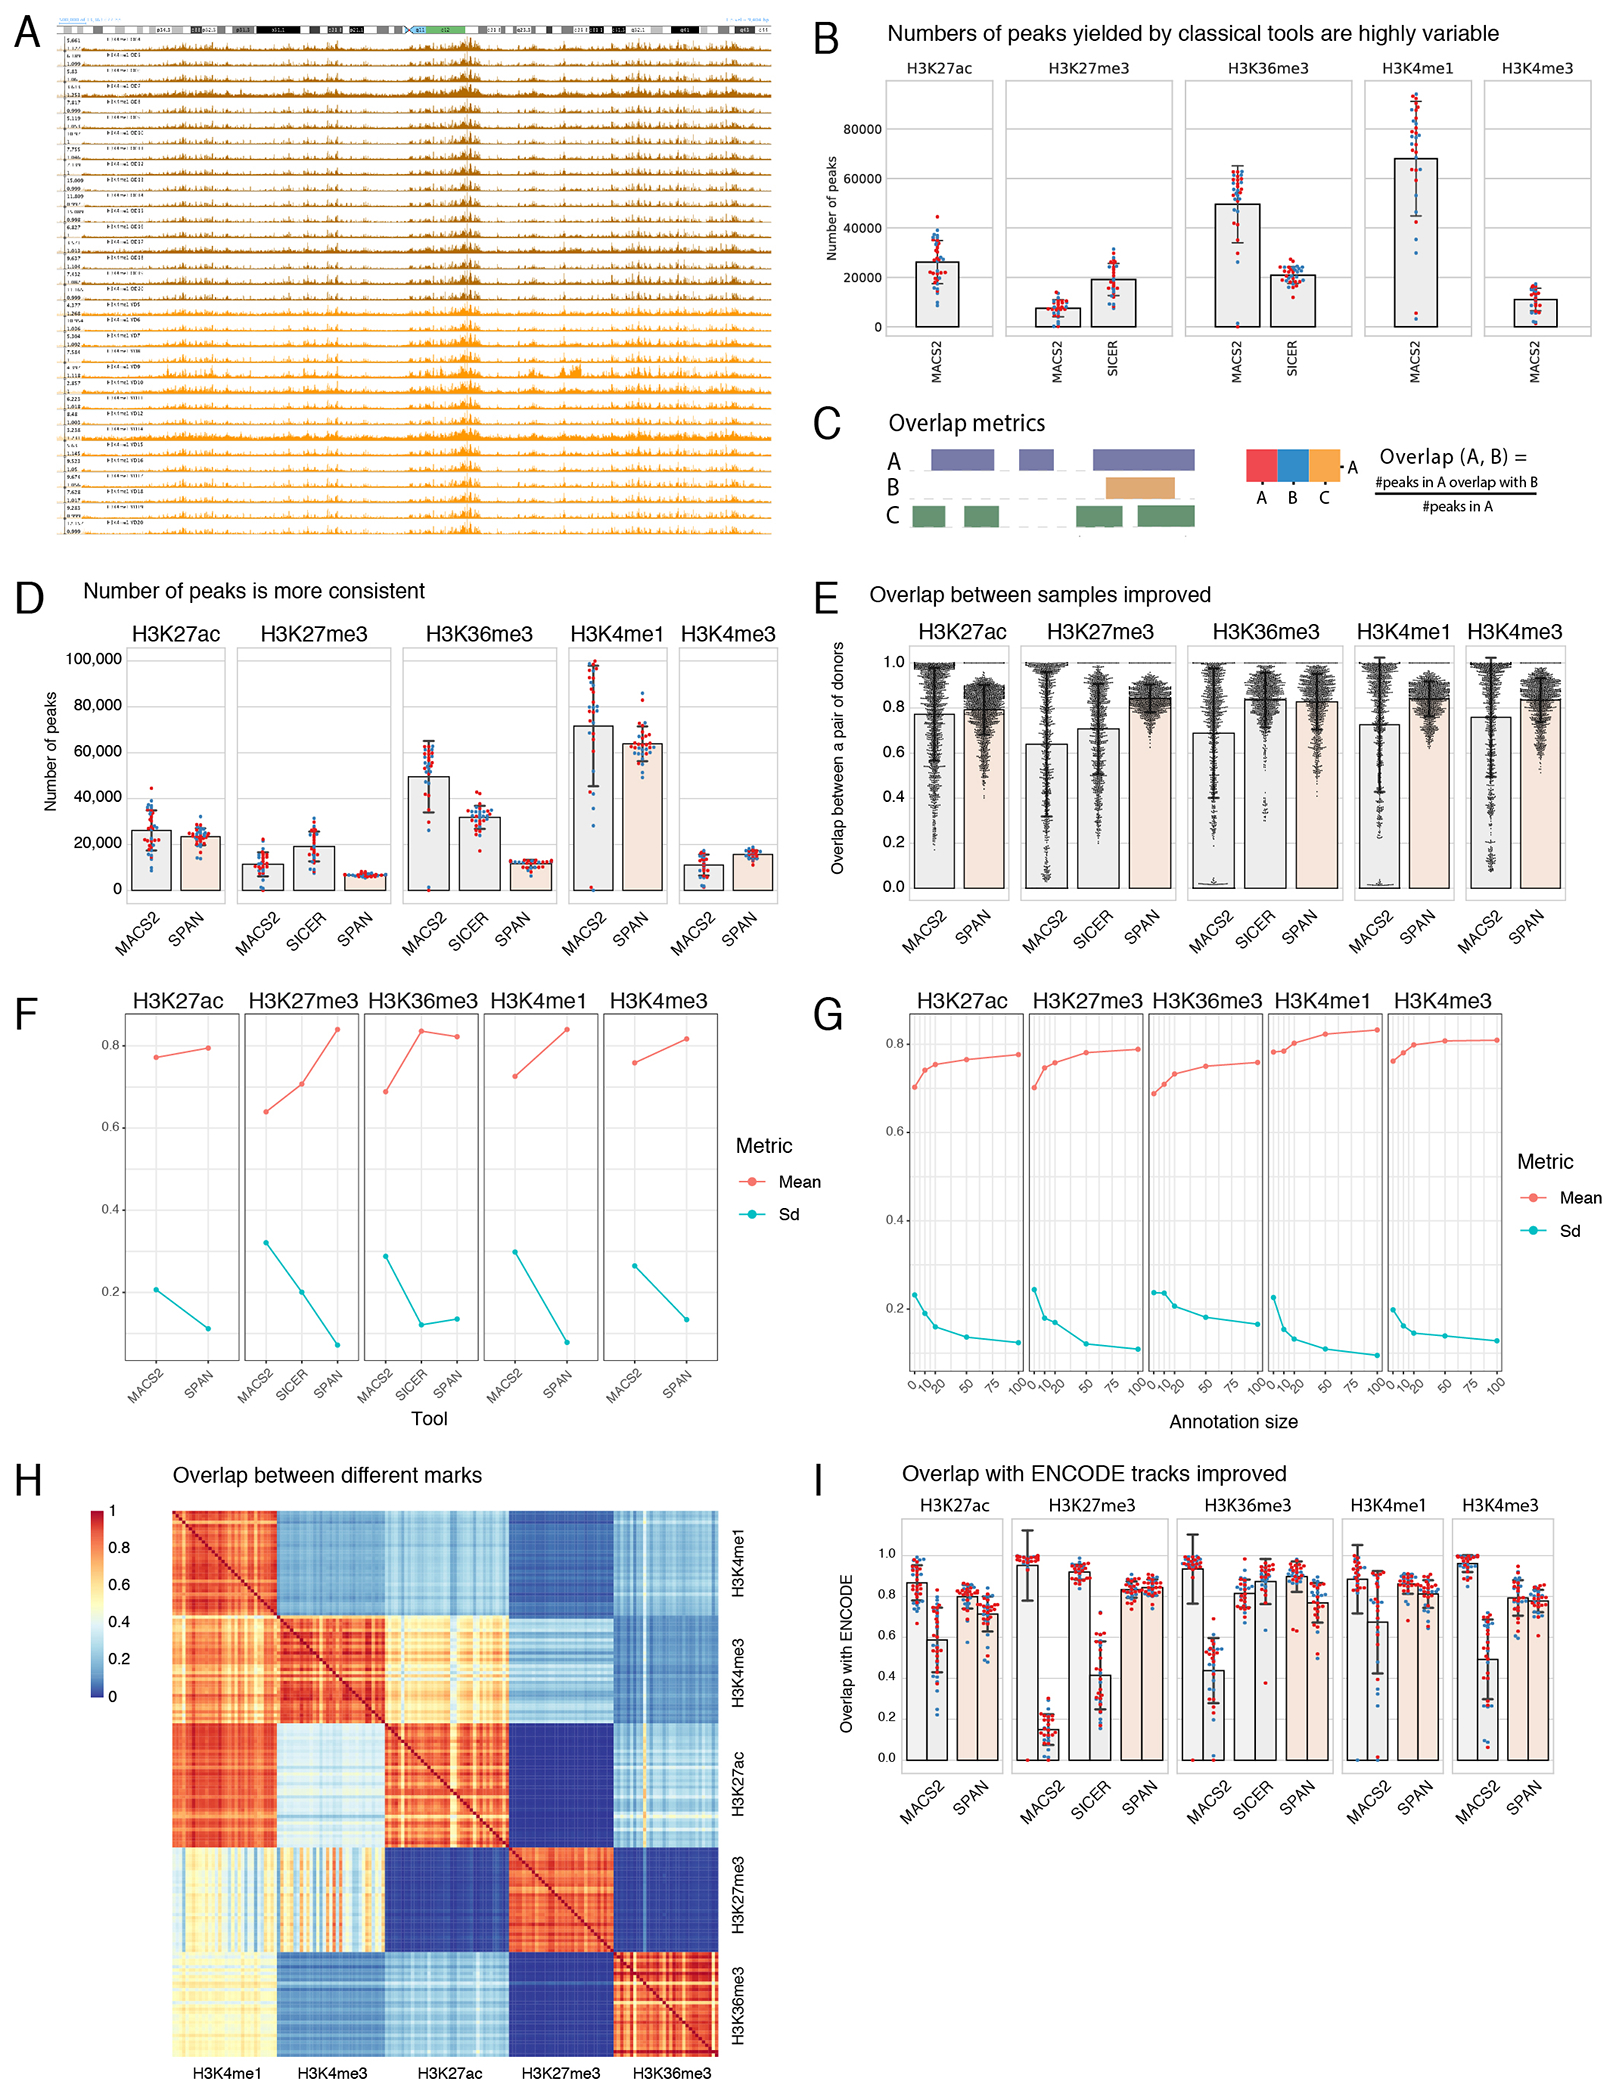
(A) Snapshot of the H3K4me1 tracks across all donors shows distinct signal for all samples with high variability in the signal-to-noise ratio. (B) Number of peaks for each mark in each donor yielded by classical peak calling tools. (C) Schematic representation of overlap metric used in panels (E) and (H). (D) Number of peaks yielded by SPAN, MACS2 and SICER. (E) Overlap between all pairs of samples for peaks generated by SPAN, MACS2 and SICER. SICER was used for wide modifications only. N for each bar is equal to a number of possible pairs between all samples that passed QC. (F) Summary for panel (E). Mean and standard deviation (SD) of overlaps between samples are shown. (G) Overlap characteristics as in (F) for SPAN runs with various annotation sizes. (H) Directional overlap of SPAN peaks between all samples and all histone modifications. (I) Two-way overlap with ENCODE CD14+ monocytes data for different peak calling approaches. In panels (B), (D), and (I) N for each bar is equal to a number of ChIP-seq samples that passed QC for each modification. See Figure 4B for exact numbers. Error bars in all panels represent SD.
Extended Data Fig. 7. SPAN test set errors.
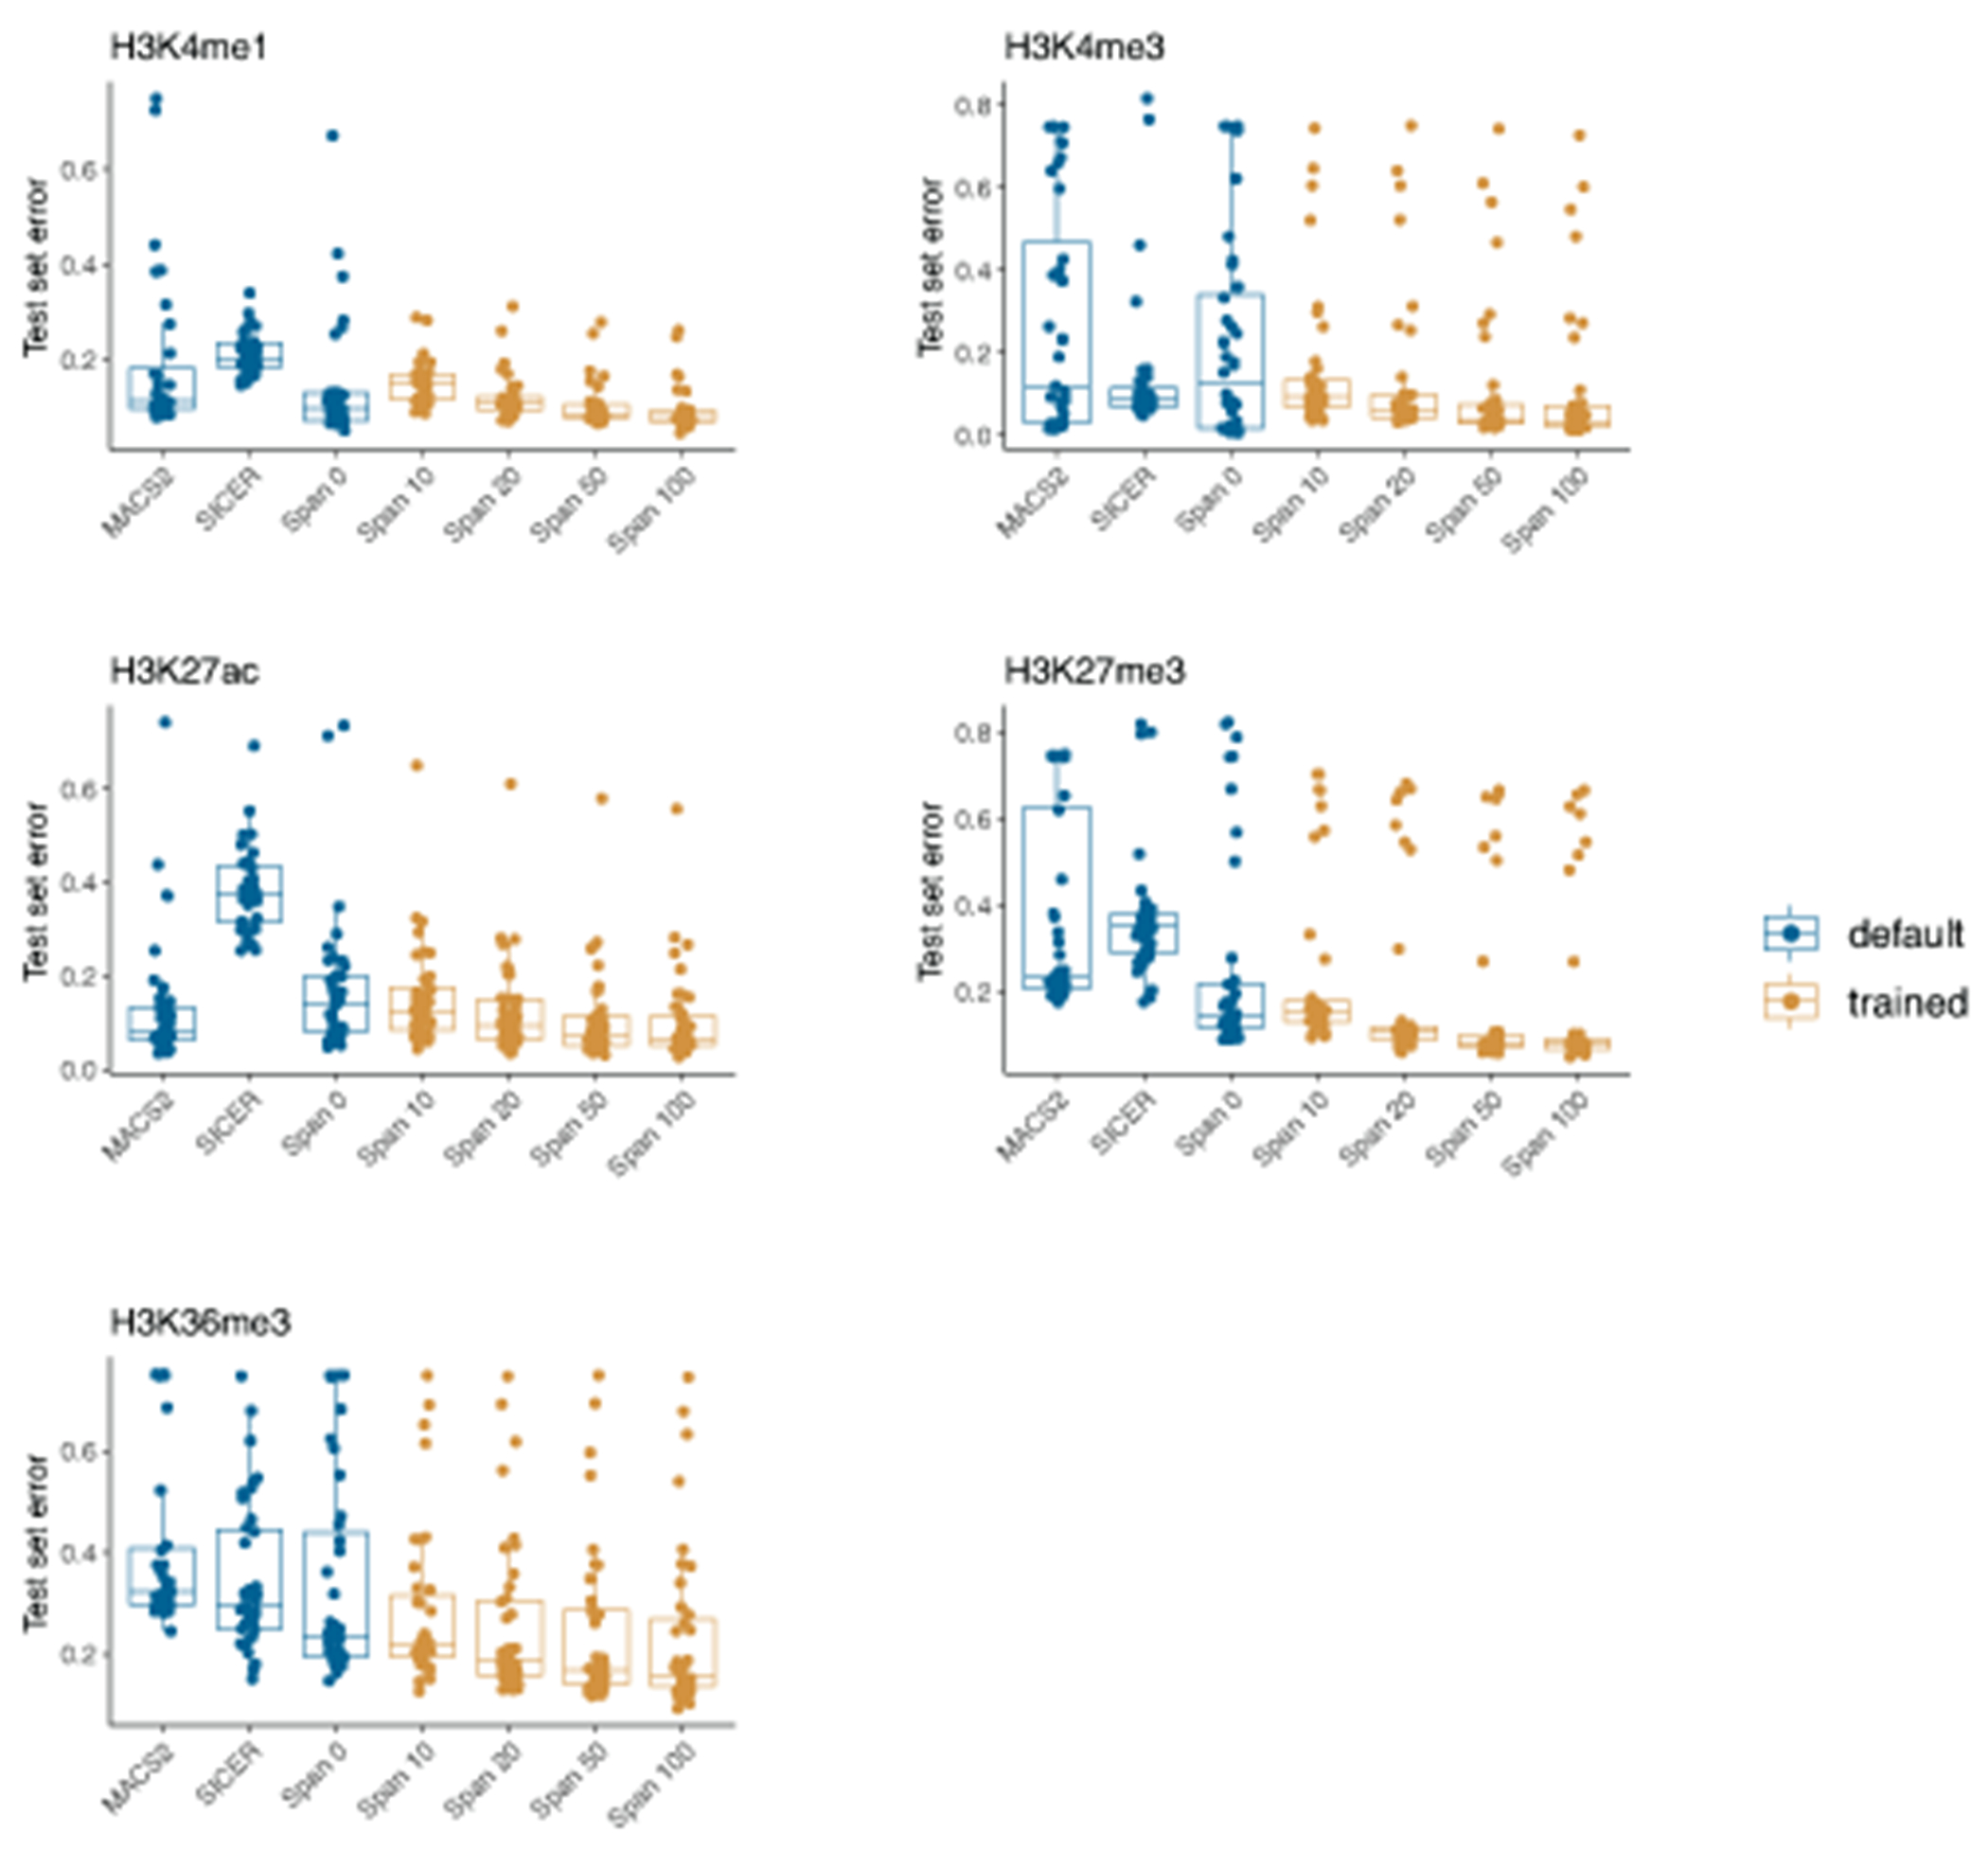
Test set errors for golden standard tools (MACS2, SICER) as well as SPAN trained with various numbers of labels. Each dot represents a sample, n=40 for H3K4me3, H3K27me3, H3K27ac, n=32 for H3K4me1, n=39 for H3K36me3. In all panels, the lower and upper hinges of all boxplots represent the 25th and 75th percentiles. Horizontal bars show median value. Whiskers extend to the values that are no further than 1.5*IQR from either upper or lower hinge. IQR stands for inter-quartile range, which is the difference between the 75th and 25th percentiles.
Extended Data Fig. 8. Chromatin context of DMRs.
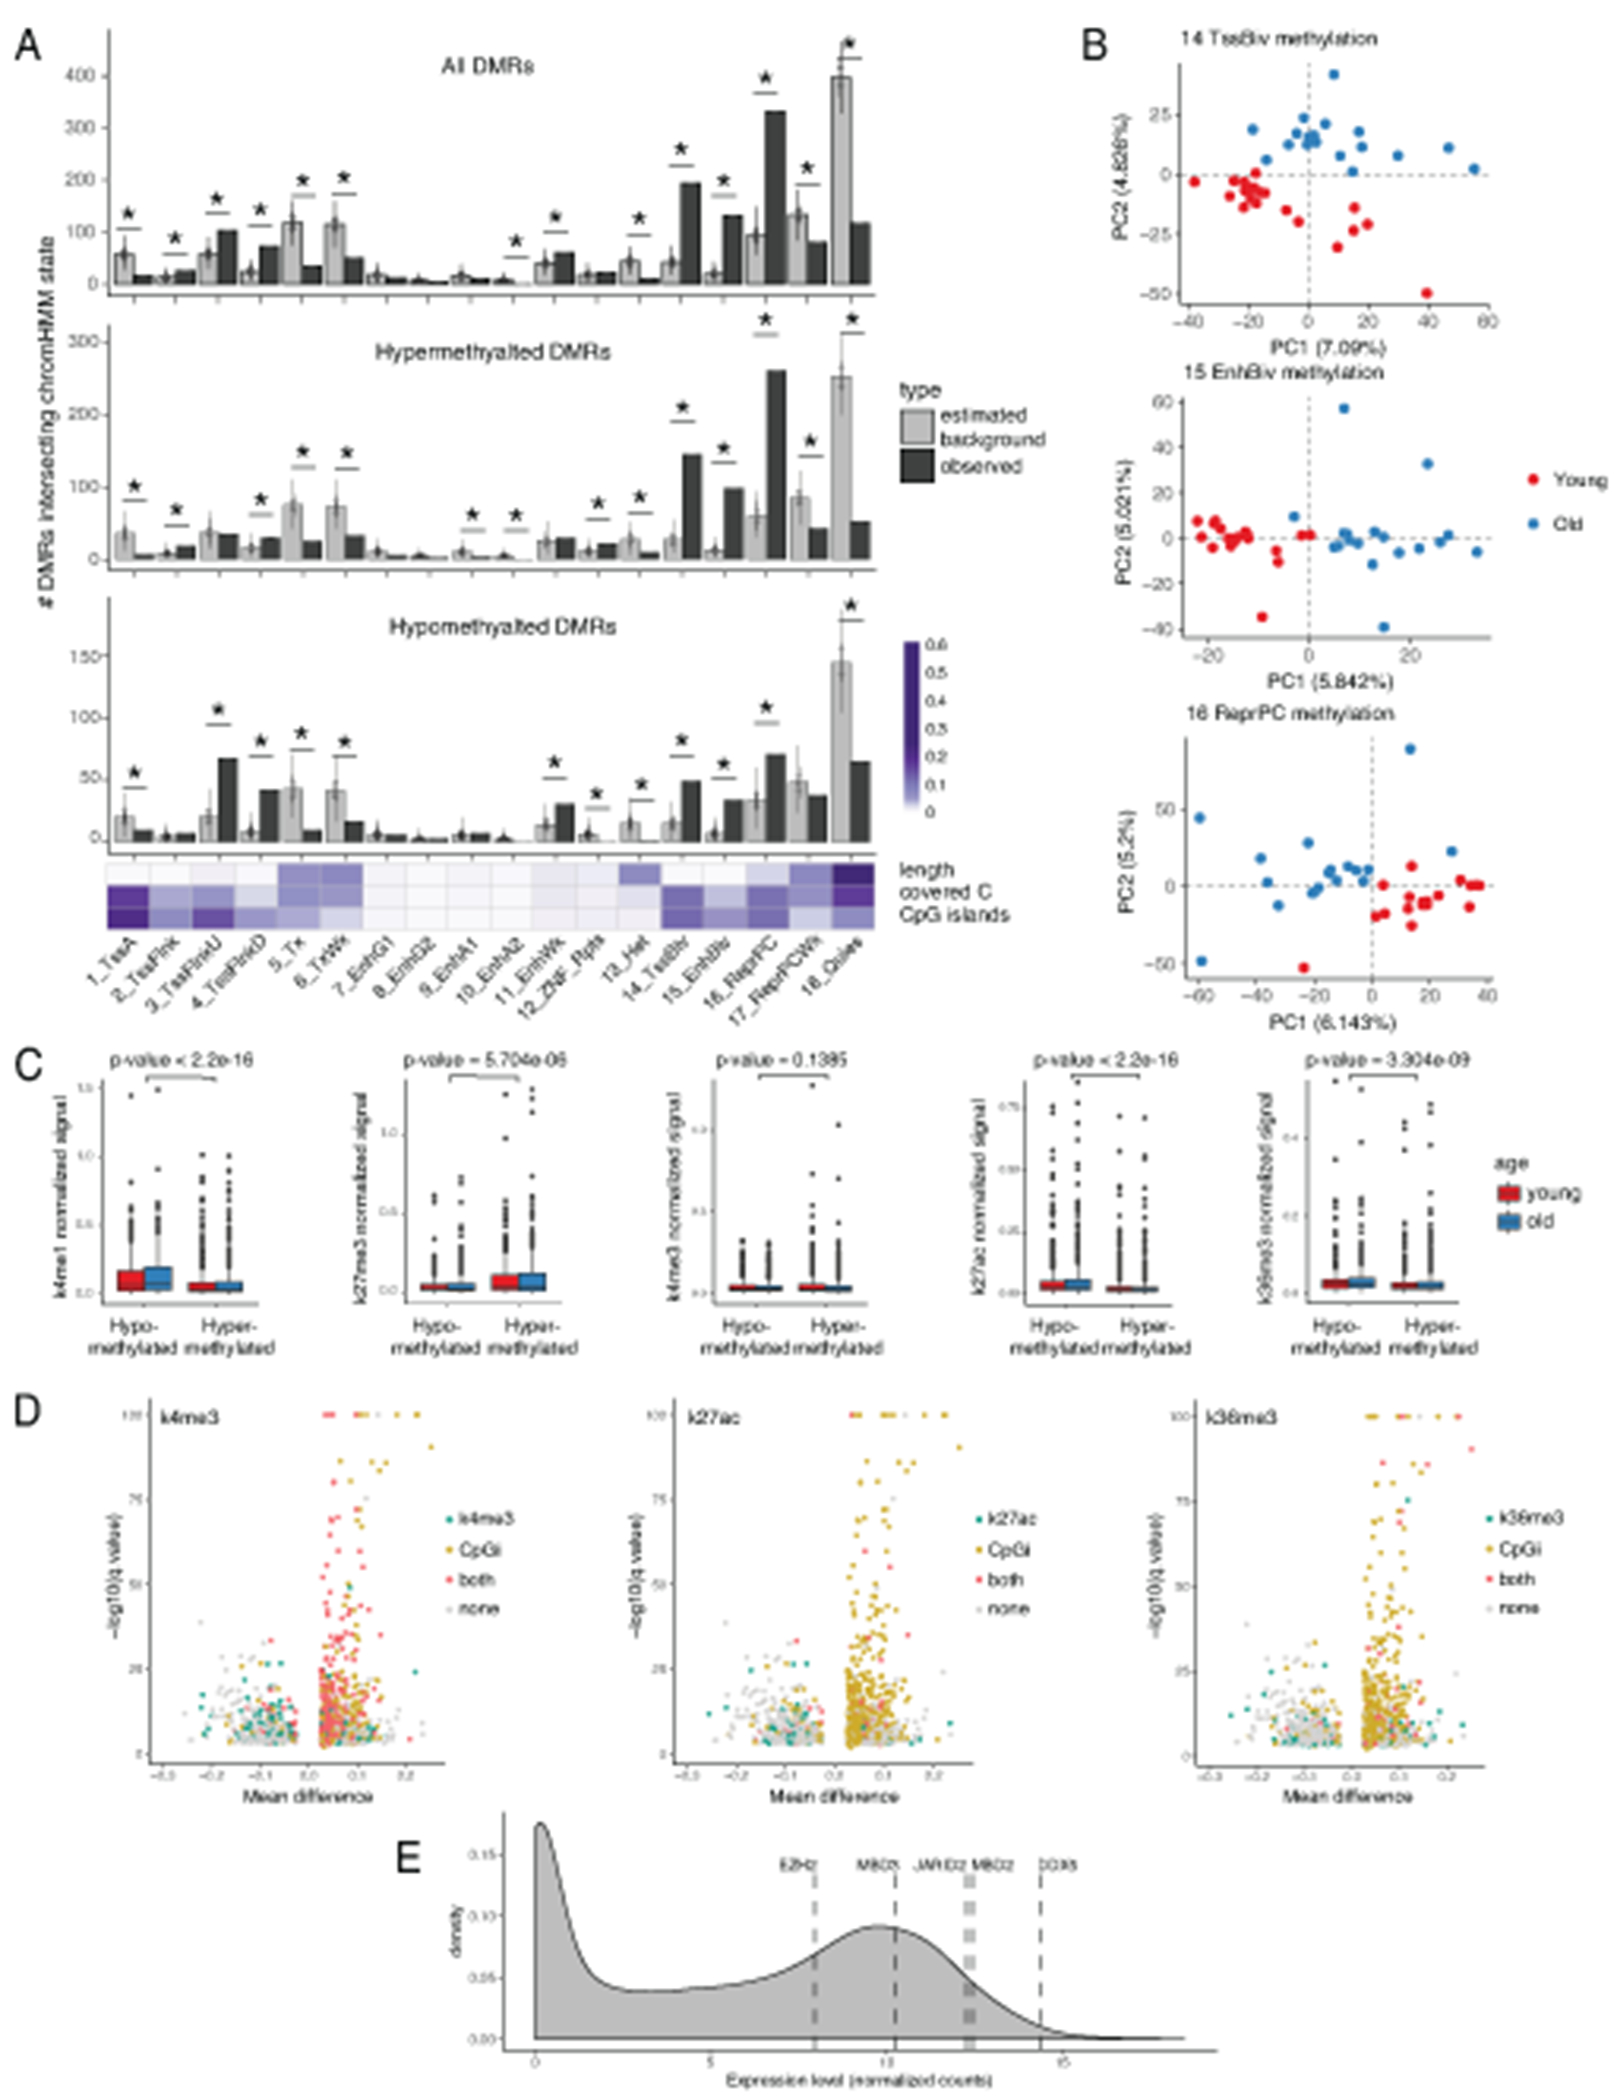
(A) Enrichment of DMRs in chromatin state segments from ENCODE ChromHMM partition. Upper: for each chromatin state dark grey bar represents number of DMRs intersecting at least one segment of the state. Light grey bar shows expected number of intersections estimated by n=100,000 random simulations. Error bars show SD, their centers represent expected intersection. Results shown for all DMRs, hypermethylated DMRs only and hypomethylated DMRs only. Chromatin states that are significantly over- or under-represented among DMRs are marked by asterix (*). Bottom: heatmap shows general statistics for each chromatin state. Values are normalized within each row. (B) PCA of standardized methylation levels in old and young groups for three chromatin states: bivalent Tss (14 TssBiv), bivalent enhancers (15 EnhBiv) and Polycomb-repressed regions (16 ReprPC). Each dot represents a sample. (C) Intensity of H3K4me1, H3K27me3, H3K4me3, H3K27ac, and H3K36me3 signals was calculated for each DMR via Diffbind package, normalized with respect to the DMR length and averaged across the cohorts. Normalized signals were compared between hypo- (n=423) and hypermethylated (n=737) DMRs using two-sided Mann-Whitney U test. Dots represent outliers. The lower and upper hinges of all boxplots represent the 25th and 75th percentiles. Horizontal bars show median value. Whiskers extend to the values that are no further than 1.5*IQR from either upper or lower hinge. IQR stands for inter-quartile range, which is the difference between the 75th and 25th percentiles. (D) Volcano plot as in Figures 4I and 4K, colored in accordance with intersection with H3K4me3, H3K27ac and H3K36me3. (E) Density plot protein coding gene expression with transcription factors of interest highlighted.
Extended Data Fig. 9. Up and down DMRs in different physiological conditions.
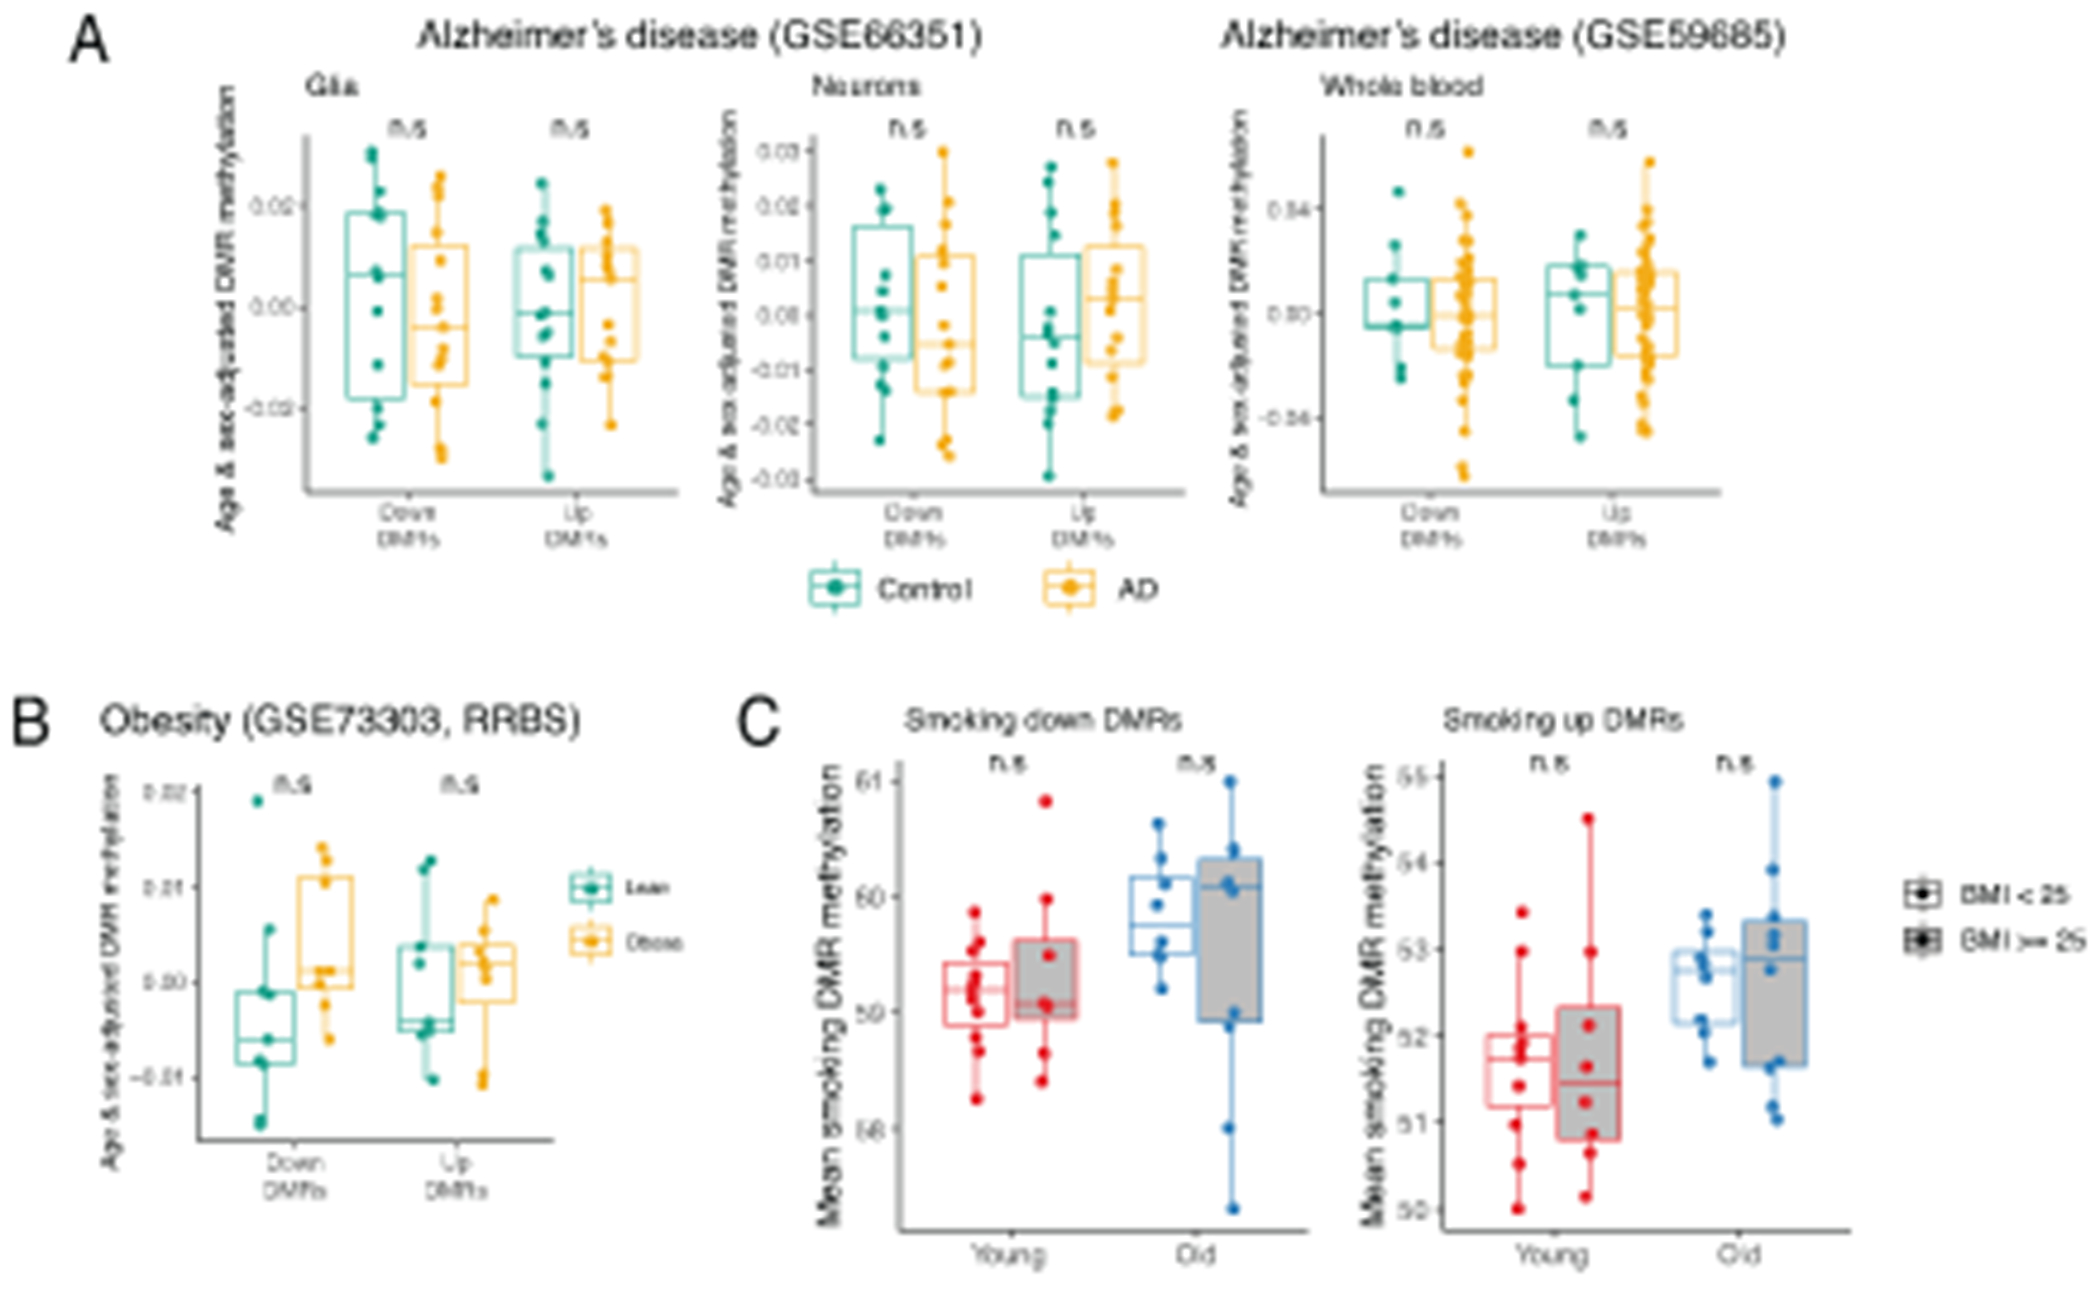
(A) Comparison of age- and sex-adjusted DMR mean methylation between Alzheimer’s patients (n=15 for glia and neurons, n=48 for whole blood) and healthy controls (n=14 for glia and neurons, n=9 for whole blood). Each dot represents one donor. P-values calculated using two-sided Mann-Whitney U test. (B) Plot as in (A) comparing data from lean (n=9) and obese (n=8) donors. (C) Plot as in Figure 6G. Mean methylation of smoking DMRs in our cohort: young lean (n=11), young overweight (n=8), old lean (n=8), and old overweight (n=10). P-values were calculated using two-sided Mann-Whitney U test. In all panels, the lower and upper hinges of all boxplots represent the 25th and 75th percentiles. Horizontal bars show median value. Whiskers extend to the values that are no further than 1.5*IQR from either upper or lower hinge. IQR stands for inter-quartile range, which is the difference between the 75th and 25th percentiles.
Supplementary Material
Basic donor information and blood differential (cell counts, Hb and HCT levels)
Cytokine bioplex assay data for all donors (IFN-γ, IL-10, IL-12p70, IL-13, IL-1β, IL-2, IL-4, IL-6, IL-8, TNF-α).
(A) Scaled intensities of the metabolites in the plasma for all donors (734 metabolites). (B) Differential analysis results. Significant differences in metabolites between cohorts were determined using two-sided Mann-Whitney U test. P-values were adjusted for multiple testing using the Benjamini-Hochberg method.
ELISA validation of the most differentially present plasma proteins (sCD86, GDF-15, SOST, OMD, Notch 1).
SomaScan proteomics array data for all donors: (A) scaled data, (B) differential comparison statistics. For differential analysis, functions lmFit and eBayes from the Limma package were used (two-sided). P-values were adjusted for multiple testing using the Benjamini-Hochberg method.
Monocyte RNA-seq data. DESeq2 differential analysis results between old and young cohorts (two-sided Wald test, correction for multiple testing using Benjamini-Hochberg method).
Transcriptomic data for MESA cohort. Limma differential analysis results (gene ~ age + chip + race-gender-site design, two-sided test, correction for multiple testing using the Benjamini-Hochberg method).
Counts for monocyte RNA-seq data. (A) Raw counts, (B) DESeq2 normalized counts, (C) Log2-quantile normalized counts.
Monocyte proteomics data generated and analyzed by Biognosys. (A) Sample table, (B) Spectral library protein inventory, (C) Spectral library peptide inventory, (D) Differential analysis results, (E) Protein intensities, (F) Peptide intensities. In brief, for each protein the fold change of each peptide ion variant was estimated as average abundance of peptide ion variant across biological replicates in old group / average abundance of peptide ion variant across biological replicates in young group. The values then were log-transformed and fold changes of all peptides belonging to the same proteins were compared to zero using two-sided paired t-test. Multiple testing correction was performed as described in Storey et al.63
RNA-seq data for monocyte differentiation and stimulation experiment (see Extended Data 4D). (A) Raw counts, (B) DESeq2 normalized counts, (C) Log2-quantile normalized counts.
Basic QC metrics of RRBS libraries (N covered (>= 10 reads) CpG, mean CpG coverage, % mapped reads, conversion rate, library depth).
Differentially methylated regions as obtained from RRBS data: (A) unfiltered DMRs, (B) Confident DMRs filtered based on ncyto ≥ 3 and abs(avdiff) ≥ 0.025.
Basic characteristics and QC of the ULI-ChipSeq libraries: (A) FastqC output, (B) QC of bam files based on ENCODE standards, (C) alignment statistics, (D) QC results reported by phantompeaks.
Transcription factors binding sites overrepresentation analysis: (A) Results for up DMRs corrected for enrichment in CpG islands, (B) Results for down DMRs corrected for enrichment in H3K4me1 marked regions. Please see Methods section for ther details of one-sided enrichment procedure. Correction for multiple testing was done using the Benjamini-Hochberg method.
ACKNOWLEDGEMENTS
The study was supported by funding from the Aging Biology Foundation to Artyomov laboratory. Bagaitkar lab is partially supported by GM125504 and DE28296. Dixit lab is supported in part by NIH grants P01AG051459, AI105097, AG051459, AR070811, the Glenn Foundation on Aging Research and Cure Alzheimer’s Fund. This publication is solely the responsibility of the authors and does not necessarily represent the official view of NCRR or NIH. We thank the Genome Technology Access Centre in the Department of Genetics at Washington University School of Medicine for help with genomic analysis. The Centre is partially supported by NCI Cancer Centre Support Grant #P30 CA91842 to the Siteman Cancer Centre and by ICTS/CTSA Grant# UL1TR000448 from the National Centre for Research Resources (NCRR), a component of the National Institutes of Health (NIH), and NIH Roadmap for Medical Research. We also wish to thank the Epigenomic Core of Weill Cornell Medicine for the initial analysis of the methylation data (eRRBS and raw data pre-processing). We acknowledge the ENCODE consortium and the ENCODE production laboratories that generated the data sets used in the manuscript. We thank Irina Miralda for Figure 1 schematic.
Footnotes
ACCESSION CODES
Raw human sequencing data are deposited to Synapse repository: https://www.synapse.org/#!Synapse:syn22020090/wiki/602603
COMPETING INTERESTS
The authors declare no competing interests
CODE AVAILABILITY
ULI-ChIP-Seq data processing pipeline is available on GitHub: https://github.com/JetBrains-Research/washu. Custom tools (SPAN and JBR browser), models and tutorials are available online at https://artyomovlab.wustl.edu/aging/tools.html.
DATA AVAILABILITY
Raw human sequencing data (Figures 2, 3, and 4) are deposited to Synapse repository (https://www.synapse.org/#!Synapse:syn22020090/wiki/602603) and available for download upon request to the corresponding author. Please provide information about the principle investigator (name, affiliation, email address, and telephone number) and official email from Institutional Signing Official. The mass spectrometry proteomics data for monocyte lysates have been deposited to the ProteomeXchange Consortium via the PRIDE77 partner repository with the dataset identifier PXD021821.
Processed sequencing data, as well as raw and processed metabolic and proteomics data are available at the dedicated online portal at https://artyomovlab.wustl.edu/aging/.
Following publicly available datasets have been used in present study:
GSE56045 MESA transcriptomic dataset – expression table and annotation are provided. (https://www.ncbi.nlm.nih.gov/geo/query/acc.cgi?acc=GSE56045)
GSE56046 MESA DNA methylation dataset – table of M values and annotation are provided. (https://www.ncbi.nlm.nih.gov/geo/query/acc.cgi?acc=GSE56046)
EGAD00001002523 Blueprint dataset – bigwig files with methylation signal were downloaded. Experiment ids are EGAX00001097775, EGAX00001097772, EGAX00001086967, EGAX00001086968, EGAX00001086970, EGAX00001097774.
GSE31263 WGBS dataset – BED files with methylation signal were used. (https://www.ncbi.nlm.nih.gov/geo/query/acc.cgi?acc=GSE31263)
ENCODE ChIP-Seq samples were used: GSM1102782, GSM1102785, GSM1102788, GSM1102793, GSM1102797.
ENCODE ChromHMM annotation ENCSR907LCD was used. (https://www.encodeproject.org/annotations/ENCSR907LCD/)
ReMap 2018 database was downloaded for hg19. (http://pedagogix-tagc.univ-mrs.fr/remap/download/remap2018/hg19/MACS/remap2018_TF_archive_nr_macs2_hg19_v1_2.tar.gz)
For a list of datasets used in Figure 6 and Extended Data 9 please see “Integration with public data” section of Methods.
Neal lab analysis of UK Biobank was downloaded from http://www.nealelab.is/blog/2017/7/19/rapid-gwas-of-thousands-of-phenotypes-for-337000-samples-in-the-uk-biobank
REFERENCES
- 1.Marengoni A, et al. Aging with multimorbidity: a systematic review of the literature. Ageing Res Rev 10, 430–439 (2011). [DOI] [PubMed] [Google Scholar]
- 2.Bektas A, Schurman SH, Sen R & Ferrucci L Aging, inflammation and the environment. Exp Gerontol 105, 10–18 (2018). [DOI] [PMC free article] [PubMed] [Google Scholar]
- 3.Cesari M, et al. Antioxidants and physical performance in elderly persons: the Invecchiare in Chianti (InCHIANTI) study. Am J Clin Nutr 79, 289–294 (2004). [DOI] [PubMed] [Google Scholar]
- 4.Reynolds LM, et al. Age-related variations in the methylome associated with gene expression in human monocytes and T cells. Nat Commun 5, 5366 (2014). [DOI] [PMC free article] [PubMed] [Google Scholar]
- 5.Peters MJ, et al. The transcriptional landscape of age in human peripheral blood. Nat Commun 6, 8570 (2015). [DOI] [PMC free article] [PubMed] [Google Scholar]
- 6.Carr EJ, et al. The cellular composition of the human immune system is shaped by age and cohabitation. Nat Immunol 17, 461–468 (2016). [DOI] [PMC free article] [PubMed] [Google Scholar]
- 7.Patin E, et al. Natural variation in the parameters of innate immune cells is preferentially driven by genetic factors. Nat Immunol 19, 302–314 (2018). [DOI] [PubMed] [Google Scholar]
- 8.Beerman I, et al. Proliferation-dependent alterations of the DNA methylation landscape underlie hematopoietic stem cell aging. Cell Stem Cell 12, 413–425 (2013). [DOI] [PubMed] [Google Scholar]
- 9.Benayoun BA, Pollina EA & Brunet A Epigenetic regulation of ageing: linking environmental inputs to genomic stability. Nat Rev Mol Cell Biol 16, 593–610 (2015). [DOI] [PMC free article] [PubMed] [Google Scholar]
- 10.Horvath S & Raj K DNA methylation-based biomarkers and the epigenetic clock theory of ageing. Nat Rev Genet (2018). [DOI] [PubMed] [Google Scholar]
- 11.Johnson AA, et al. The role of DNA methylation in aging, rejuvenation, and age-related disease. Rejuvenation Res 15, 483–494 (2012). [DOI] [PMC free article] [PubMed] [Google Scholar]
- 12.Zhang W, Qu J, Liu GH & Belmonte JCI The ageing epigenome and its rejuvenation. Nat Rev Mol Cell Biol 21, 137–150 (2020). [DOI] [PubMed] [Google Scholar]
- 13.Brind’Amour J, et al. An ultra-low-input native ChIP-seq protocol for genome-wide profiling of rare cell populations. Nat Commun 6, 6033 (2015). [DOI] [PubMed] [Google Scholar]
- 14.Brodin P, et al. Variation in the human immune system is largely driven by non-heritable influences. Cell 160, 37–47 (2015). [DOI] [PMC free article] [PubMed] [Google Scholar]
- 15.Trabado S, et al. The human plasma-metabolome: Reference values in 800 French healthy volunteers; impact of cholesterol, gender and age. PLoS One 12, e0173615 (2017). [DOI] [PMC free article] [PubMed] [Google Scholar]
- 16.Rodriguez-Rodero S, et al. Aging genetics and aging. Aging Dis 2, 186–195 (2011). [PMC free article] [PubMed] [Google Scholar]
- 17.Mitchell SJ, Scheibye-Knudsen M, Longo DL & de Cabo R Animal models of aging research: implications for human aging and age-related diseases. Annu Rev Anim Biosci 3, 283–303 (2015). [DOI] [PubMed] [Google Scholar]
- 18.Kim HO, Kim HS, Youn JC, Shin EC & Park S Serum cytokine profiles in healthy young and elderly population assessed using multiplexed bead-based immunoassays. J Transl Med 9, 113 (2011). [DOI] [PMC free article] [PubMed] [Google Scholar]
- 19.Clark JA & Peterson TC Cytokine production and aging: overproduction of IL-8 in elderly males in response to lipopolysaccharide. Mech Ageing Dev 77, 127–139 (1994). [DOI] [PubMed] [Google Scholar]
- 20.Wolf J, et al. The effect of chronological age on the inflammatory response of human fibroblasts. Exp Gerontol 47, 749–753 (2012). [DOI] [PMC free article] [PubMed] [Google Scholar]
- 21.Franceschi C, Garagnani P, Parini P, Giuliani C & Santoro A Inflammaging: a new immune-metabolic viewpoint for age-related diseases. Nat Rev Endocrinol 14, 576–590 (2018). [DOI] [PubMed] [Google Scholar]
- 22.Mahlknecht U & Kaiser S Age-related changes in peripheral blood counts in humans. Exp Ther Med 1, 1019–1025 (2010). [DOI] [PMC free article] [PubMed] [Google Scholar]
- 23.Geiger H, de Haan G & Florian MC The ageing haematopoietic stem cell compartment. Nat Rev Immunol 13, 376–389 (2013). [DOI] [PubMed] [Google Scholar]
- 24.Conte M, et al. Human aging and longevity are characterized by high levels of mitokines. J Gerontol A Biol Sci Med Sci (2018). [DOI] [PubMed] [Google Scholar]
- 25.Tanaka T, et al. Plasma proteomic signature of age in healthy humans. Aging Cell, e12799 (2018). [DOI] [PMC free article] [PubMed] [Google Scholar]
- 26.Labrie F, Belanger A, Cusan L, Gomez JL & Candas B Marked decline in serum concentrations of adrenal C19 sex steroid precursors and conjugated androgen metabolites during aging. J Clin Endocrinol Metab 82, 2396–2402 (1997). [DOI] [PubMed] [Google Scholar]
- 27.Liu Y, et al. Methylomics of gene expression in human monocytes. Hum Mol Genet 22, 5065–5074 (2013). [DOI] [PMC free article] [PubMed] [Google Scholar]
- 28.Reynolds LM, et al. Transcriptomic profiles of aging in purified human immune cells. BMC Genomics 16, 333 (2015). [DOI] [PMC free article] [PubMed] [Google Scholar]
- 29.Bocklandt S, et al. Epigenetic predictor of age. PLoS One 6, e14821 (2011). [DOI] [PMC free article] [PubMed] [Google Scholar]
- 30.Florath I, Butterbach K, Muller H, Bewerunge-Hudler M & Brenner H Cross-sectional and longitudinal changes in DNA methylation with age: an epigenome-wide analysis revealing over 60 novel age-associated CpG sites. Hum Mol Genet 23, 1186–1201 (2014). [DOI] [PMC free article] [PubMed] [Google Scholar]
- 31.Hannum G, et al. Genome-wide methylation profiles reveal quantitative views of human aging rates. Mol Cell 49, 359–367 (2013). [DOI] [PMC free article] [PubMed] [Google Scholar]
- 32.Horvath S DNA methylation age of human tissues and cell types. Genome Biol 14, R115 (2013). [DOI] [PMC free article] [PubMed] [Google Scholar]
- 33.Horvath S, et al. Aging effects on DNA methylation modules in human brain and blood tissue. Genome Biol 13, R97 (2012). [DOI] [PMC free article] [PubMed] [Google Scholar]
- 34.Weidner CI, et al. Aging of blood can be tracked by DNA methylation changes at just three CpG sites. Genome Biol 15, R24 (2014). [DOI] [PMC free article] [PubMed] [Google Scholar]
- 35.Garrett-Bakelman FE, et al. Enhanced reduced representation bisulfite sequencing for assessment of DNA methylation at base pair resolution. J Vis Exp, e52246 (2015). [DOI] [PMC free article] [PubMed] [Google Scholar]
- 36.Heyn H, et al. Distinct DNA methylomes of newborns and centenarians. Proc Natl Acad Sci U S A 109, 10522–10527 (2012). [DOI] [PMC free article] [PubMed] [Google Scholar]
- 37.Wilson VL, Smith RA, Ma S & Cutler RG Genomic 5-methyldeoxycytidine decreases with age. J Biol Chem 262, 9948–9951 (1987). [PubMed] [Google Scholar]
- 38.Cheung P, et al. Single-Cell Chromatin Modification Profiling Reveals Increased Epigenetic Variations with Aging. Cell (2018). [DOI] [PMC free article] [PubMed] [Google Scholar]
- 39.Slieker RC, et al. Age-related accrual of methylomic variability is linked to fundamental ageing mechanisms. Genome Biol 17, 191 (2016). [DOI] [PMC free article] [PubMed] [Google Scholar]
- 40.Tserel L, et al. Age-related profiling of DNA methylation in CD8+ T cells reveals changes in immune response and transcriptional regulator genes. Sci Rep 5, 13107 (2015). [DOI] [PMC free article] [PubMed] [Google Scholar]
- 41.Song Q, et al. A reference methylome database and analysis pipeline to facilitate integrative and comparative epigenomics. PLoS One 8, e81148 (2013). [DOI] [PMC free article] [PubMed] [Google Scholar]
- 42.Adams D, et al. BLUEPRINT to decode the epigenetic signature written in blood. Nat Biotechnol 30, 224–226 (2012). [DOI] [PubMed] [Google Scholar]
- 43.Stunnenberg HG, International Human Epigenome C & Hirst M The International Human Epigenome Consortium: A Blueprint for Scientific Collaboration and Discovery. Cell 167, 1145–1149 (2016). [DOI] [PubMed] [Google Scholar]
- 44.Hocking TD, et al. Optimizing ChIP-seq peak detectors using visual labels and supervised machine learning. Bioinformatics 33, 491–499 (2017). [DOI] [PMC free article] [PubMed] [Google Scholar]
- 45.Ernst J & Kellis M Chromatin-state discovery and genome annotation with ChromHMM. Nat Protoc 12, 2478–2492 (2017). [DOI] [PMC free article] [PubMed] [Google Scholar]
- 46.Cheneby J, Gheorghe M, Artufel M, Mathelier A & Ballester B ReMap 2018: an updated atlas of regulatory regions from an integrative analysis of DNA-binding ChIP-seq experiments. Nucleic Acids Res 46. D267–D275 (2018). [DOI] [PMC free article] [PubMed] [Google Scholar]
- 47.Griffon A, et al. Integrative analysis of public ChIP-seq experiments reveals a complex multi-cell regulatory landscape. Nucleic Acids Res 43, e27 (2015). [DOI] [PMC free article] [PubMed] [Google Scholar]
- 48.Fernandez AF, et al. H3K4me1 marks DNA regions hypomethylated during aging in human stem and differentiated cells. Genome Res 25, 27–40 (2015). [DOI] [PMC free article] [PubMed] [Google Scholar]
- 49.Gasparoni G, et al. DNA methylation analysis on purified neurons and glia dissects age and Alzheimer’s disease-specific changes in the human cortex. Epigenetics Chromatin 11, 41 (2018). [DOI] [PMC free article] [PubMed] [Google Scholar]
- 50.Gross AM, et al. Methylome-wide Analysis of Chronic HIV Infection Reveals Five-Year Increase in Biological Age and Epigenetic Targeting of HLA. Mol Cell 62, 157–168 (2016). [DOI] [PMC free article] [PubMed] [Google Scholar]
- 51.Wan M, et al. Identification of Smoking-Associated Differentially Methylated Regions Using Reduced Representation Bisulfite Sequencing and Cell type-Specific Enhancer Activation and Gene Expression. Environ Health Perspect 126, 047015 (2018). [DOI] [PMC free article] [PubMed] [Google Scholar]
- 52.Day SE, et al. Next-generation sequencing methylation profiling of subjects with obesity identifies novel gene changes. Clin Epigenetics 8, 77 (2016). [DOI] [PMC free article] [PubMed] [Google Scholar]
- 53.Marquez EJ, et al. Sexual-dimorphism in human immune system aging. Nat Commun 11, 751 (2020). [DOI] [PMC free article] [PubMed] [Google Scholar]
- 54.Vire E, et al. The Polycomb group protein EZH2 directly controls DNA methylation. Nature 439, 871–874 (2006). [DOI] [PubMed] [Google Scholar]
- 55.Mozhui K & Pandey AK Conserved effect of aging on DNA methylation and association with EZH2 polycomb protein in mice and humans. Mech Ageing Dev 162, 27–37 (2017). [DOI] [PMC free article] [PubMed] [Google Scholar]
- 56.Zhao MT, et al. Cell Type-Specific Chromatin Signatures Underline Regulatory DNA Elements in Human Induced Pluripotent Stem Cells and Somatic Cells. Circ Res 121, 1237–1250 (2017). [DOI] [PMC free article] [PubMed] [Google Scholar]
- 57.Baker DJ, et al. Opposing roles for p16Ink4a and p19Arf in senescence and ageing caused by BubR1 insufficiency. Nat Cell Biol 10, 825–836 (2008). [DOI] [PMC free article] [PubMed] [Google Scholar]
- 58.Gold L, et al. Aptamer-based multiplexed proteomic technology for biomarker discovery. PLoS One 5, e15004 (2010). [DOI] [PMC free article] [PubMed] [Google Scholar]
- 59.Ritchie ME, et al. limma powers differential expression analyses for RNA-sequencing and microarray studies. Nucleic Acids Res 43, e47 (2015). [DOI] [PMC free article] [PubMed] [Google Scholar]
- 60.Yang J, et al. Synchronized age-related gene expression changes across multiple tissues in human and the link to complex diseases. Sci Rep 5, 15145 (2015). [DOI] [PMC free article] [PubMed] [Google Scholar]
- 61.Sergushichev AA An algorithm for fast preranked gene set enrichment analysis using cumulative statistic calculation. (2016). [Google Scholar]
- 62.Jha AK, et al. Network integration of parallel metabolic and transcriptional data reveals metabolic modules that regulate macrophage polarization. Immunity 42, 419–430 (2015). [DOI] [PubMed] [Google Scholar]
- 63.Derr A, et al. End Sequence Analysis Toolkit (ESAT) expands the extractable information from single-cell RNA-seq data. Genome Res 26, 1397–1410 (2016). [DOI] [PMC free article] [PubMed] [Google Scholar]
- 64.Storey JD & Tibshirani R Statistical significance for genomewide studies. Proc Natl Acad Sci U S A 100, 9440–9445 (2003). [DOI] [PMC free article] [PubMed] [Google Scholar]
- 65.Karolchik D, et al. The UCSC Table Browser data retrieval tool. Nucleic Acids Res 32, D493–496 (2004). [DOI] [PMC free article] [PubMed] [Google Scholar]
- 66.Legrand C, et al. Statistically robust methylation calling for whole-transcriptome bisulfite sequencing reveals distinct methylation patterns for mouse RNAs. Genome Res 27, 1589–1596 (2017). [DOI] [PMC free article] [PubMed] [Google Scholar]
- 67.Yu G, Wang LG & He QY ChIPseeker: an R/Bioconductor package for ChIP peak annotation, comparison and visualization. Bioinformatics 31, 2382–2383 (2015). [DOI] [PubMed] [Google Scholar]
- 68.Quinlan AR & Hall IM BEDTools: a flexible suite of utilities for comparing genomic features. Bioinformatics 26, 841–842 (2010). [DOI] [PMC free article] [PubMed] [Google Scholar]
- 69.Quinlan AR BEDTools: The Swiss-Army Tool for Genome Feature Analysis. Curr Protoc Bioinformatics 47, 11 12, 11–34 (2014). [DOI] [PMC free article] [PubMed] [Google Scholar]
- 70.Thorvaldsdottir H, Robinson JT & Mesirov JP Integrative Genomics Viewer (IGV): high-performance genomics data visualization and exploration. Brief Bioinform 14, 178–192 (2013). [DOI] [PMC free article] [PubMed] [Google Scholar]
- 71.Robinson JT, et al. Integrative genomics viewer. Nat Biotechnol 29, 24–26 (2011). [DOI] [PMC free article] [PubMed] [Google Scholar]
- 72.Du P, Kibbe WA & Lin SM lumi: a pipeline for processing Illumina microarray. Bioinformatics 24, 1547–1548 (2008). [DOI] [PubMed] [Google Scholar]
- 73.Consortium EP An integrated encyclopedia of DNA elements in the human genome. Nature 489, 57–74 (2012). [DOI] [PMC free article] [PubMed] [Google Scholar]
- 74.Steinhauser S, Kurzawa N, Eils R & Herrmann C A comprehensive comparison of tools for differential ChIP-seq analysis. Brief Bioinform 17, 953–966 (2016). [DOI] [PMC free article] [PubMed] [Google Scholar]
- 75.Nicodemus-Johnson J, et al. DNA methylation in lung cells is associated with asthma endotypes and genetic risk. JCI Insight 1, e90151 (2016). [DOI] [PMC free article] [PubMed] [Google Scholar]
- 76.Lunnon K, et al. Methylomic profiling implicates cortical deregulation of ANK1 in Alzheimer’s disease. Nat Neurosci 17, 1164–1170 (2014). [DOI] [PMC free article] [PubMed] [Google Scholar]
- 77.Perez-Riverol Y, et al. The PRIDE database and related tools and resources in 2019: improving support for quantification data. Nucleic Acids Res 47, D442–D450 (2019). [DOI] [PMC free article] [PubMed] [Google Scholar]
Associated Data
This section collects any data citations, data availability statements, or supplementary materials included in this article.
Supplementary Materials
Basic donor information and blood differential (cell counts, Hb and HCT levels)
Cytokine bioplex assay data for all donors (IFN-γ, IL-10, IL-12p70, IL-13, IL-1β, IL-2, IL-4, IL-6, IL-8, TNF-α).
(A) Scaled intensities of the metabolites in the plasma for all donors (734 metabolites). (B) Differential analysis results. Significant differences in metabolites between cohorts were determined using two-sided Mann-Whitney U test. P-values were adjusted for multiple testing using the Benjamini-Hochberg method.
ELISA validation of the most differentially present plasma proteins (sCD86, GDF-15, SOST, OMD, Notch 1).
SomaScan proteomics array data for all donors: (A) scaled data, (B) differential comparison statistics. For differential analysis, functions lmFit and eBayes from the Limma package were used (two-sided). P-values were adjusted for multiple testing using the Benjamini-Hochberg method.
Monocyte RNA-seq data. DESeq2 differential analysis results between old and young cohorts (two-sided Wald test, correction for multiple testing using Benjamini-Hochberg method).
Transcriptomic data for MESA cohort. Limma differential analysis results (gene ~ age + chip + race-gender-site design, two-sided test, correction for multiple testing using the Benjamini-Hochberg method).
Counts for monocyte RNA-seq data. (A) Raw counts, (B) DESeq2 normalized counts, (C) Log2-quantile normalized counts.
Monocyte proteomics data generated and analyzed by Biognosys. (A) Sample table, (B) Spectral library protein inventory, (C) Spectral library peptide inventory, (D) Differential analysis results, (E) Protein intensities, (F) Peptide intensities. In brief, for each protein the fold change of each peptide ion variant was estimated as average abundance of peptide ion variant across biological replicates in old group / average abundance of peptide ion variant across biological replicates in young group. The values then were log-transformed and fold changes of all peptides belonging to the same proteins were compared to zero using two-sided paired t-test. Multiple testing correction was performed as described in Storey et al.63
RNA-seq data for monocyte differentiation and stimulation experiment (see Extended Data 4D). (A) Raw counts, (B) DESeq2 normalized counts, (C) Log2-quantile normalized counts.
Basic QC metrics of RRBS libraries (N covered (>= 10 reads) CpG, mean CpG coverage, % mapped reads, conversion rate, library depth).
Differentially methylated regions as obtained from RRBS data: (A) unfiltered DMRs, (B) Confident DMRs filtered based on ncyto ≥ 3 and abs(avdiff) ≥ 0.025.
Basic characteristics and QC of the ULI-ChipSeq libraries: (A) FastqC output, (B) QC of bam files based on ENCODE standards, (C) alignment statistics, (D) QC results reported by phantompeaks.
Transcription factors binding sites overrepresentation analysis: (A) Results for up DMRs corrected for enrichment in CpG islands, (B) Results for down DMRs corrected for enrichment in H3K4me1 marked regions. Please see Methods section for ther details of one-sided enrichment procedure. Correction for multiple testing was done using the Benjamini-Hochberg method.
Data Availability Statement
Raw human sequencing data (Figures 2, 3, and 4) are deposited to Synapse repository (https://www.synapse.org/#!Synapse:syn22020090/wiki/602603) and available for download upon request to the corresponding author. Please provide information about the principle investigator (name, affiliation, email address, and telephone number) and official email from Institutional Signing Official. The mass spectrometry proteomics data for monocyte lysates have been deposited to the ProteomeXchange Consortium via the PRIDE77 partner repository with the dataset identifier PXD021821.
Processed sequencing data, as well as raw and processed metabolic and proteomics data are available at the dedicated online portal at https://artyomovlab.wustl.edu/aging/.
Following publicly available datasets have been used in present study:
GSE56045 MESA transcriptomic dataset – expression table and annotation are provided. (https://www.ncbi.nlm.nih.gov/geo/query/acc.cgi?acc=GSE56045)
GSE56046 MESA DNA methylation dataset – table of M values and annotation are provided. (https://www.ncbi.nlm.nih.gov/geo/query/acc.cgi?acc=GSE56046)
EGAD00001002523 Blueprint dataset – bigwig files with methylation signal were downloaded. Experiment ids are EGAX00001097775, EGAX00001097772, EGAX00001086967, EGAX00001086968, EGAX00001086970, EGAX00001097774.
GSE31263 WGBS dataset – BED files with methylation signal were used. (https://www.ncbi.nlm.nih.gov/geo/query/acc.cgi?acc=GSE31263)
ENCODE ChIP-Seq samples were used: GSM1102782, GSM1102785, GSM1102788, GSM1102793, GSM1102797.
ENCODE ChromHMM annotation ENCSR907LCD was used. (https://www.encodeproject.org/annotations/ENCSR907LCD/)
ReMap 2018 database was downloaded for hg19. (http://pedagogix-tagc.univ-mrs.fr/remap/download/remap2018/hg19/MACS/remap2018_TF_archive_nr_macs2_hg19_v1_2.tar.gz)
For a list of datasets used in Figure 6 and Extended Data 9 please see “Integration with public data” section of Methods.
Neal lab analysis of UK Biobank was downloaded from http://www.nealelab.is/blog/2017/7/19/rapid-gwas-of-thousands-of-phenotypes-for-337000-samples-in-the-uk-biobank