Abstract
Regulatory guidance documents stress the value of assessing the most appropriate endpoints in multiple tissues when evaluating the in vivo genotoxic potential of chemicals. However, conducting several independent studies to evaluate multiple endpoints and/or tissue compartments is resource intensive. Furthermore, when dependent on visual detection, conventional approaches for scoring genotoxicity endpoints can be slow, tedious, and less objective than the ideal. To address these issues with current practices we attempted to (1) devise resource sparing treatment and harvest schedules that are compatible with liver and blood micronucleus endpoints, as well as the Pig-a gene mutation assay, and (2) utilize flow cytometry-based methods to score each of these genotoxicity biomarkers. Proof-of-principle experiments were performed with 4-week-old male and female Crl:CD (SD) rats exposed to aristolochic acids I/II, benzo[a] pyrene, cisplatin, cyclophosphamide, diethylnitrosamine, 1,2-dimethylhydrazine, dimethylnitrosamine, 2,6-dinitrotoluene, hydroxyurea, melphalan, temozolomide, quinoline, or vinblastine. These 13 chemicals were each tested in two treatment regimens: one 3-day exposure cycle, and three 3-day exposure cycles. Each exposure, blood collection, and liver harvest was accomplished during a standard Monday–Friday workweek. Key findings are that even these well-studied, relatively potent genotoxicants were not active in both tissues and all assays (indeed only cisplatin was clearly positive in all three assays); and whereas the sensitivity of the Pig-a assay clearly benefitted from three versus one treatment cycle, micronucleus assays yielded qualitatively similar results across both study designs. Collectively, these results suggest it is possible to significantly reduce animal and other resource requirements while improving assessments of in vivo genotoxicity potential by simultaneously evaluating three endpoints and two important tissue compartments using fit-for-purpose study designs in conjunction with flow cytometric scoring approaches.
Keywords: in vivo, genotoxicity, chromosomal damage, mutation, flow cytometry
INTRODUCTION
Recommendations for in vivo genetic toxicology testing for regulatory safety purposes have increasingly embraced the use of combination studies that provide more than one genetic toxicology endpoint per animal studied as well as integration of DNA damage assay(s) into repeat dose toxicology studies (MacGregor et al. 1990; Pfuhler et al. 2009; Dertinger et al. 2010; Rothfuss et al. 2010; Stankowski Jr et al. 2011; Zeller et al. 2018). Relative to dedicated singleendpoint experiments, multiple-endpoint study designs provide greater efficiencies, lower costs, reduce overall animal requirements, and significantly enhance study interpretability. Combining endpoints allows resulting data to be interpreted in a more holistic manner, as multiple genotoxicity test results from the same animal are considered, ideally alongside pharmacokinetic, hematological, histopathology, and other toxicological data generated in the same study or in the same animal model.
The so-called 3Rs are aimed at replacing, reducing, and refining the use of sentient laboratory models wherever possible (Russell and Burch 1959). Whereas combining and/or integrating genotoxicity endpoints are clearly aligned with 3Rs principles, several factors must be considered when performing such studies. Appropriate tissue(s) must be chosen, taking into consideration information that may be available regarding the chemical’s disposition and biotransformation to reactive metabolite(s), and genotoxicity endpoints need to include the range of lesions that are important to detect. The treatment and tissue-sampling schedule must accommodate differences in expression time and lesion repair or elimination of each DNA damage endpoint. Importantly, overly complex study designs that increase the chance of procedural error or overwhelm the capability of laboratory personnel must be avoided.
These experimental design considerations, together with 3Rs goals, formed the basis of the studies described herein. Thirteen chemicals were tested in young rats using two treatment regimens, one using one cycle of three consecutive days of treatment and the other three consecutive days of treatment that were repeated over three consecutive weeks.
The development and implementation of automated genotoxicity scoring methods have increased throughput capacity and the objectivity by which the rare events are scored and enhanced the statistical power to detect treatment-related effects (Kissling et al. 2007). The studies described herein employed previously established flow cytometric methods for scoring the frequency of rat blood micronucleated reticulocytes (MN-RET) and Pig-a gene mutant phenotype reticulocytes (RETCD59−) and erythrocytes (RBCCD59−) (Dertinger et al. 2004, 2011). The incidence of rat liver micronuclei (MNHEP) was scored using a recently reported flow cytometric method (Avlasevich et al. 2018; Khanal et al. 2018).
Two of the three genotoxicity endpoints studied are based on peripheral blood samples, and were selected because of the pivotal role of the erythrocyte micronucleus assay in regulatory studies and the ready access to samples with minimally invasive procedures. The choice of liver as a second tissue is also based on regulatory agency recommendations related to the exposure and metabolic characteristics of this tissue (ICH 2011). Young rats were employed to take advantage of their elevated rate of hepatocyte proliferation, a requirement for conducting liver micronucleus assessments (Uno et al. 2015). Both male and female rats were studied even though OECD genotoxicity test guidelines for in vivo studies indicate that the use of one sex is sufficient in most circumstances. This aligned the experiments with our funding agency’s (National Institutes of Health) initiative aimed at balancing sex in preclinical research (NIH 2015; Miller et al. 2017).
While these 13 chemicals have previously been shown to produce positive genotoxicity findings in various rodent models, the current work allowed us to investigate the practicality of combining several flow cytometry-based assays into one study, and to systematically assess the influence of study design, tissue compartment, and choice of biological endpoint on the outcomes.
MATERIALS AND METHODS
Reagents, Miscellaneous Supplies
Aristolochic acids I/II (AA) were purchased from Enzo Life Sciences, Farmingdale, NY. Benzo[a]pyrene (B[a]P), cisplatin (cisPt), cyclophosphamide monohydrate (CP), diethylnitrosamine (DEN), 1,2-dimethylhydrazine-2HCl (1,2-DMH), dimethylnitrosamine (DMN), 2,6-dinitrotoluene (2,6-DNT), hydroxyurea (HU), melphalan (MEL), temozolomide (TMZ), quinoline (QUIN), and vinblastine sulfate (VB) were purchased from Sigma-Aldrich, St. Louis, MO. CAS numbers, choice of vehicle, and other information about these test chemicals are provided in Table I. Dimethyl sulfoxide (CAS No. 67–68-5) was also from Sigma-Aldrich. Heat-inactivated fetal bovine serum (FBS; Cat. No. 89510–186) was from VWR, Radnor, PA. Reagents used for flow cytometric MN-RET scoring (Anticoagulant Solution, Buffer Solution, DNA Stain, Anti-CD71-FITC and Anti-CD61-PE Antibodies, RNase Solution, and Malaria Biostandards) were from In Vivo MicroFlow® PLUS-R Kits, Litron Laboratories, Rochester, NY. Reagents used for flow cytometric enumeration of mutant erythrocytes (RBCCD59−) and mutant reticulocytes (RETCD59−) were from Rat MutaFlow® Kits, Litron Laboratories, and included Anticoagulant Solution, Buffer Solution, Nucleic Acid Dye Solution (contains SYTO® 13), Anti-CD59-PE, and Anti-CD61-PE. Reagents used for flow cytometric MNHEP scoring (Liver Preservation Buffer, Buffer Solution, Erythrocyte Clearing Solution, Collagenase Solution, Lysis Solution 1, Lysis Solution 2, Anti-Ki-67-eFluor® 660, DNA Stain (contains SYTOX® Green), and RNase Solution) were from Prototype In Vivo MicroFlow® PLUS RL Kits, Litron Laboratories. Additional supplies included Lympholyte®-Mammal cell separation reagent from CedarLane, Burlington, NC; Anti-PE MicroBeads, LS Columns, and a QuadroMACS™ Separator from Miltenyi Biotec, Bergisch Gladbach, Germany; CountBright™ Absolute Count Beads and FBS from Invitrogen, Carlsbad, CA; Falcon-brand 35 μm cell strainers (Cat. No. 352235) from Corning, Corning, NY; and heparinized capillary tubes from Fisher Scientific, Pittsburg, PA (Cat. No. 22–260-950).
TABLE I.
Test Agents and Associated Information
| Test agent | CAS. No. | Vehicle | Treatment schedule | Dose level (mg/kg/day) | Rationale for top dose level |
|---|---|---|---|---|---|
| Aristolochic acids I/II | 313–67–7 | PBS | 3 days × 1 cycle 3 days × 3 cycles |
0, 5.5, 11, 22 0, 5.5, 11, 22 |
From literature, Bhalli et al. (2013) |
| Benzo[a]pyrene | 50–32-8 | Sesame oil | 3 days × 1 cycle 3 days × 3 cycles |
0, 62.5, 125, 250 0, 62.5, 125, 250 |
From literature, Phonethepswath et al. (2010) |
| Cisplatin | 15663–27-1 | 0.9% Saline | 3 days × 1 cycle 3 days × 3 cycles |
0, 0.5, 1, 2 0, 0.5, 1, 2 |
Preliminary dose range finding study |
| Cyclophosphamide monohydrate | 6055–19–2 | Water | 3 days × 1 cycle 3 days × 3 cycles |
0, 3.75, 7.5, 15 0, 3.75, 7.5, 15 |
From literature, Dertinger et al. (2012) |
| Diethylnitrosamine | 55–18–5 | Water | 3 days × 1 cycle 3 days × 3 cycles |
0, 10, 20, 40 0, 10, 20, 40 |
From literature, Avlasevich et al. (2018) |
| 1,2-Dimethylhydrazine-2HCl | 306–37–6 | Water | 3 days × 1 cycle 3 days × 3 cycles |
0, 7.5, 15, 30 0, 7.5, 15, 30 |
Preliminary dose range finding study |
| Dimethylnitrosamine | 62–75–9 | 0.5% Methyl cellulose | 3 days × 1 cycle 3 days × 3 cycles |
0, 2.5, 5, 10 0, 2.5, 5, 10* |
Preliminary dose range finding study |
| 2,6-Dinitrotoluene | 606–20–2 | Sesame oil | 3 days × 1 cycle 3 days × 3 cycles |
0, 25, 50, 100 0, 25, 50, 100 |
Preliminary dose range finding study |
| Hydroxyurea | 127–07–1 | Water | 3 days × 1 cycle 3 days × 3 cycles |
0, 31.25, 62.5, 125 0, 31.25, 62.5, 125 |
From literature, Dertinger et al. (2012) |
| Melphalan | 148–82–3 | Sesame oil | 3 days × 1 cycle 3 days × 3 cycles |
0, 0.375, 0.75, 1.5 0, 0.75, 1.5, 3 |
From literature, Dertinger et al. (2012) |
| Temozolomide | 85622–93–1 | 0.5% Methyl cellulose | 3 days × 1 cycle 3 days × 3 cycles |
0, 3.75, 7.5, 15 0, 3.75, 7.5, 15 |
Preliminary dose range finding study |
| Quinoline | 91–22–5 | Sesame oil | 3 days × 1 cycle 3 days × 3 cycles |
0, 75, 100, 125 0, 75, 100, 125 |
From literature, Avlasevich et al. (2018) |
| Vinblastine sulfate | 143–67–9 | 0.9% Saline | 3 days × 1 cycle 3 days × 3 cycles |
0, 0.0625, 0.125, 0.25 0, 0.075, 0.125, 0.175 |
Preliminary dose range finding study |
Animals,Treatment/Harvest Schedules
Experiments were conducted with the oversight of the University of Rochester’s Committee for Animal Resources. Male and female Crl:CD (SD) rats were purchased from Charles River Laboratories, Wilmington, MA. Rodents were allowed to acclimate for approximately 1 week. Water and food were available ad libitum throughout the acclimation and experimental periods.
Age at the start of treatment was 4 weeks, n = 3 males and 3 females per treatment group. Four-week-old rats were chosen to match an International Workshops on Genotoxicity Testing (IWGT) recommendation to use rats of this age to ensure sufficient hepatocyte proliferation (Uno et al. 2015). Test chemical dose levels are provided in Table I. Administration was by oral gavage at 10 mL/kg body weight. Exceptions were cisPt and VB, which were administered via intraperitoneal injection at a volume of 5 mL/kg body weight. Each chemical was evaluated in two separate studies that employed one of two treatment/harvest schedules. One design, abbreviated 3 × 1 hereafter, consisted of three consecutive days of exposure at approximately 24 h intervals (i.e., Days 1–3). Approximately 24 h following the last exposure, tail vein blood was collected for a Day 4 MN-RET assay. Four days following the last exposure (i.e., Day 7), rats were exsanguinated and left lateral liver lobes were collected for a MNHEP assay. A fraction of Day 7 blood was used to conduct the Pig-a assay. The second design, abbreviated 3 × 3 hereafter, consisted of three consecutive days of exposure at approximately 24 h intervals, and this treatment cycle was repeated two more times on the following 2 weeks. As with the 3 × 1 design, tail vein blood was collected on Day 4 MN-RET analysis, and 4 days following the last exposure (i.e., Day 21 in this case) rats were exsanguinated and left lateral liver lobes were collected for MNHEP analysis. Terminal day blood samples were used to conduct the Pig-a assay. Figure 1 provides a graphic overview of the 3 × 1 and 3 × 3 experimental designs.
Fig. 1.
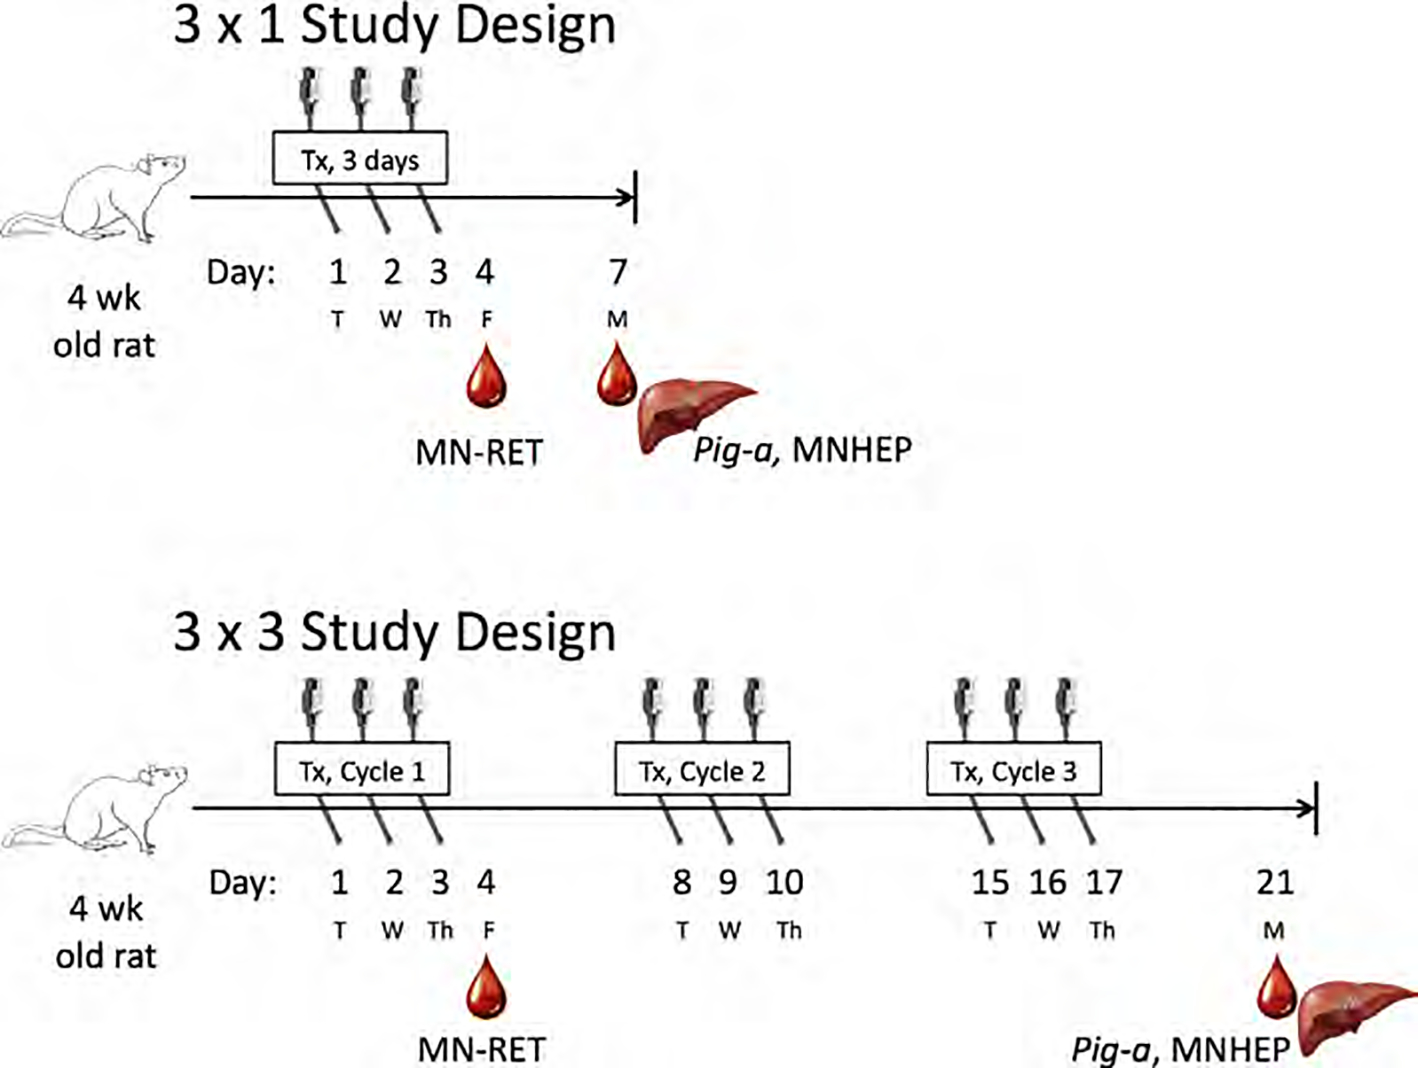
Two experimental designs used to study each of 13 chemicals are outlined above. The upper panel describes the “3 × 1” design. These studies entailed exposing rats to test agent for three consecutive days, obtaining blood samples one day later, and obtaining blood and liver tissue 4 days after cessation of treatment. The lower panel illustrates the “3 × 3” design.” In this case, three days of exposure occurred in each of three consecutive weeks. As with the 3 × 1 studies, blood was collected on Day 4, and blood and liver were also collected 4 days after cessation of treatment on Day 21 of the study.
Blood Harvests
Peripheral blood was collected for the MN-RET assay by nicking a lateral tail vein with a surgical blade after animals were warmed briefly under a heat lamp. Approximately 50–80 μL of free-flowing blood were collected directly into microcentrifuge tubes containing 175 μL MicroFlow PLUS-R kit-supplied Anticoagulant Solution. Samples were maintained at room temperature for less than 3 h until fixation with ultracold methanol as described by Torous et al. (2003). Day 7 and Day 21 blood specimens were collected via heart puncture into MutaFlow PLUS-R kit-supplied Anticoagulant Solution-coated needles and syringes following CO2 anesthesia. Typically, 5–9 mL blood was collected per rat. For Pig-a analyses, 80 μL of each blood sample was transferred to tubes containing 100 μL kit-supplied Anticoagulant Solution where they remained at room temperature for less than 3 h until leukodepletion as described previously (Dertinger et al. 2011, 2012).
Micronucleated Reticulocyte Assay: Sample Preparation, Data Acquisition
MN-RET and CD71-positive reticulocyte (RET) frequencies were determined for each Day 4 sample via flow cytometry according to the In Vivo MicroFlow PLUS-R Kit manual, v170503 (www.litronlabs.com). These procedures have been described in detail (Dertinger et al. 2004). MN-RET frequency measurements were based on the acquisition of approximately 20,000 high CD71-positive RET per blood sample. Instrument set up and calibration were performed using kit-supplied biological standards (Plasmodium berghei-infected blood cells) (Tometsko et al. 1993; Dertinger et al., 2000). A BD FACSCalibur™ flow cytometer running CellQuest™ Pro v5.2 software was used for data acquisition and analysis.
Pig-a Gene Mutation Assay: Sample Preparation, Data Acquisition
RETCD59− and RBCCD59− frequencies were determined for each blood sample via immunomagnetic depletion of wild type erythrocytes and flow cytometric analysis, as described previously (Dertinger et al. 2011, 2012). In addition to reducing analysis times to 4 min per sample, immunomagnetic depletion made it practical to evaluate many times more cells than is otherwise feasible. For example the current studies consistently evaluated >150 × 106 erythrocytes and >5 × 10⁶ RET per sample for the CD59-negative phenotype.
Pig-a sample labeling and washing steps utilized deep-well 96 well plates from Axygen Scientific (Cat. No. P-DW-20-C), which facilitated efficient, parallel processing. Flow cytometric analyses were also conducted using 96 well plates (U-bottom, Corning, Cat. No. 3799) and the BD High Throughput Sampler provided automated, walk-away flow cytometric analysis. These variations are described in the Rat MutaFlow Instruction Manual, v140403 (www.litronlabs.com).
An Instrument Calibration Standard was created with approximately 50% wild type and 50% mutant-mimic erythrocytes, and as described previously, it provided a means to rationally and consistently define the location of CD59-negative cells (Phonethepswath et al. 2010). A BD FACSCanto™ II flow cytometer running BD FACSDiva™ v6.1.2 software was used for data acquisition and analysis.
Micronucleated Hepatocyte Assay: Sample Preparation, Data Acquisition
Rats were anesthetized via CO2 overdose and exsanguinated with a needle and syringe via heart puncture. Livers were immediately excised, wet weights were recorded, and left lateral lobes were transferred to 50 mL tubes that contained ice-cold, kit-supplied Liver Preservation Buffer (includes 10% v/v dimethyl sulfoxide, added same day as use).
Approximately 1 g of each left lateral lobe was processed for flow cytometric analysis according to procedures described previously (Avlasevich et al. 2018). Briefly, following collagenase treatment and centrifugation/washing steps, cells were passed through a 35 μm cell strainer and stored overnight in a 4°C refrigerator. On the day of flow cytometric analysis, cells were washed again via centrifugation until the supernatants were clear by visual inspection (typically three times). At this point 100 μL aliquots were resuspended with 400 μL kit-provided Lysis Solution 1 followed by 400 μL Lysis Solution 2. Samples were analyzed with a FACSCanto™ II flow cytometer equipped with 488 and 633 nM excitation (BD Biosciences, San Jose, CA).
Data Analysis
The incidence of MNHEP, Ki-67-positive nuclei, MN-RET, and RET are expressed as frequency percent. Note that the MN-RET assay scores reticulocytes based on the cell surface marker CD71 and are abbreviated RET (CD71 +), while the Pig-a assay identifies RETs based on RNA content and are abbreviated RET (RNA+). The formulas used to calculate the number of RBCCD59− per 106 total RBC and the number of RETCD59− per 106 total RET were based on pre- and post-immunomagnetic column data as described in Dertinger et al. (2012) and the MutaFlow manual (www.litronlabs.com).
The effects Treatment, Sex, and Treatment × Sex interaction may have had on MNHEP, Ki-67-positive nuclei, MN-RET, RET (CD71+), RET (RNA+), RBCCD59−, and RETCD59− frequencies, as well as liver weights relative to concurrent vehicle control rats were evaluated using JMP software’s two-way ANOVA platform (v12.0.1, SAS Institute, Cary, NC). These two-tailed tests were performed at α = 0.05. When ANOVA indicated statistical significance, Dunnett’s pair-wise test was used to identify the responsible group(s) (α = 0.05). Given the rarity of the Pig-a mutant phenotype, and the fact that rats were not pre-screened to eliminate high spontaneous mutation frequency outliers, an additional assessment was applied to groups that achieved statistical significance. Specifically, the number of animals that exceeded the upper bounds RBCCD59− and RETCD59− 95% tolerance intervals based on 756 negative control rats was determined (see Supporting Information 1).
Note that prior to 2-way ANOVA and Dunnett’s tests, several of the endpoints were transformed to meet the tests’ homogeneity of variance assumptions (Levene’s test, α = 0.05, JMP v12.0.1). More specifically, whereas graphs provided herein display %MNHEP and %MN-RET, and the number of RBCCD59− and RETCD59− per 106 cells, these data were log10 transformed for statistical significance testing. For those occasional data sets that included one or more zero RETCD59− readings, a 0.1 offset was added to the number of RETCD59− before log transformation occurred. Prior to statistical analyses liver weights were also transformed, in this case by normalizing them to body weight as follows: g liver weight/kg body weight.
RESULTS
Aristolochic Acids, 3 × 1
One cycle of AA exposure modestly affected mean body weight gains over Days 1 through 4: 23, 23, 21, and 18 g for the 0, 5.5, 11, and 22 mg/kg/day dose groups, respectively. With no deaths or other outward signs of toxicity, AA doses used in this study appeared to be well tolerated.
As shown by Figure 2a, mean RET (CD71+) frequencies were reduced in the high dose group. The effect reached statistical significance for female rats, not males. On the other hand, no effect on the chromosomal damage endpoint MN-RET was observed (Fig. 2b).
Fig. 2.
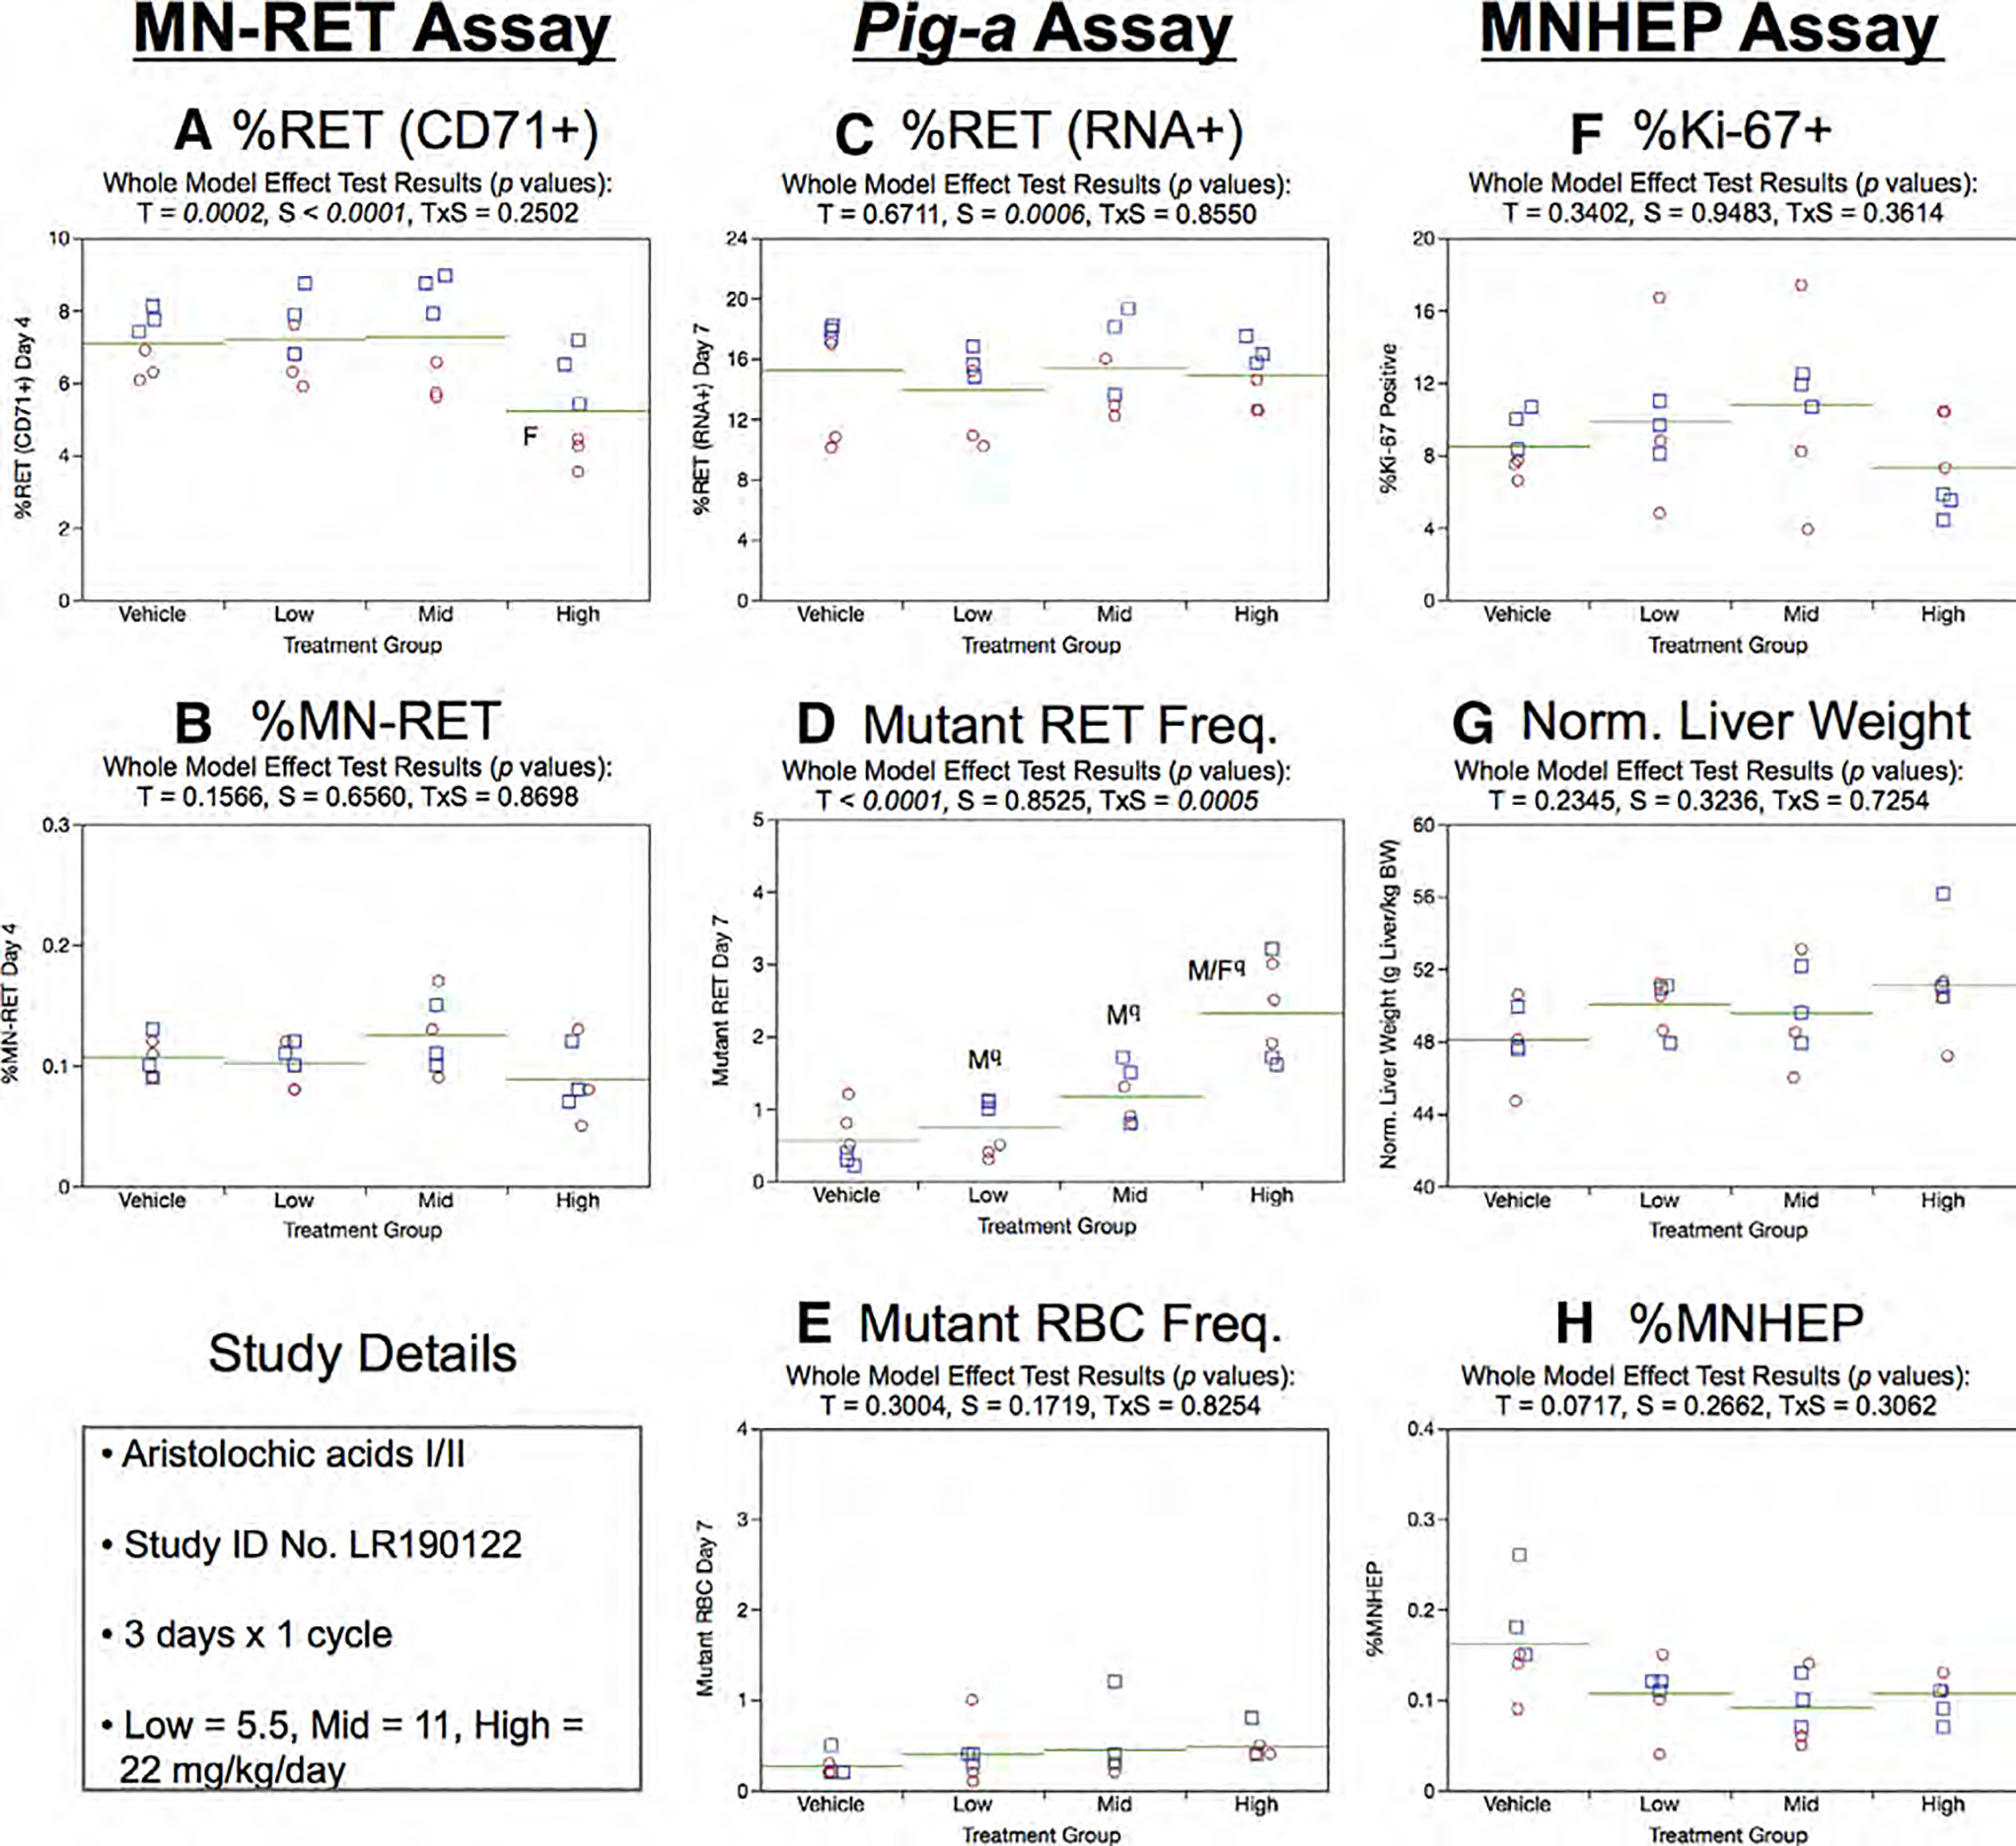
Results from the Aristolochic acids 3 × 1 study. Panels a and b show results for each of the four treatment groups in the micronucleated reticulocyte (MN-RET) assay, where a = percent CD71-positive reticulocytes [%RET (CD71+)] and b = percent MN-RET. Panels c, d, and e show results for each of the four treatment groups in the Pig-a mutation assay, where c = percent RNA-positive reticulocytes [%RET (RNA+)], d = number of mutant reticulocytes (Mutant RET, per 106 RET), and e = number of mutant erythrocytes (Mutant RBC, per 106 RBC). Panels f, g, and h show results for each of the four treatment groups in the MNHEP assay, where f = percent Ki-67-positive hepatocyte nuclei (%Ki-67+), g = Normalized liver weights (g liver/kg body weight), and h = percent micronucleated hepatocytes (%MNHEP). Note that for each panel, a–h above: squares = individual males, circles = individual females, and horizontal lines = group means. Two-way ANOVA p-values are provided at the top of each graph, whenever treatment was significant. Dunnett’s tests were used to identify the exposure group(s) that were significantly different than vehicle controls, with significance denoted by “M” (males) and “F” (females). The use of superscript q in panel d denotes Pig-a statistical significance is qualified because more than half the mutant cell frequencies were within the historical negative control distribution.
Day 7 RET (RNA+) frequencies generated by the Pig-a assay showed no treatment, sex, or treatment × sex interaction effects (Fig. 2c). Mean RETCD59− exhibited dose-related increases that achieved statistical significance in each AA-exposed group of males, and in the high dose group in the case of females (Fig. 2d). However, these results are qualified, because the majority of these RETCD59− frequencies (16/18) did not exceed the historical negative control distribution’s 95% upper bound tolerance interval (2.9 × 10⁻⁶; Supplemental file 1). Mean RBCCD59− values were not significantly affected by AA treatment (Fig. 2e). This was an expected result owing to the lengthier time frame needed to affect the total peripheral blood RBC pool compared to the short-lived RET cohort (Phonethepswath et al. 2010; Gollapudi et al. 2015; Kimoto et al. 2016).
The MNHEP assay was accompanied by two assessments of liver toxicity. Figure 2f shows that mean Ki-67-positive nuclei were not affected by AA exposure. Furthermore, normalized liver weights showed no treatment, sex, or treatment × sex interaction effects (Fig. 2g). Similarly, the chromosomal damage endpoint MNHEP was not responsive to AA exposure (Fig. 2h).
Aristolochic Acids, 3 × 3
Three cycles of AA exposure moderately reduced mean body weight gains over Days 1 through 17: 121, 120, 110, and 95 g for the 0, 5.5, 11, and 22 mg/kg/day dose groups, respectively. As with the 3 × 1 study, these dose levels appeared to be well tolerated in this repeated cycle experimental design.
Mean Day 4 %RET (CD71+) was significantly reduced in high dose female rats (Fig. 3a). Treatment had no effect on %MN-RET (Fig. 3b).
Fig. 3.
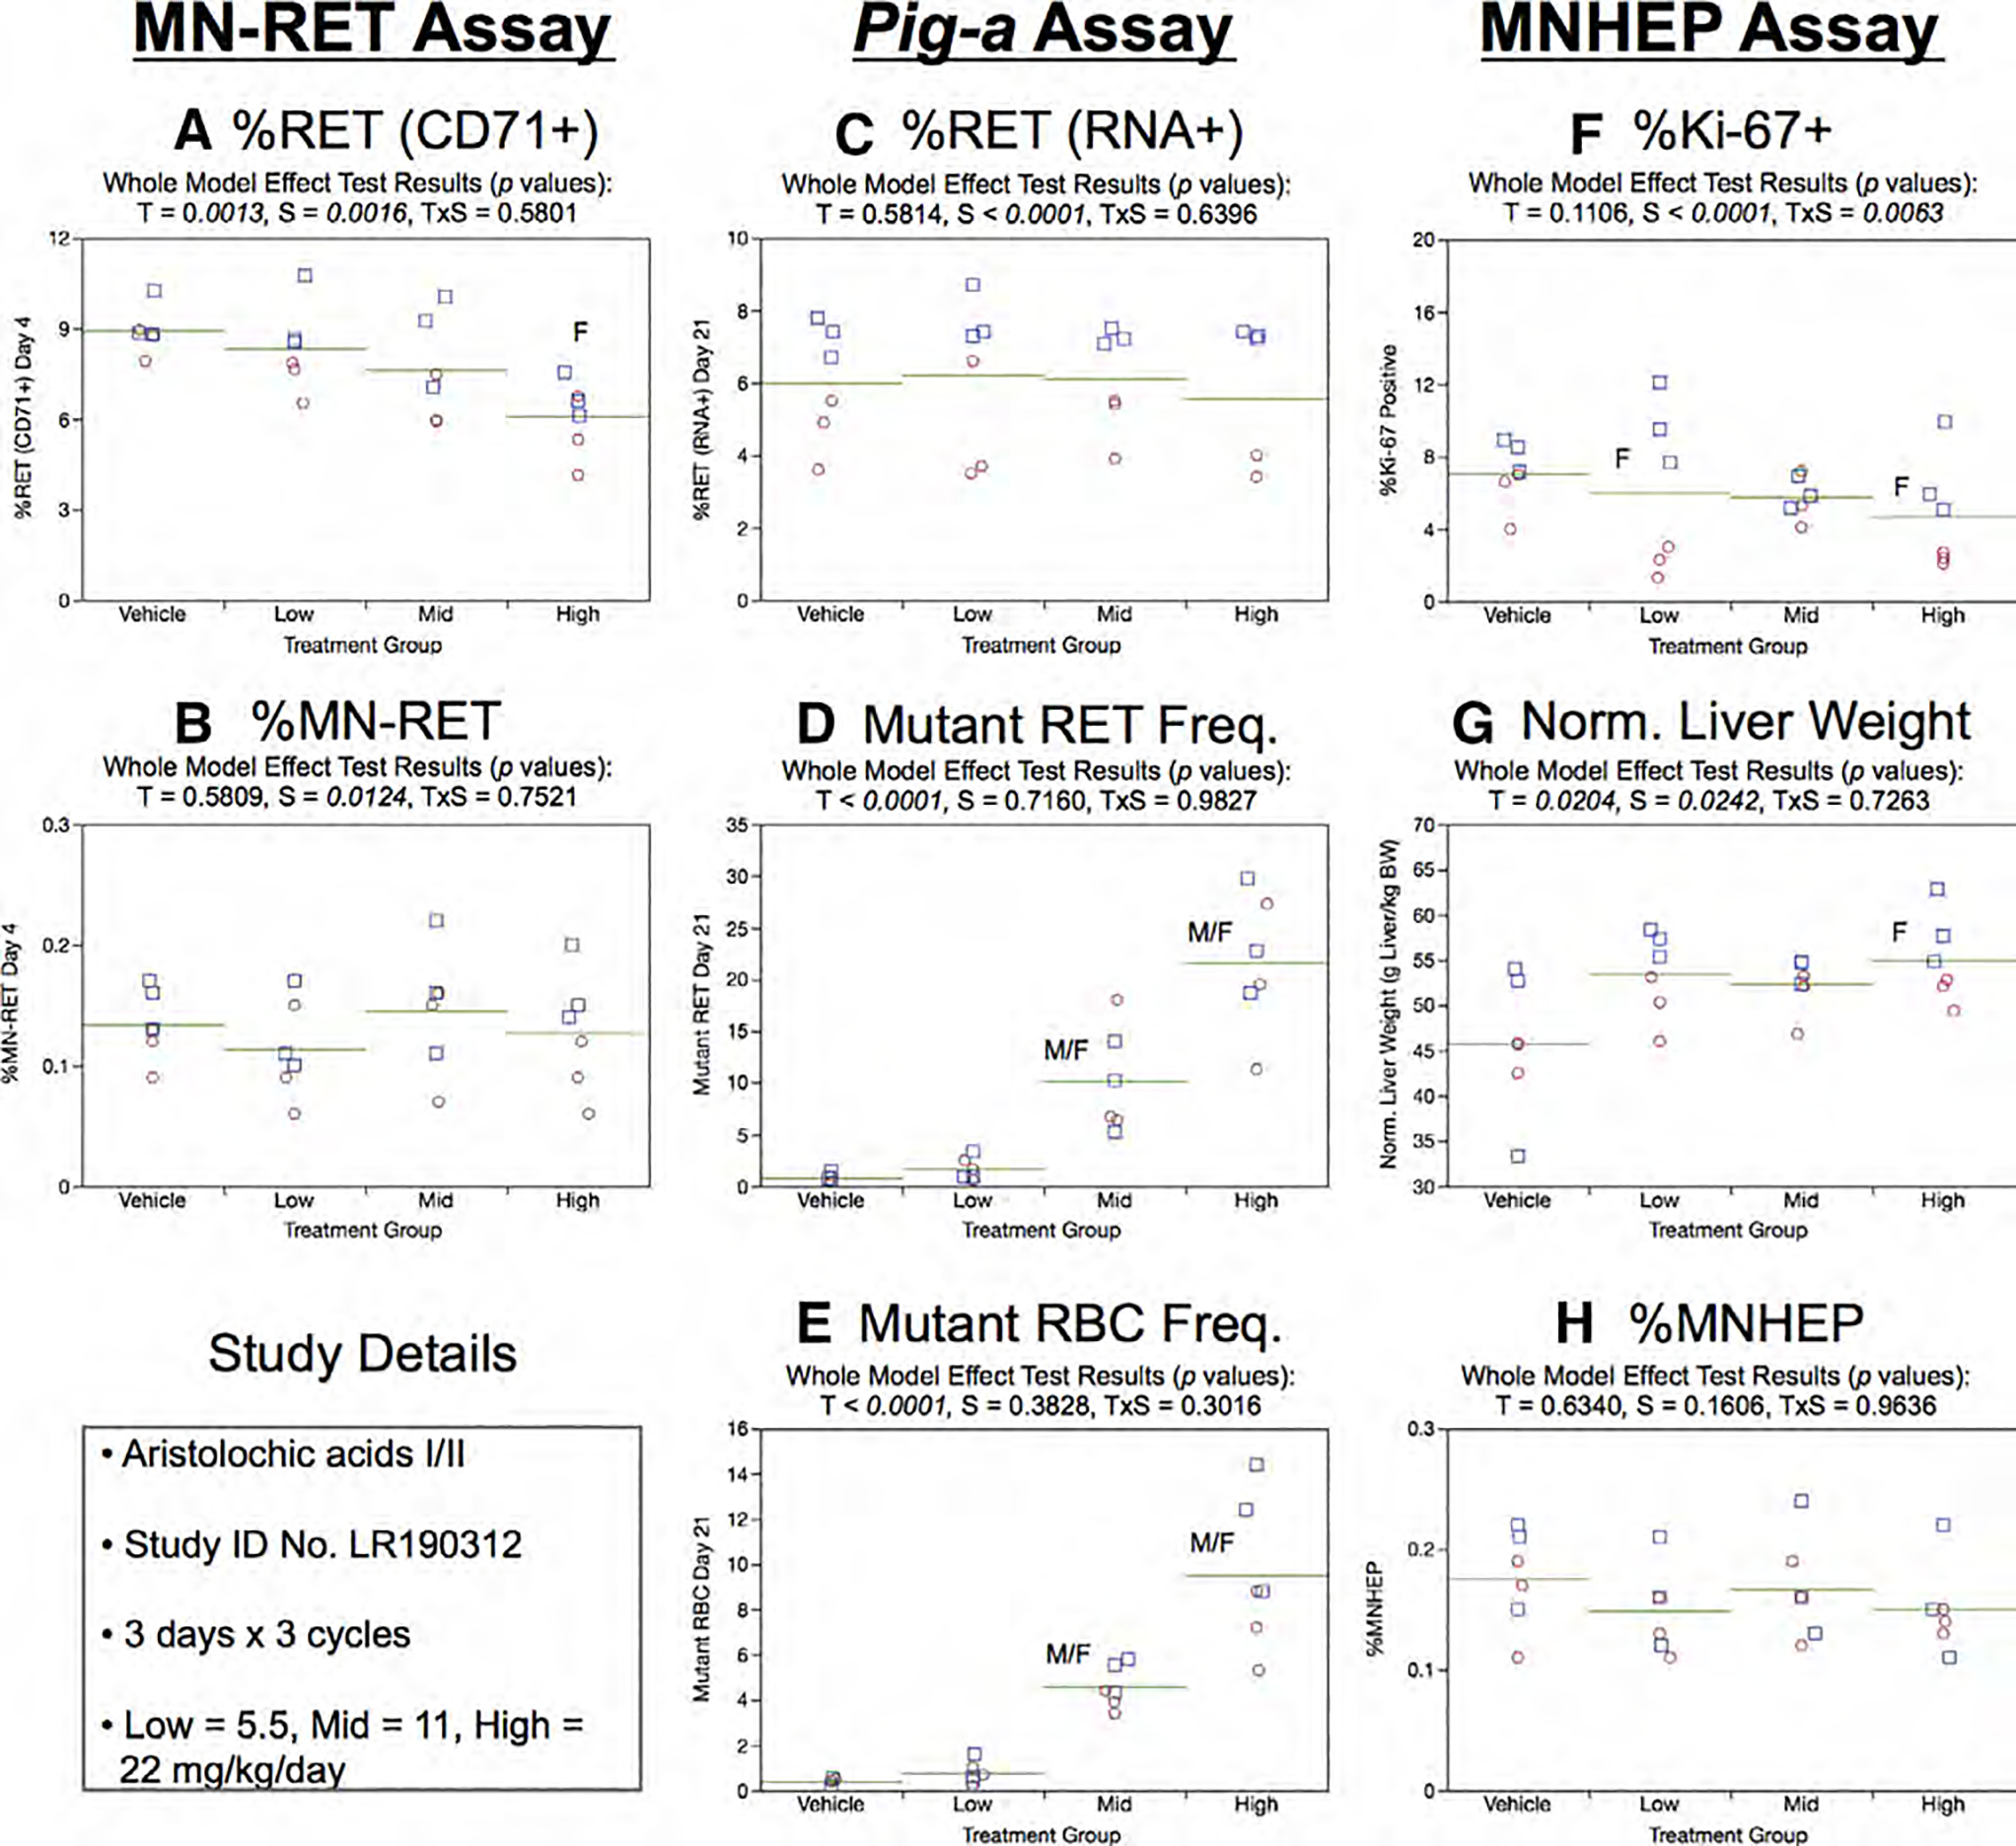
Results from the Aristolochic acids 3 × 3 study are provided. The same abbreviations and graph formats described in Figure 2 legend are used here.
Whereas Day 21 RET (RNA+) frequencies exhibited a sex effect, male rats higher than females, treatment was not a significant factor (Fig. 3c). As shown by Figure 3d, mean RETCD59− frequencies were significantly elevated in the mid and high treatment groups. This dose-related effect was accompanied by increased RBCCD59− (Fig. 3e).
In the liver MN assay, %Ki-67-positive nuclei exhibited slight sex and treatment × sex interaction effects (Fig. 3f), while normalized liver weights showed evidence of significant treatment and sex effects (Fig. 3g). Despite these modest liver effects, there was no evidence of MNHEP induction by three cycles of AA exposure (Fig. 3h).
Benzo[a]Pyrene, 3 × 1
One cycle of B[a]P exposure led to decreased mean body weight gains over Days 1 through 4: 19, 16, 9, and 4 g for the 0, 62.5, 125, and 250 mg/kg/day dose groups, respectively. As there were no deaths or other outward signs of toxicity beyond the reduced body weight gain noted above, the B[a]P doses used in this study appeared to be well tolerated.
As shown by Figure 4a, mean RET (CD71+) frequencies were reduced with increasing B[a]P dose. MN-RET frequencies increased in a dose-dependent manner (Fig. 4b).
Fig. 4.
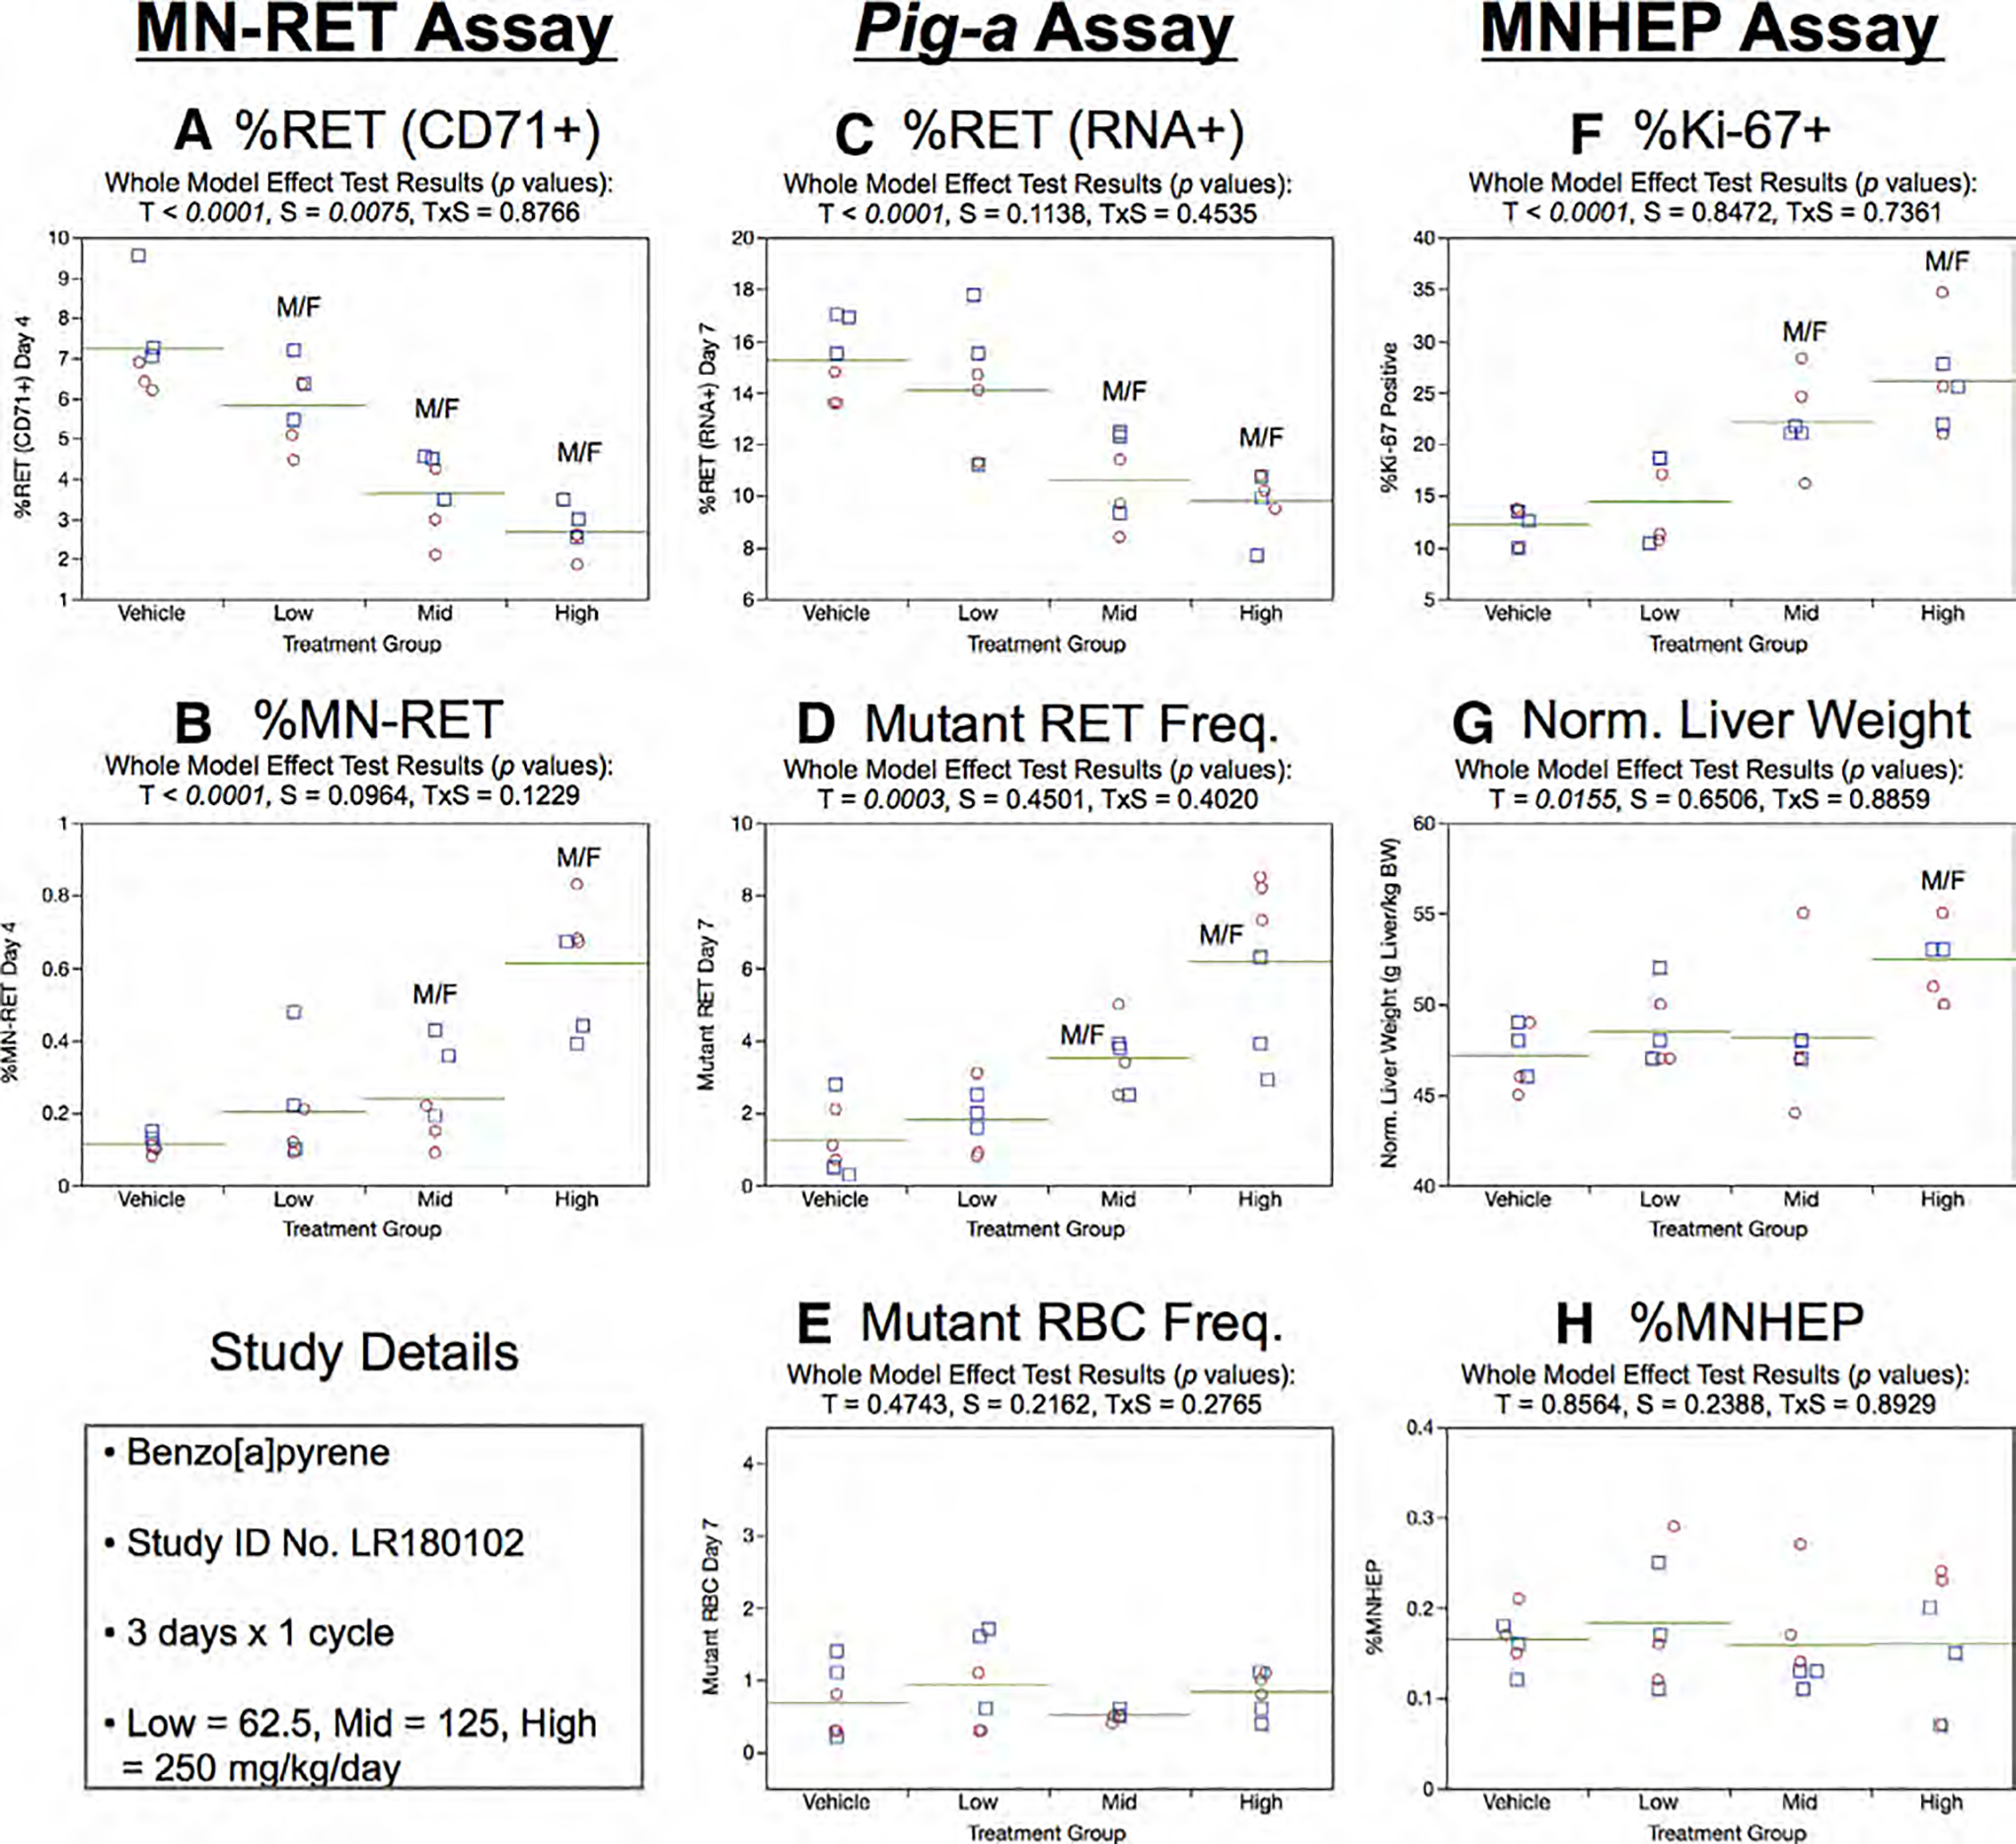
Results from the Benzo[a]pyrene 3 × 1 study. The same abbreviations and graph formats described in Figure 2 legend are used here.
Similar to Day 4% RET (CD71+), Day 7 RET (RNA+) frequencies generated by the Pig-a assay also showed a dose-dependent reduction (Fig. 4c). As shown by Figure 4d, mean RETCD59− frequencies were moderately elevated in the mid and high B[a]P dose groups compared to concurrent controls. Furthermore, the majority of these animals exceeded the historical negative control distribution’s 95% upper bound tolerance interval. Conversely, mean RBCCD59− values were not significantly affected by B[a]P treatment (Fig. 4e).
In the liver MN assay, B[a]P was observed to increase Ki-67-positive nuclei in a dose-dependent manner (Fig. 4f), and the high dose group exhibited elevated normalized liver weights compared to concurrent vehicle controls (Fig. 4g). Despite these liver effects, no statistically significant effects were noted for the MNHEP endpoint (Fig. 4h).
Benzo[a]Pyrene, 3 × 3
Three cycles of B[a]P exposure led to decreased mean body weight gains over Days 1 through 17: 106, 100, 88, and 74 g for the 0, 62.5, 125, and 250 mg/kg/day dose groups, respectively. As with the 3 × 1 study, these dose levels were well tolerated in this repeated cycle experimental design.
Day 4 MN-RET assay results show significant %RET (CD71+) decreases and %MN-RET increases (Fig. 5a,b, respectively). Both of these hematopoietic compartment responses are similar to the results observed in the 3 × 1 study described above.
Fig. 5.
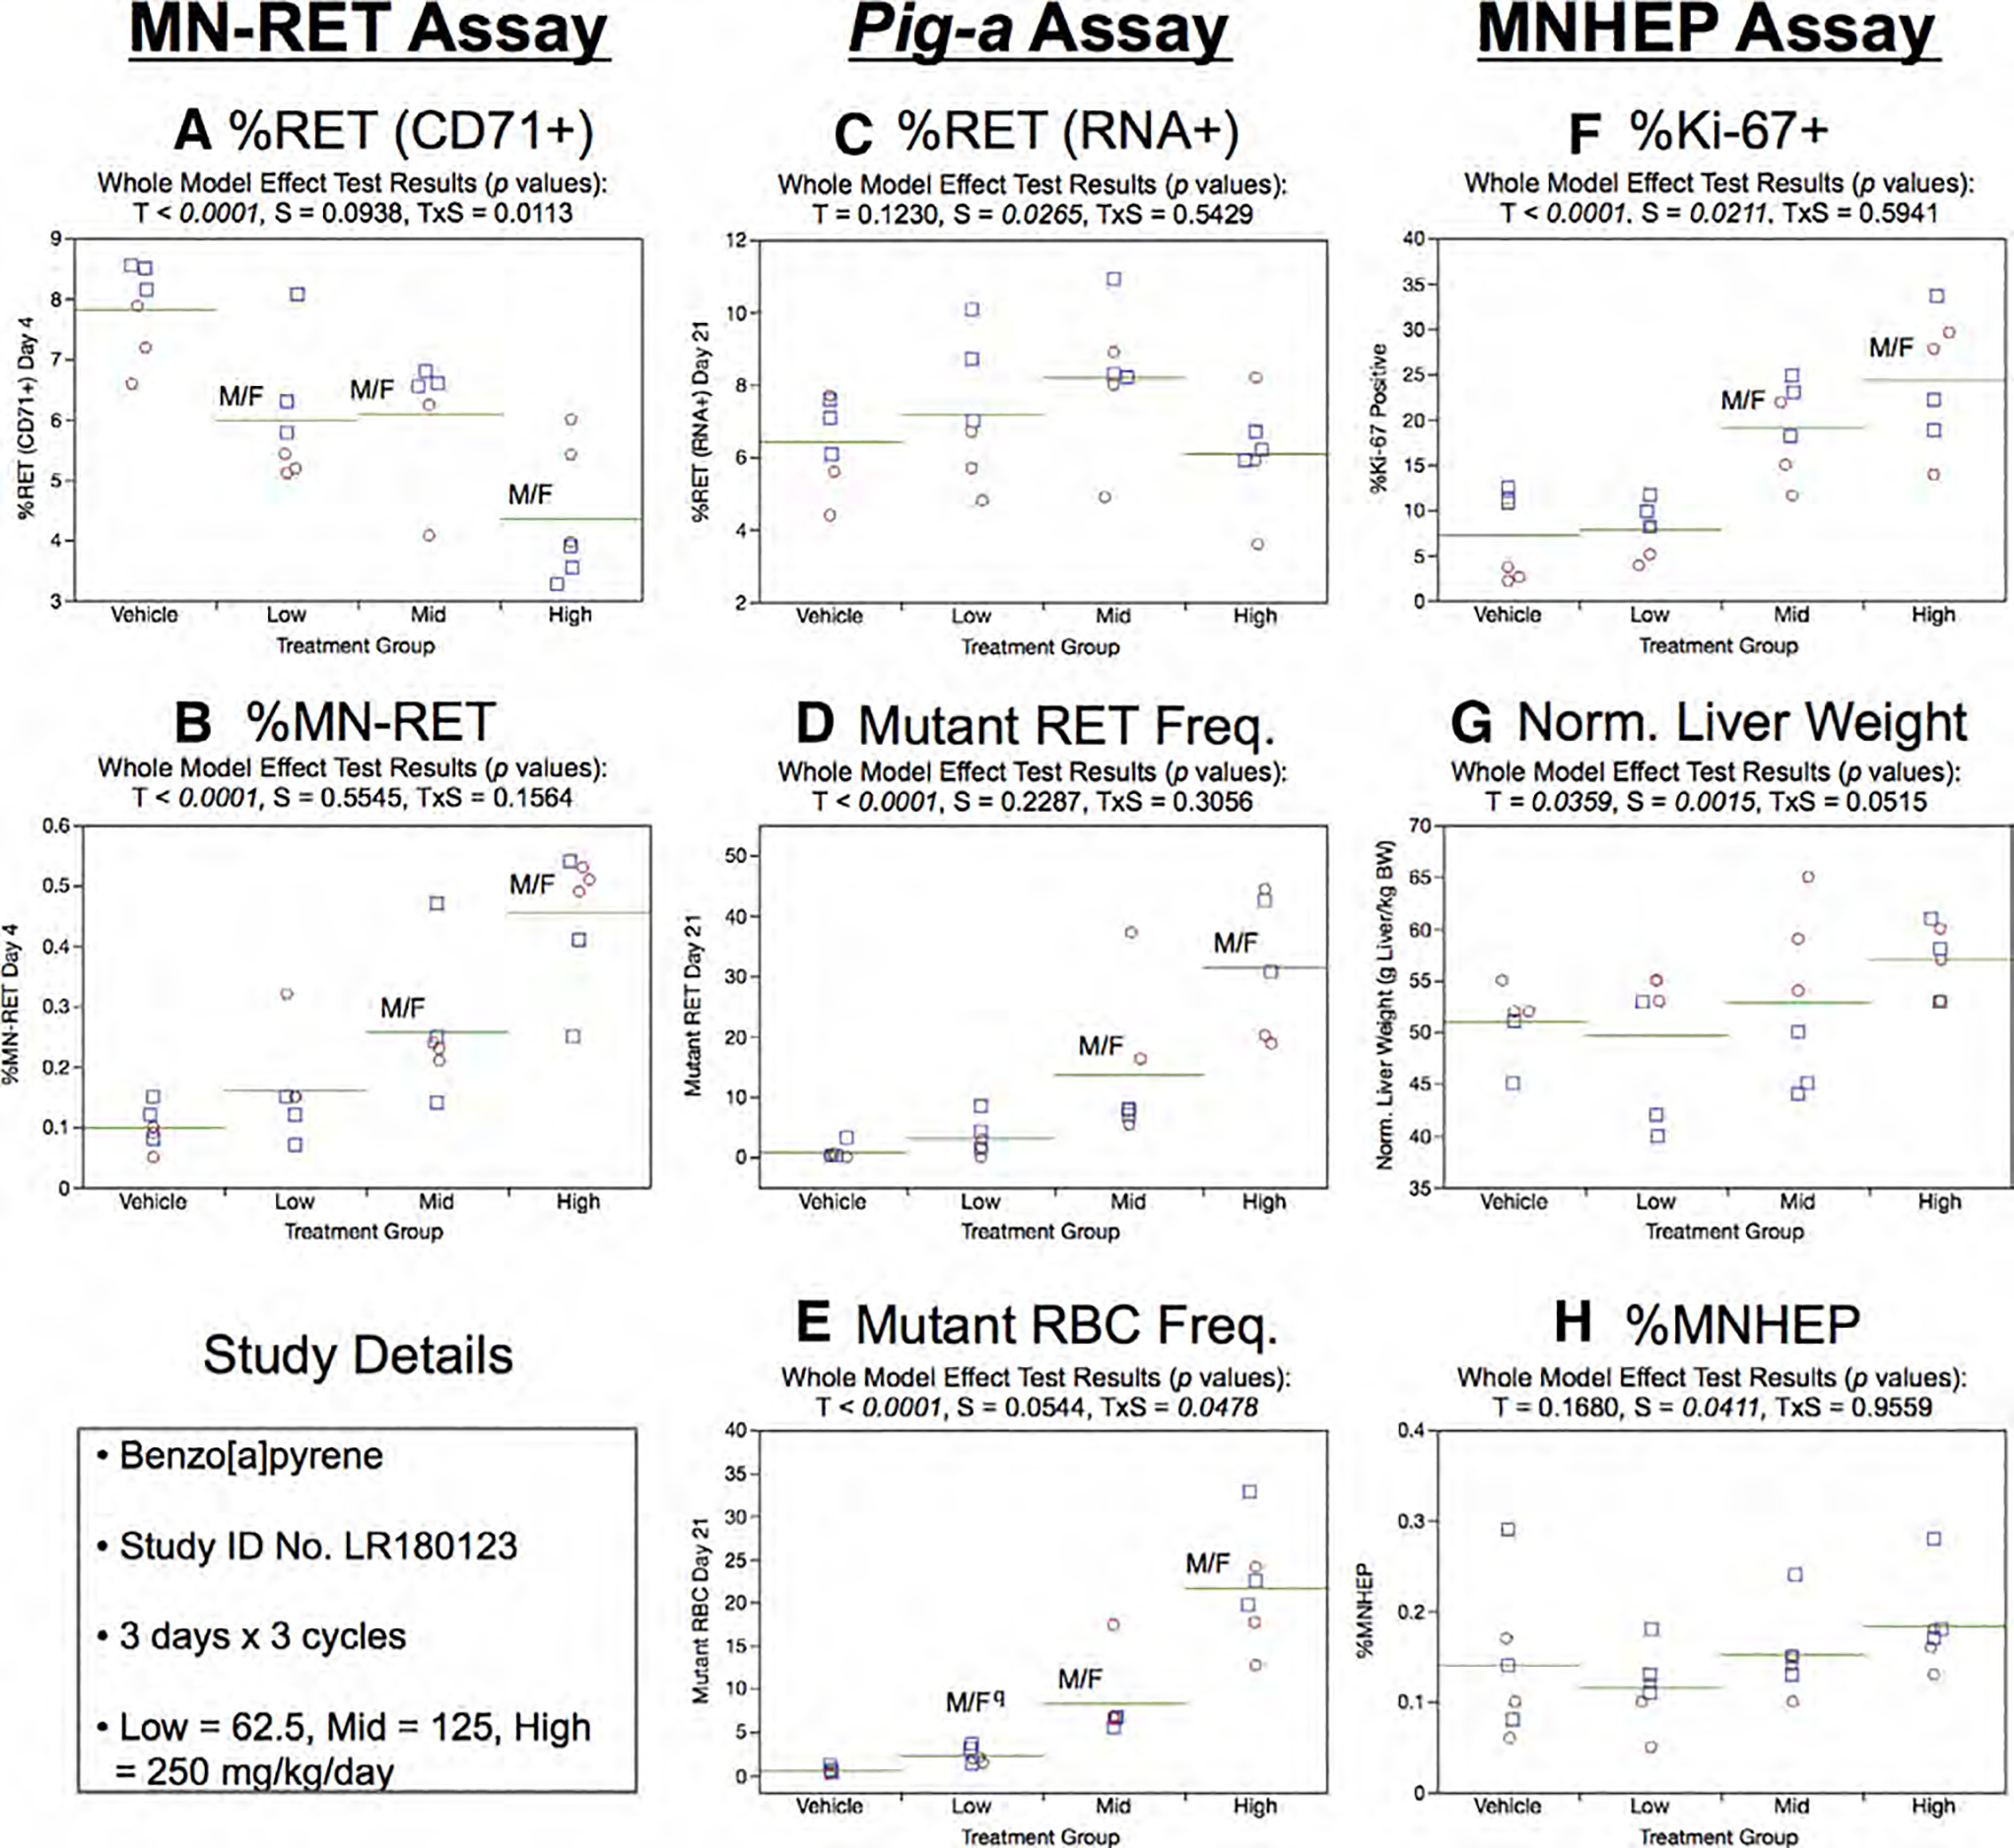
Results from the Benzo[a]pyrene 3 × 3 study. The same abbreviations and graph formats described in Figure 2 legend are used here. The use of superscript q in panel e denotes Pig-a statistical significance is qualified because more than half the mutant cell frequencies were within the historical negative control distribution.
In the Pig-a assay, Day 21 RET (RNA+) frequencies showed no influence of treatment, although a sex-related effect was observed whereby %RET tended to be moderately higher in males compared to females (Fig. 5c). As shown by Figure 5d, mean RETCD59− frequencies were elevated in the mid and high B[a]P dose groups and to a much greater extent than was observed in the 3 × 1 study. The 3 × 3 experimental design’s greater number of treatments and lengthier mutant manifestation time are presumably responsible for the significant dose-dependent increases in RBCCD59− frequencies (Fig. 5e) that were not evident in the 3 × 1 study (Fig. 4e). Note that the statistical significance indicated for the low dose rats are qualified, as more than half of this group’s RBCCD59− frequencies were within the historical negative control distribution’s 95% tolerance interval.
Repeated cycles of B[a]P exposure were observed to increase %Ki-67-positive hepatocyte nuclei in a dose-dependent manner (Fig. 5f), although no change to normalized liver weights was observed (Fig. 5g). %MNHEP show that three cycles of B[a]P exposure was not associated with increased levels of liver cell chromosome breaks (Fig. 5h).
Cisplatin, 3 × 1
One cycle of cisPt exposure led to decreased mean body weight gains over Days 1 through 4: 22, 21, 16, and 15 g for the 0, 0.5, 1, and 2 mg/kg/day dose groups, respectively. As there were no deaths or other outward signs of toxicity, these results suggest cisPt doses used in this study were well tolerated.
As shown by Figure 6a, Day 4 %RET (CD71+) was significantly reduced in the high dose group, and this was accompanied by marked dose-related increases in %MN-RET (Fig. 6b).
Fig. 6.
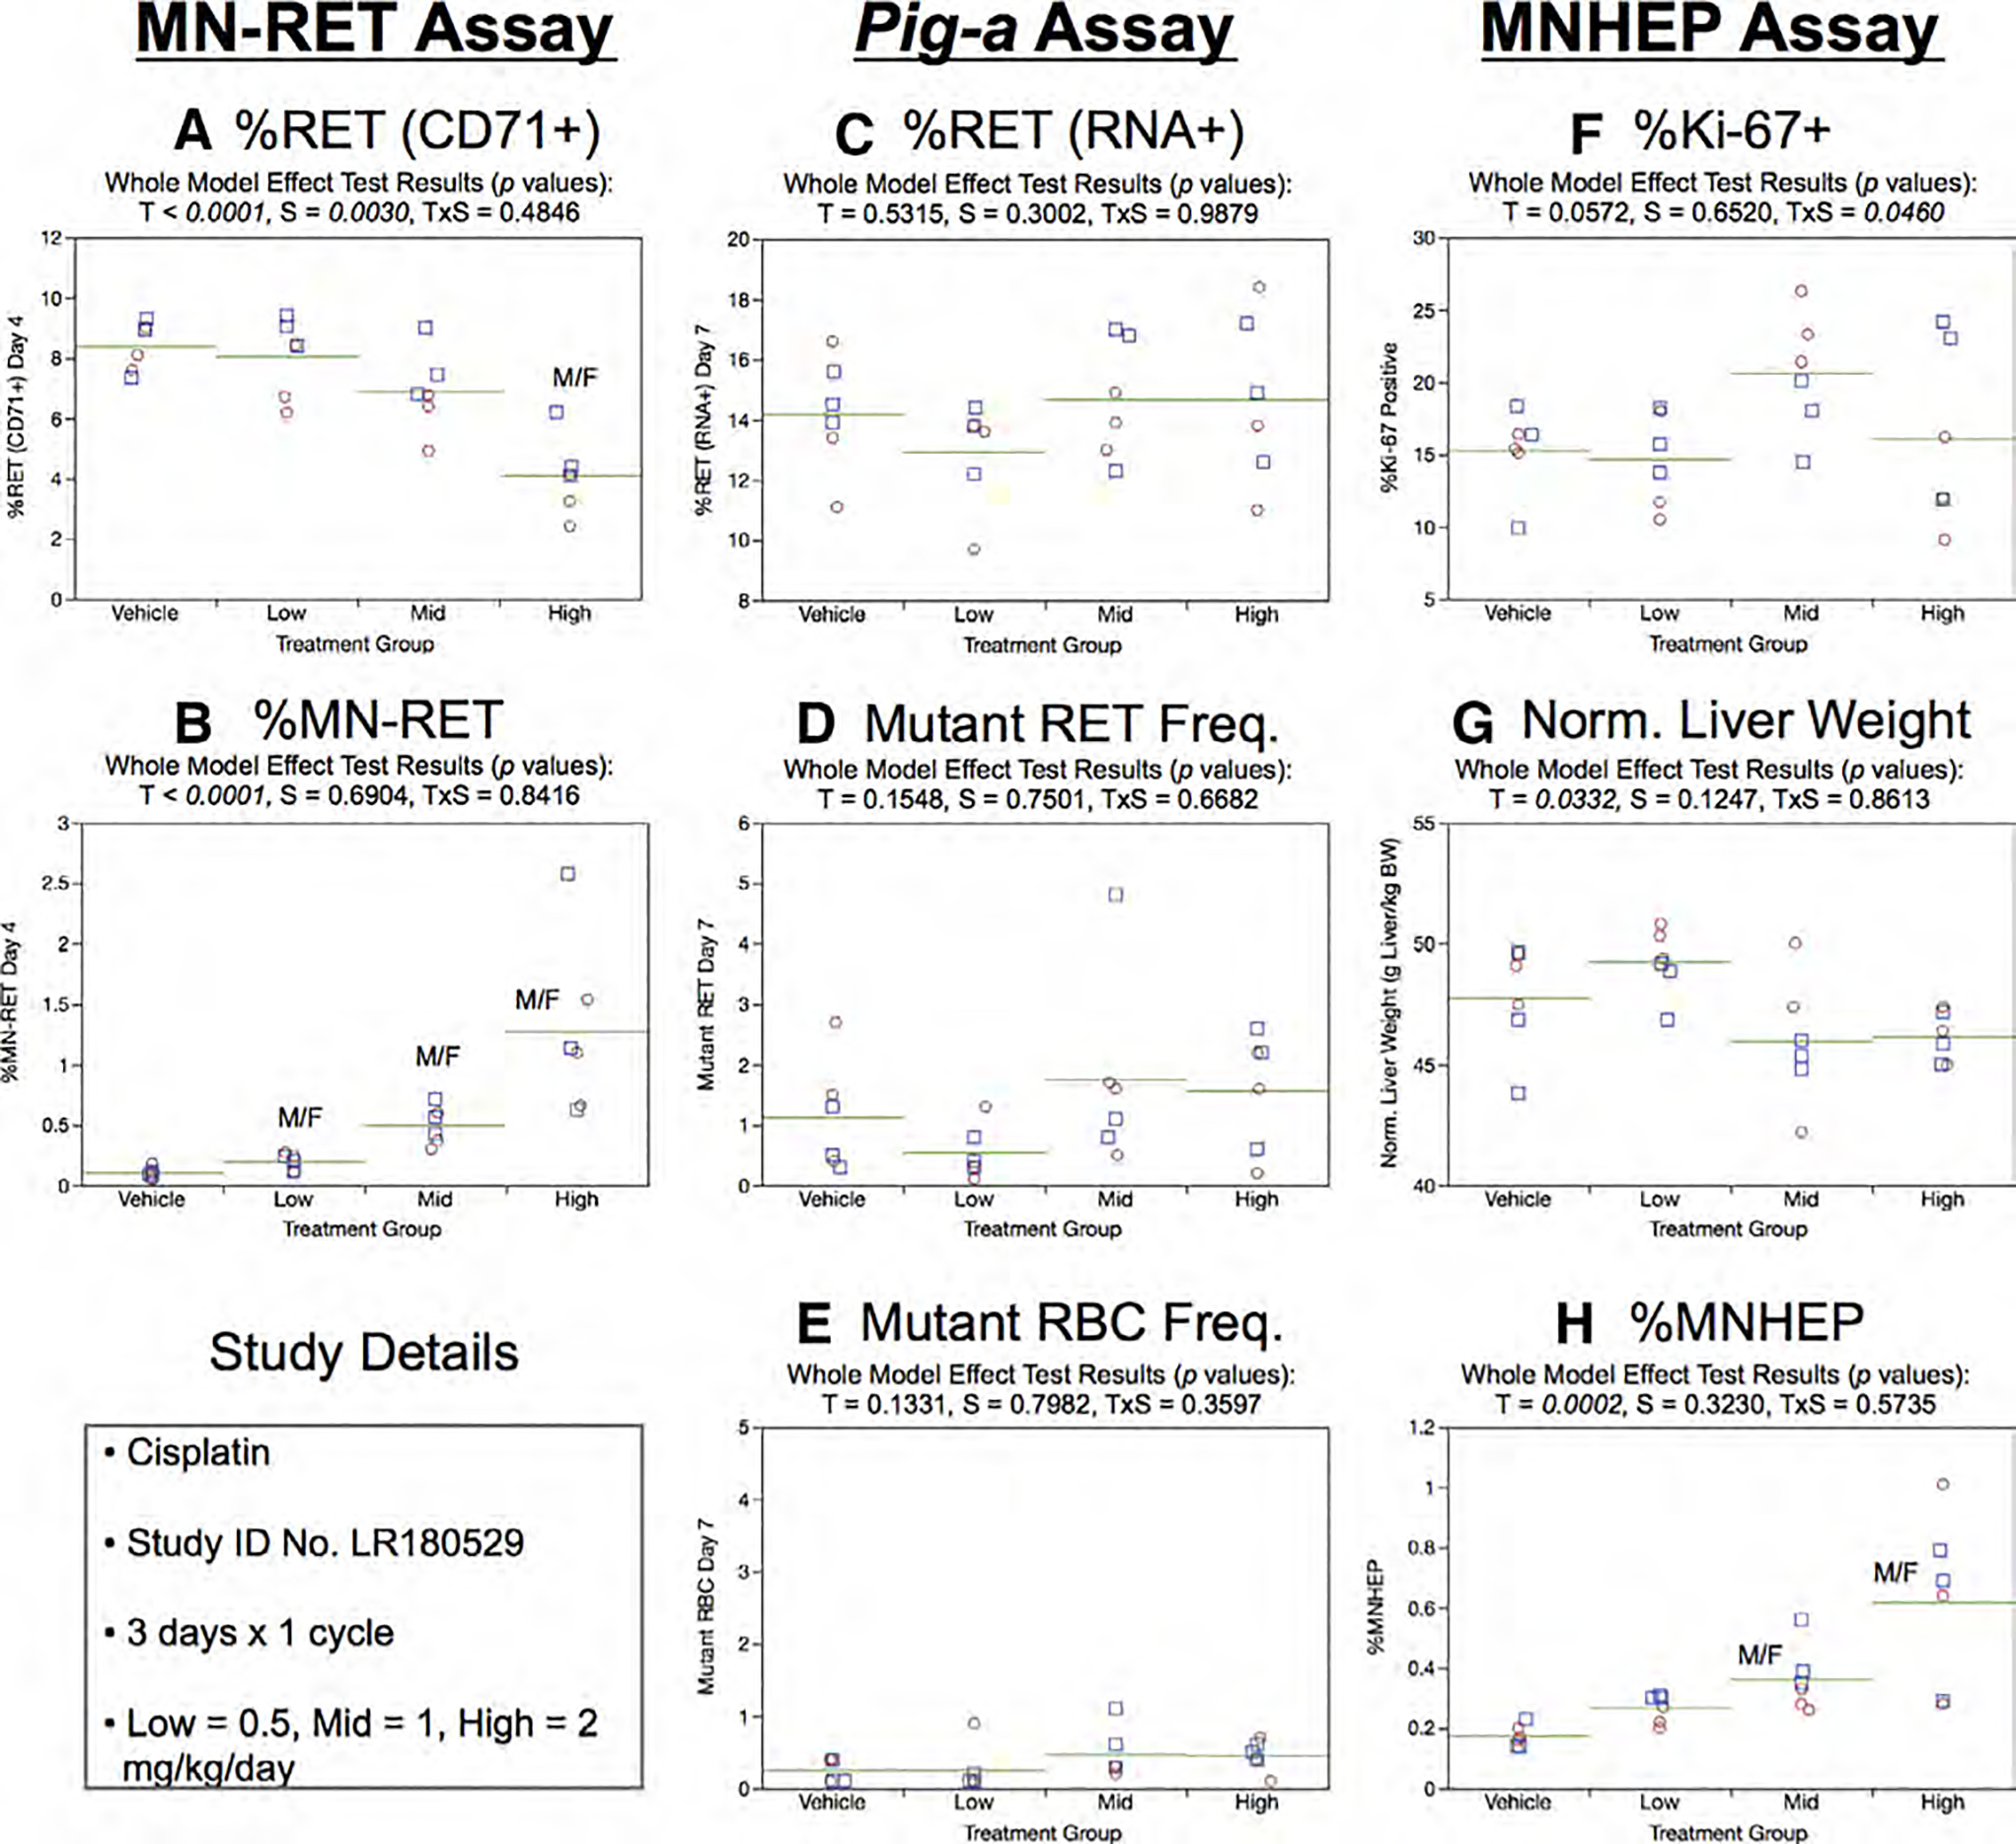
Results from the Cisplatin 3 × 1 study. The same abbreviations and graph formats described in Figure 2 legend are used here.
%RET (RNA+) data generated by the Pig-a assay showed no significant treatment or sex effects (Fig. 6c). Furthermore, the 3 × 1 study design and the associated Day 7 sampling time showed no evidence of treatment-related changes to mutant phenotype RET or RBC frequencies (Fig. 6d,e).
Figure 6f shows the results of flow cytometric Ki-67-positive nuclei assessments. While no significant treatment or sex effects were noted, the modest treatment × sex interaction that was observed appears to be due to somewhat higher %Ki-67 values observed in mid dose females. Normalized liver weights are presented in Figure 6g, and no significant effects were observed. Unlike the subtle/nil effects observed for the liver proliferation endpoints, %MNHEP increased with increasing cisPt dose levels (Fig. 6h).
Cisplatin, 3 × 3
Three cycles of cisPt exposure only slightly affected mean body weight gains over Days 1 through 17: 96, 99, 89, and 84 g for the 0, 0.5, 1, and 2 mg/kg/day dose groups, respectively. As with the 3 × 1 study, these dose levels appeared to be well tolerated in this repeated cycle experimental design.
Although mean Day 4 %RET (CD71+) was modestly reduced in the high dose group, statistical significance was not achieved (Fig. 7a). On the other hand, statistically significant dose-related increases in %MN-RET were observed (Fig. 7b).
Fig. 7.
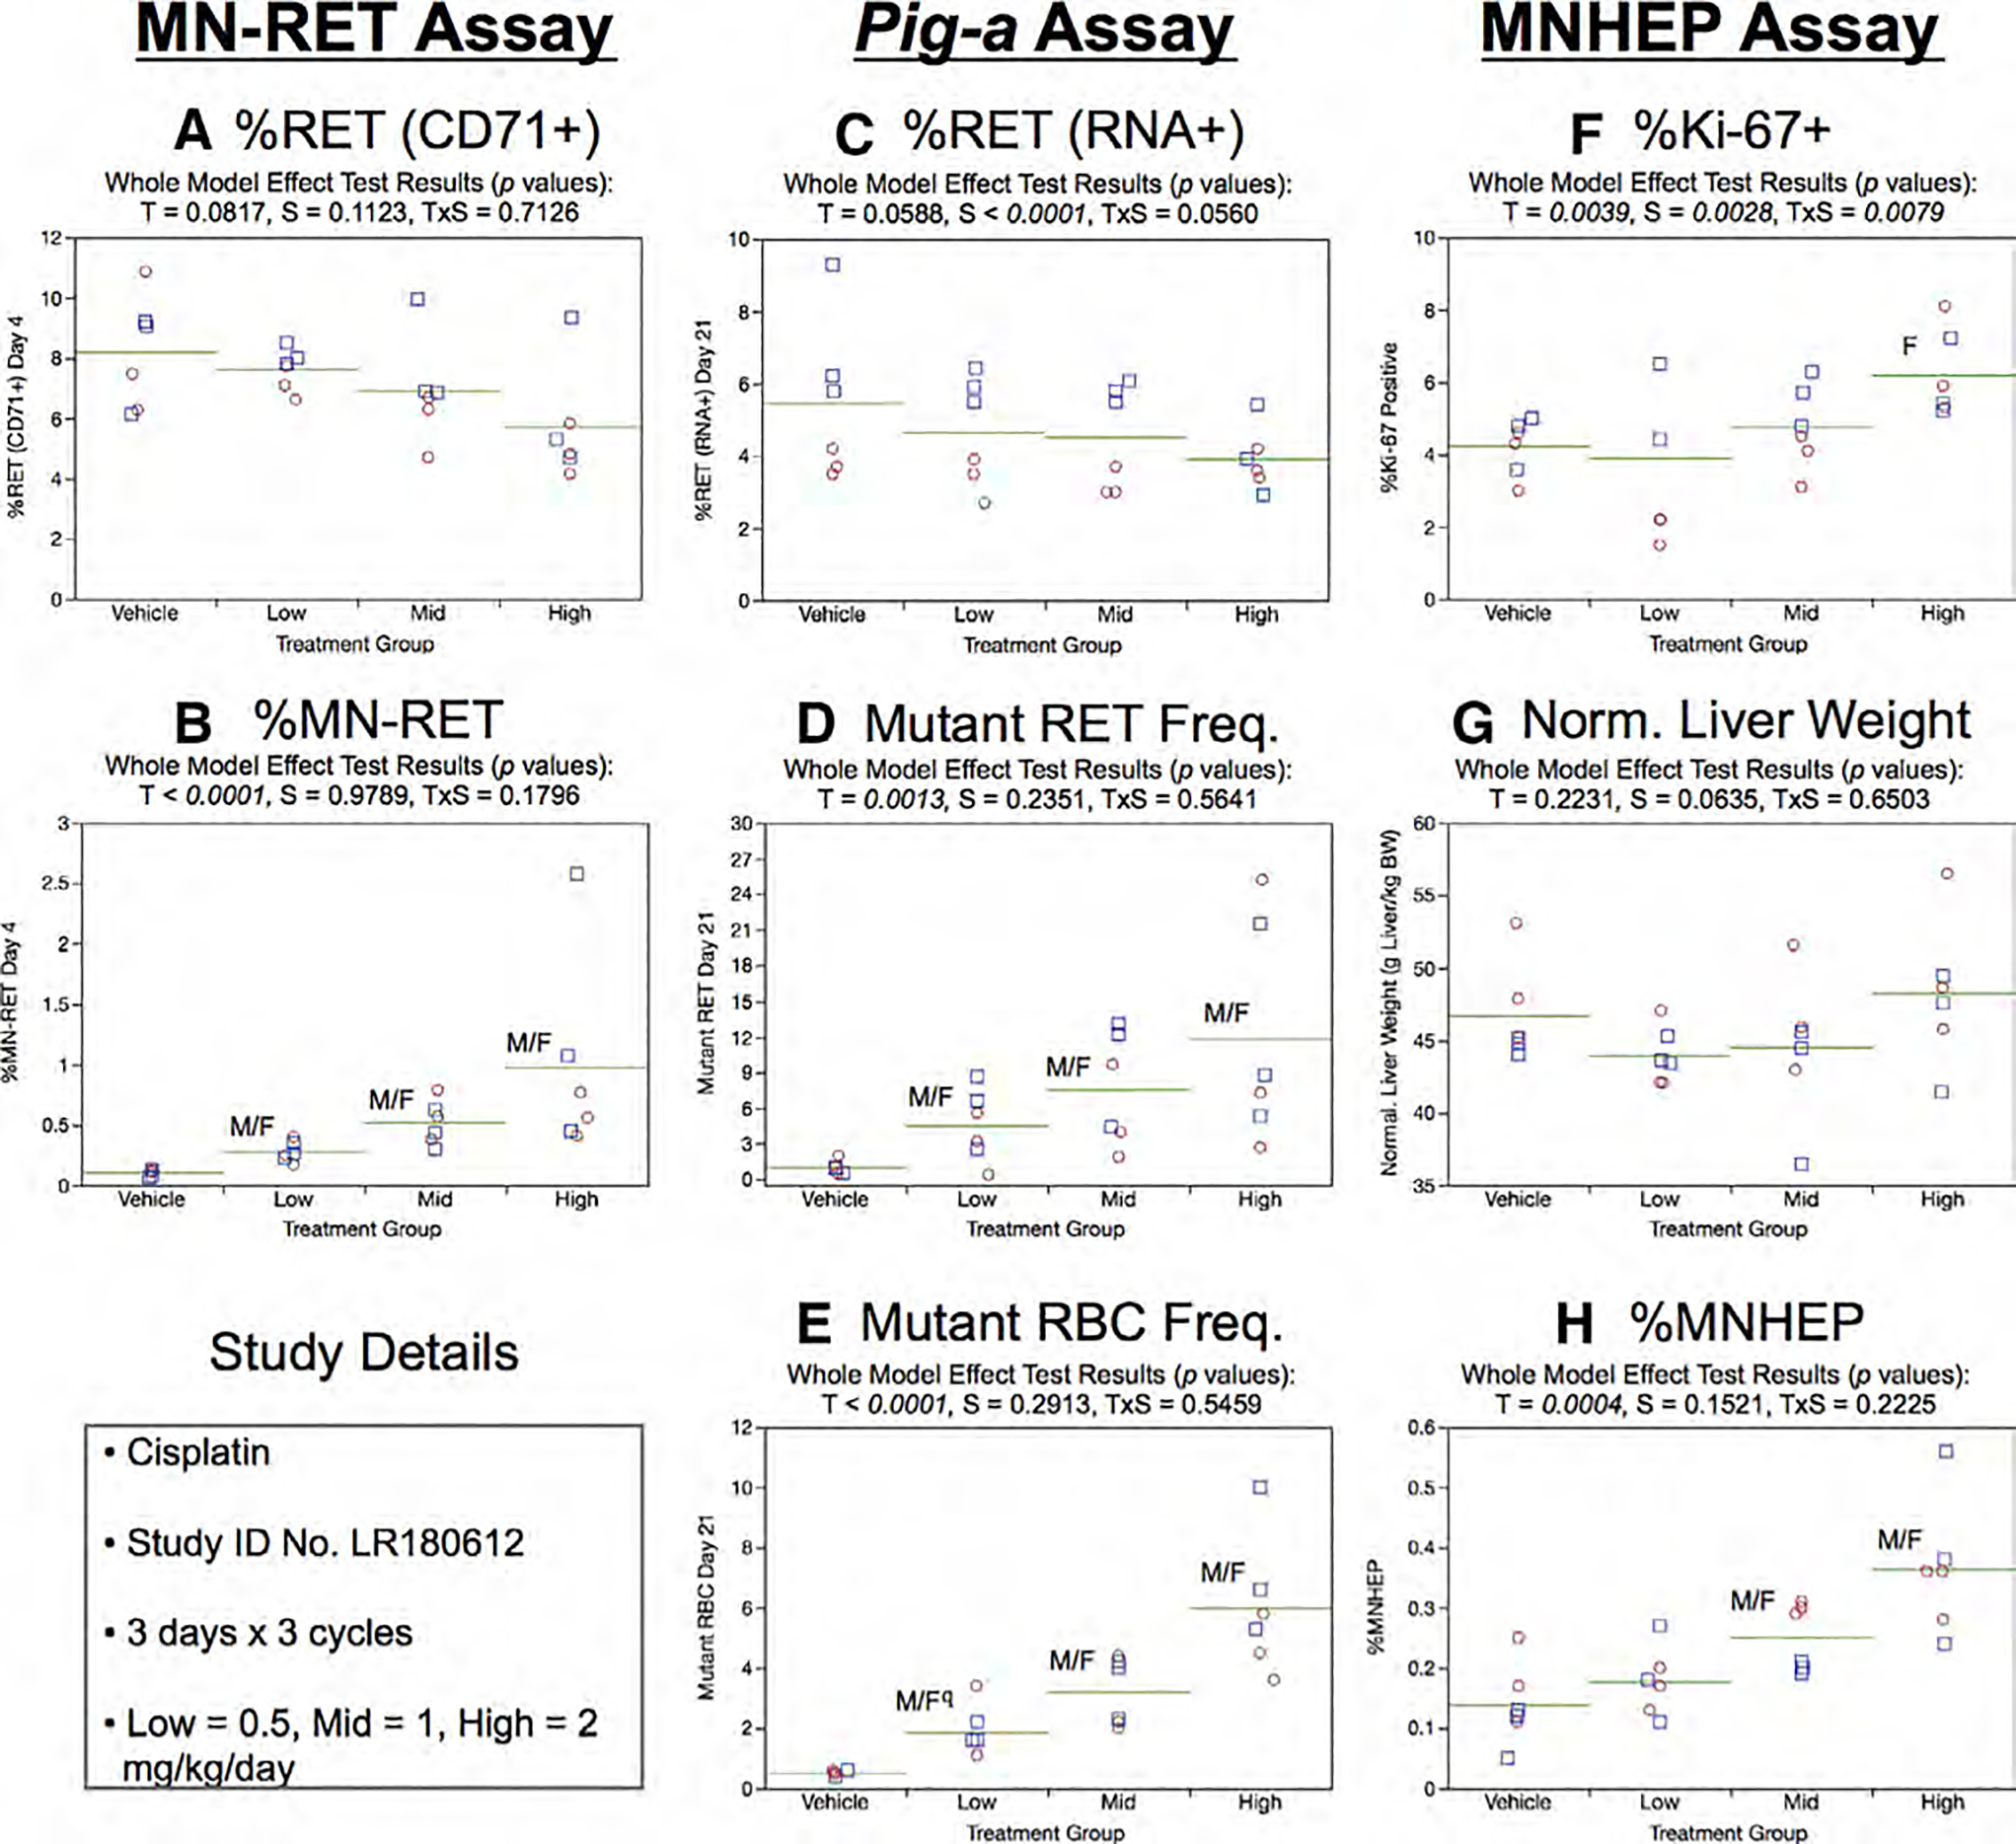
Results from the Cisplatin 3 × 3 study. The same abbreviations and graph formats described in Figure 2 legend are used here. The use of superscript q in panel e denotes Pig-a statistical significance is qualified because more than half the mutant cell frequencies were within the historical negative control distribution.
Day 21 RET (RNA+) frequencies generated by the Pig-a assay showed no treatment effect, although a sex-related effect was observed (%RET higher in males compared to females; Fig. 7c). As shown by Figure 7d, mean RETCD59− frequencies were elevated in every cisPt-treated group. This effect was mirrored by significant dose-dependent increases in RBCCD59− frequencies (Fig. 7e). Note that the statistical significance indicated for the low dose rats must be qualified, as more than half of this group’s RBCCD59− frequencies were within the historical negative control distribution’s 95% tolerance interval.
Repeated cycles of cisPt exposure were observed to increase %Ki-67-positive nuclei in high dose female rats (Fig. 7f). No changes to normalized liver weights were observed (Fig. 7g). The %MNHEP values provided in Figure 7h show that three cycles of cisPt exposure caused increased levels of liver cell chromosomal damage, as was the case in the 3 × 1 study design described above.
Cyclophosphamide, 3 × 1
One cycle of CP exposure had a slight effect on mean body weight gains over Days 1 through 4: 17, 18, 16, and 14 g for the 0, 3.75, 7.5, and 15 mg/kg/day dose groups, respectively. Coupled with no other outward signs of toxicity, these results suggest the CP dose levels used in this study were well tolerated.
As shown in Figure 8a, Day 4 %RET (CD71+) values were significantly reduced in males exposed to the mid dose level, and in both sexes exposed to the high dose. This was accompanied by significant dose-related increases in %MN-RET (Fig. 8b).
Fig. 8.
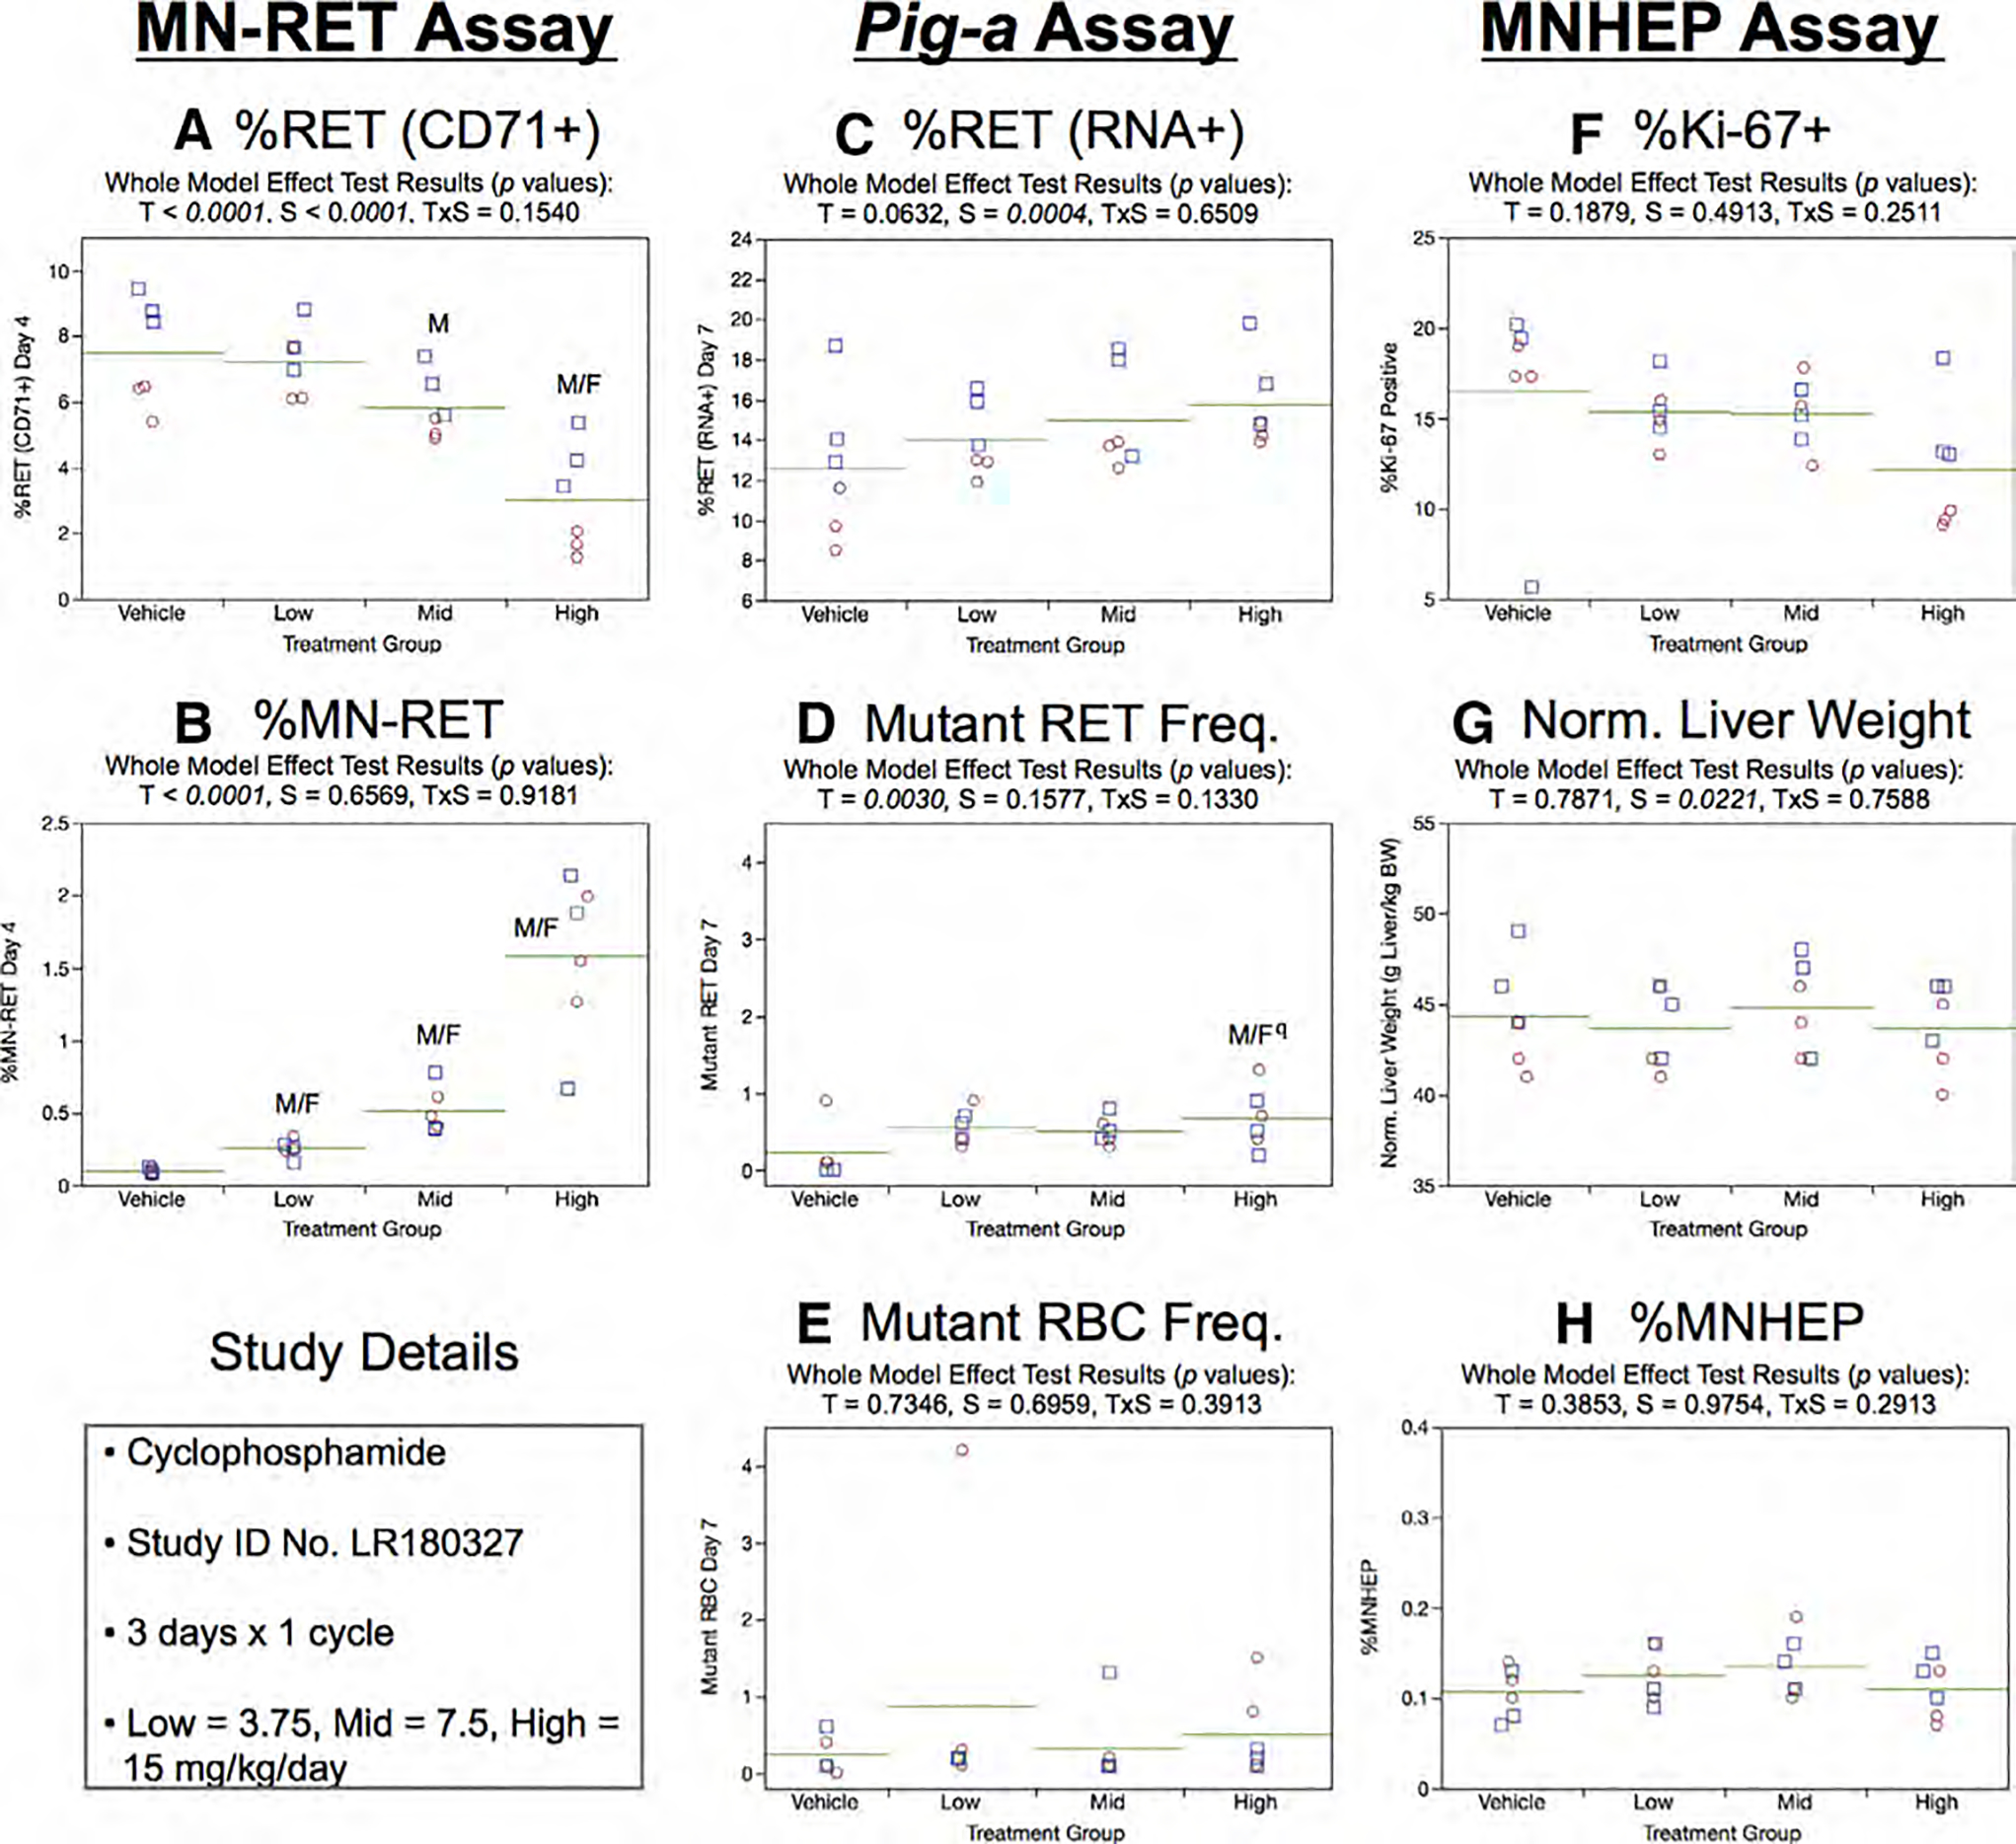
Results from the Cyclophosphamide 3 × 1 study. The same abbreviations and graph formats described in Figure 2 legend are used here. The use of superscript q in panel d denotes Pig-a statistical significance is qualified because more than half the mutant cell frequencies were within the historical negative control distribution.
Neither treatment nor sex effects were evident in RET (RNA+) frequencies generated by the Day 7 Pig-a assay (Fig. 8c). Furthermore, the 3 × 1 study design produced no convincing evidence of treatment effects on RETCD59− or RBCCD59− frequencies (Fig. 8d,e). Whereas statistical significance was noted for RETCD59− in the high dose group, these results are qualified because none of the frequencies exceeded the upper bound 95% tolerance interval for historical negative controls.
Mean %Ki-67-positive nuclei were slightly decreased with increasing CP dose level, however, a treatment effect did not attain statistical significance (Fig. 8f). Normalized liver weights showed a slight sex effect, whereas no treatment effect was evident (Fig. 8g). In line with these other subtle/nil liver effects, MNHEP frequencies were not affected by treatment or sex (Fig. 8h).
Cyclophosphamide, 3 × 3
Three cycles of CP exposure moderately reduced mean body weight gains over Days 1 through 17: 101, 95, 98, and 75 g for the 0, 3.75, 7.5, and 15 mg/kg/day dose groups, respectively. As with the 3 × 1 study, these dose levels appeared to be well tolerated in this repeated cycle experimental design.
Mean Day 4 RET (CD71+) were significantly reduced in the mid and high dose groups (Fig. 9a). In conjunction with these effects on erythropoiesis, robust induction of %MN-RET was observed (Fig. 9b).
Fig.9.
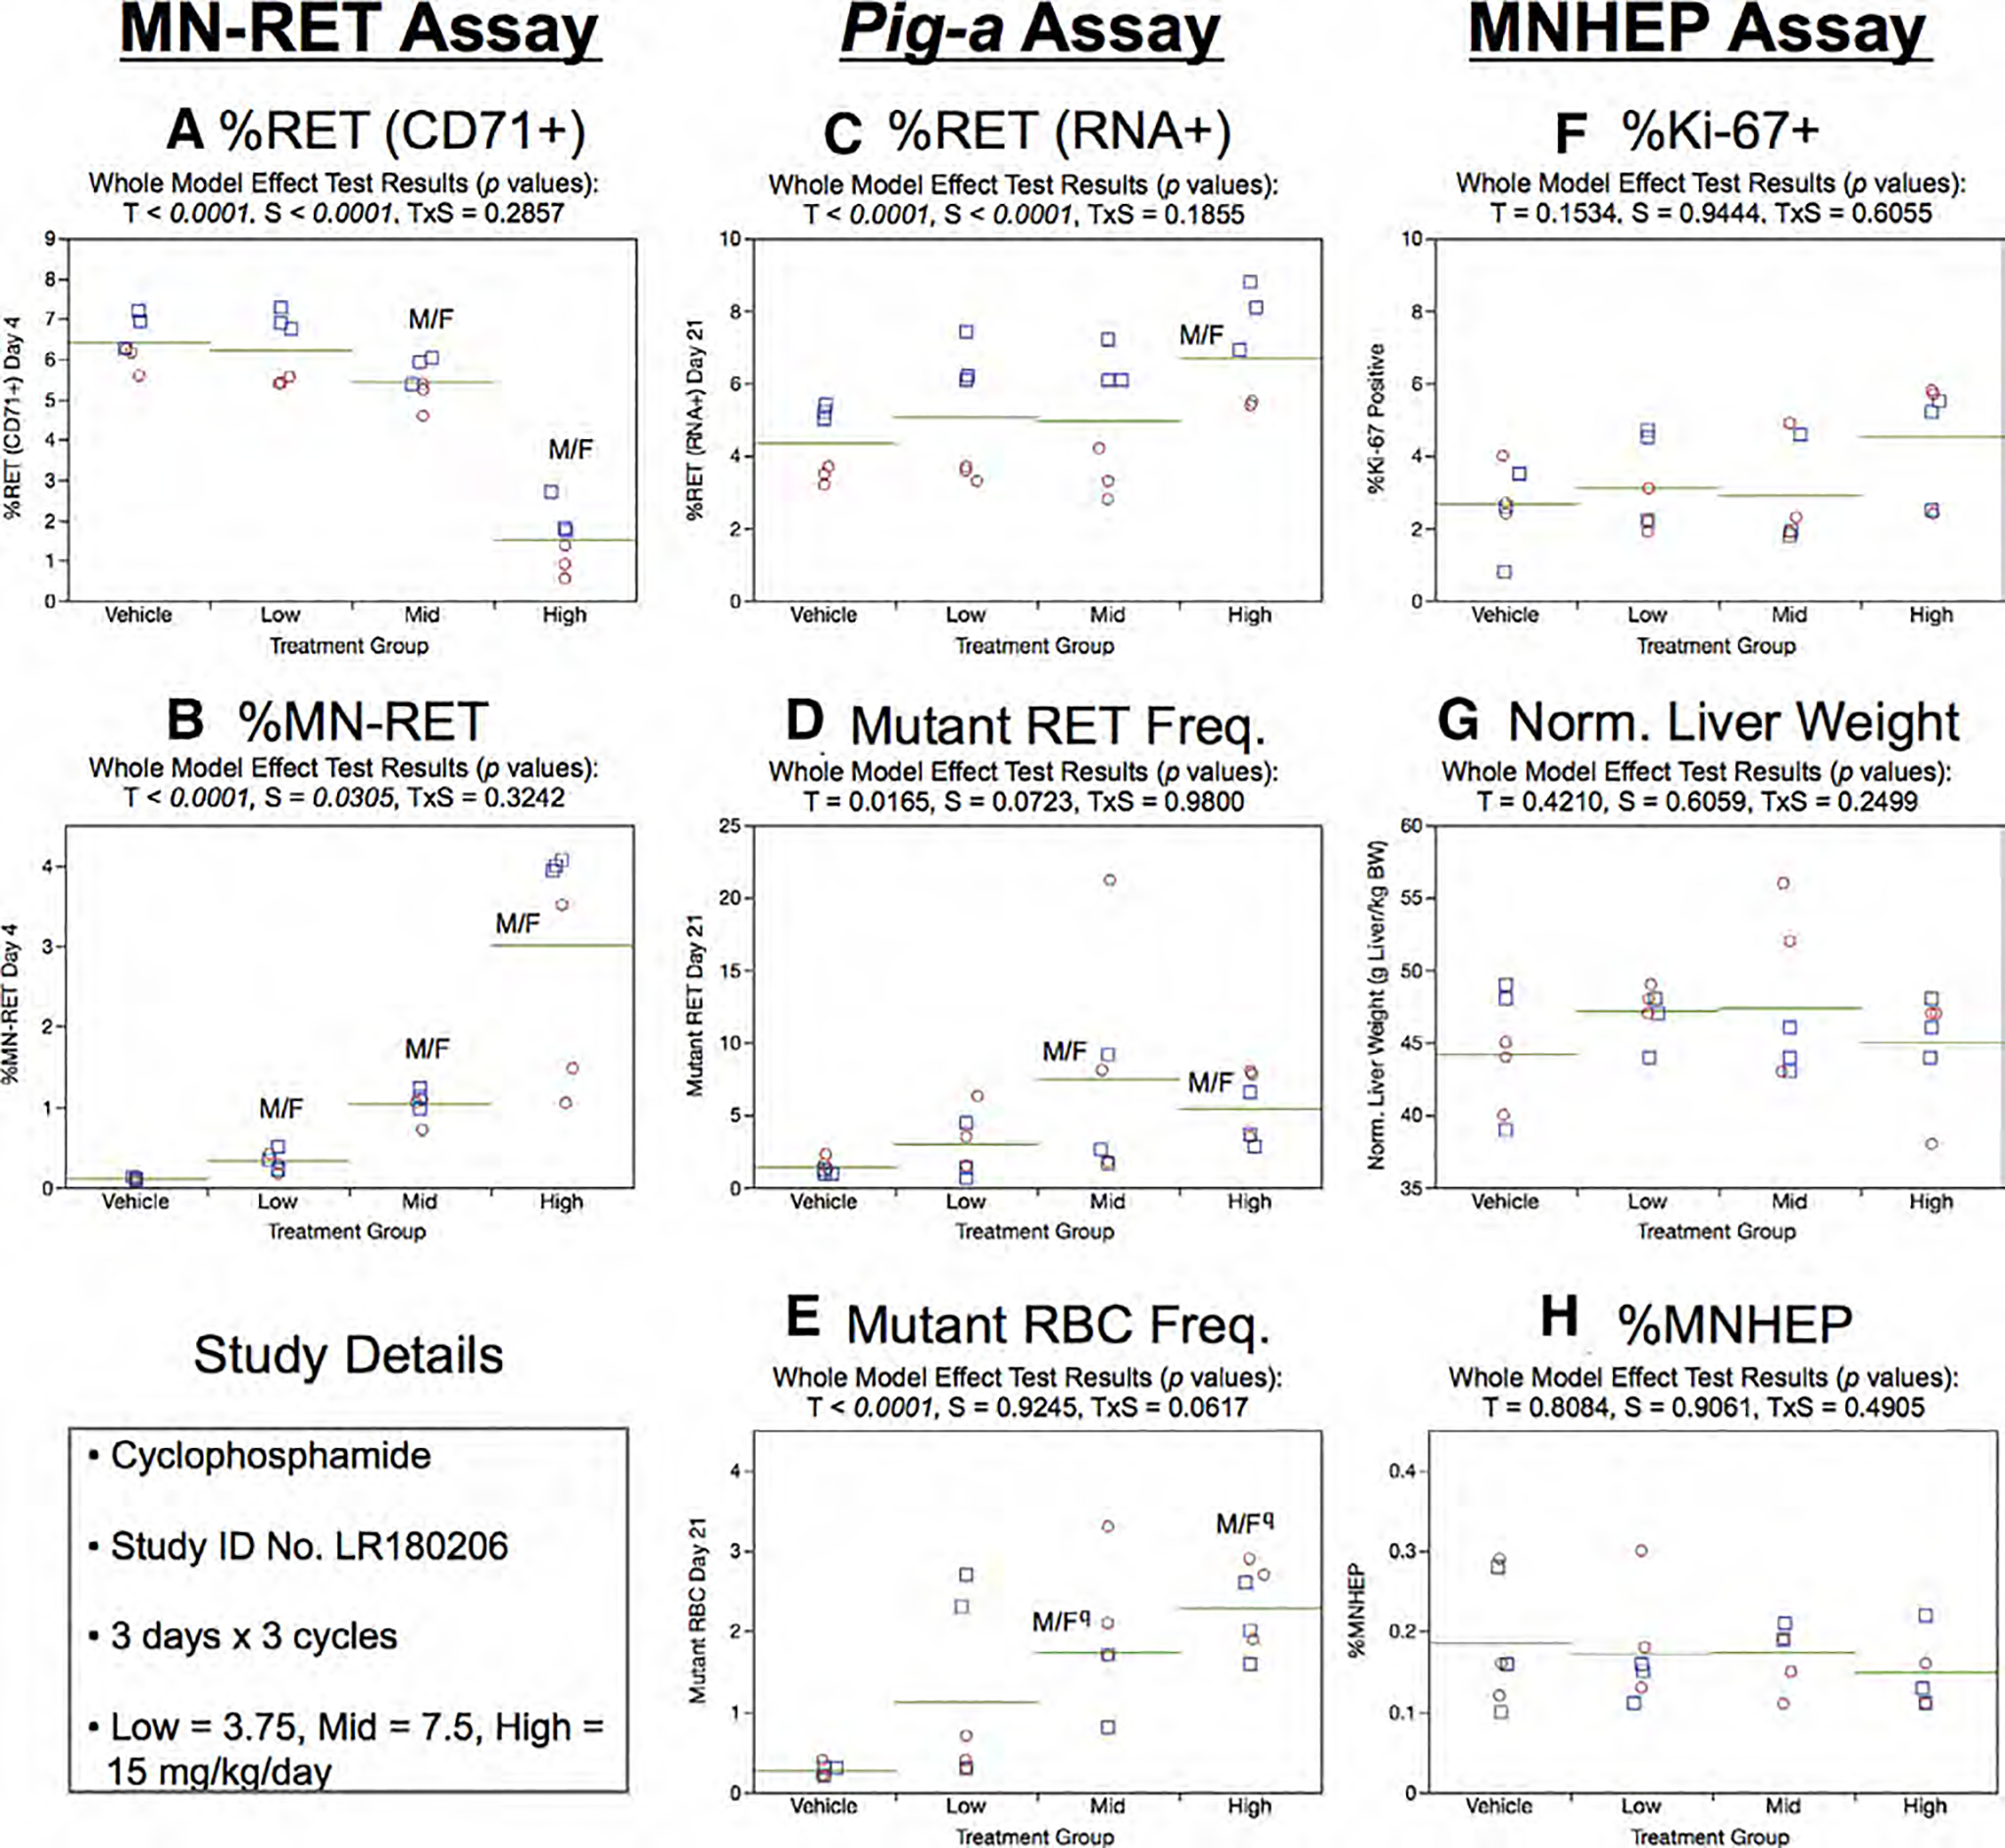
Results from the Cyclophosphamide 3 × 3 study. The same abbreviations and graph formats described in Figure 2 legend are used here. The use of superscript q in panel e denotes Pig-a statistical significance is qualified because more than half the mutant cell frequencies were within the historical negative control distribution.
Day 21 RET (RNA+) frequencies generated by the Pig-a assay showed treatment as well as sex effects (Fig. 9c). As shown by Figure 9d, mean RETCD59− frequencies were significantly elevated in the mid and high treatment groups, and at least half of the rats in each of these groups exceeded the historical negative control distribution’s 95% tolerance interval. Although dose-related, statistically significant increases were also noted for the RBCCD59− endpoint (Fig. 9e), these results are qualified because the majority of the rats’ RBCCD59− frequencies were within the historical negative control distribution.
No treatment or sex effects were evident for %Ki-67-positive nuclei (Fig. 9f), normalized liver weights (Fig. 9g), and %MNHEP (Fig. 9h).
Diethylnitrosamine, 3 × 1
The high dose of DEN caused a moderate reduction to mean body weight gain over Days 1 through 4: 19, 17, 17, and 10 g for the 0, 10, 20, and 40 mg/kg/day dose groups, respectively. Coupled with no other outward signs of toxicity, these results suggest the DEN dose levels used in this study were well tolerated.
As shown by Figure 10a, Day 4 %RET (CD71+) were significantly reduced in mid and high dose groups. No indication of increased %MN-RET due to treatment was observed (Fig. 10b).
Fig. 10.
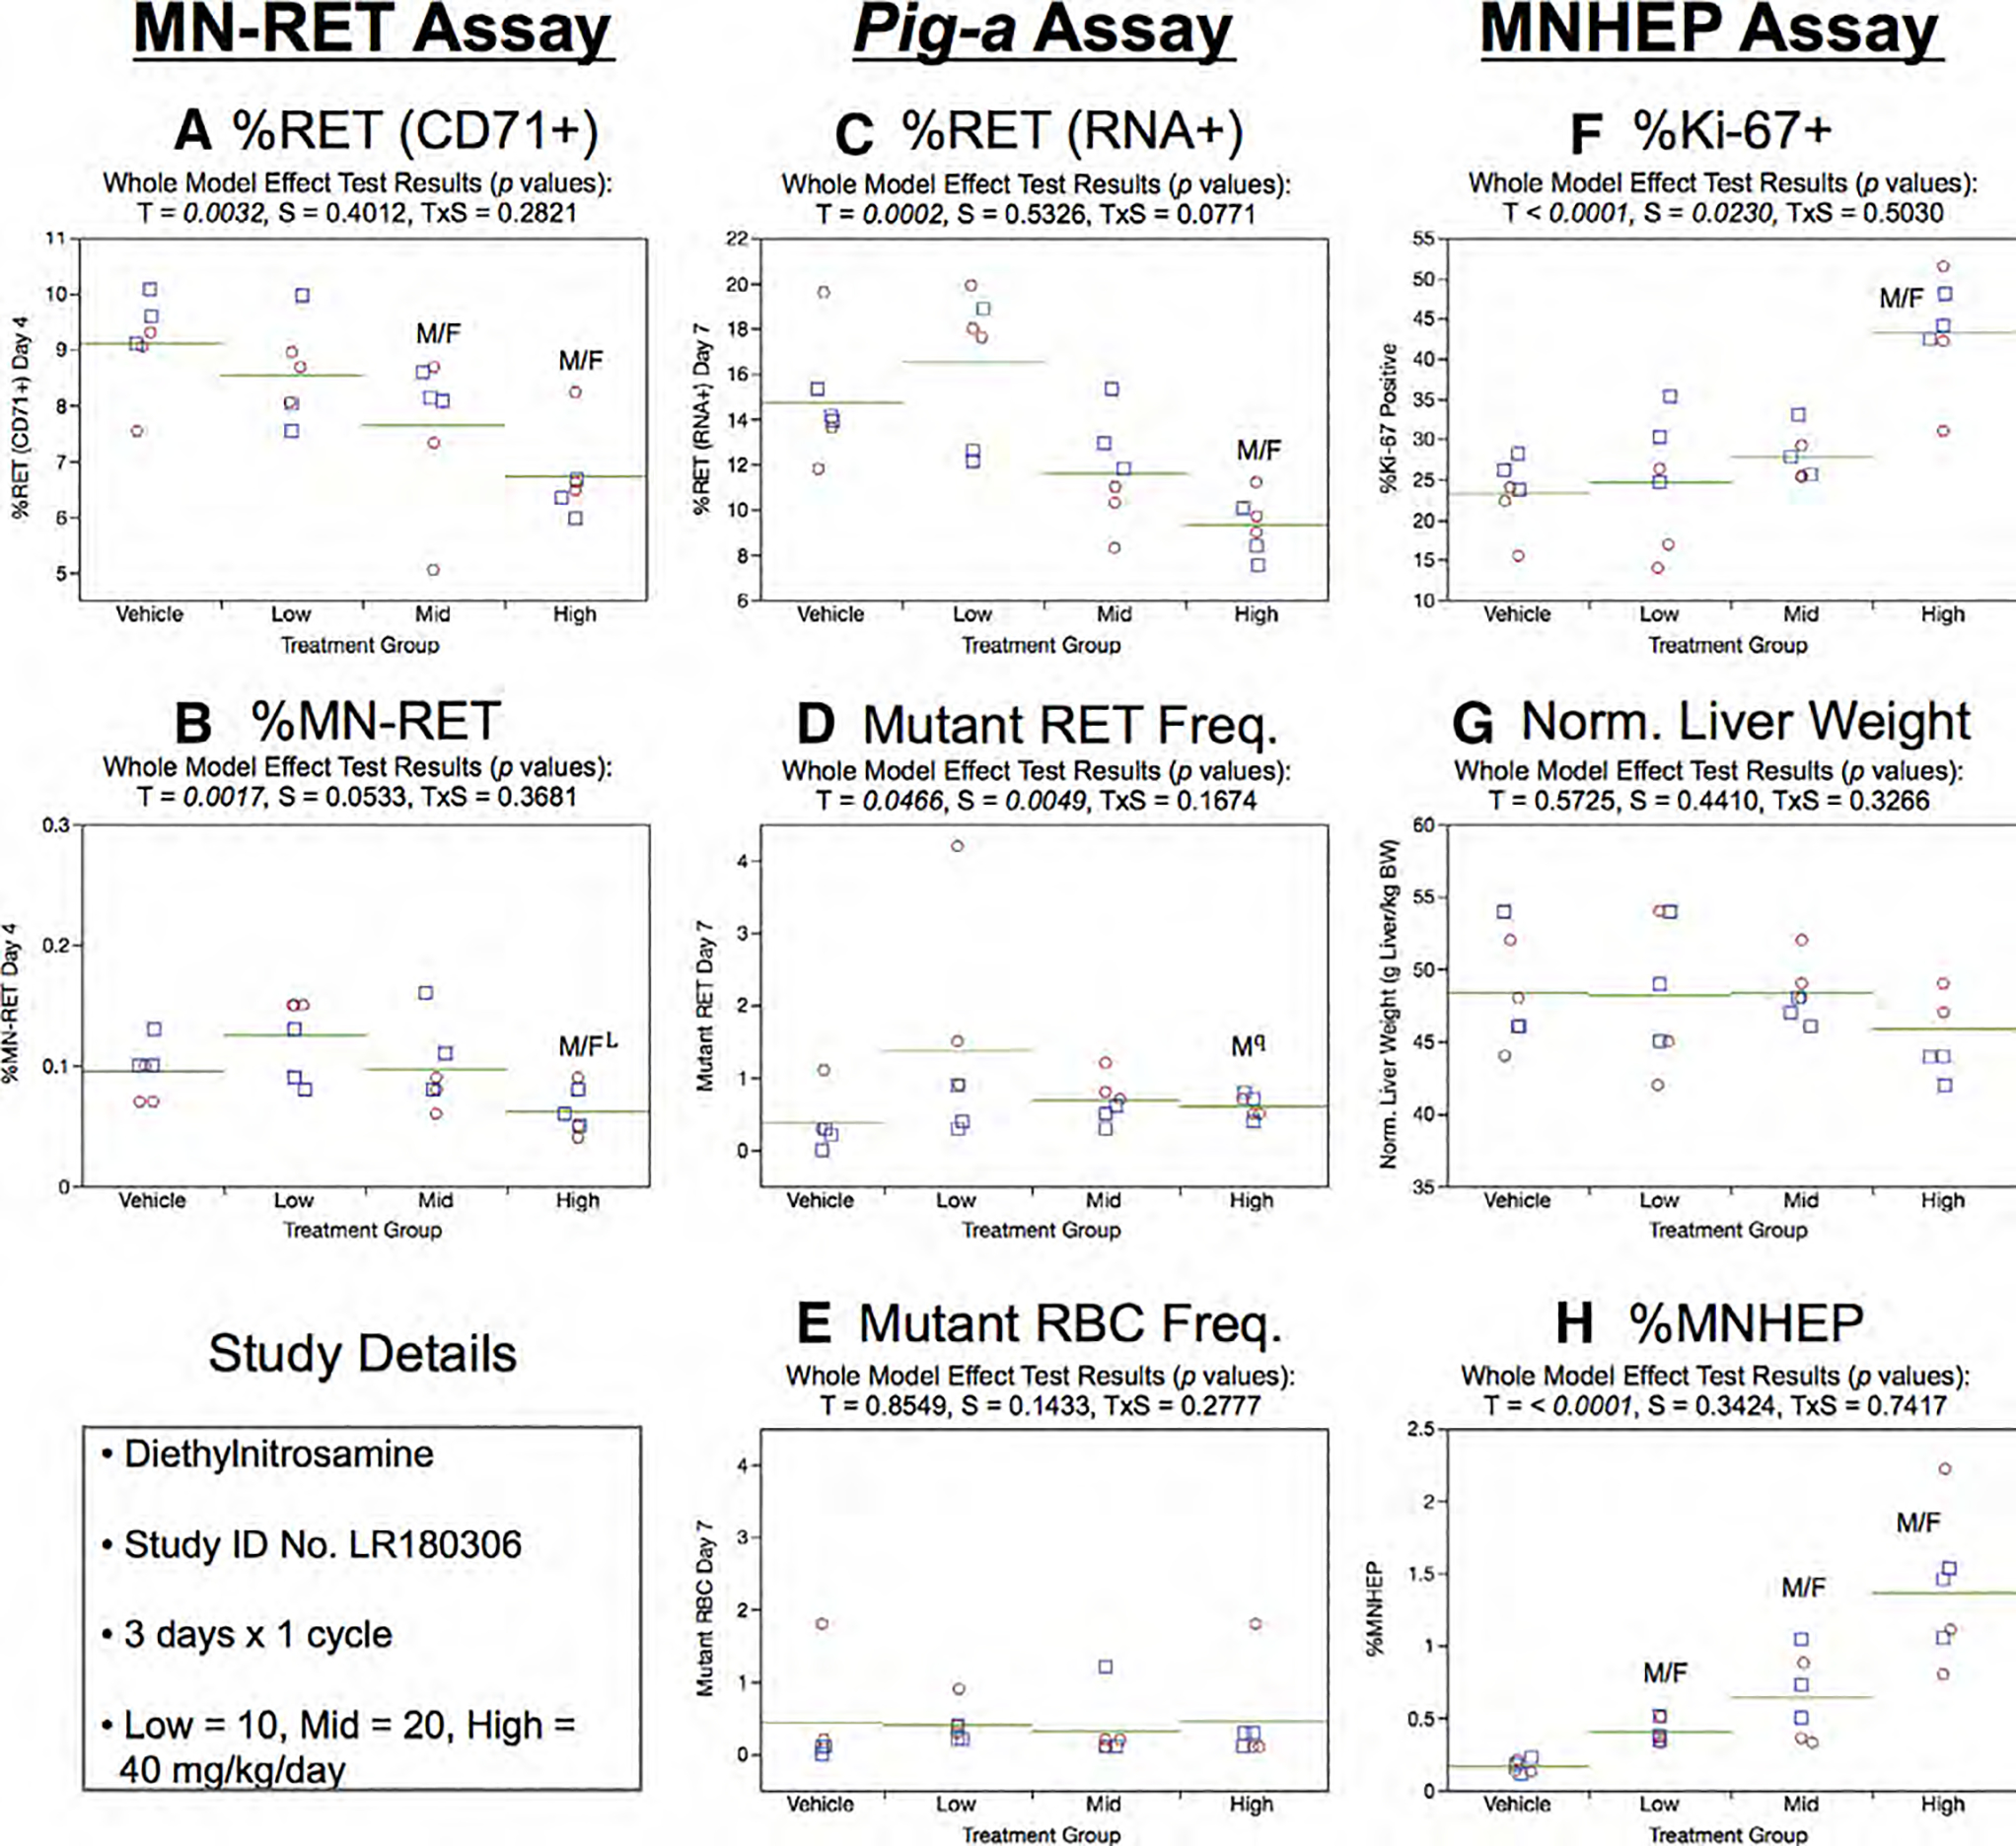
Results from the Diethylnitrosamine 3 × 1 study. The same abbreviations and graph formats described in Figure 2 legend are used here. The use of a superscript L in panel b denotes the high dose group exhibited lower, not higher %MN-RET relative to controls. The use of superscript q in panel d denotes Pig-a statistical significance is qualified because more than half the mutant cell frequencies were within the historical negative control distribution.
Day 7 %RET (RNA+) showed evidence of a significant treatment effect (high dose group; Fig. 10c). On the other hand, the 3 × 1 study design provided no convincing evidence of treatment effects on RETCD59− or RBCCD59− frequencies (Fig. 10d,e). Whereas statistical significance was noted for RETCD59− in the high dose group, these results are qualified because none of the frequencies exceeded the historical negative control upper bound 95% tolerance interval.
Mean %Ki-67-positive nuclei were markedly increased in the high DEN dose group (Fig. 10f), whereas normalized liver weights showed no treatment or sex effects (Fig. 10g). MNHEP were strongly induced by DEN exposure, with no evidence of a sex or treatment × sex interaction effect (Fig. 10h).
Diethylnitrosamine, 3 × 3
Three cycles of DEN exposure led to moderately reduced mean body weight gains over Days 1 through 17: 101, 100, 90, and 76 g for the 0, 3.75, 7.5, and 15 mg/kg/day dose groups, respectively. With no other outward signs of toxicity, these dose levels appeared to be well tolerated in this repeated cycle experimental design.
Although mean Day 4 %RET (CD71+) were reduced with increasing DEN dose levels, this effect did not attain statistical significance (Fig. 11a). MN-RET frequencies were not influenced by treatment or sex (Fig. 11b).
Fig.11.
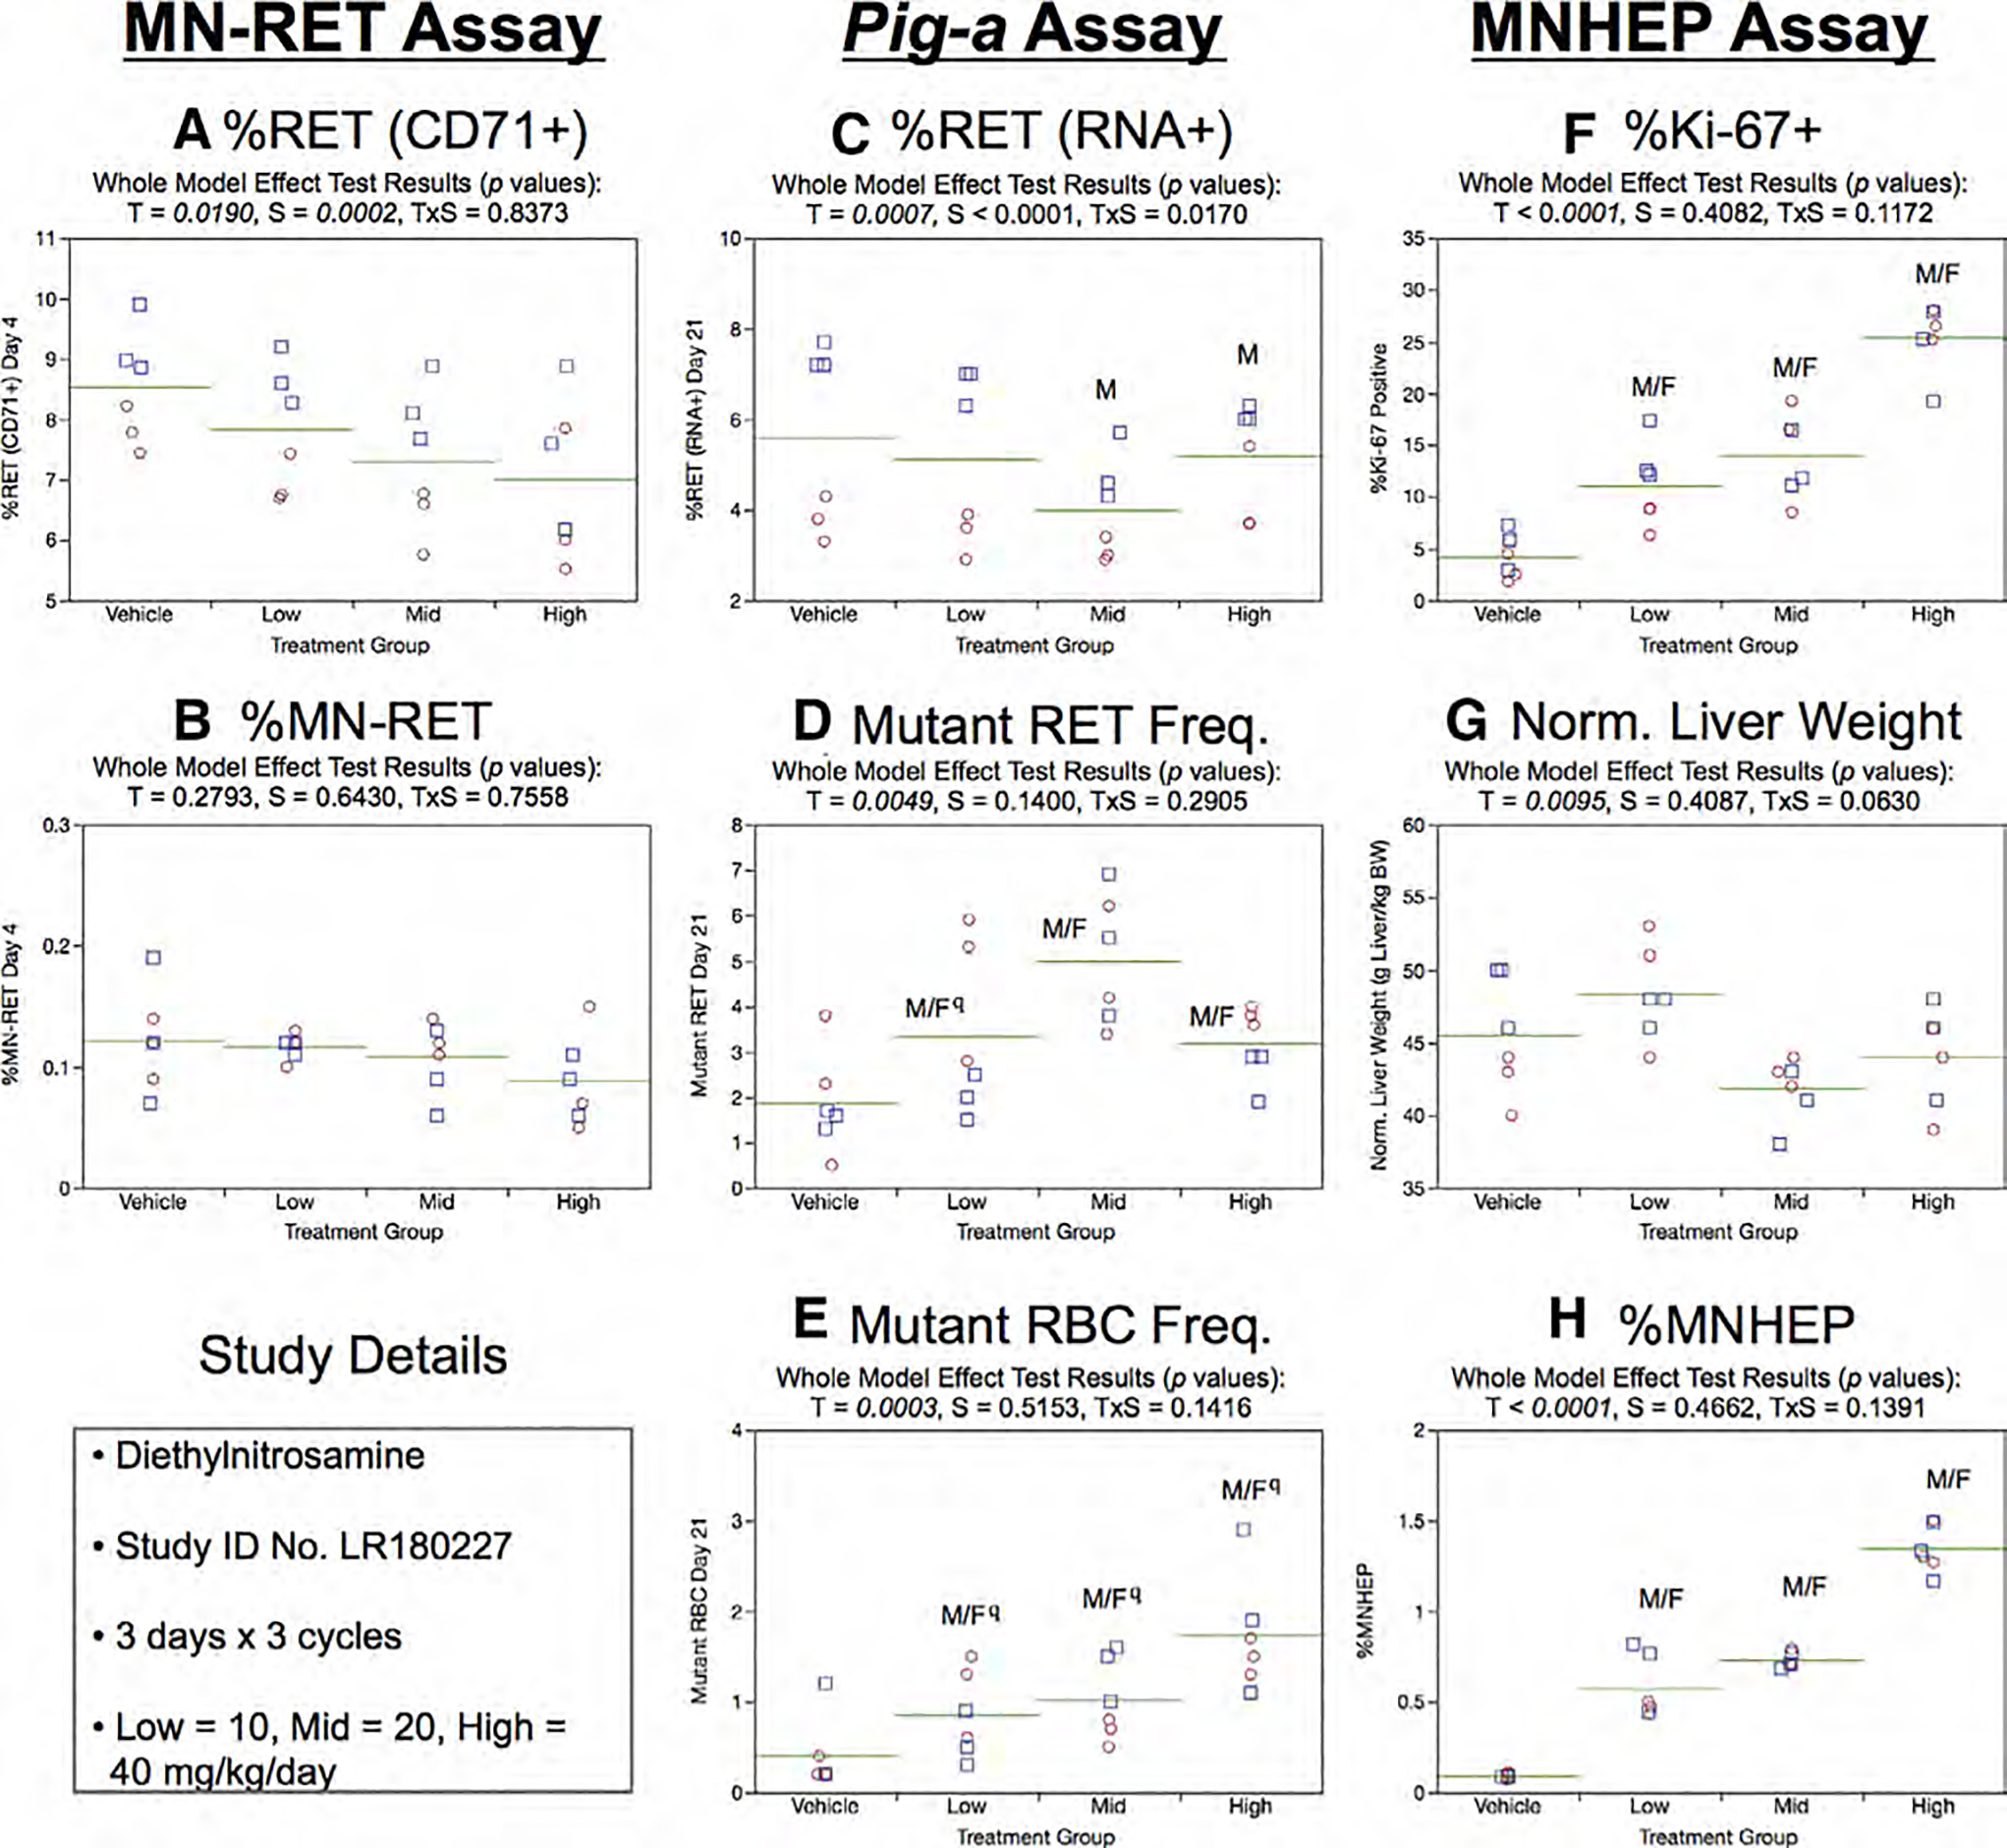
Results from the Diethylnitrosamine 3 × 3 study. The same abbreviations and graph formats described in Figure 2 legend are used here. The use of superscript q in panels d and e denotes Pig-a statistical significance is qualified because more than half the mutant cell frequencies were within the historical negative control distribution.
Day 21 RET (RNA+) frequencies generated by the Pig-a assay were not affected by treatment or sex (Fig. 11c). As shown by Figure 11d, mean RETCD59− frequencies were significantly elevated in each of the DEN treatment groups, but the low dose results are qualified because more than half of the rats in this group were within the historical negative control distribution. Although dose-related, statistically significant increases were also noted for the RBCCD59− endpoint (Fig. 11e), these results are qualified because only one rat’s RBCCD59− frequency exceeded the historical negative control distribution.
%Ki-67-positive nuclei results are presented in Figure 11f. While this biomarker of recent proliferation exhibited large dose-related increases, normalized liver weights were not affected by DEN exposure (Fig. 11g). In agreement with findings in the 3 × 1 study, three cycles of DEN were found to markedly induce MNHEP, with each tested dose level causing a significant increase (Fig. 11h).
1,2-Dimethylhydrazine, 3 × 1
One cycle of 1,2-DMH exposure led to reduced mean body weight gains over Days 1 through 4: 21, 19, 10, and 5 g for the 0, 7.5, 15, and 30 mg/kg/day dose groups, respectively.
As shown by Figure 10a, Day 4 %RET (CD71+) were significantly reduced in mid and high dose groups. Furthermore, MN-RET were induced to a statistically significant level in the high dose group (Fig. 12b).
Fig. 12.
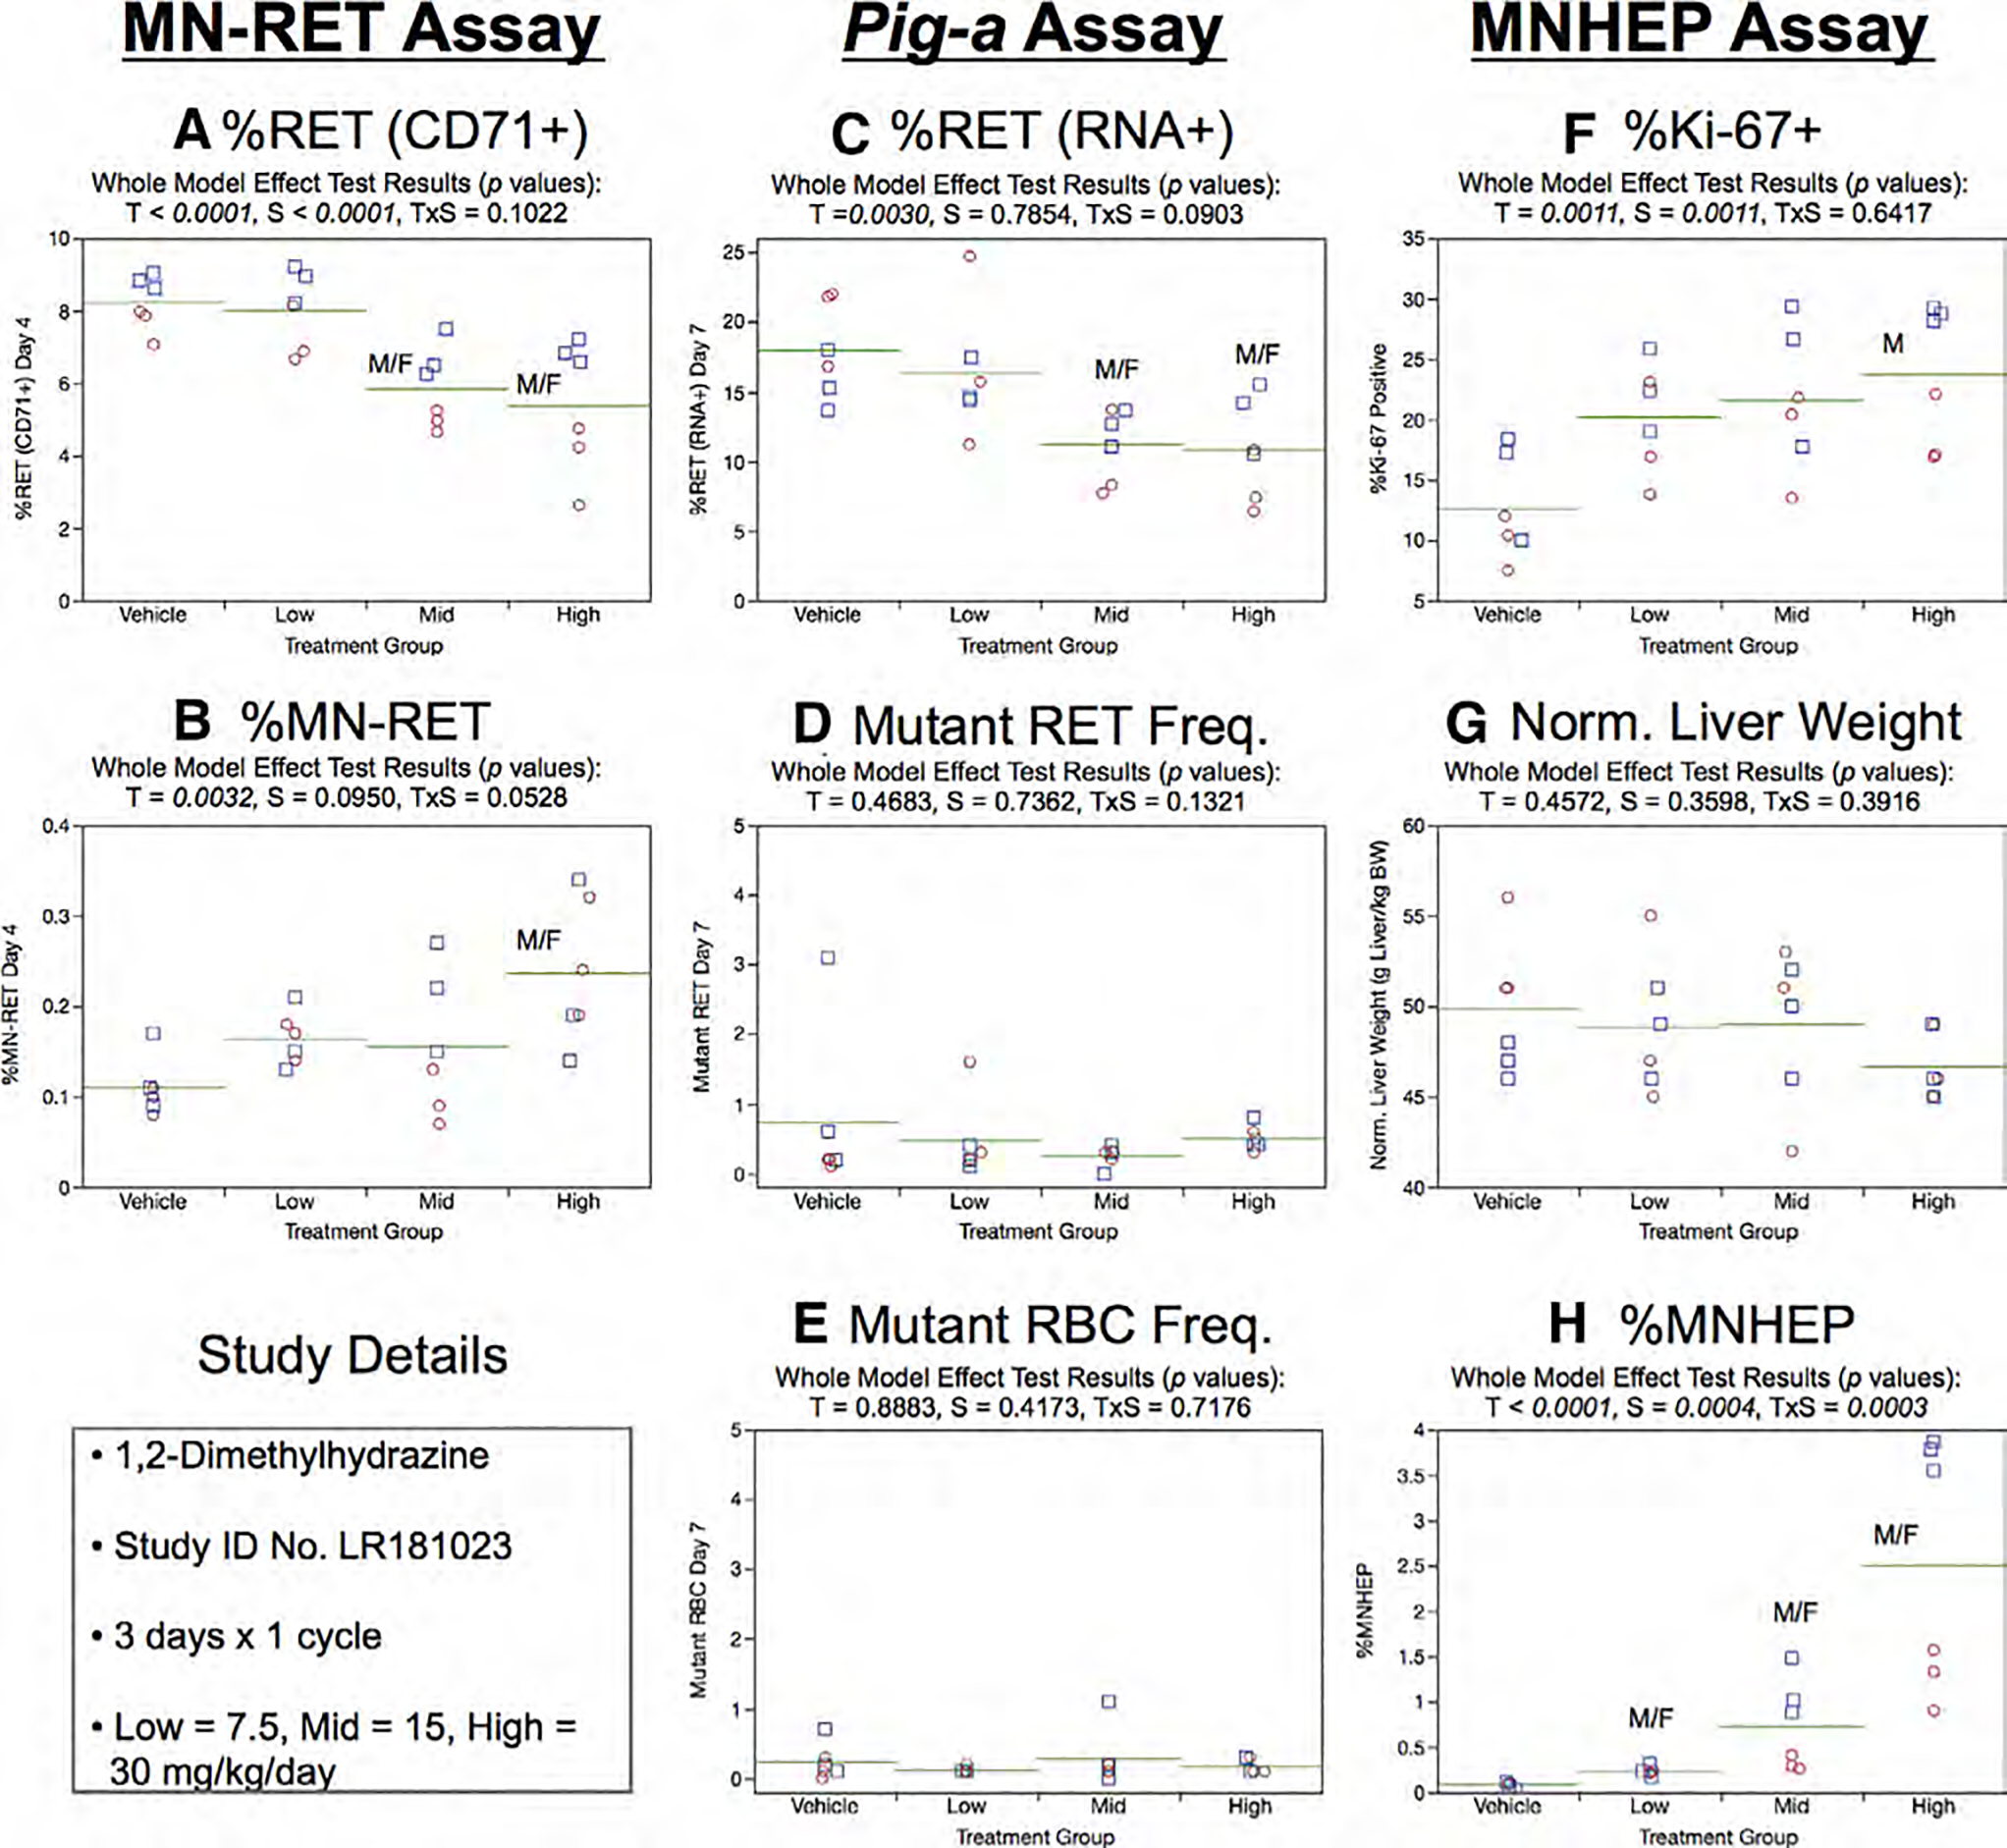
Results from the 1,2-Dimethylhydrazine 3 × 1 study. The same abbreviations and graph formats described in Figure 2 legend are used here.
Day 7 %RET (RNA+) generated by the Pig-a assay showed a significant treatment effect for the mid and high dose groups (Fig. 12c). However, there was no evidence of treatment or sex effects on RETCD59− or RBCCD59− frequencies (Fig. 12d,e).
Mean Ki-67-positive nuclei frequencies increased in a dose-related manner, and this effect attained statistical significance in the case of high dose males. Sex was also found to be a significant factor, with males exhibiting higher Ki-67 frequencies compared to females. Normalized liver weights showed no treatment or sex effects (Fig. 12g). MNHEP were strongly induced by 1,2-DMH exposure, and there was evidence for a treatment × sex interaction effect, as males exhibited higher induced % MNHEP compared to females in the mid and high dose groups (Fig. 12h).
1,2-Dimethylhydrazine, 3 × 3
Three cycles of 1,2-DMH exposure led to moderately reduced mean body weight gains over Days 1 through 17: 130, 116, 110, and 80 g for the 0, 7.5, 15, and 30 mg/kg/day dose groups, respectively.
Relatively small but statistically significant reductions to mean %RET (CD71+) were observed for 1,2-DMH exposed rats (Fig. 13a). Increased %MN-RET were evident in high dose animals (Fig. 13b).
Fig. 13.
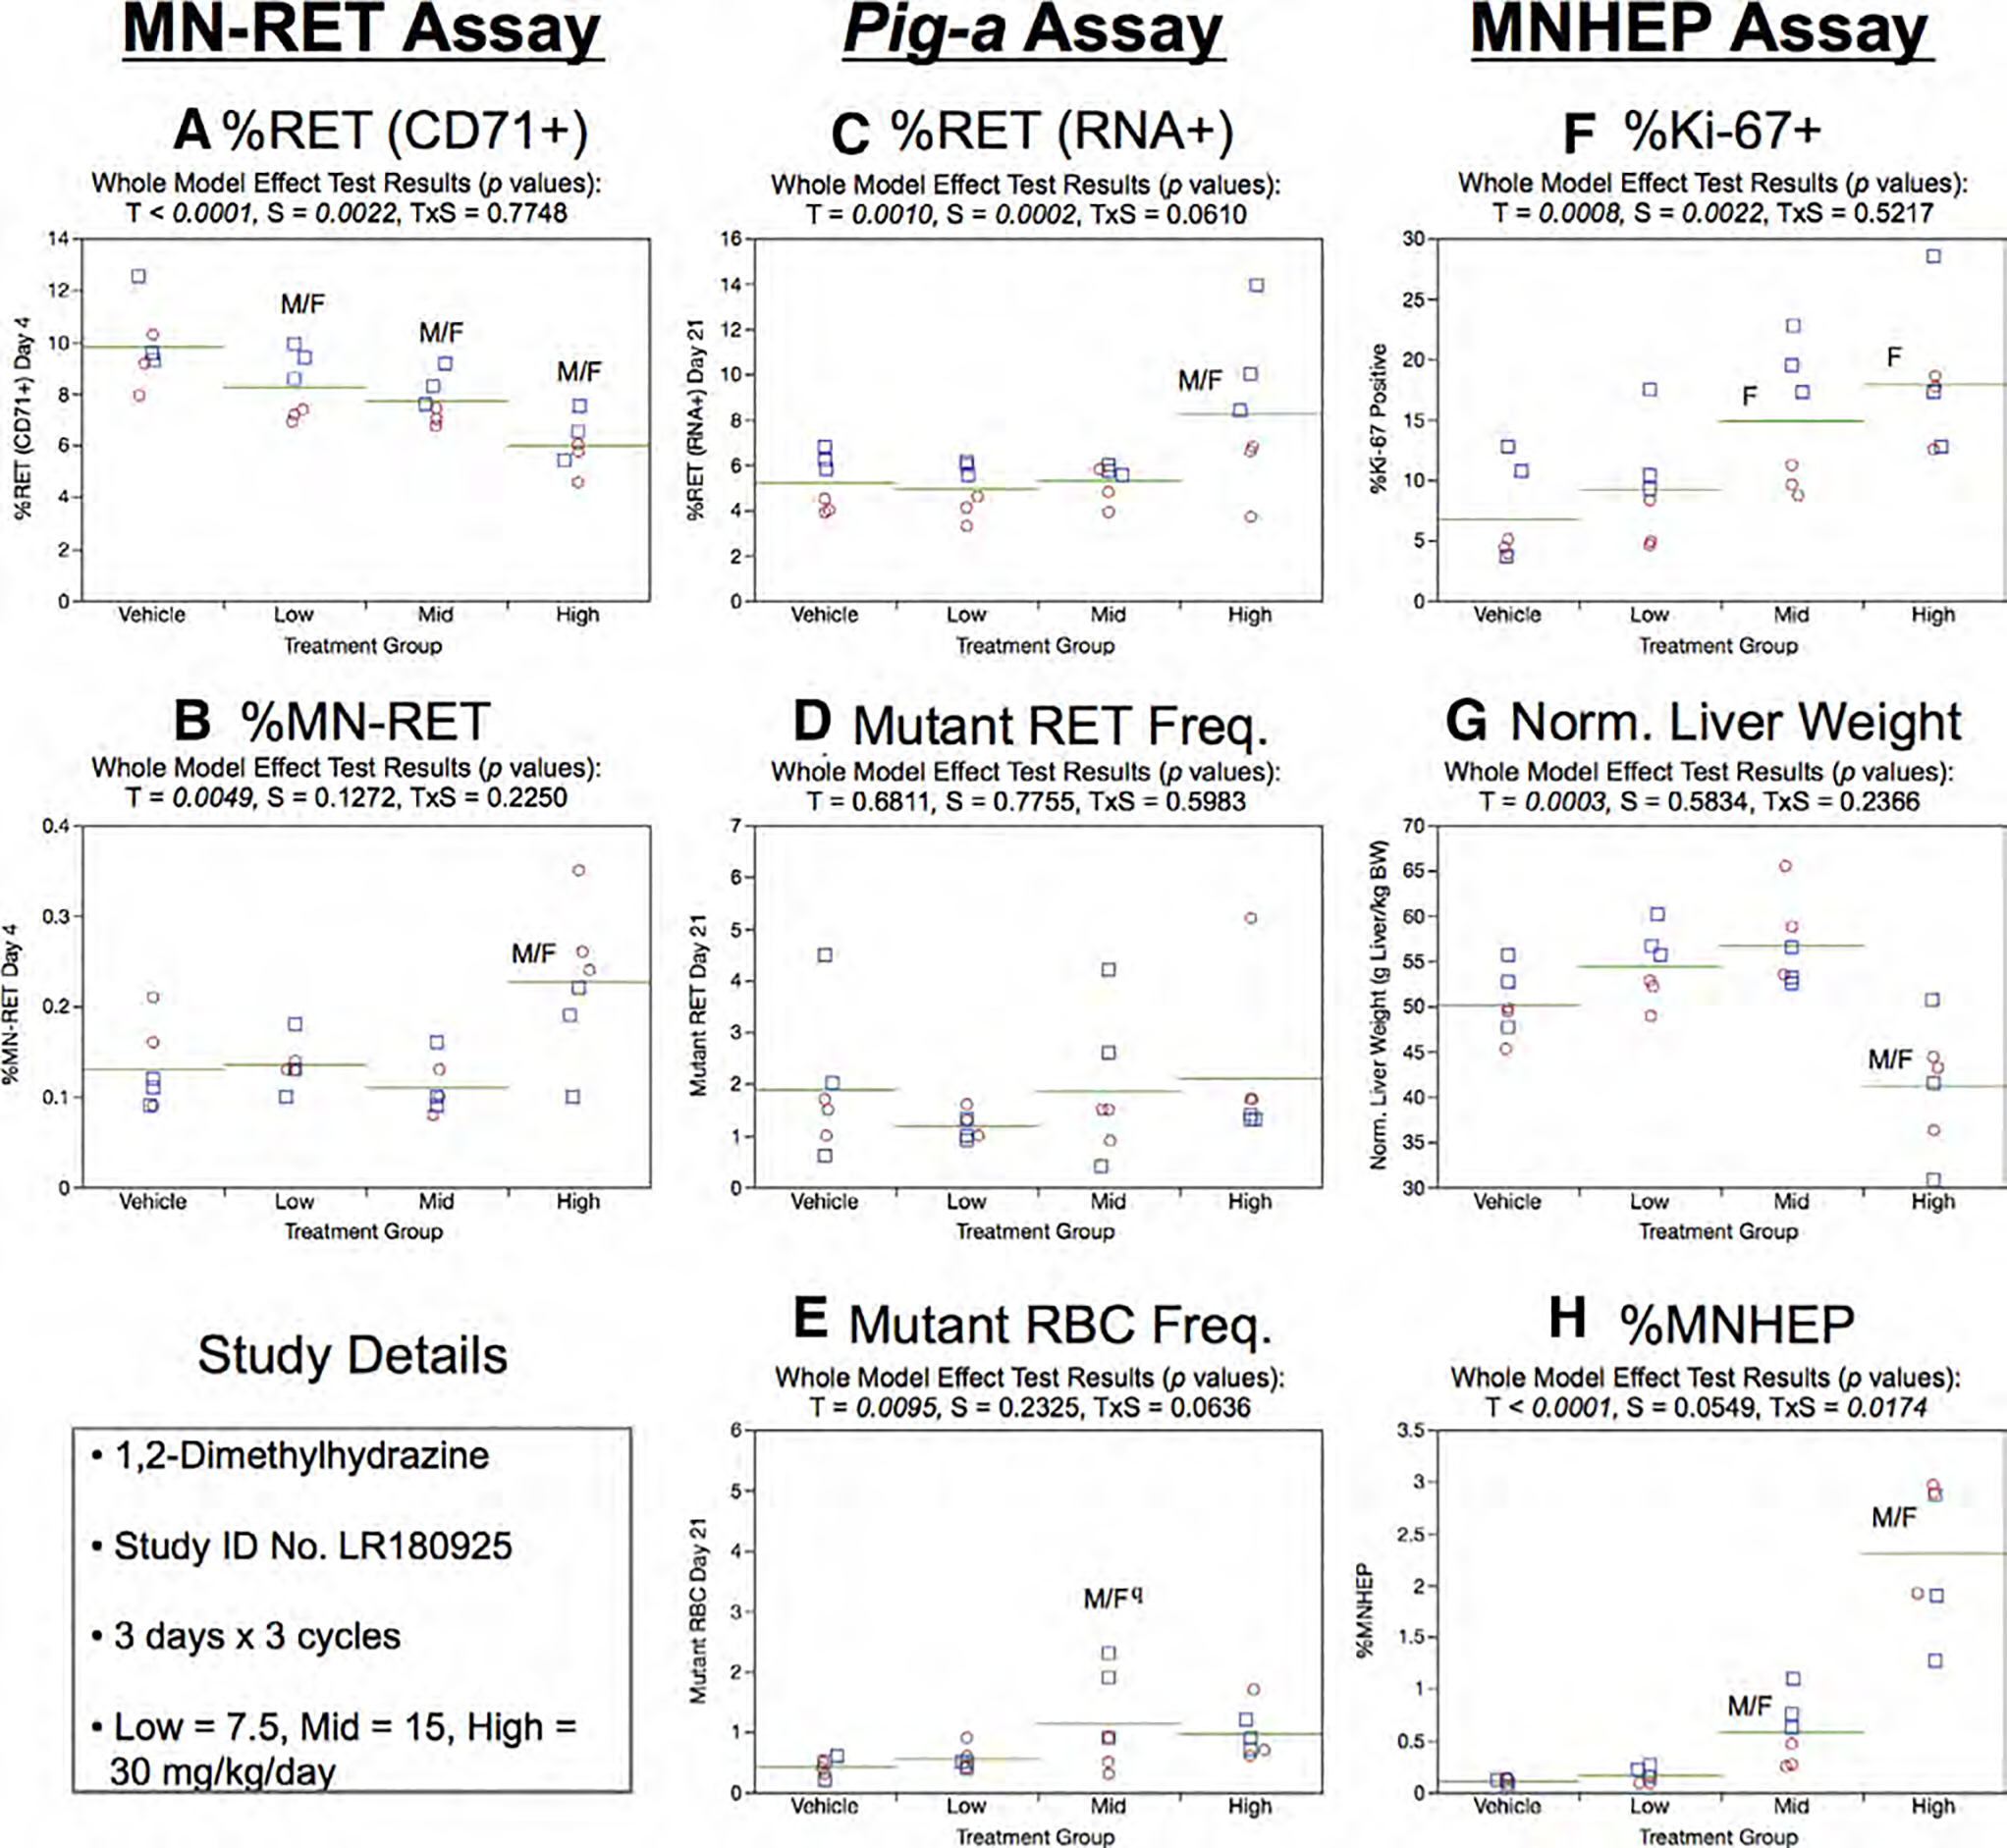
Results from the 1,2-Dimethylhydrazine 3 × 3 study. The same abbreviations and graph formats described in Figure 2 legend are used here. The use of superscript q in panel e denotes Pig-a statistical significance is qualified because more than half the mutant cell frequencies were within the historical negative control distribution.
Day 21 RET (RNA+) frequencies generated by the Pig-a assay were elevated in the high dose group (Fig. 13c). Mean RETCD59− frequencies showed no treatment or sex effects (Fig. 13d). Although a statistically significant increase was noted for RBCCD59−, (Fig. 13e) these results are qualified because none of the frequencies exceeded the historical negative control distribution.
Mean %Ki-67-positive nuclei were observed to increase with increasing 1,2-DMH exposure, although only mid and high dose females attained statistical significance (Fig. 13f). Normalized liver weights were significantly reduced by 1,2-DMH treatment (Fig. 13g). Robust dose-related increases were evident in the chromosomal damage endpoint MNHEP in the mid and high dose groups (Fig. 13h). The significant treatment × sex interaction effect observed in this 3 × 3 study design appears less pronounced than the one noted in the 3 × 1 study described above (Fig. 12h).
Dimethylnitrosamine, 3 × 1
One cycle of DMN exposure led to reduced mean body weight gain over Days 1 through 4: 18, 20, 16, and 10 g for the 0, 2.5, 5, and 10 mg/kg/day dose groups, respectively.
As shown by Figure 14a,b, neither Day 4 %RET (CD71 +) nor %MN-RET were affected by DMN treatment.
Fig. 14.
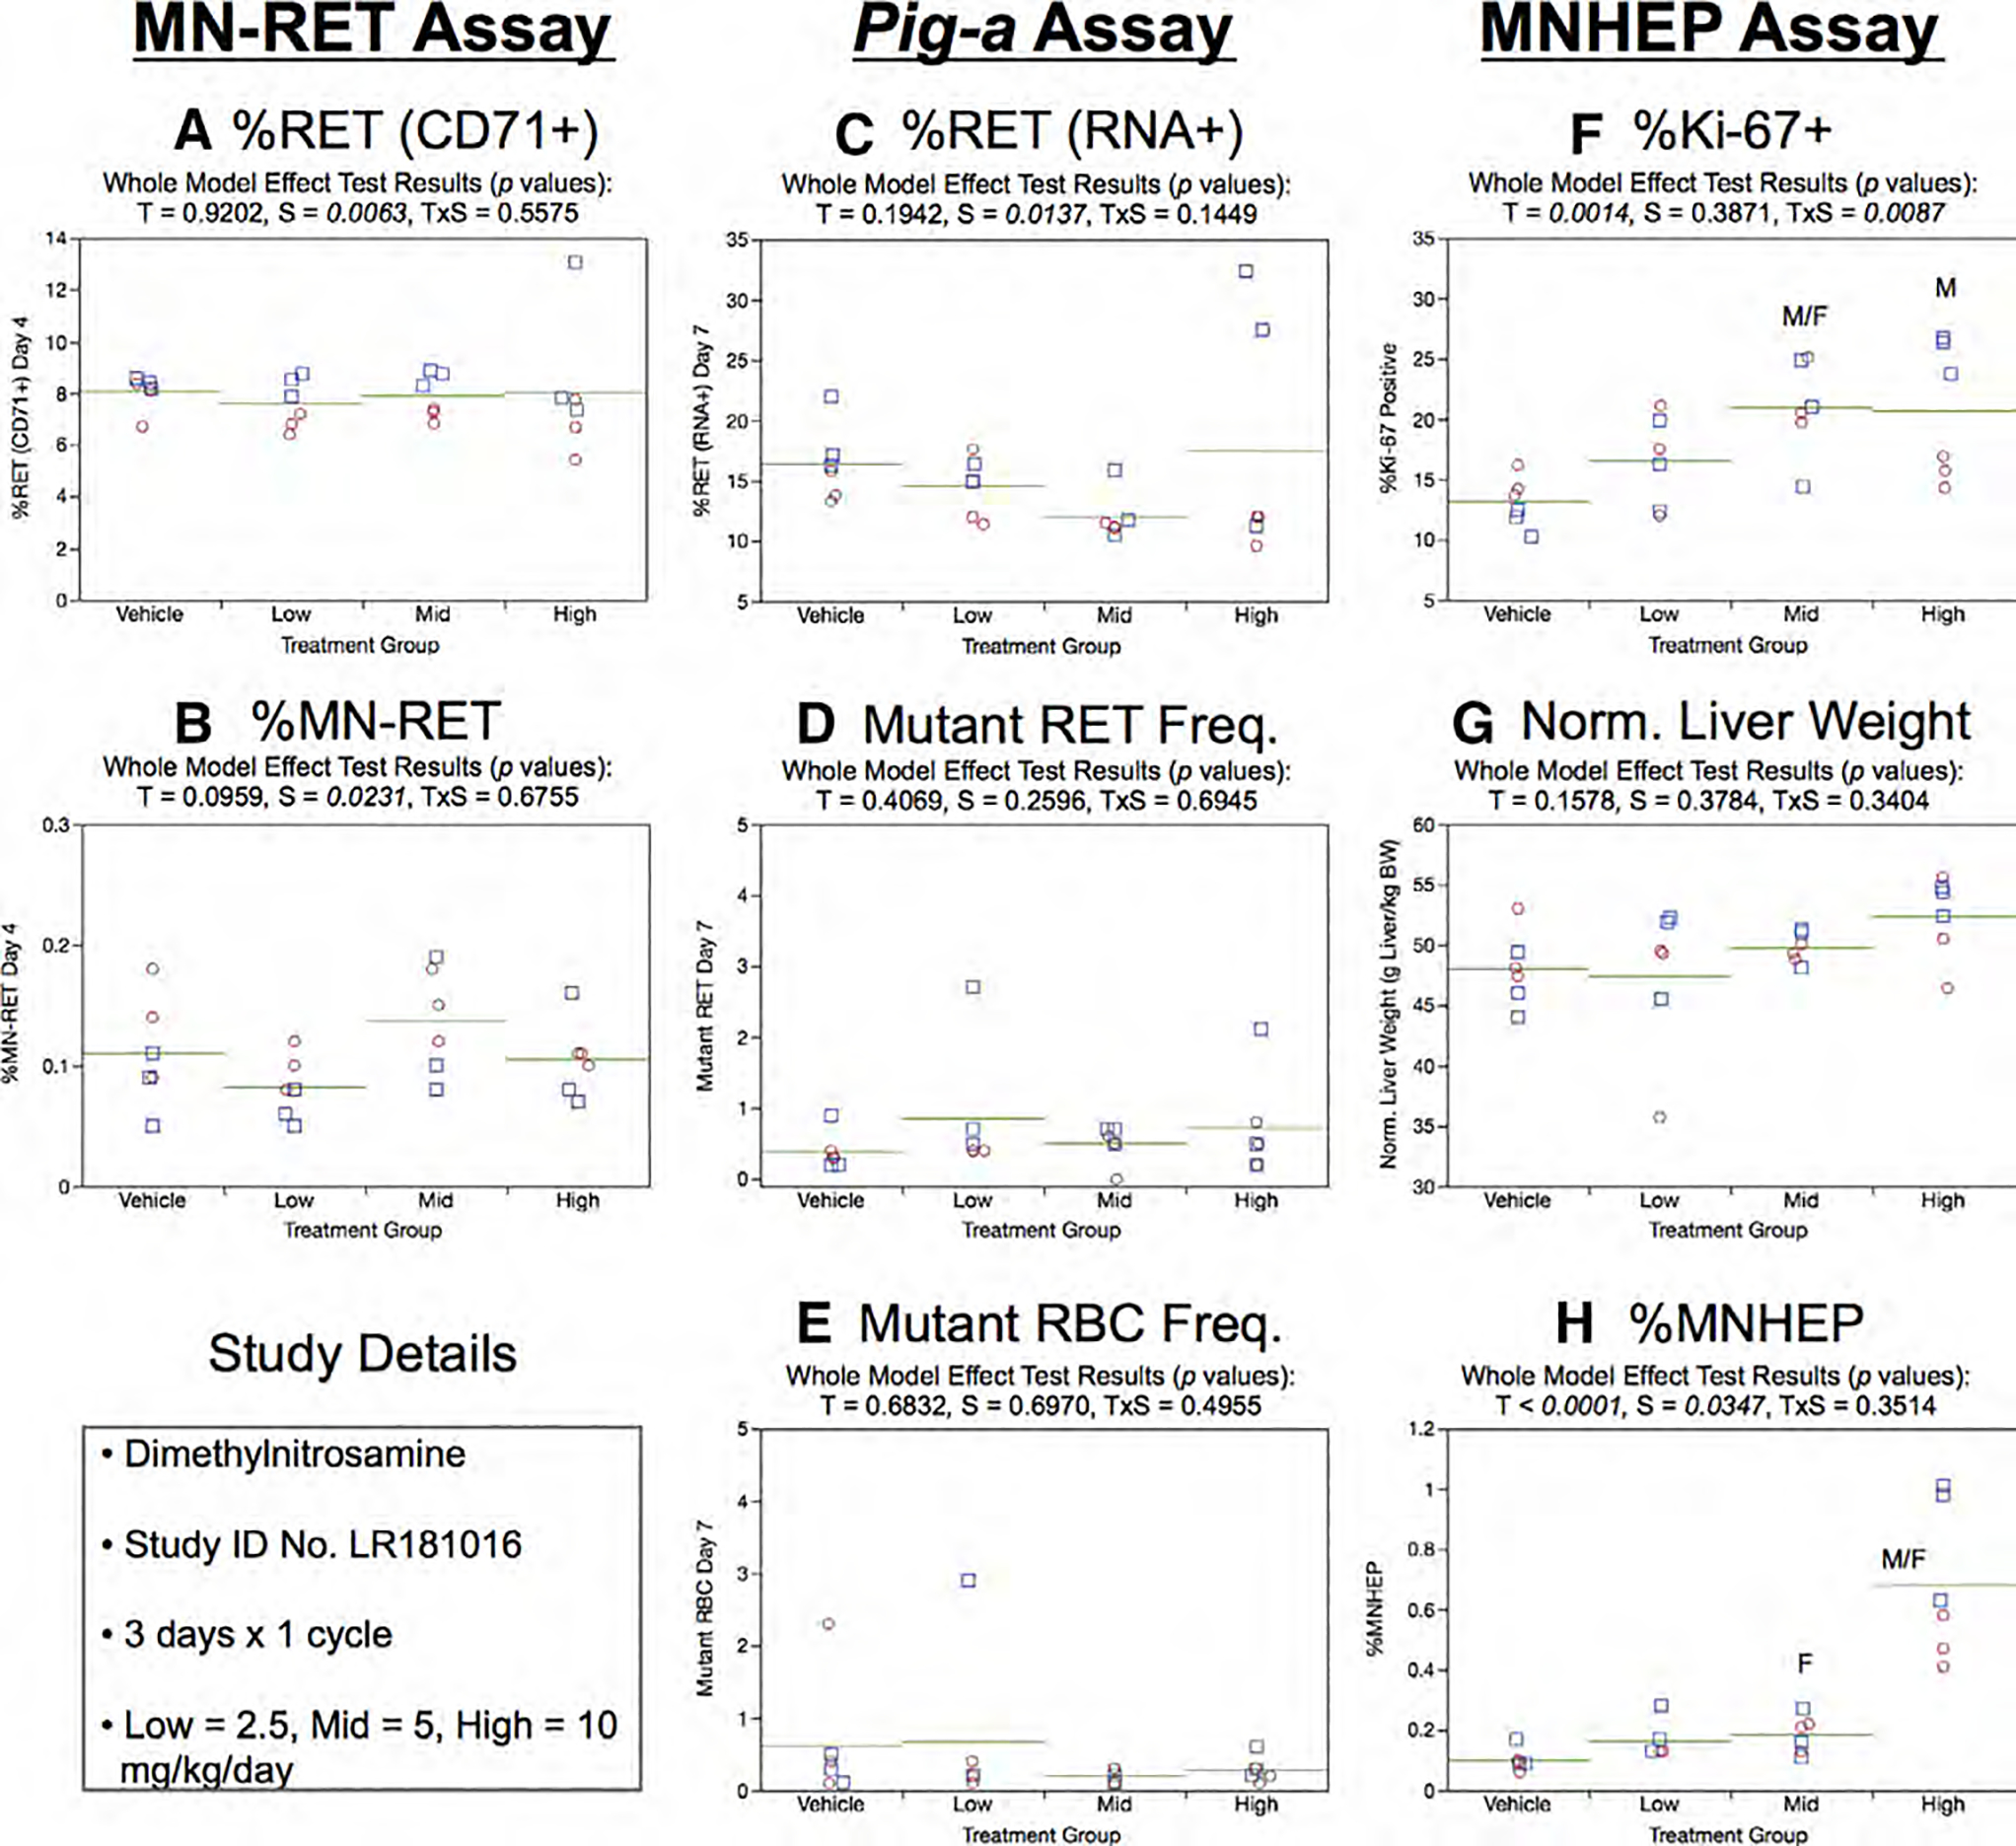
Results from the Dimethylnitrosamine 3 × 1 study. The same abbreviations and graph formats described in Figure 2 legend are used here.
Day 7 %RET (RNA+) generated by the Pig-a assay showed no significant treatment or sex effects (Fig. 14c). Similarly, no effects were observed for RETCD59− and RBCCD59− frequencies (Fig. 14d,e).
Mean Ki-67-positive nuclei frequencies increased in a dose-related manner, with significant effects observed in the mid and high dose groups. A treatment × sex interaction effect was evident, with males seemingly responding to high dose DMN to a greater degree than females. Normalized liver weights showed no treatment or sex effects (Fig. 14g). MNHEP were clearly elevated by high dose DMN in both sexes, whereas only females exhibited a slight but statistically significant effect at the mid dose level (Fig. 14h).
Dimethylnitrosamine, 3 × 3
Three cycles of DMN exposure reduced mean body weight gains over Days 1 through 17: 110, 108, 94, and 74 g for the 0, 2.5, 5, and 10 mg/kg/day dose groups, respectively. Whereas the high dose animals generally tolerated exposure well, one administration was withheld from a single female (sixth of nine) owing to considerable weight loss over the previous 2 days.
Mean %RET (CD71+) decreased with increasing DMN exposure, and the reduction for the high dose group attained statistical significance (Fig. 15a). On the other hand, MN-RET frequencies were not affected by DMN treatment (Fig. 15b).
Fig. 15.
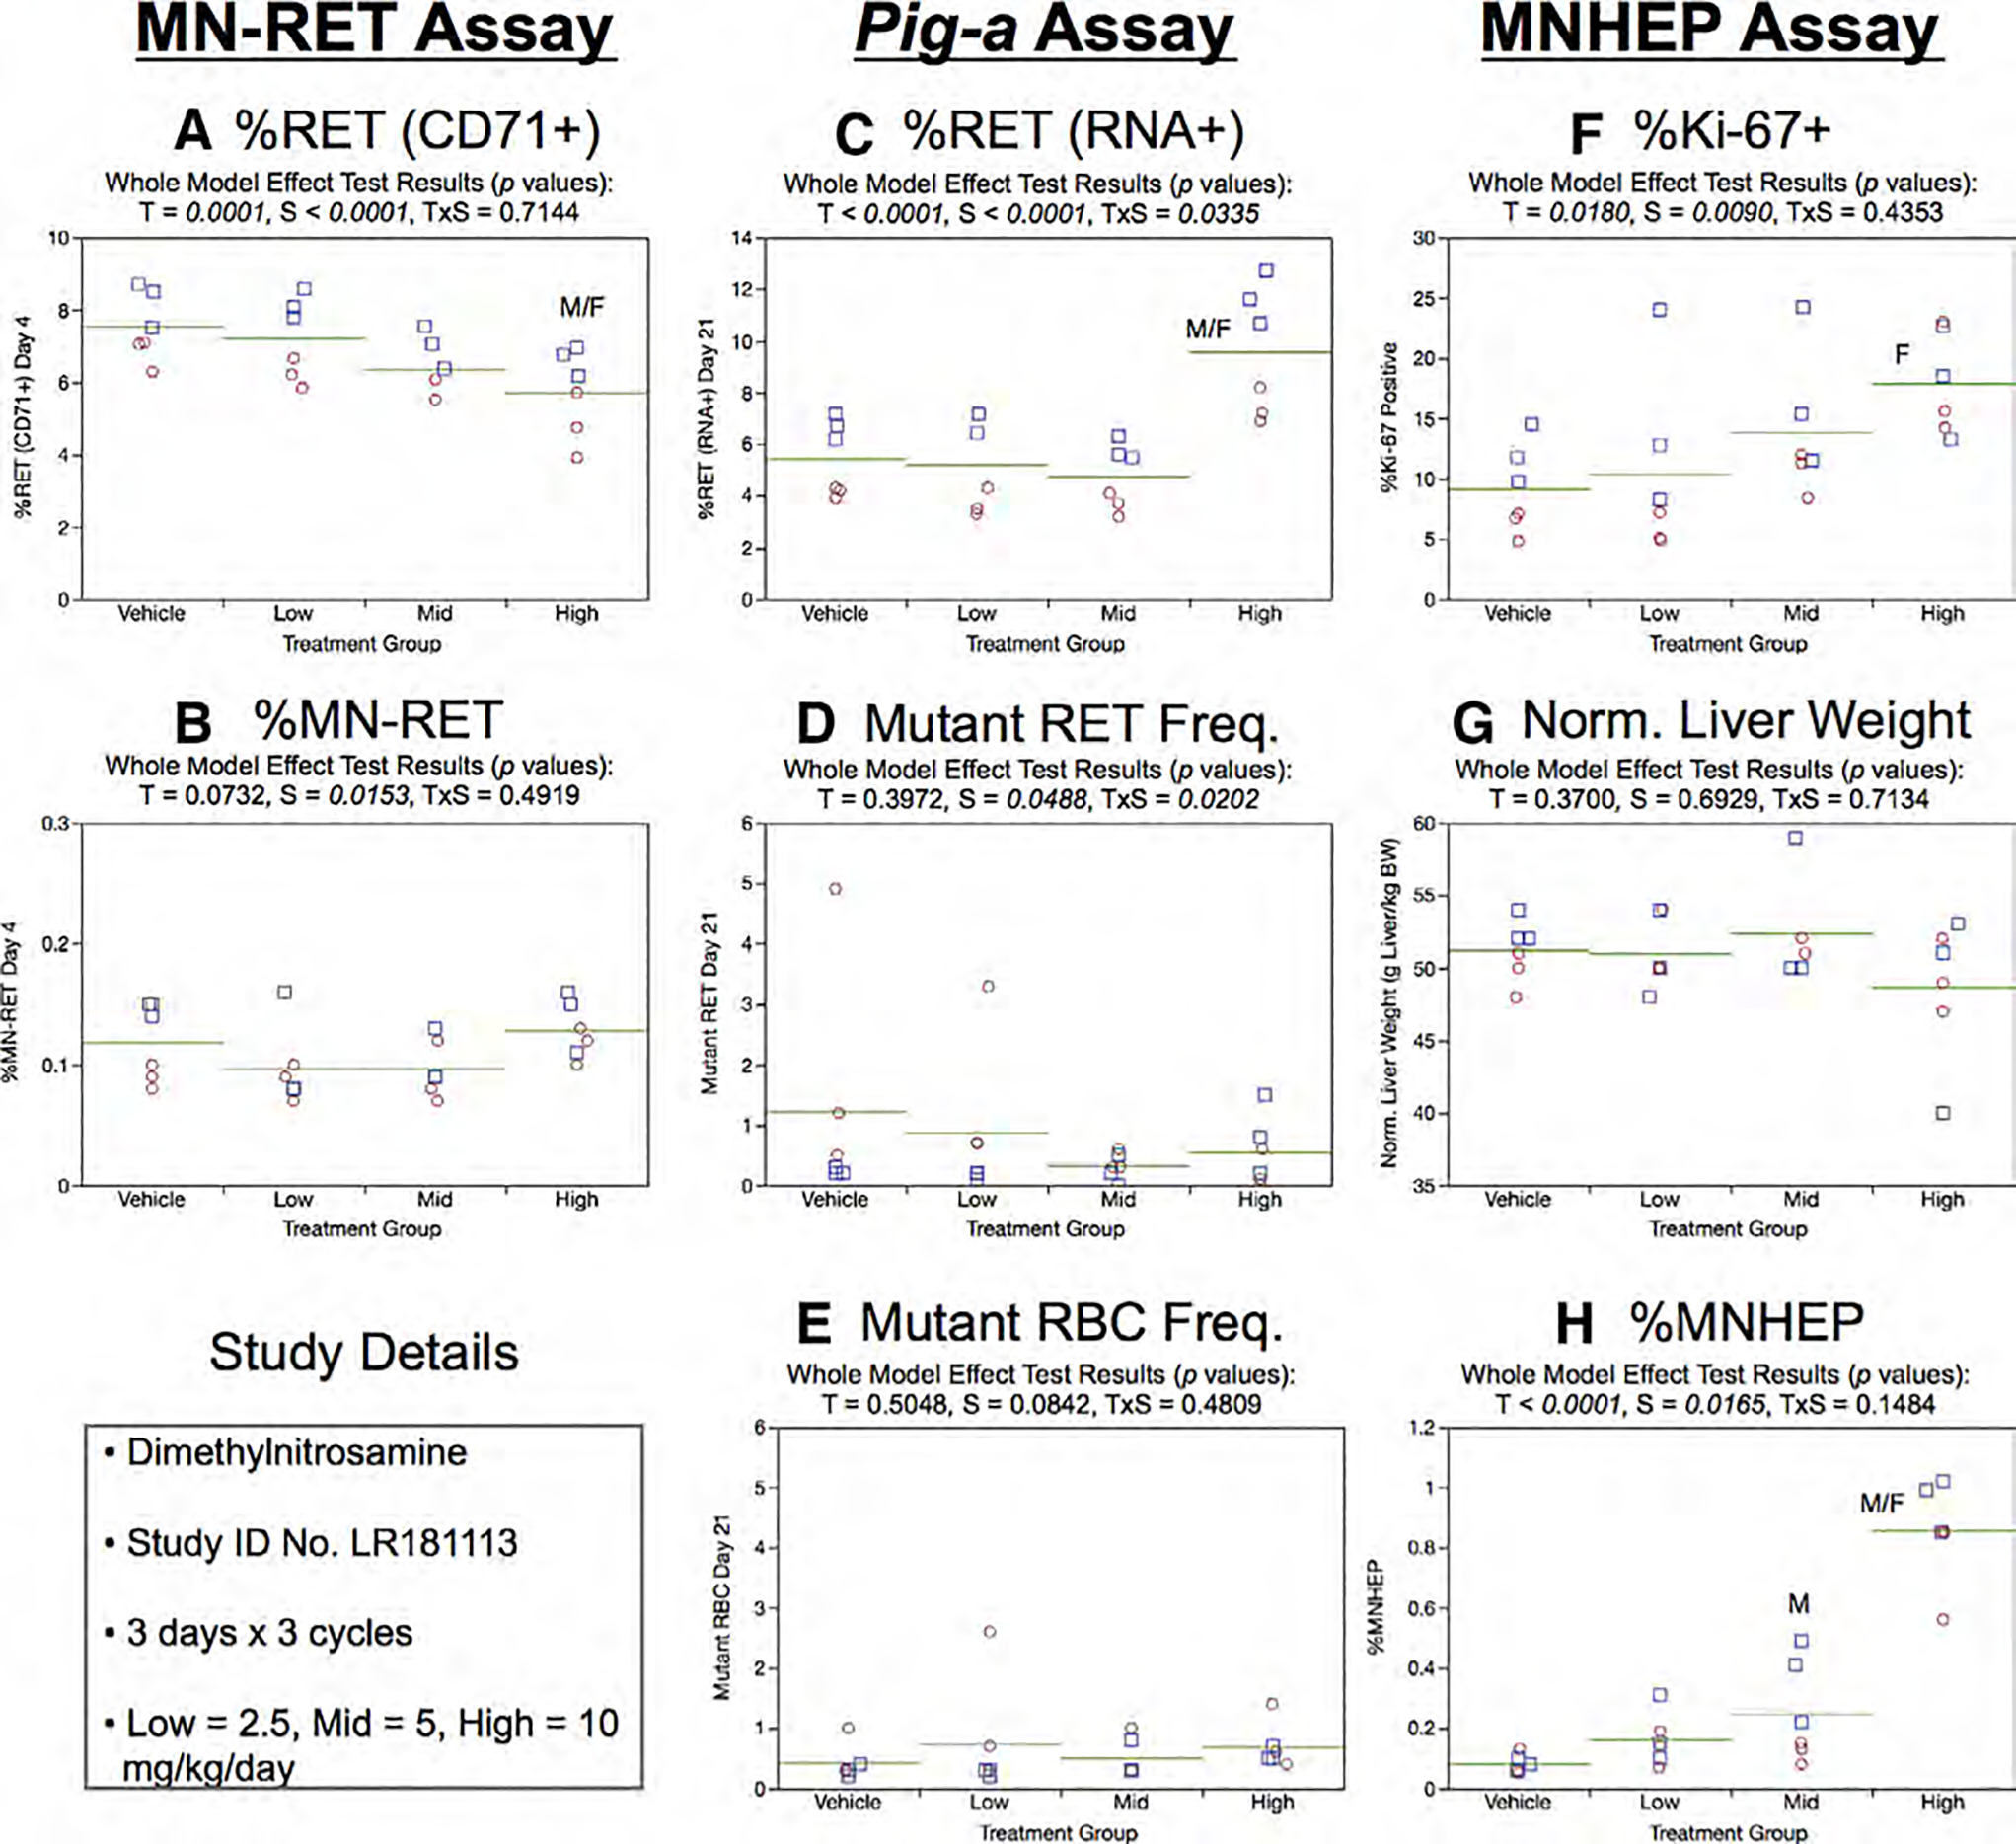
Results from the Dimethylnitrosamine 3 × 3 study. The same abbreviations and graph formats described in Figure 2 legend are used here.
Day 21 RET (RNA+) frequencies were elevated in the high dose group (Fig. 15c). While a slight sex effect was observed for Day 21 RETCD59− frequencies, RETCD59− and RBCCD59− showed no evidence of a significant treatment effect (Fig.15d,e).
Mean %Ki-67-positive nuclei were increased with increasing DMN dose, although only high dose females attained statistical significance (Fig. 15f). Normalized liver weights were not significantly affected by DMN exposure (Fig. 15g). The chromosome damage endpoint MNHEP showed a robust increase in high dose animals of both sexes, whereas the effect only attained statistical significance for mid dose male rats (Fig. 15h).
2,6-Dinitrotoluene, 3 × 1
One cycle of 2,6-DNT exposure slightly reduced mean body weight gain in the high dose group over Days 1 through 4: 20, 22, 22, and 16 g for the 0, 25, 50, and 100 mg/kg/day dose groups, respectively. Together with no other outward signs of toxicity, these data suggest the dose levels chosen for this study were well tolerated.
As shown by Figure 16a,b, neither Day 4 %RET (CD71 +) nor %MN-RET were affected by exposure to 2,6-DNT.
Fig. 16.
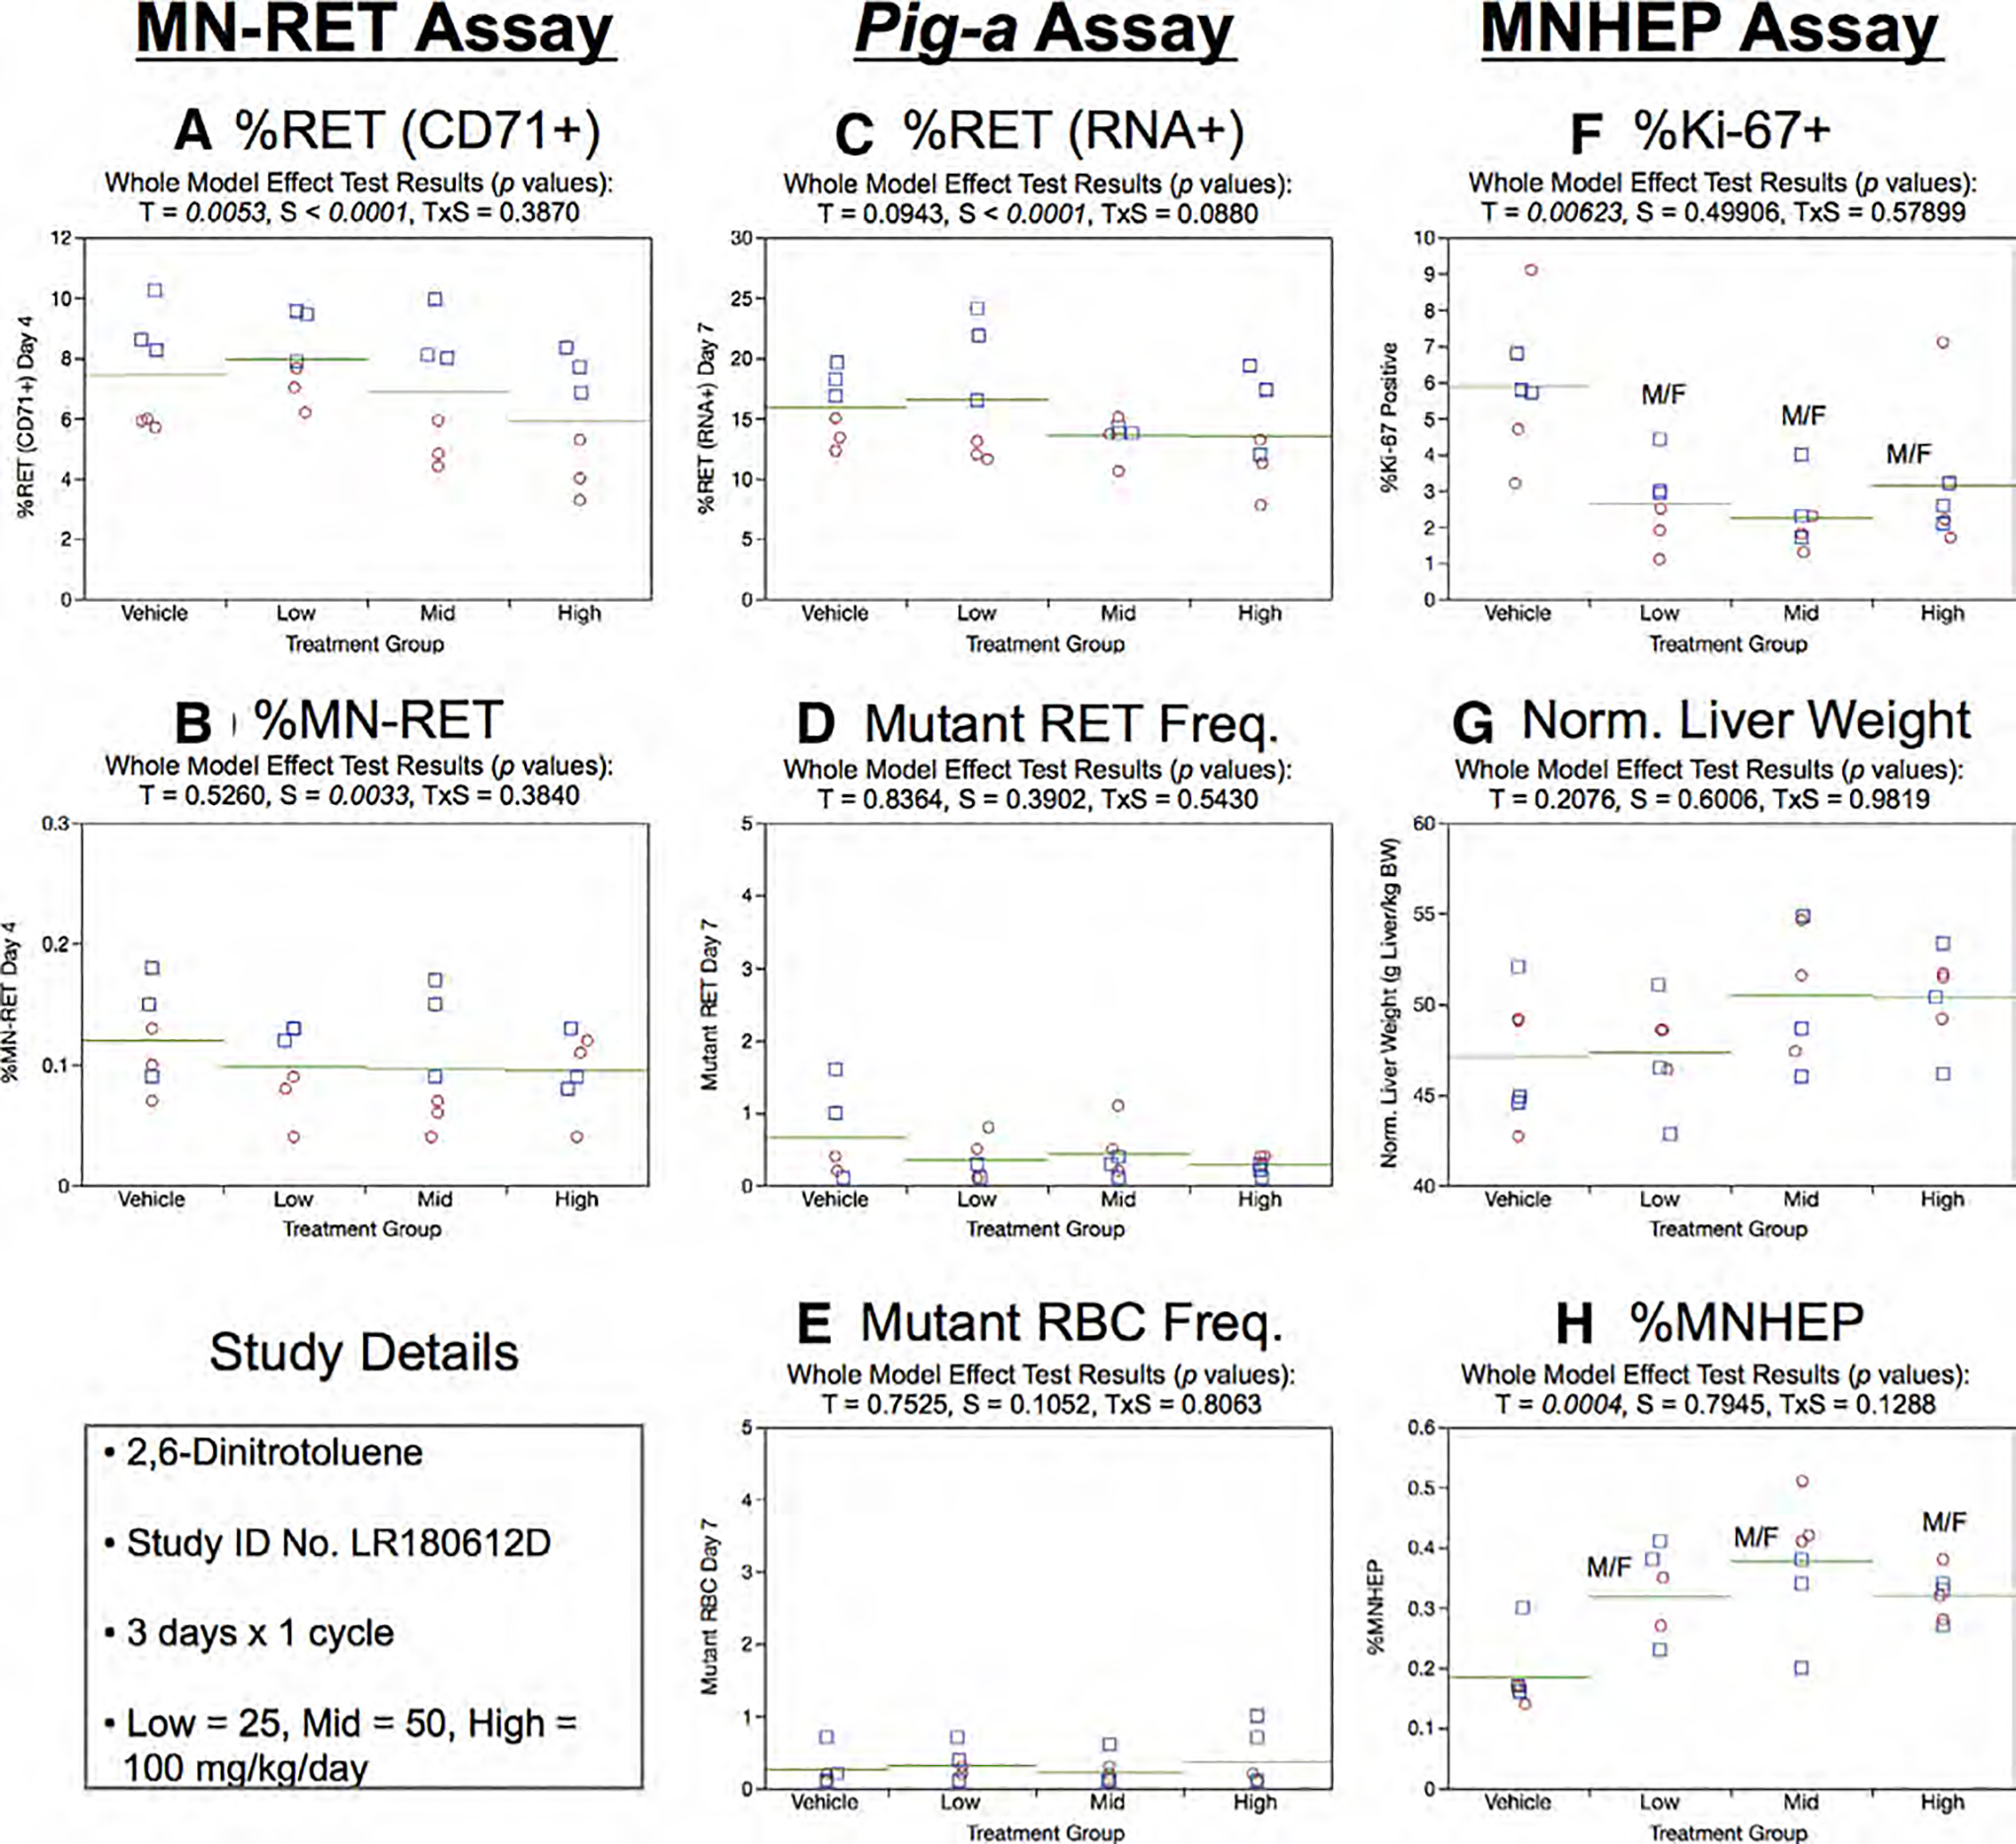
Results from the 2,6-Dinitrotoluene 3 × 1 study. The same abbreviations and graph formats described in Figure 2 legend are used here.
Day 7 %RET (RNA+) showed no treatment effect, although sex was a significant factor in this experiment, with males exhibiting slightly higher frequencies compared to females (Fig. 16c). Neither treatment nor sex were observed to affect RETCD59− and RBCCD59− frequencies (Fig. 16d,e).
Mean %Ki-67-positive nuclei were significantly decreased in each 2,6-DNT exposed group compared to vehicle controls (Fig. 16f). Normalized liver weights were not affected by treatment or sex (Fig. 16g). On the other hand, small but significant increases in MNHEP frequencies were observed in each of the 2,6-DNT exposed groups (Fig. 16h).
2,6-Dinitrotoluene, 3 × 3
Three cycles of 2,6-DNT exposure reduced mean body weight gains over Days 1 through 17: 111, 101, 97, and 94 g for the 0, 25, 50, and 100 mg/kg/day dose groups, respectively. As with the 3 × 1 study, these dose levels appeared to be well tolerated in this repeated cycle experimental design.
As shown in Figure 17a,b, mean Day 4 RET (CD71+) frequencies and %MN-RET were not affected by 2,6-DNT exposure.
Fig. 17.
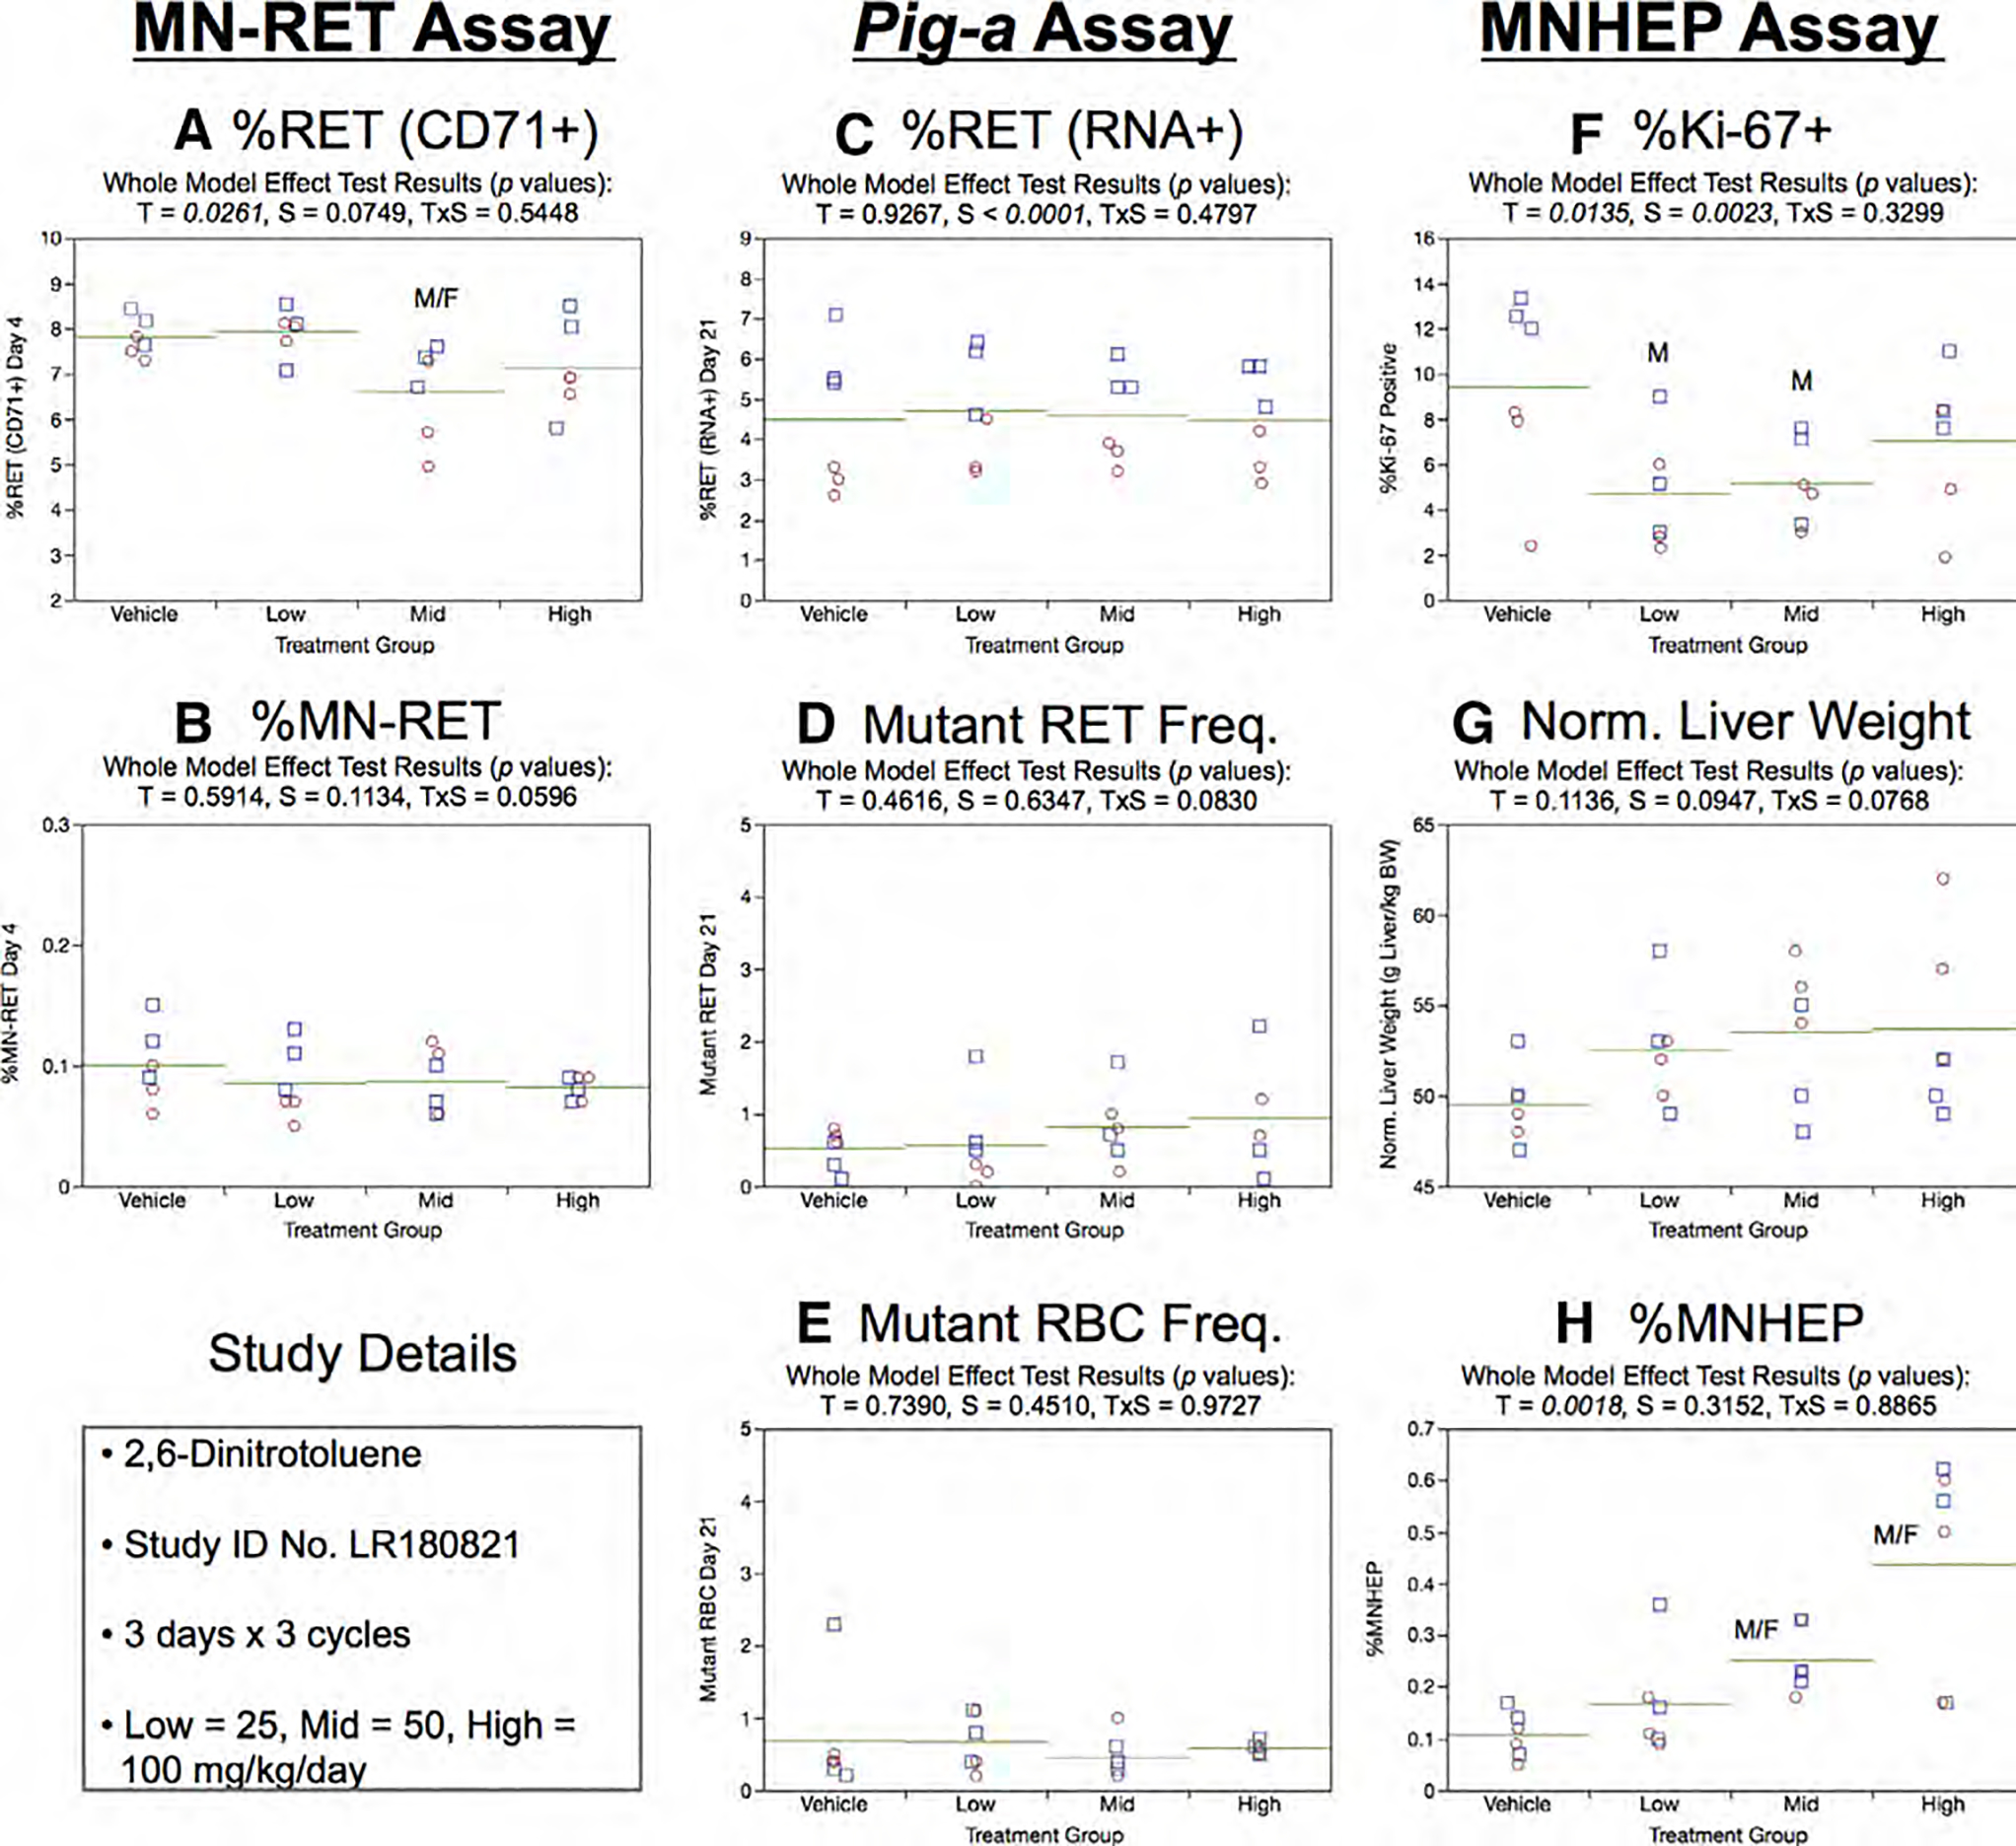
Results from the 2,6-Dinitrotoluene 3 × 3 study. The same abbreviations and graph formats described in Figure 2 legend are used here.
Day 21 RET (RNA+) frequencies in the Pig-a assay were not influenced by treatment or sex (Fig. 17c). Neither mean RETCD59− nor RBCCD59− frequencies showed evidence of a treatment or sex effect (Fig. 17d,e).
Mean %Ki-67-positive nuclei were lower in each 2,6-DNT exposed group, although statistical significance was only achieved for low and mid dose males (Fig. 17f). Normalized liver weights were not affected by 2,6-DNT (Fig. 17g). MNHEP frequencies showed dose-related increases that were statistically significant for the mid and high dose groups (Fig. 17h).
Hydroxyurea, 3 × 1
One cycle of HU had a modest effect on mean body weight gain in the high dose group over Days 1 through 4: 17, 18, 17, and 12 g for the 0, 31.25, 62.5, and 125 mg/kg/day dose groups, respectively. Coupled with no other outward signs of toxicity, these results suggest the HU dose levels used in this study were well tolerated.
As shown by Figure 18a, Day 4 %RET (CD71+) were significantly reduced in mid and high dose groups. This effect on erythropoiesis function was accompanied by a dose-related increase in MN-RET frequencies (Fig. 18b).
Fig. 18.
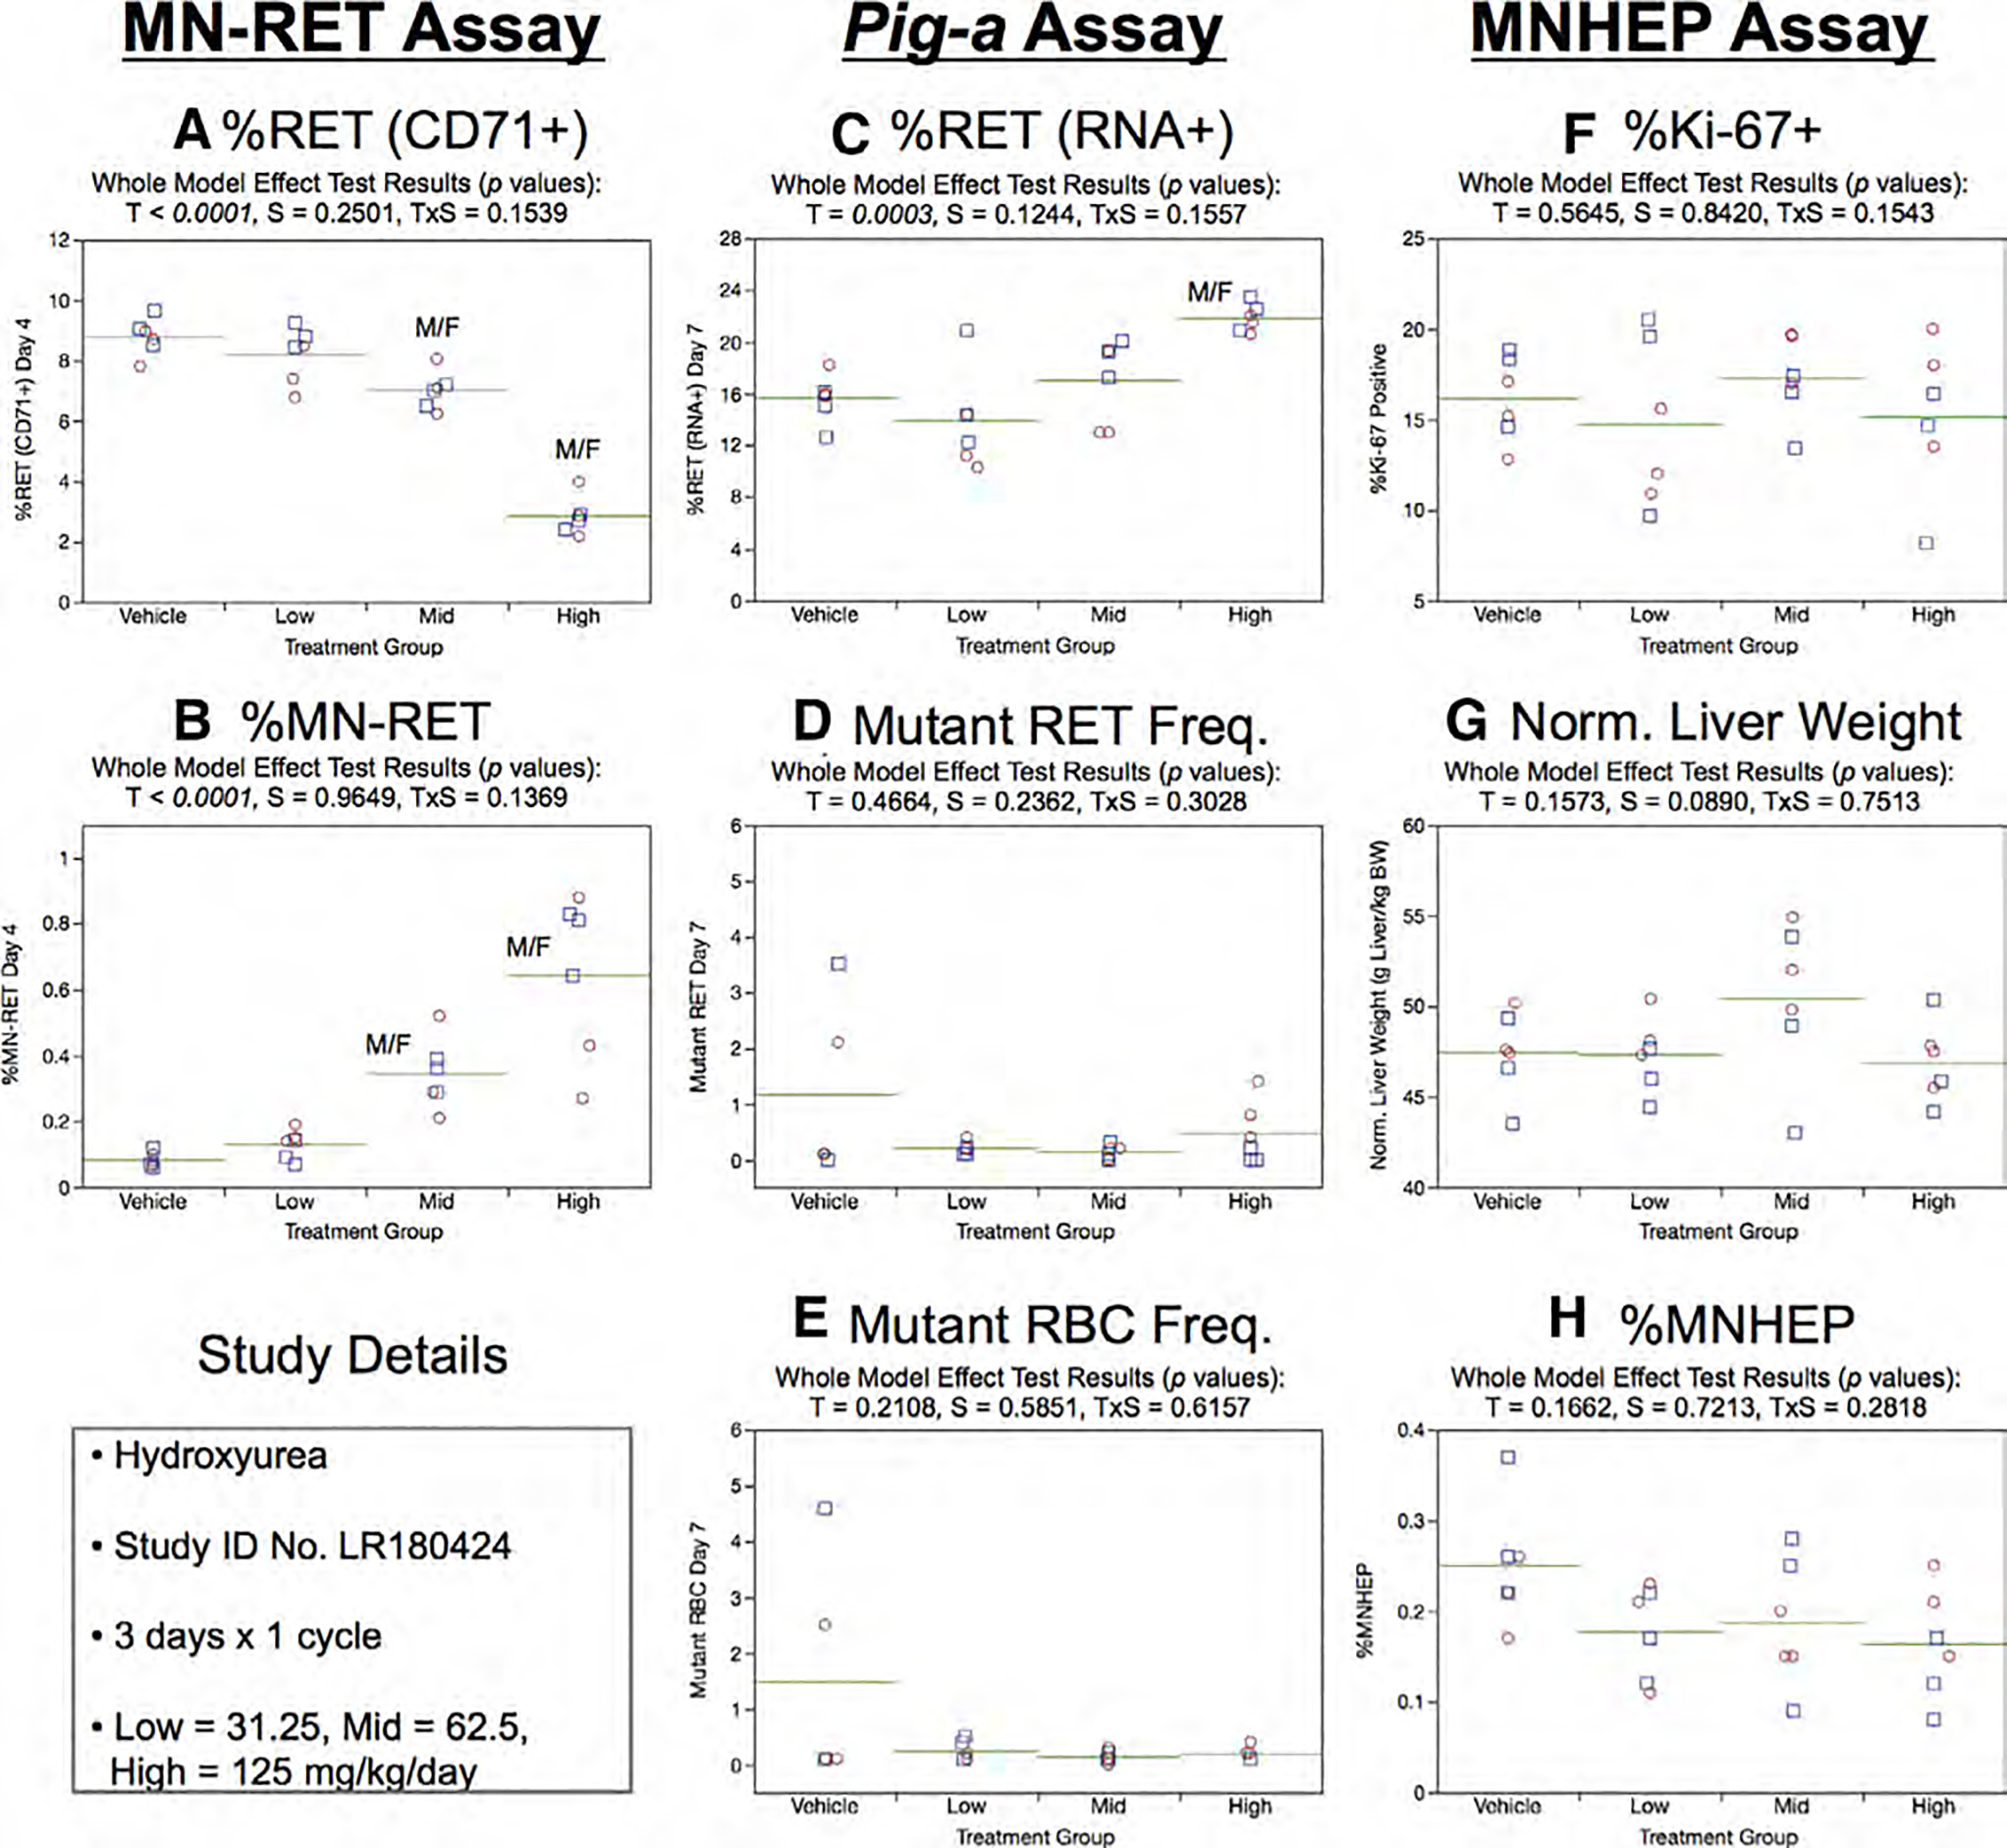
Results from the Hydroxyurea 3 × 1 study. The same abbreviations and graph formats described in Figure 2 legend are used here.
High dose group animals exhibited elevated %RET (RNA+) on Day 7 (Fig. 18c). On the other hand, no treatment or sex effects were evident for Day 7 RETCD59− and RBCCD59− endpoints (Fig. 18d,e).
Regarding the liver tissue analyses, no treatment or sex effects were found for %Ki-67-positive nuclei (Fig. 18f), normalized liver weights (Fig. 18g), or % MNHEP (Fig. 18h).
Hydroxyurea, 3 × 3
As with the 3 × 1 study, three cycles of HU exposure modestly affected mean body weight gains across exposure groups over Days 1 through 17: 107, 95, 85, and 97 g for the 0, 31.25, 62.5, and 125 mg/kg/day dose groups, respectively. Coupled with no other outward signs of toxicity, these results suggest the HU dose levels used in this study were well tolerated.
As shown by Figure 19a, Day 4 %RET (CD71+) values were significantly reduced in the high dose group, while MN-RET were clearly induced in the mid and high dose groups (Fig. 19b).
Fig. 19.
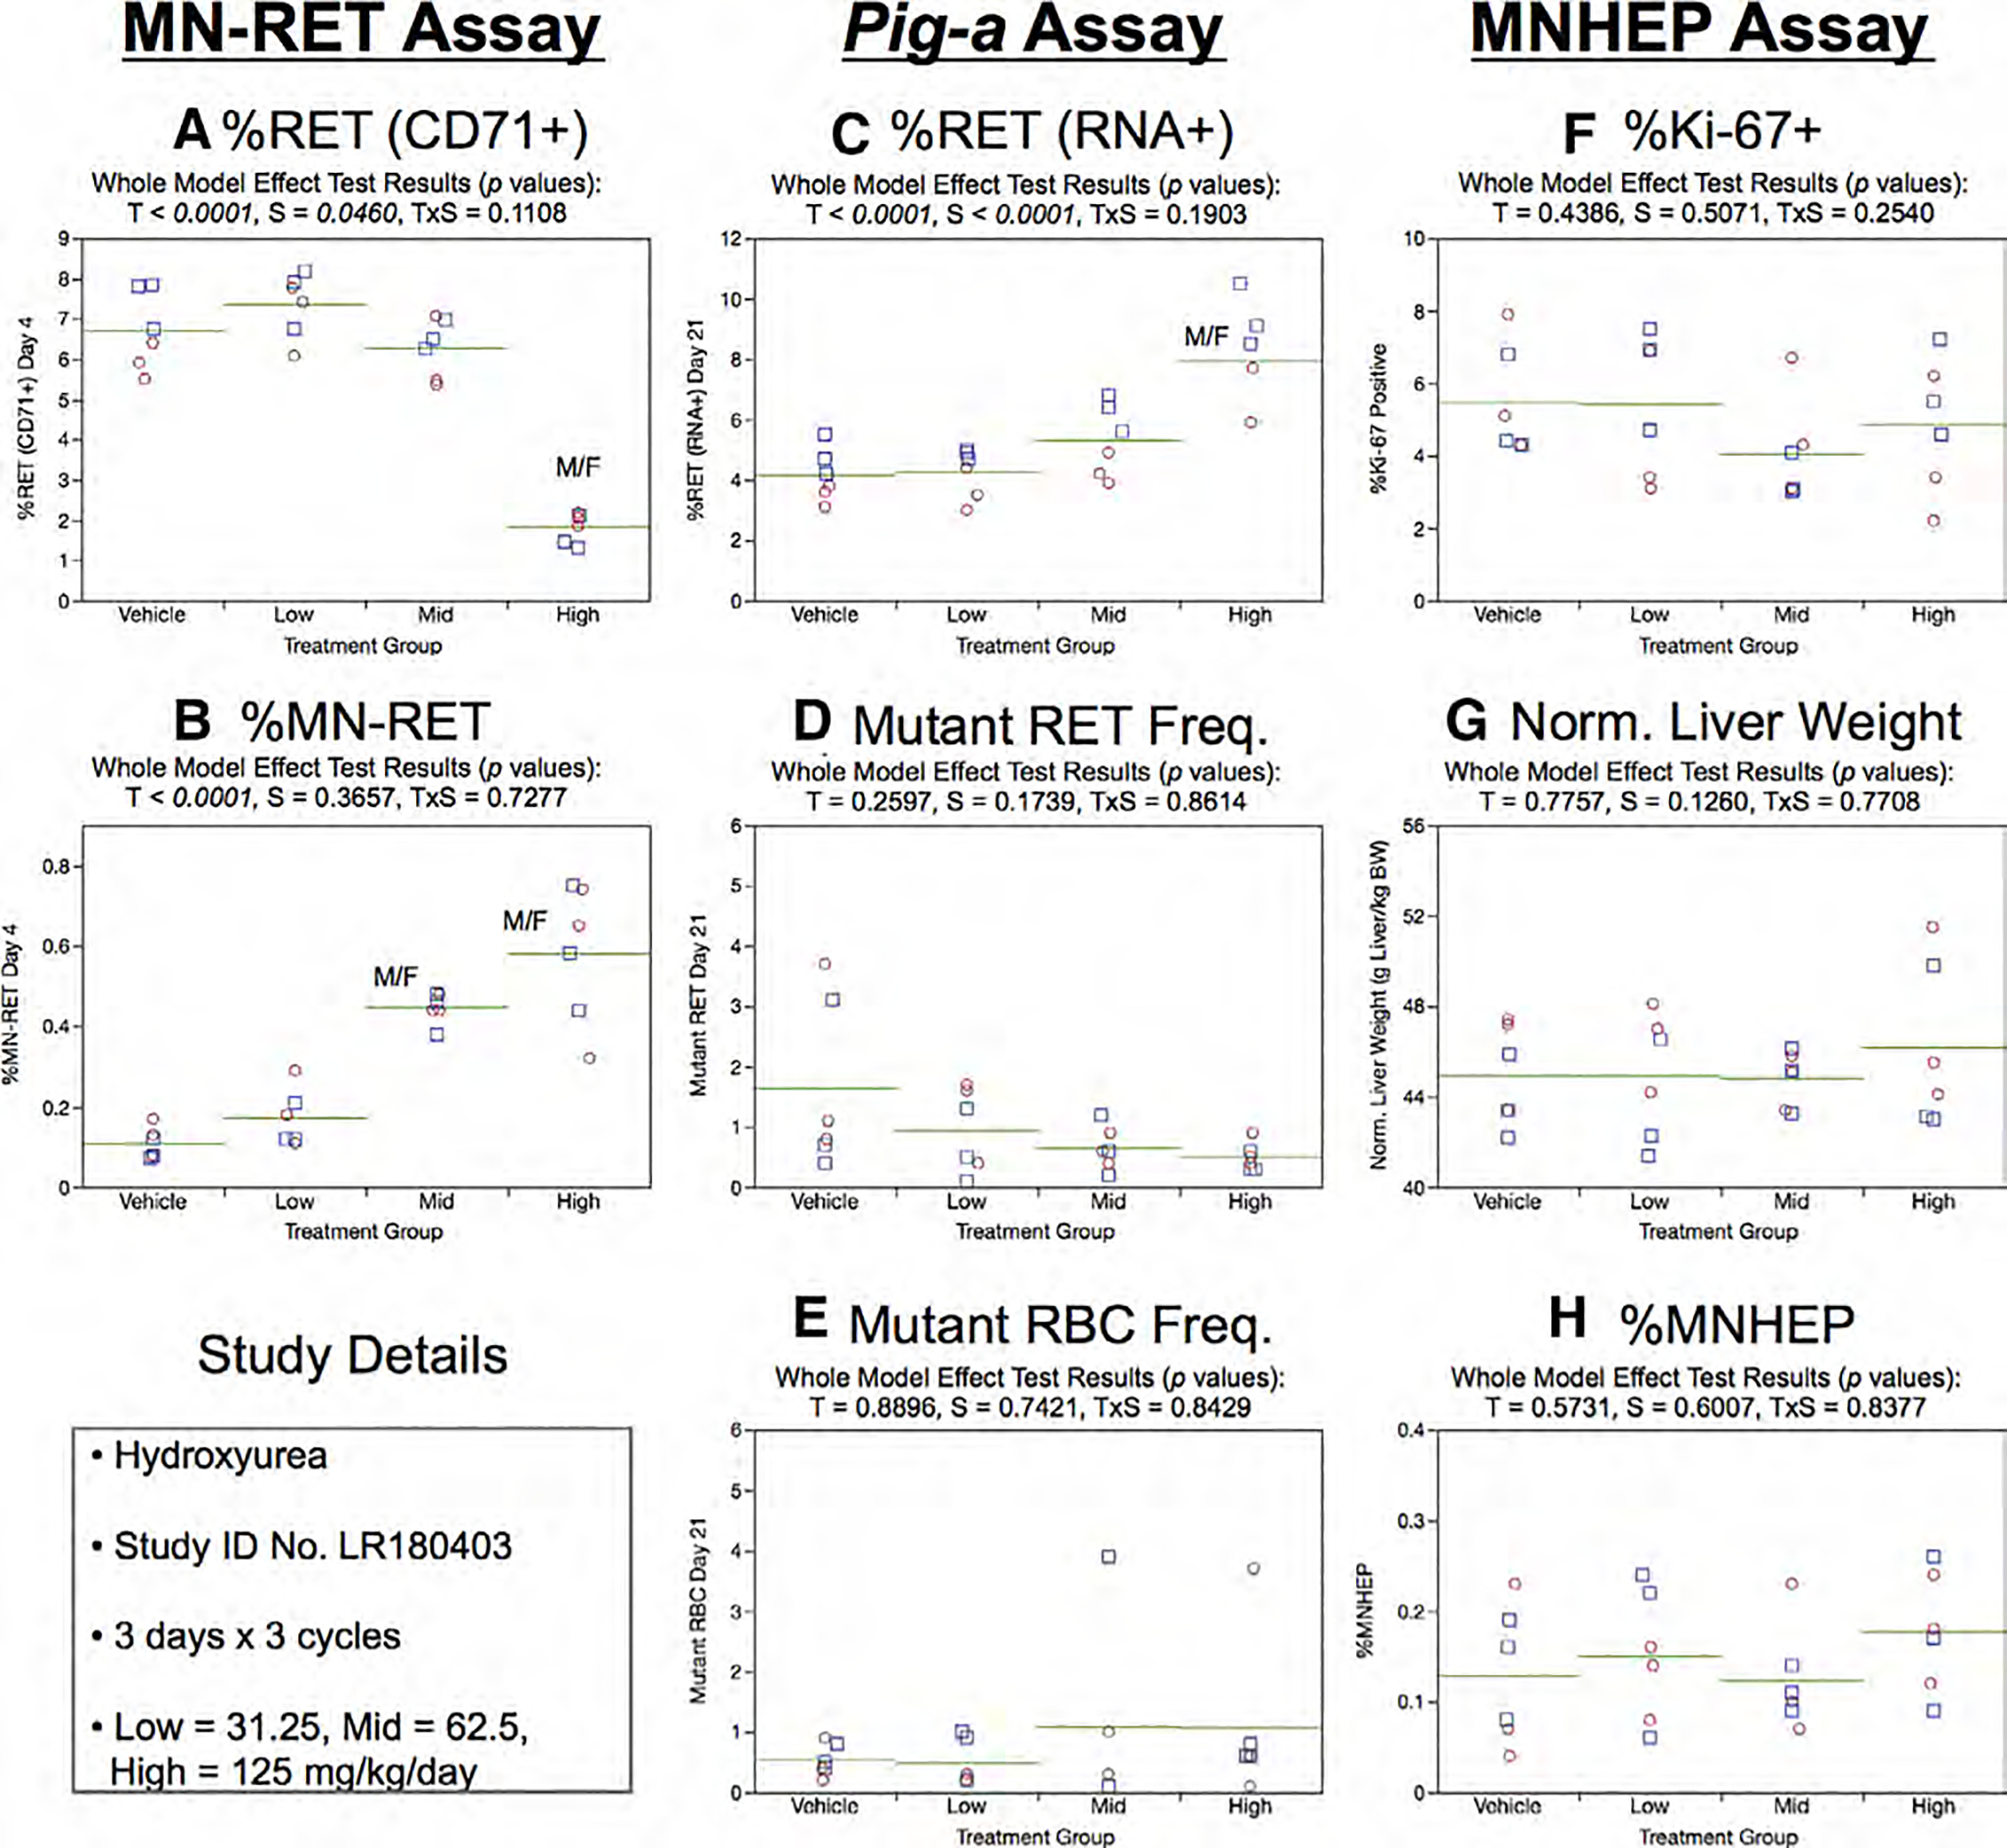
Results from the Hydroxyurea 3 × 3 study. The same abbreviations and graph formats described in Figure 2 legend are used here.
High dose group animals exhibited elevated %RET (RNA+) on Day 21 (Fig. 19c). However, no treatment or sex effects were evident for the RETCD59− and RBCCD59− endpoints (Fig. 19d,e).
As with the 3 × 1 study, three cycles of HU exposure had no effect on the liver-based measurements. That is, no treatment or sex effects were found for %Ki-67-positive nuclei (Fig. 19f), normalized liver weights (Fig. 19g), or % MNHEP (Fig. 19h).
Melphalan, 3 × 1
One cycle of MEL exposure slightly reduced mean body weight gain in the high dose group over Days 1 through 4: 20, 21, 20, and 16 g for the 0, 0.375, 0.75, and 1.5 mg/kg/day dose groups, respectively.
As shown in Figure 20a, 2-factor ANOVA indicated that treatment and sex were significant factors for Day 4 %RET (CD71+), although pair-wise testing on individual sexes were not powerful enough to detect the responsible exposure group(s). MN-RET responses exhibited clear dose-related effects, with statistical significance observed in each MEL-exposed female group, and in the case of males in the mid and high dose groups (Fig. 20b).
Fig. 20.
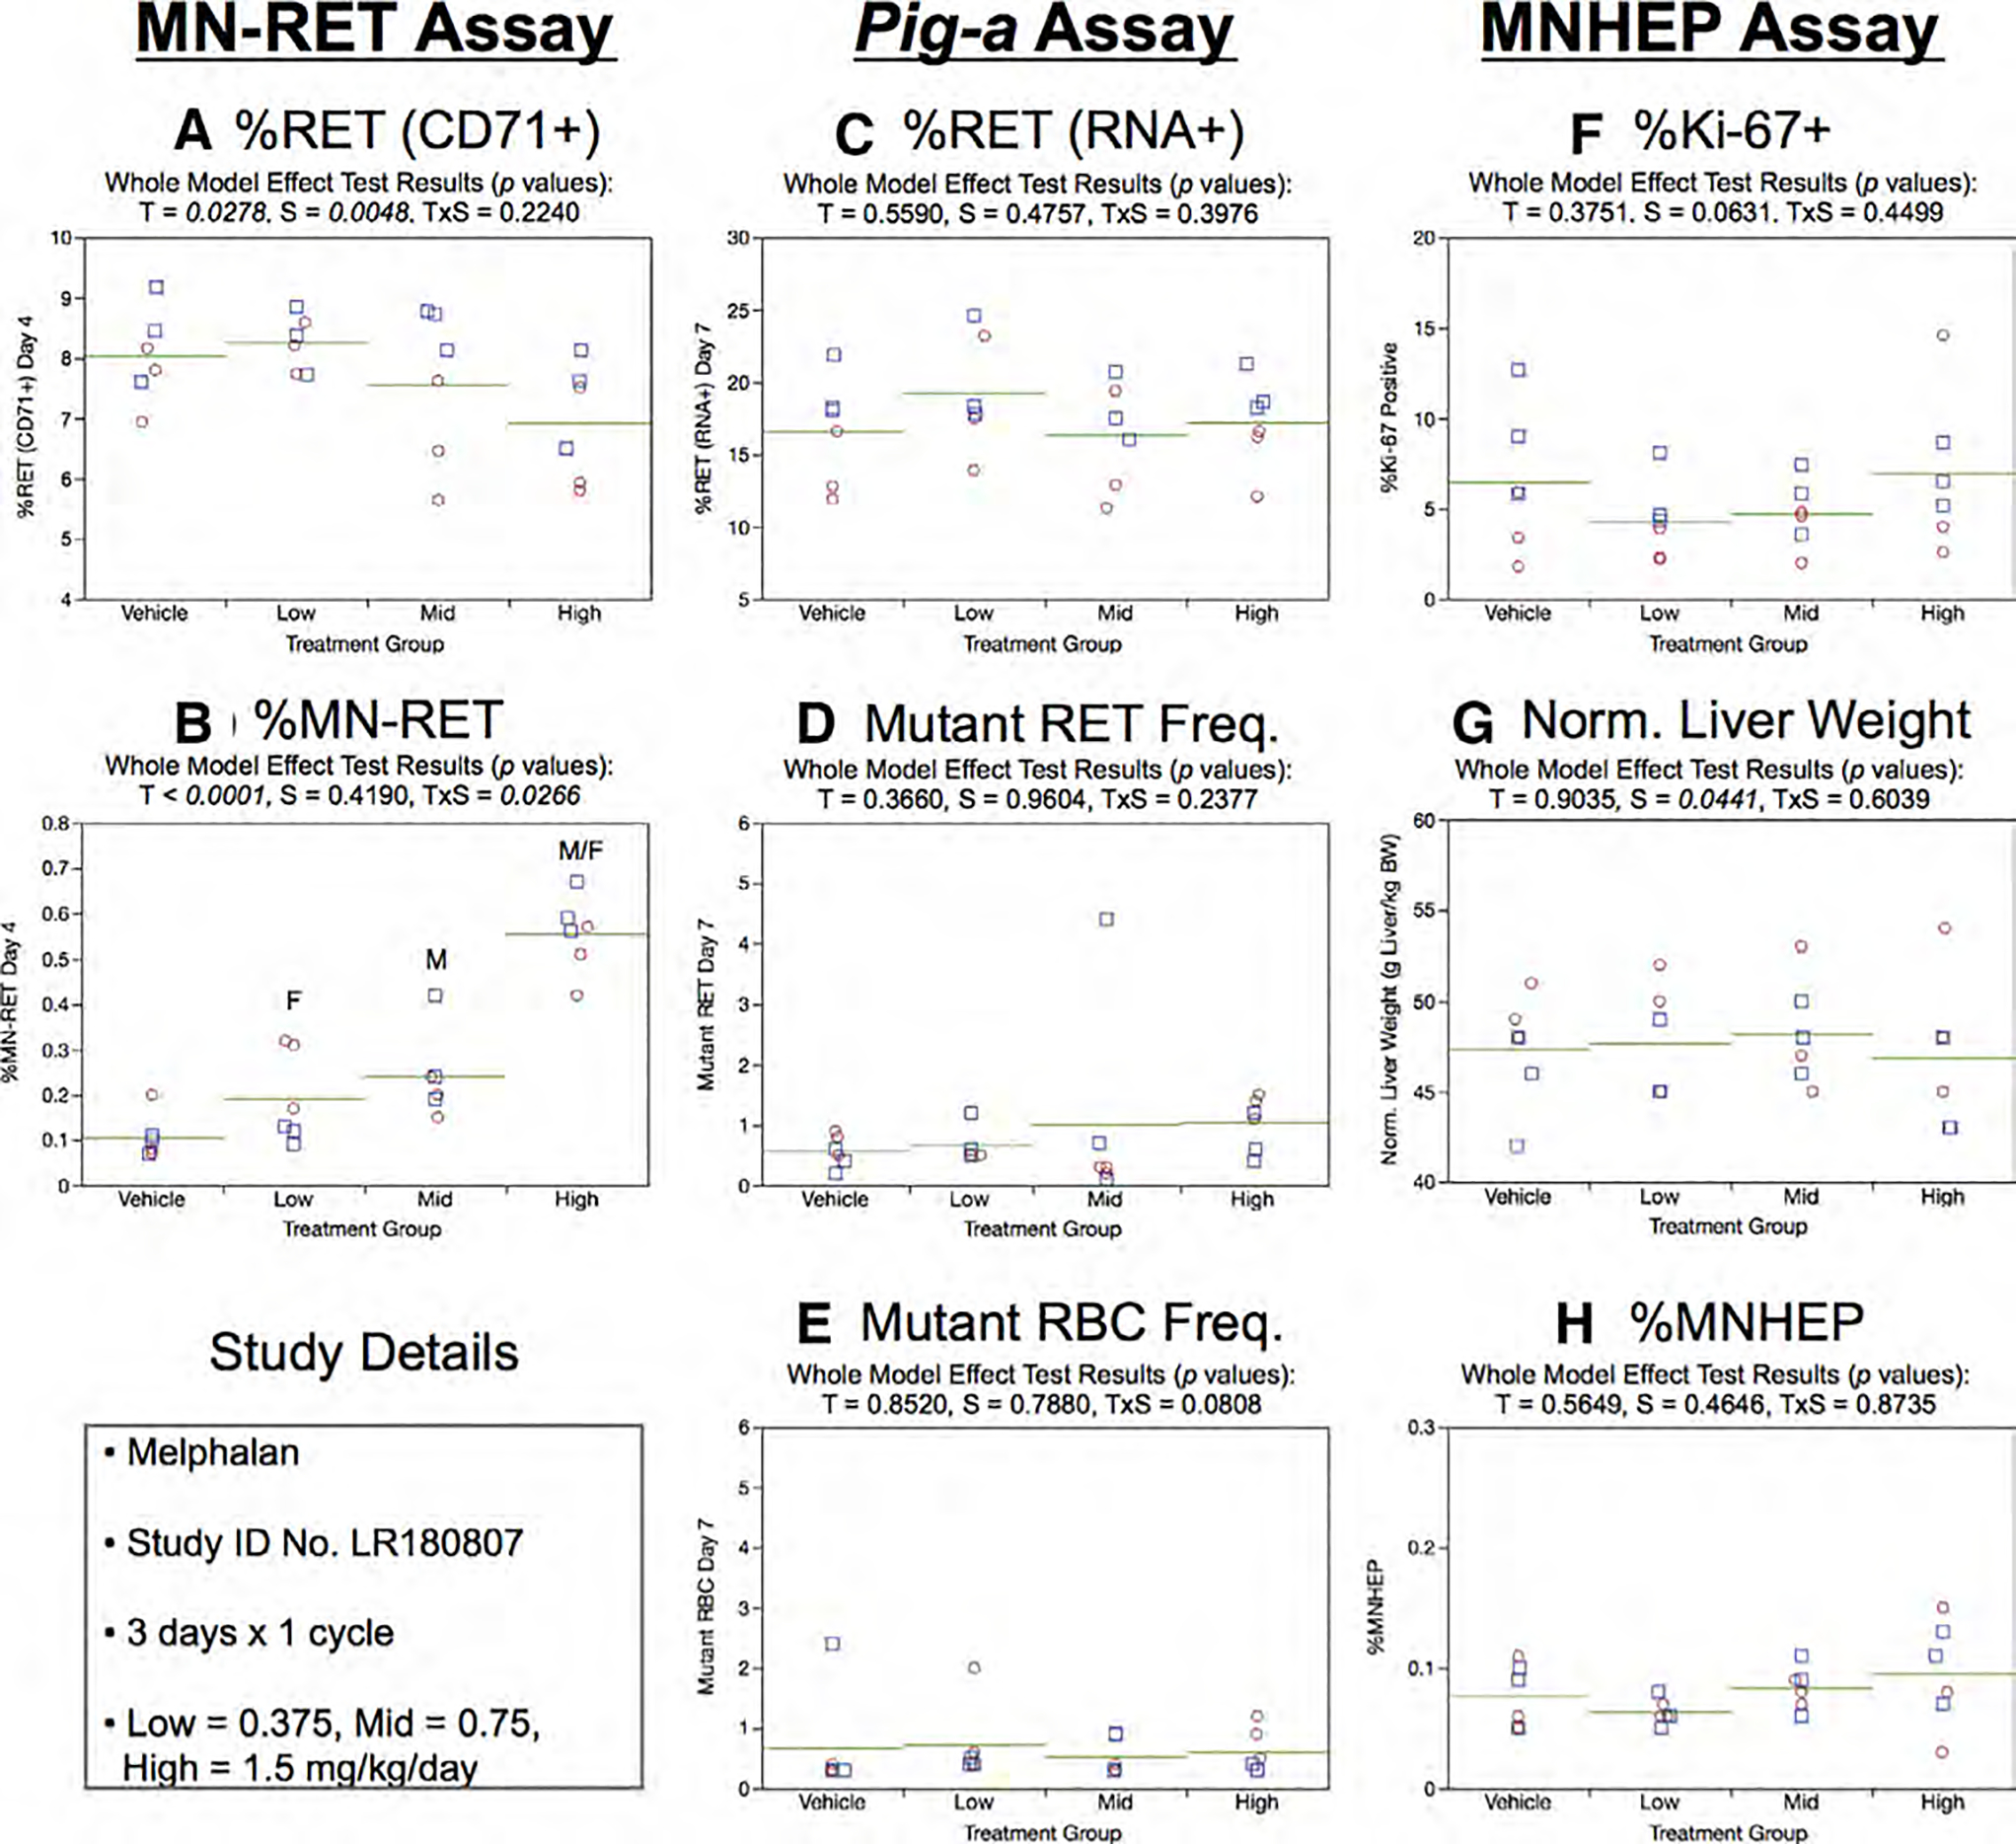
Results from the Melphalan 3 × 1 study. The same abbreviations and graph formats described in Figure 2 legend are used here.
In the 3 × 1 study design, %RET (RNA+), RETCD59−, and RBCCD59− endpoints were not affected by treatment or sex (Fig. 20c,d,e, respectively).
One cycle of MEL exposure had no effect on the liver-based measurements. This was the case for %Ki-67-positive nuclei (Fig. 20f), normalized liver weights (Fig. 20g), and %MNHEP (Fig. 20h).
Melphalan, 3 × 3
After observing slight indications of toxicity in the 3 × 1 study, above, the 3 × 3 study was revised to include 3 mg/kg/day as the high dose (as opposed to 1.5 mg/kg/day as described above). Even with this adjustment, only modest differences in mean body weight gains over Days 1 through 17 were evident after three cycles of MEL exposure: 108, 95, 102, and 94 g for the 0, 7.5, 1.5, and 3 mg/kg/day dose groups, respectively.
Similar to the 3 × 1 study, 2-factor ANOVA indicated that treatment and sex were significant factors for Day 4 % RET (CD71+) (Fig. 21a), although pair-wise testing on individual sexes did not reach statistical significance. MN-RET responses exhibited clear dose-related effects, with statistical significance observed for both sexes in mid and high dose groups (Fig. 21b).
Fig. 21.
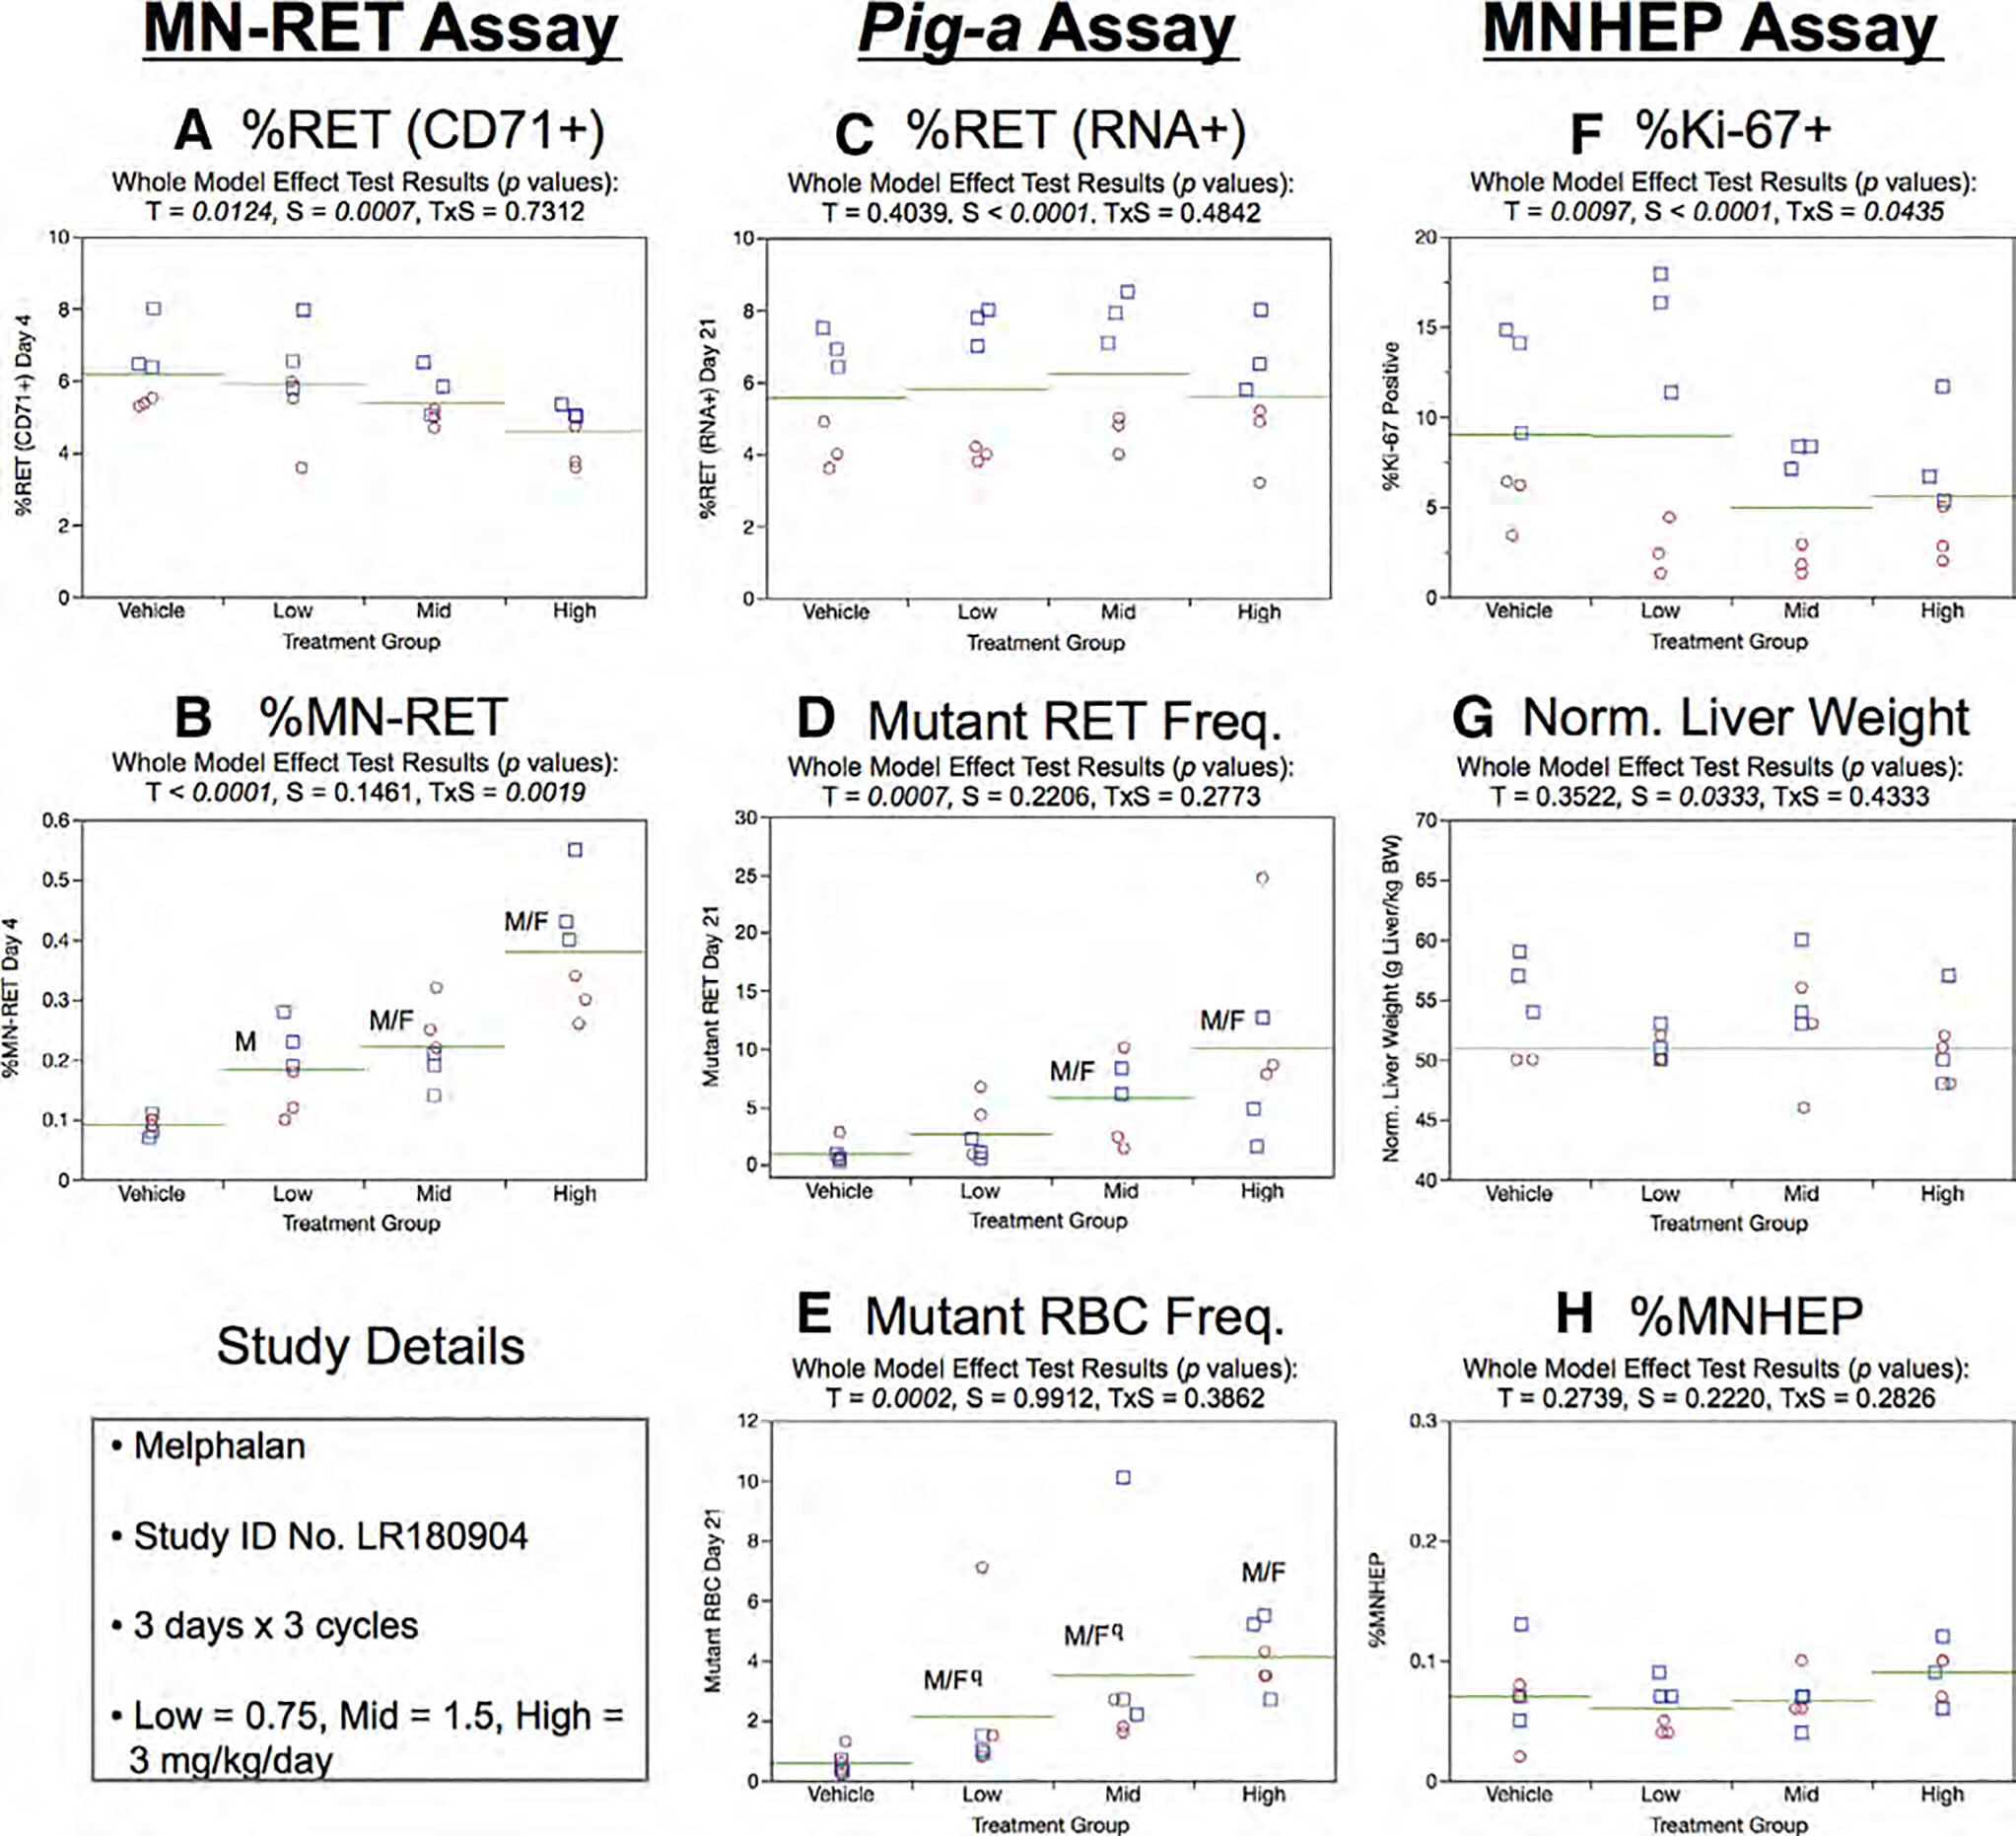
Results from the Melphalan 3 × 3 study. The same abbreviations and graph formats described in Figure 2 legend are used here. The use of superscript q in panel e denotes Pig-a statistical significance is qualified because more than half the mutant cell frequencies were within the historical negative control distribution.
Day 21 RET (RNA+) frequencies showed no significant treatment or sex effects (Fig. 21c). On the other hand, mean RETCD59− frequencies were significantly elevated in the mid and high treatment groups, and at least half of the rats in each of these groups exceeded the historical negative control distribution’s 95% tolerance interval. Although statistically significant increases in RBCCD59− were found for each MEL dose level (Fig. 21e), the low and mid dose groups are qualified because the majority of rats’ RBCCD59− frequencies were within the historical negative control distribution.
Repeated cycles of MEL exposure were observed to cause treatment and treatment × sex interaction effect to % Ki-67-positive nuclei, with generally lower values with increasing dose (Fig. 21f). However, when pair-wise testing was conducted with the sexes separated, no significant differences were identified. No evidence of treatment or sex effects were found in the case of normalized liver weights and %MNHEP (Fig. 21g,h).
Temozolomide, 3 × 1
One cycle of TMZ exposure reduced mean body weight gains over Days 1 through 4: 21, 19, 15, and 16 g for the 0, 3.75, 7.5, and 15 mg/kg/day dose groups, respectively. As there were no deaths or other outward signs of toxicity beyond the reduced body weight gain noted above, the TMZ doses used in this study appeared to be well tolerated.
Mean Day 4 %RET (CD71+) were reduced with increasing TMZ exposure (Fig. 22a), whereas the chromosomal damage endpoint, %MN-RET, markedly increased in a dose-dependent manner (Fig. 22b).
Fig. 22.
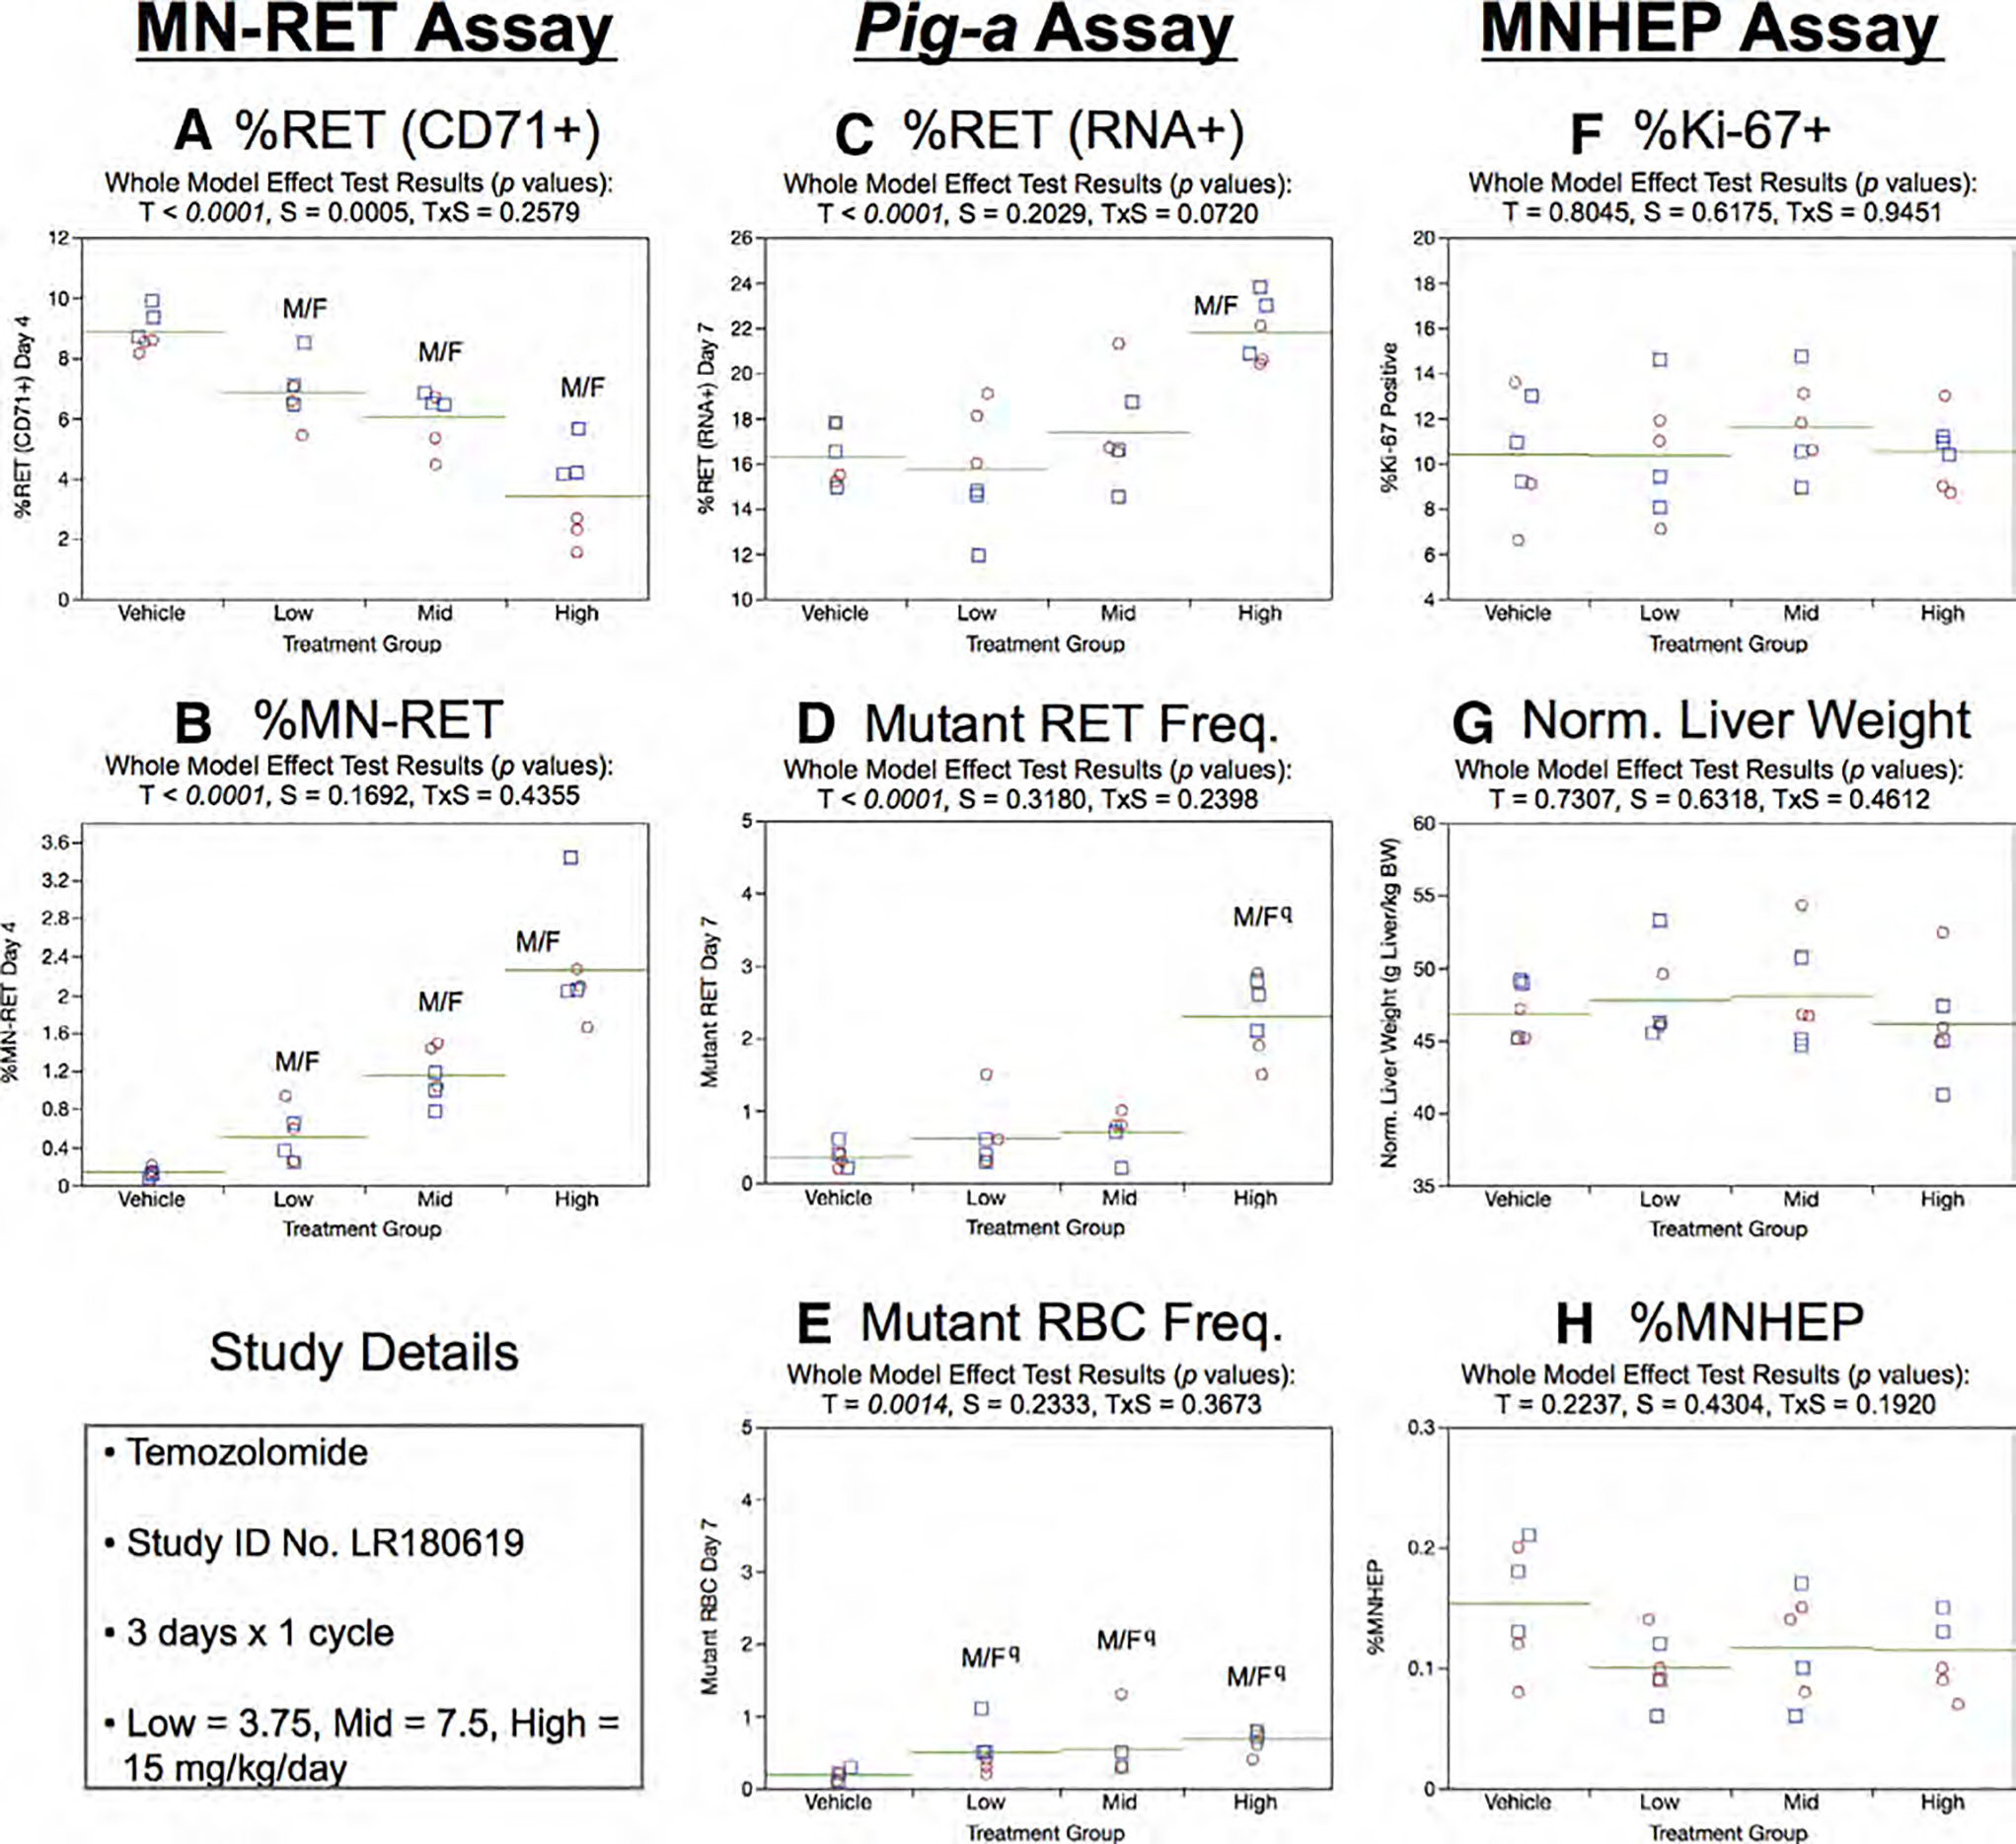
Results from the Temozolomide 3 × 1 study. The same abbreviations and graph formats described in Figure 2 legend are used here. The use of superscript q in panels d and e denotes Pig-a statistical significance is qualified because more than half the mutant cell frequencies were within the historical negative control distribution.
Day 7 RET (RNA+) frequencies generated by the Pig-a assay were significantly elevated in high dose rats (Fig. 22c). As shown by Figure 2d,e, some indications of increased RETCD59− and RBCCD59− frequencies were observed, as the effect of treatment reached statistical significance in several instances. However, these findings need to be qualified because the majority of these Day 7 RETCD59− and RBCCD59− frequencies were within the historical negative control distribution.
One cycle of TMZ exposure had no effect on the liver-based measurements. This was the case for %Ki-67-positive nuclei (Fig. 22f), normalized liver weights (Fig. 22g), and %MNHEP (Fig. 22h).
Temozolomide, 3 × 3
Three cycles of TMZ exposure led to moderately reduced mean body weight gains over Days 1 through 17: 115, 105, 102, and 89 g for the 0, 3.75, 7.5, and 15 mg/kg/day dose groups, respectively. As with the 3 × 1 study, these dose levels appeared to be well tolerated in this repeated cycle experimental design.
Day 4 RET (CD71+) frequencies were reduced in each TMZ treatment group (Fig. 21a), and robust induction of MN-RET was observed at every dose studied (Fig. 23b).
Fig. 23.
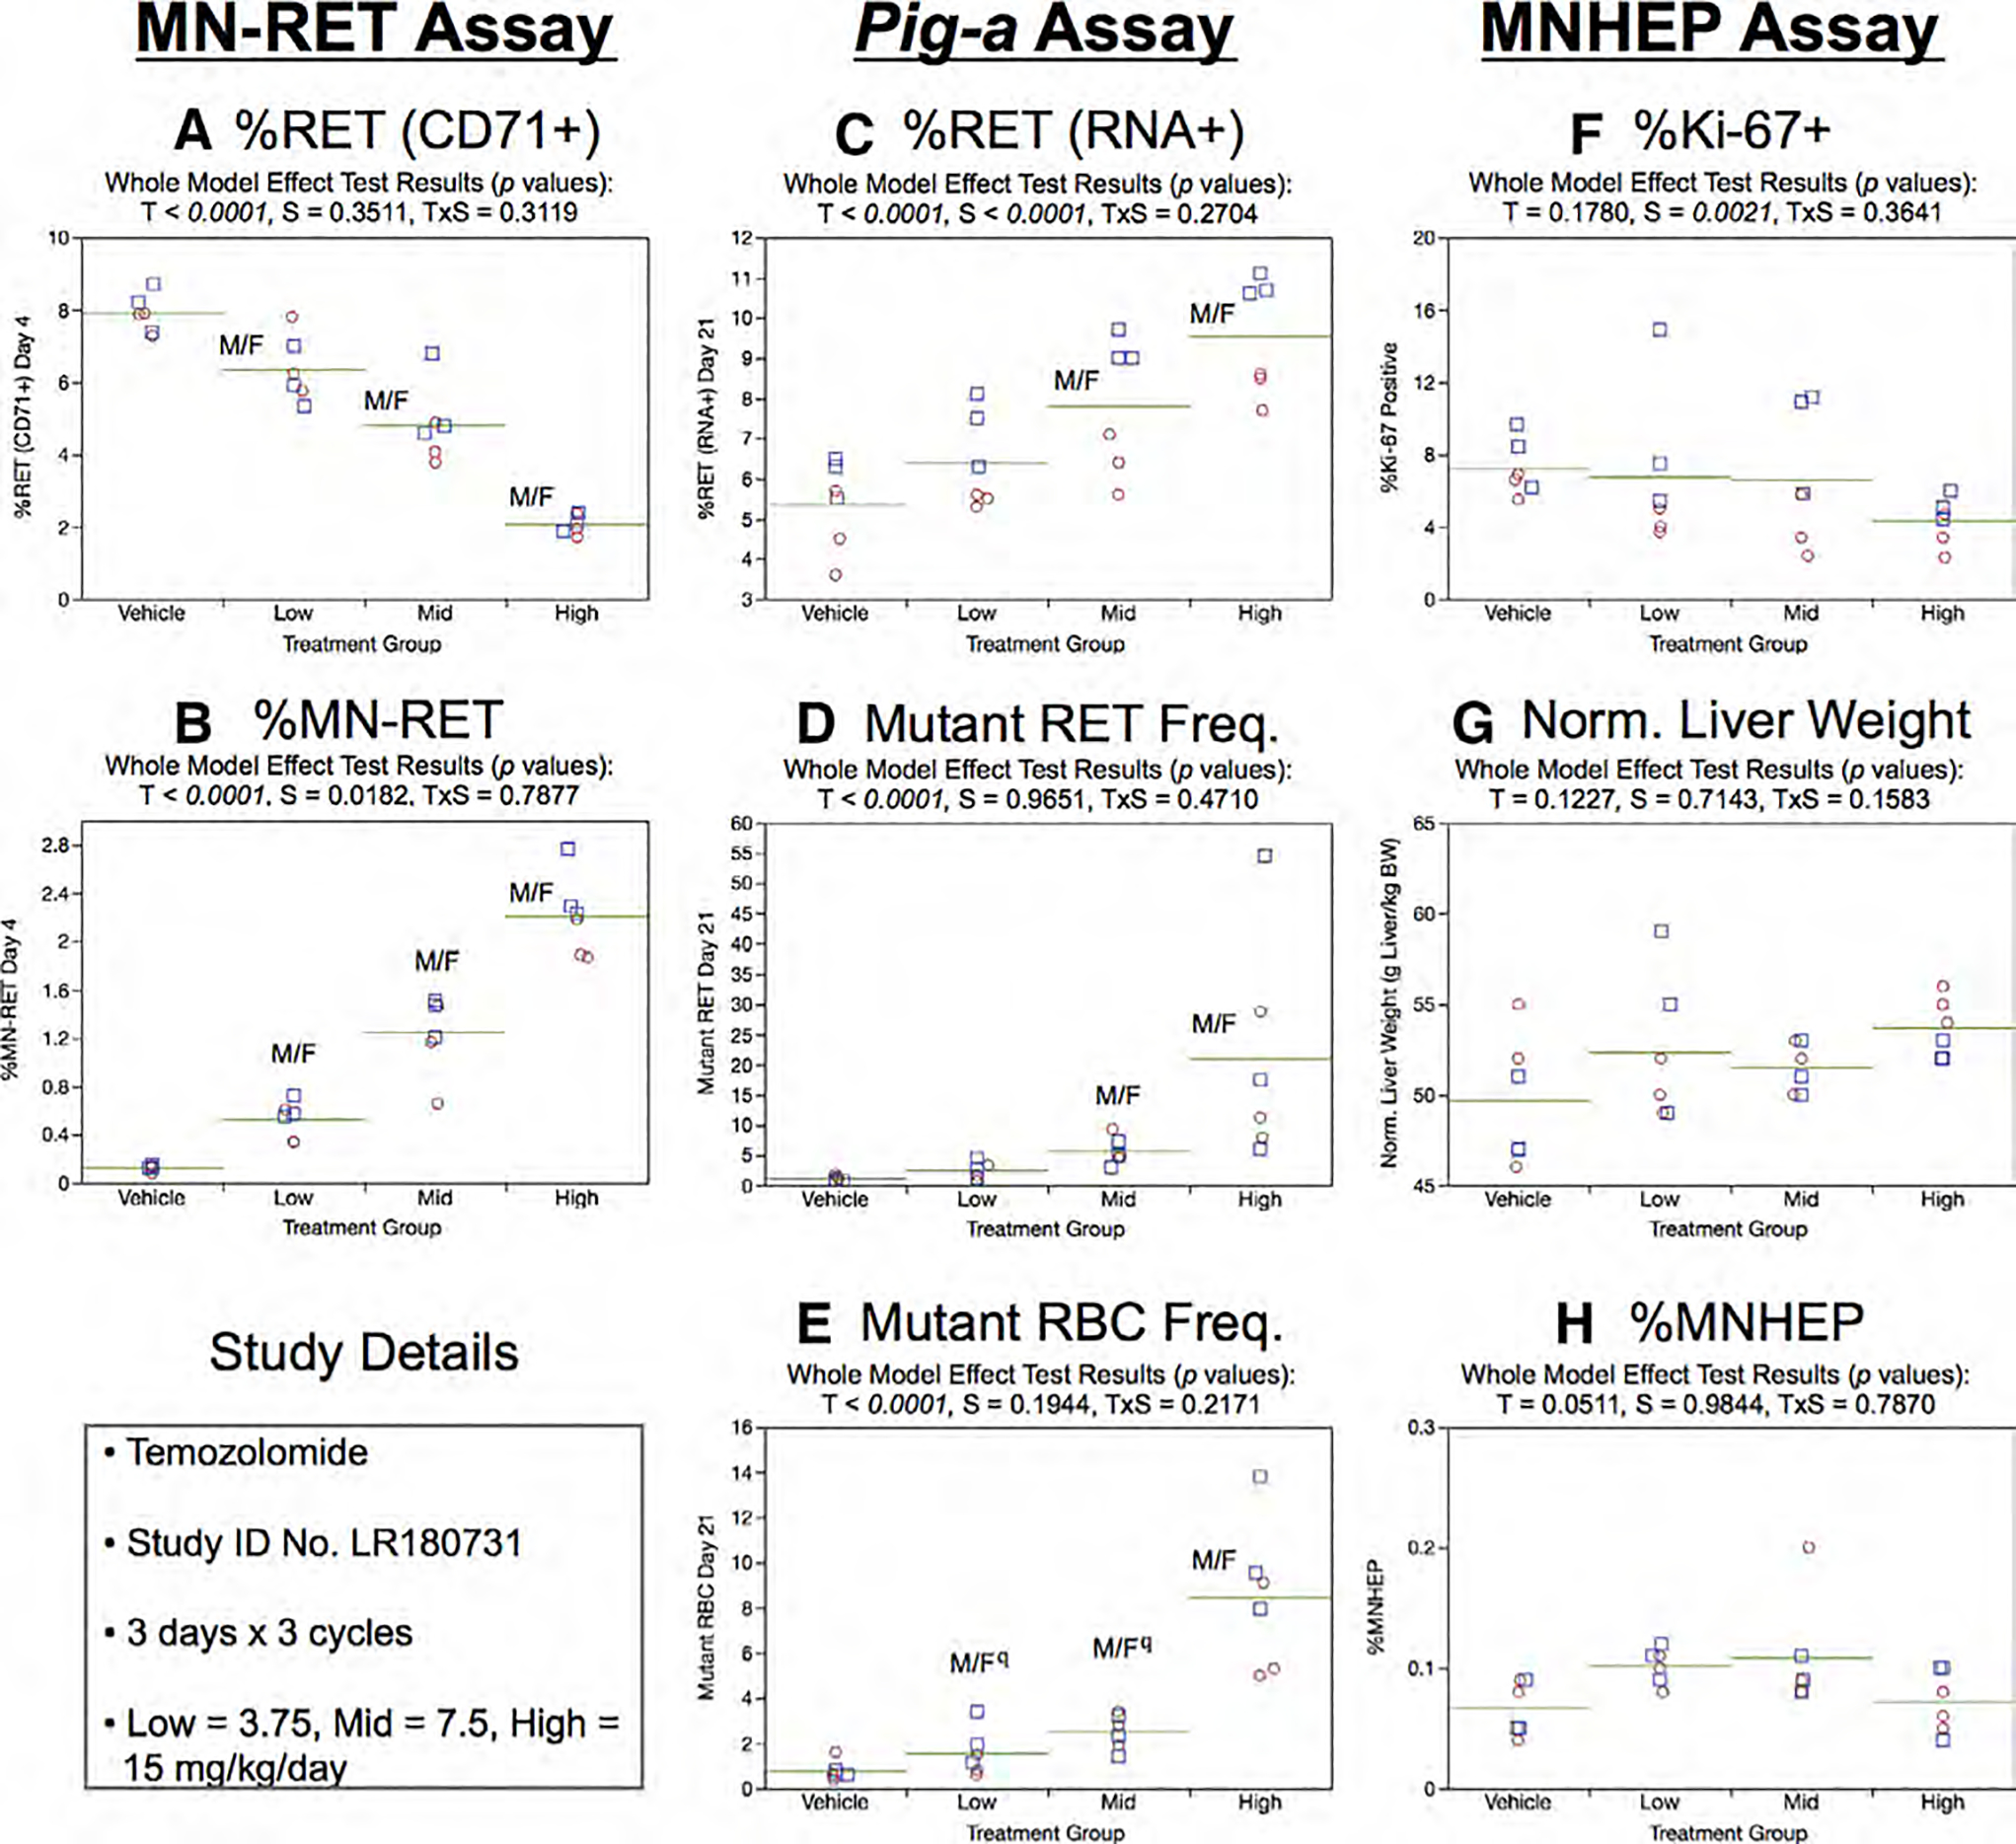
Results from the Temozolomide 3 × 3 study. The same abbreviations and graph formats described in Figure 2 legend are used here. The use of superscript q in panel e denotes Pig-a statistical significance is qualified because more than half the mutant cell frequencies were within the historical negative control distribution.
Day 21 RET (RNA+) frequencies for mid and high dose animals were elevated (Fig. 21c). As shown by Figure 23d, mean RETCD59− frequencies were increased in mid and high dose treatment groups. This effect was accompanied by significant dose-dependent increases in RBCCD59− frequencies (Fig. 23e). However, in the latter case, low and mid dose group responses are qualified because the majority of the RBCCD59− frequencies were within the historical negative control distribution.
Repeated cycles of TMZ had no effect on %Ki-67-positive nuclei, although a sex effect was evident, as male rats tended to exhibit higher values compared to females (Fig. 23f). No significant treatment or sex effects were observed for normalized liver weights (Fig. 23g) or %MNHEP (Fig. 23h).
Quinoline, 3 × 1
One cycle of QUIN did not affect mean body weight gains over Days 1 through 4: 18, 16, 18, and 17 g for the 0, 75, 100, and 125 mg/kg/day dose groups, respectively. With no other outward signs of toxicity, these dose levels appeared to be well tolerated.
No significant changes to Day 4 RET (CD71+) frequencies were observed (Fig. 24a), nor did QUIN exposure affect %MN-RET (Fig. 24b).
Fig. 24.
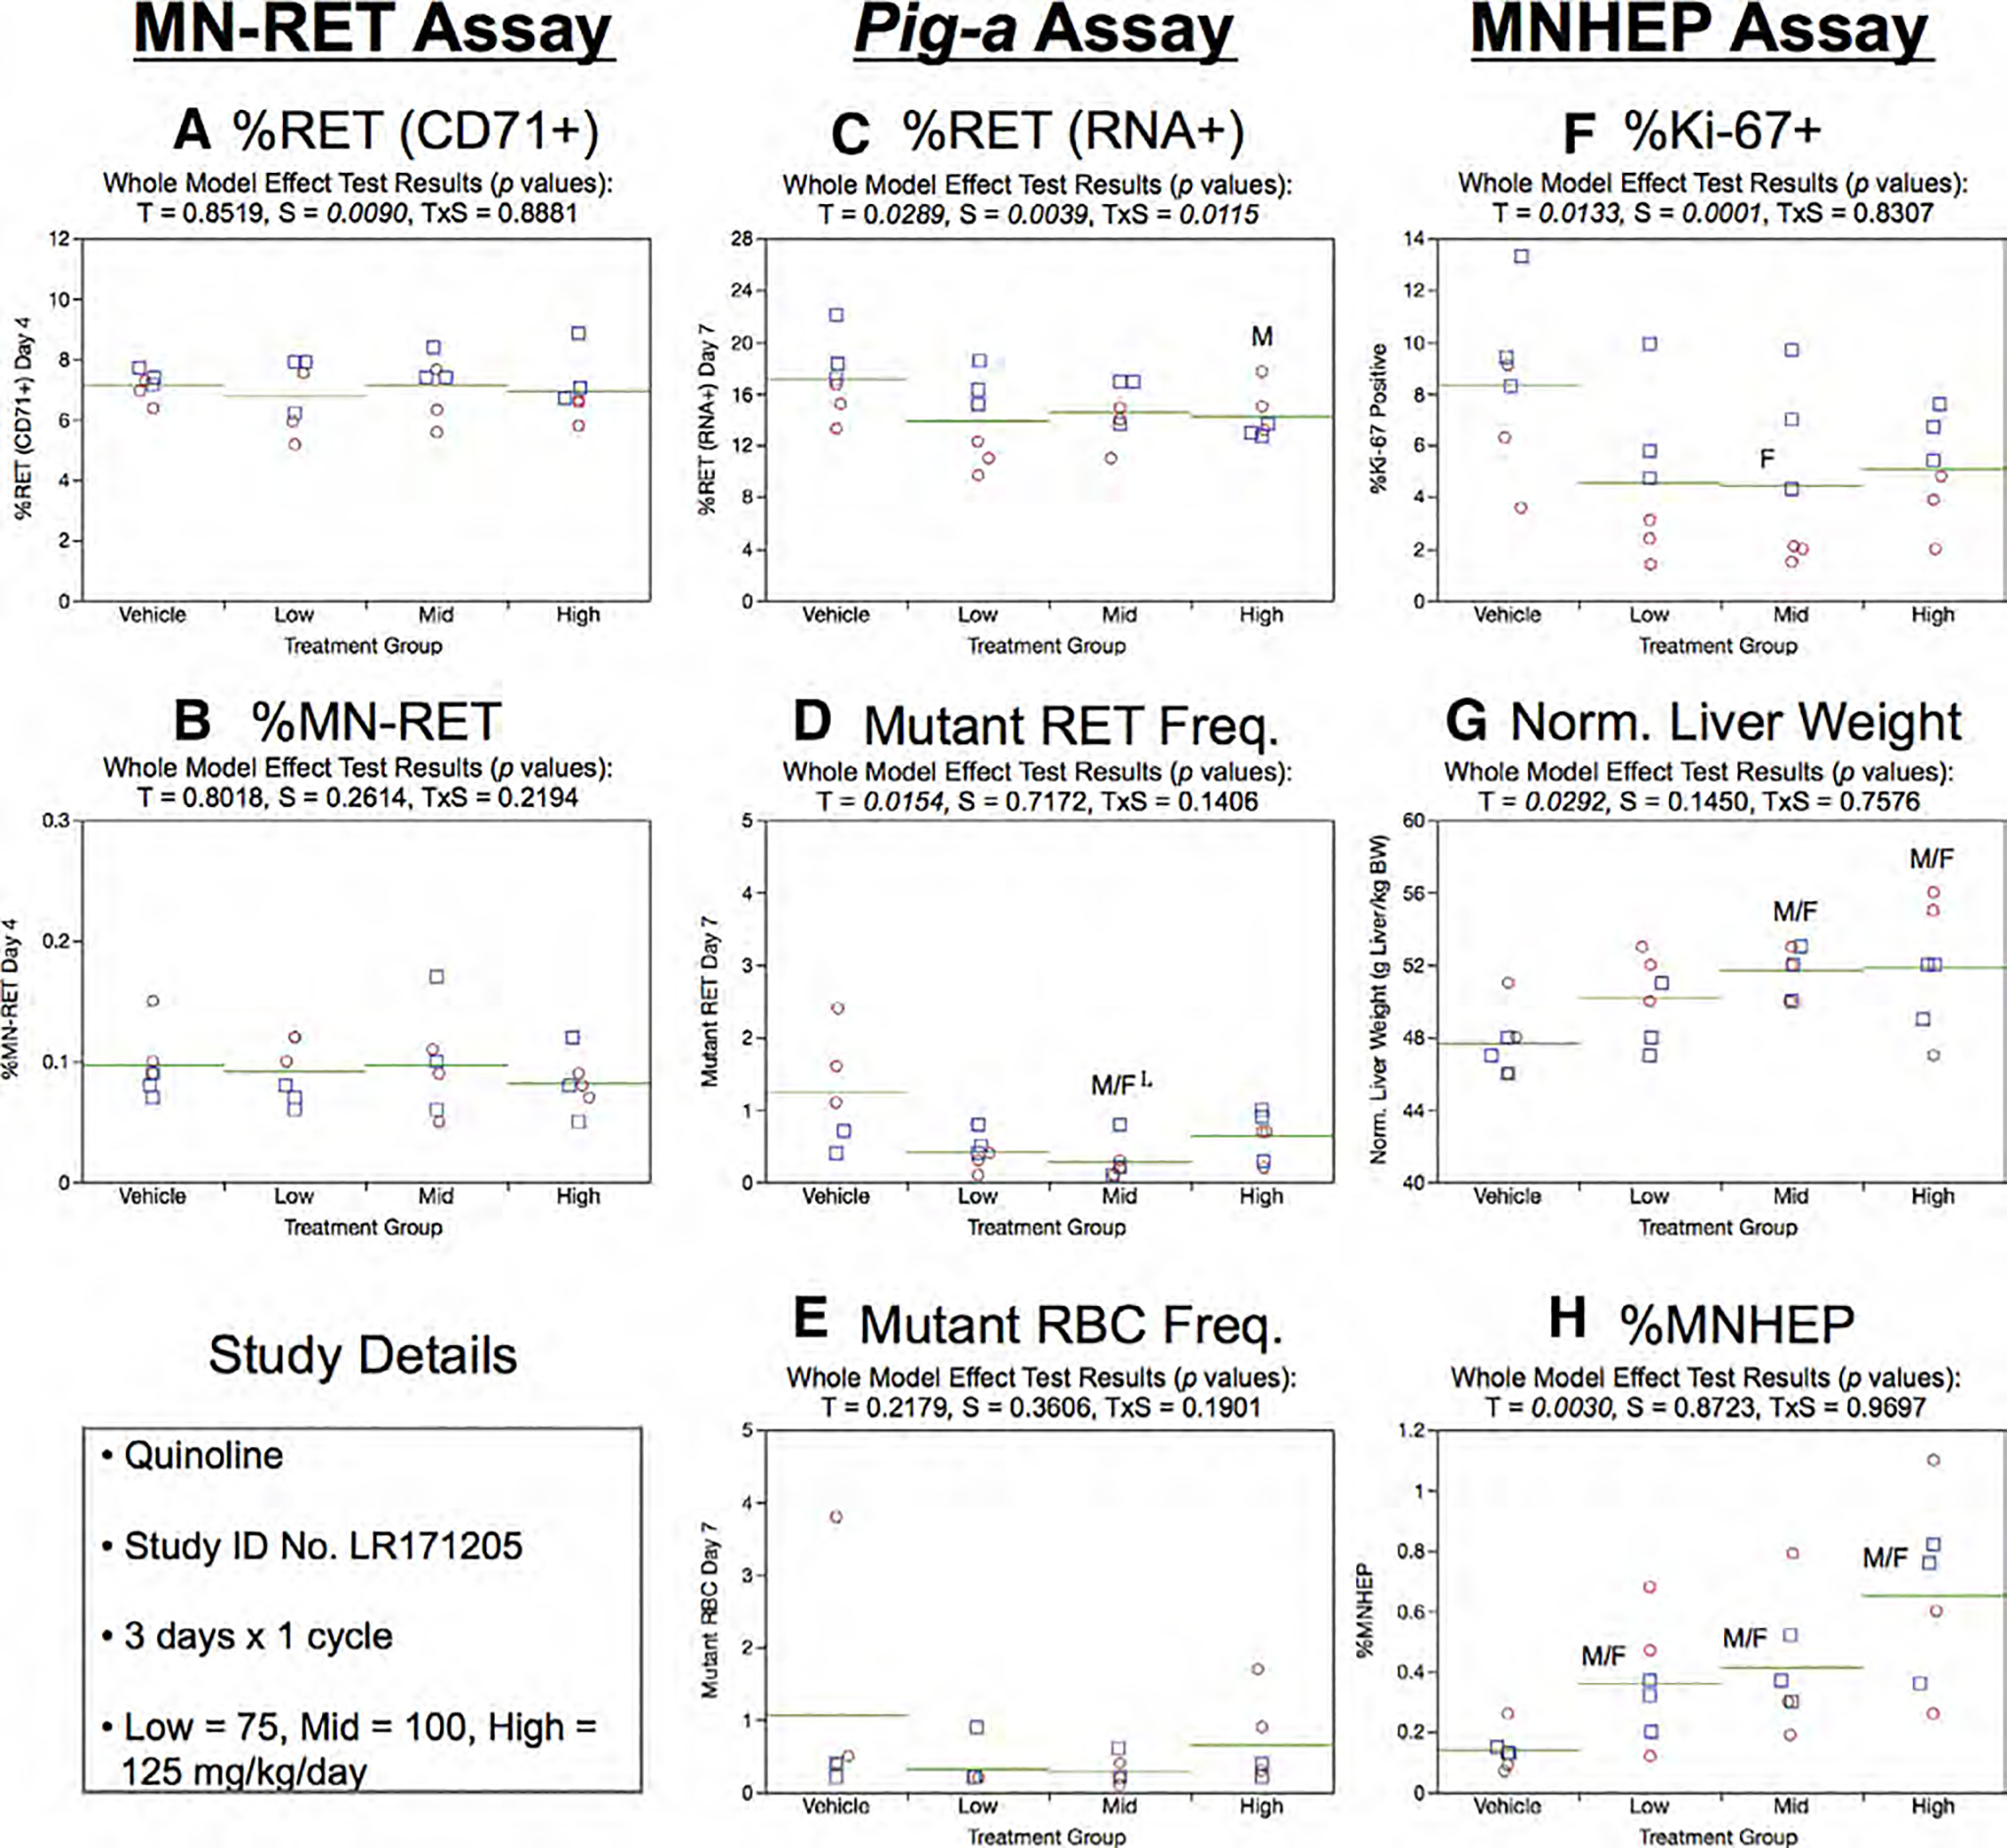
Results from the Quinoline 3 × 1 study. The same abbreviations and graph formats described in Figure 2 legend are used here. The use of superscript L in panel d denotes the mid dose group exhibited lower, not higher mutant reticulocyte frequencies relative to controls.
Day 7 RET (RNA+) frequencies generated by the Pig-a assay were slightly lower in high dose male rats compared to concurrent vehicle controls (Fig. 24c). Neither RETCD59− nor RBCCD59− frequencies were significantly elevated in any of the QUIN exposure groups (Fig. 24d,e).
Treatment and sex were significant factors for %Ki-67-positive hepatocyte nuclei values (Fig. 24f). Male rats generally exhibited higher frequencies compared to females, whereas only mid dose females exhibited a statistically significant treatment effect (reduction). On the other hand, both sexes exhibited elevated normalized liver weights in the two highest exposure groups (Fig. 24g). Three days of treatment were found to induce MNHEP in each of the three QUIN exposure groups (Fig. 24h).
Quinoline, 3 × 3
Three cycles of QUIN exposure slightly affected mean body weight gains over Days 1 through 17: 106, 102, 97, and 99 g for the 0, 75, 100, and 125 mg/kg/day dose groups, respectively. With no other outward signs of toxicity, these dose levels appeared to be well tolerated in this repeated cycle experimental design.
The mid dose group exhibited Day 4 RET (CD71+) frequencies that were significantly reduced relative to vehicle controls (Fig. 25a). No significant increases in %MN-RET were observed (Fig. 25b).
Fig. 25.
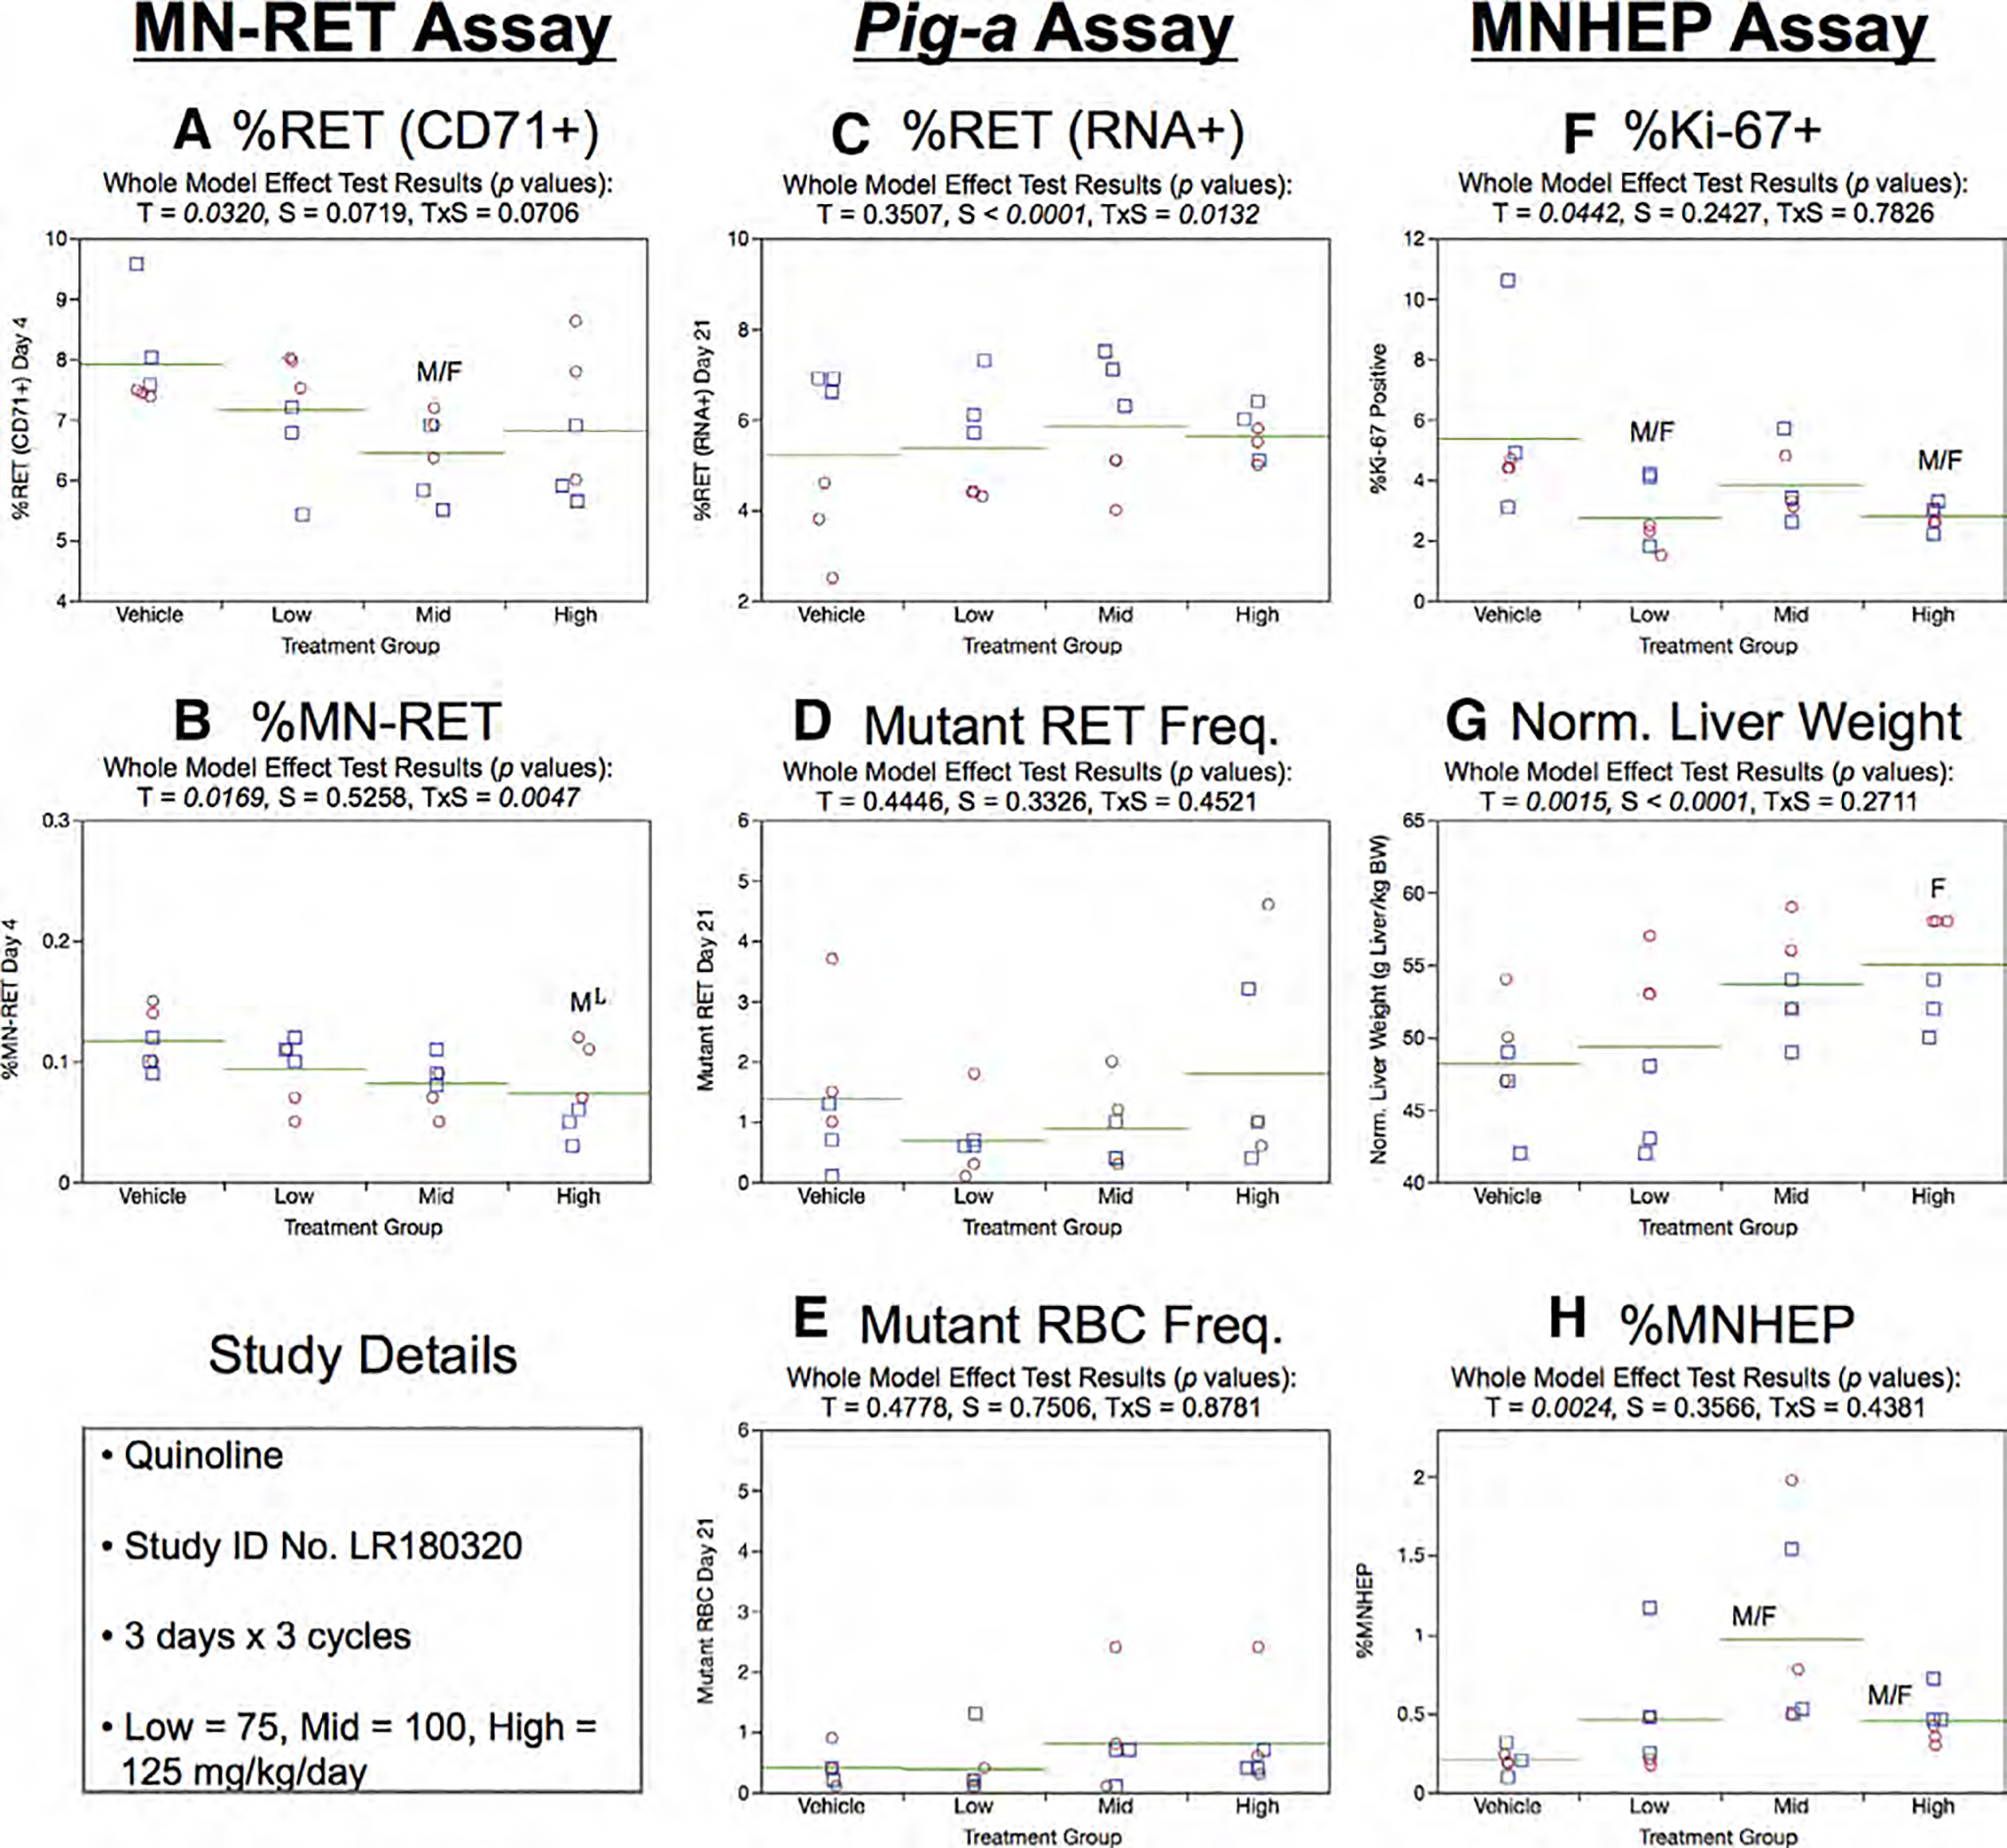
Results from the Quinoline 3 × 3 study. The same abbreviations and graph formats described in Figure 2 legend are used here. The use of superscript L in panel b denotes the high dose group exhibited lower, not higher %MN-RET relative to controls.
Day 21 RET (RNA+) frequencies generated by the Pig-a assay were not affected by treatment or sex (Fig. 25c). Similarly, there was no evidence that these factors influenced RETCD59− and RBCCD59− frequencies (Fig. 25d,e).
%Ki-67-positive nuclei results are presented in Figure 25f. Whereas QUIN treatment was associated with lower values relative to concurrent vehicle control, statistical significance was only achieved in the low and high dose groups. Normalized liver weights were elevated in female rats exposed to the high dose level of QUIN (Fig. 25g). Three cycles of QUIN exposure were found to induce MNHEP, with the mid and high dose groups exhibiting statistically significant increases relative to controls (Fig. 25h).
Vinblastine, 3 × 1
The high dose of VB caused a reduction to mean body weight gain over Days 1 through 4: 19, 18, 15, and 8 g for the 0, 0.0625, 0.125, and 0.25 mg/kg/day dose groups, respectively.
Day 4 %RET (CD71+) were significantly reduced in mid and high dose groups (Fig.26a). The chromosomal damage endpoint, MN-RET, was significantly elevated in high dose rats (Fig.26b).
Fig. 26.
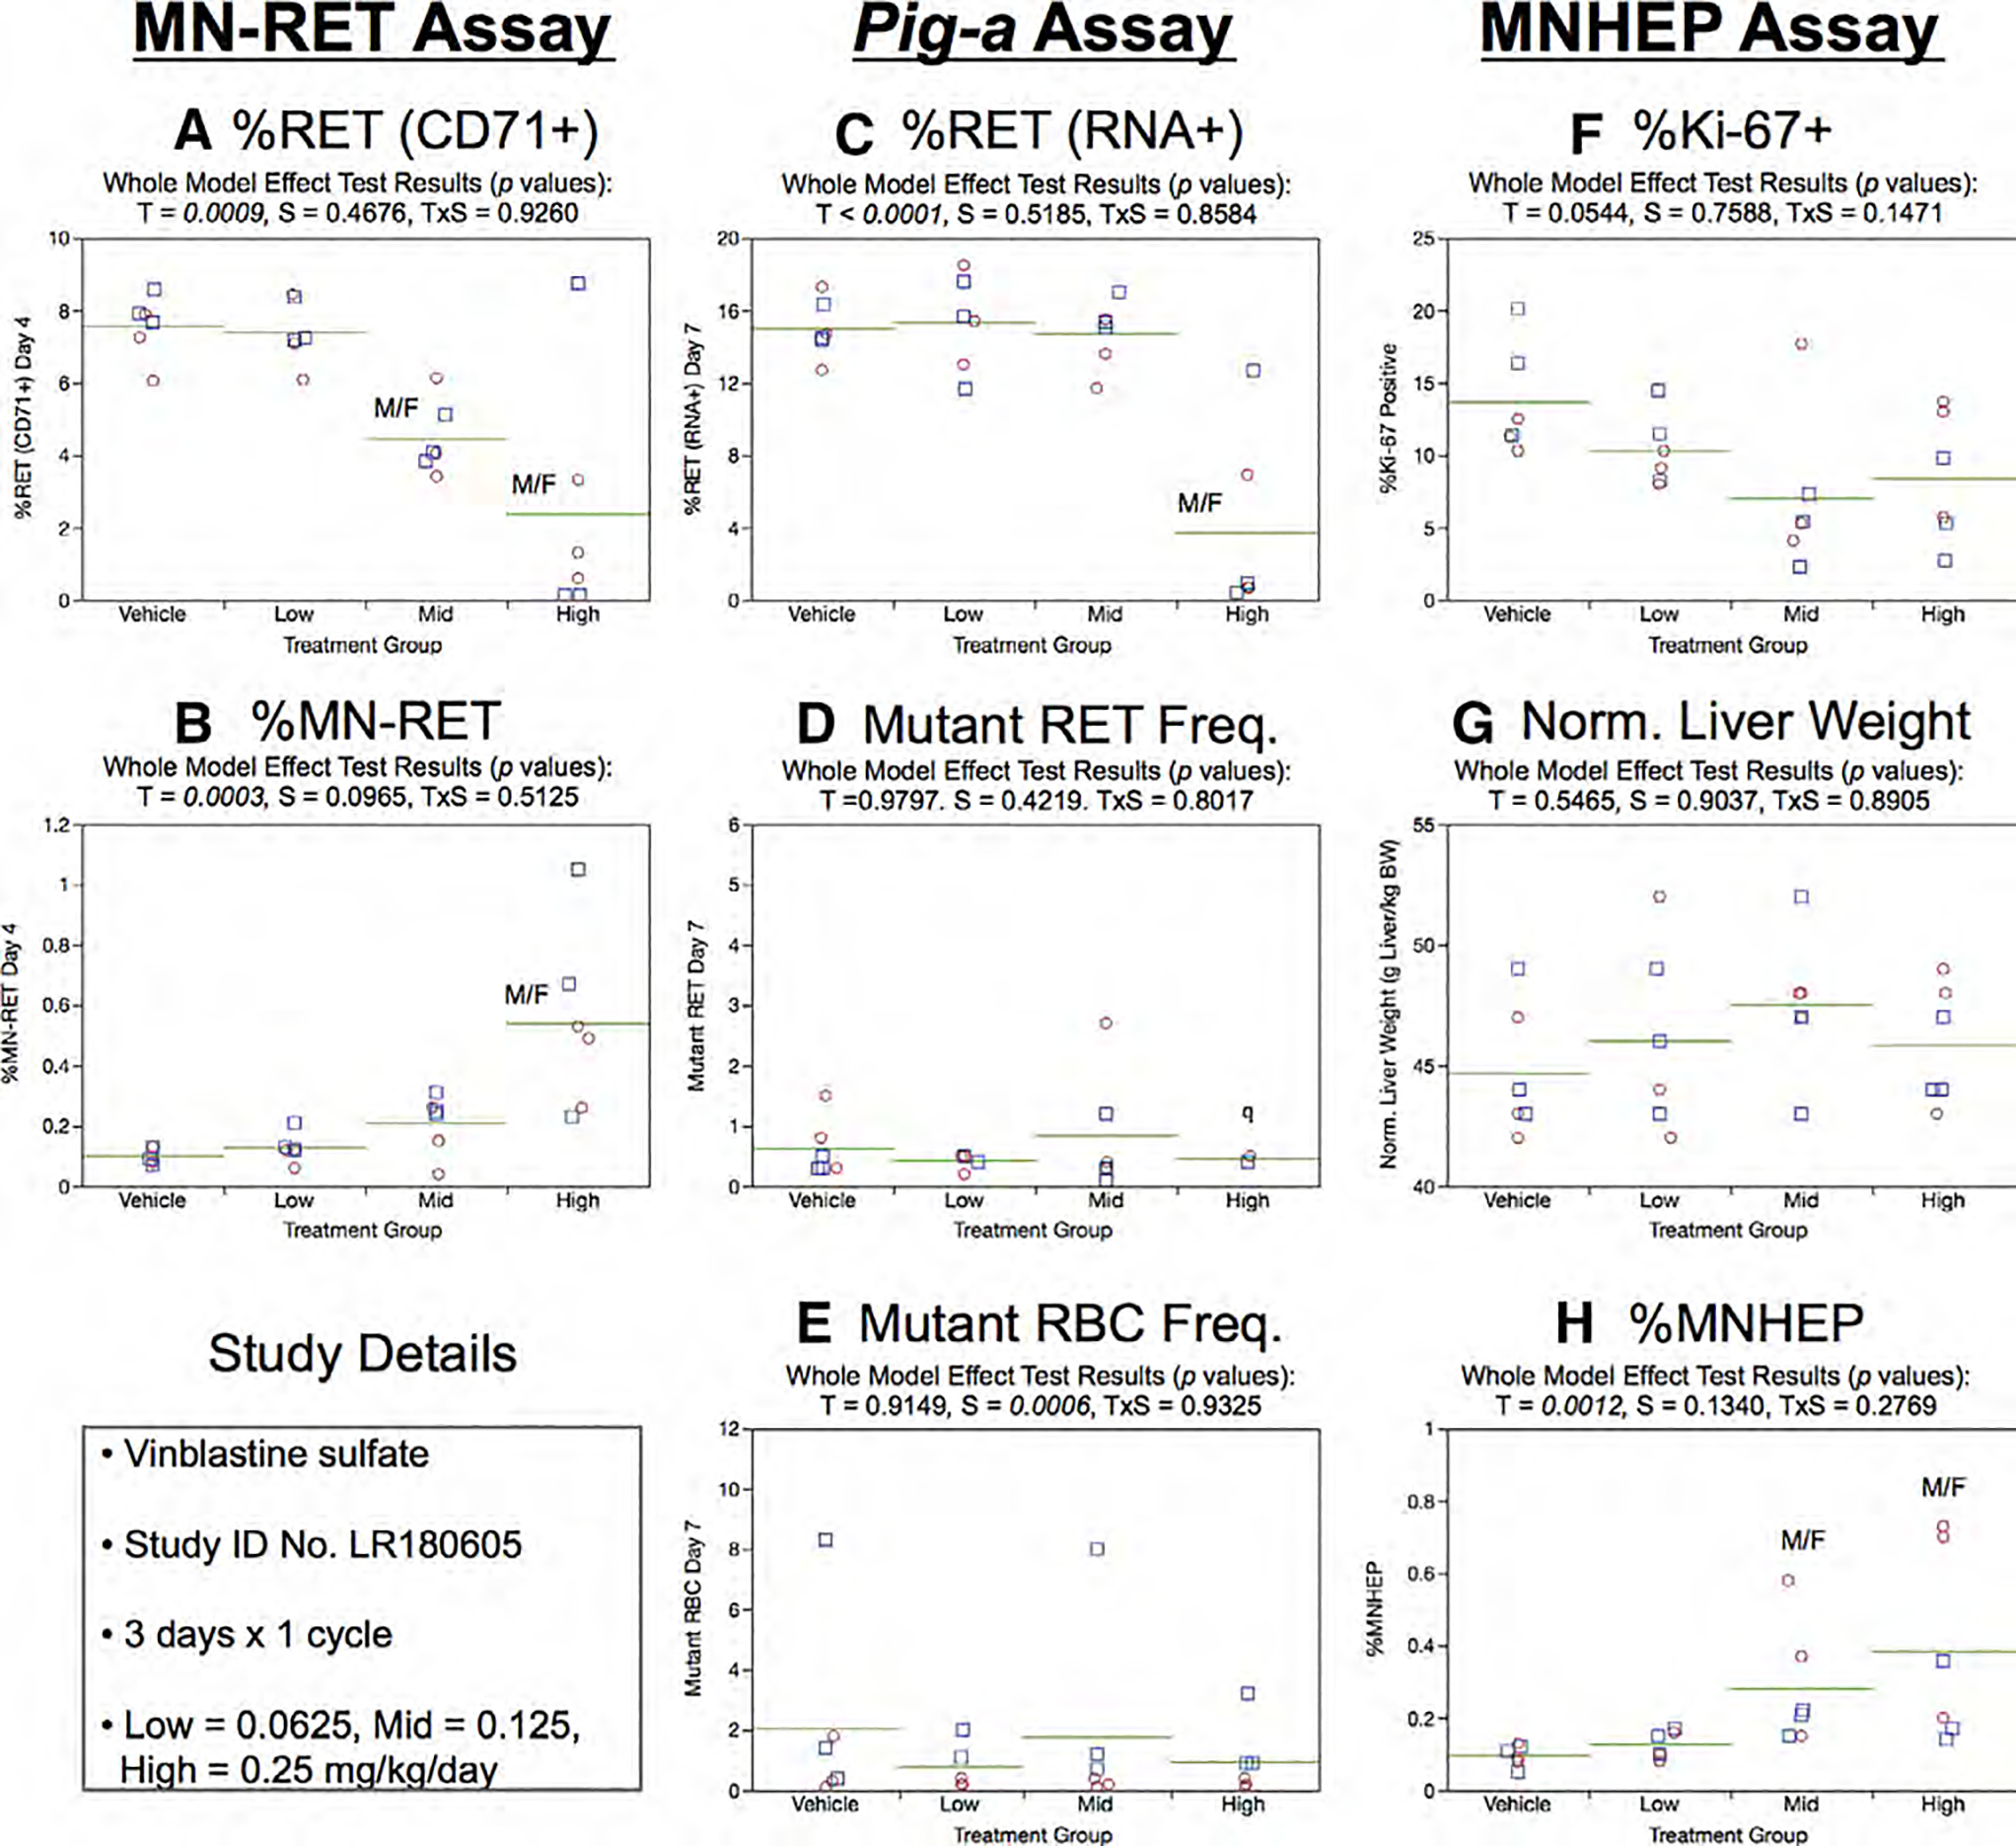
Results from the Vinblastine 3 × 1 study. The same abbreviations and graph formats described in Figure 2 legend are used here. The letter q in panel d denotes that Pig-a data are qualified because 2/3 males and 2/3 females in the high dose group exhibited too few reticulocytes to score mutant reticulocyte frequencies.
Day 7 RET (RNA+) frequencies were reduced in animals exposed to high dose VB (Fig. 26c). There was no evidence of treatment or sex effects on RETCD59− or RBCCD59− frequencies (Fig. 26d,e).
Mean %Ki-67-positive nuclei and normalized liver weights showed no statistically significant treatment or sex effects (Fig. 26f,g). However, %MNHEP were elevated in the mid and high dose groups (Fig. 26h).
Vinblastine, 3 × 3
Three cycles of VB exposure reduced mean body weight gains over Days 1 through 17: 102, 87, 92, and 83 g for the 0, 0.075, 0.125, and 0.175 mg/kg/day dose groups, respectively.
Day 4 %RET (CD71+) were significantly reduced in the mid dose rats (females) and in the high dose (males and females) (Fig. 27a). %MN-RET was significantly elevated in mid and high dose rats of both sex (Fig. 27b).
Fig. 27.
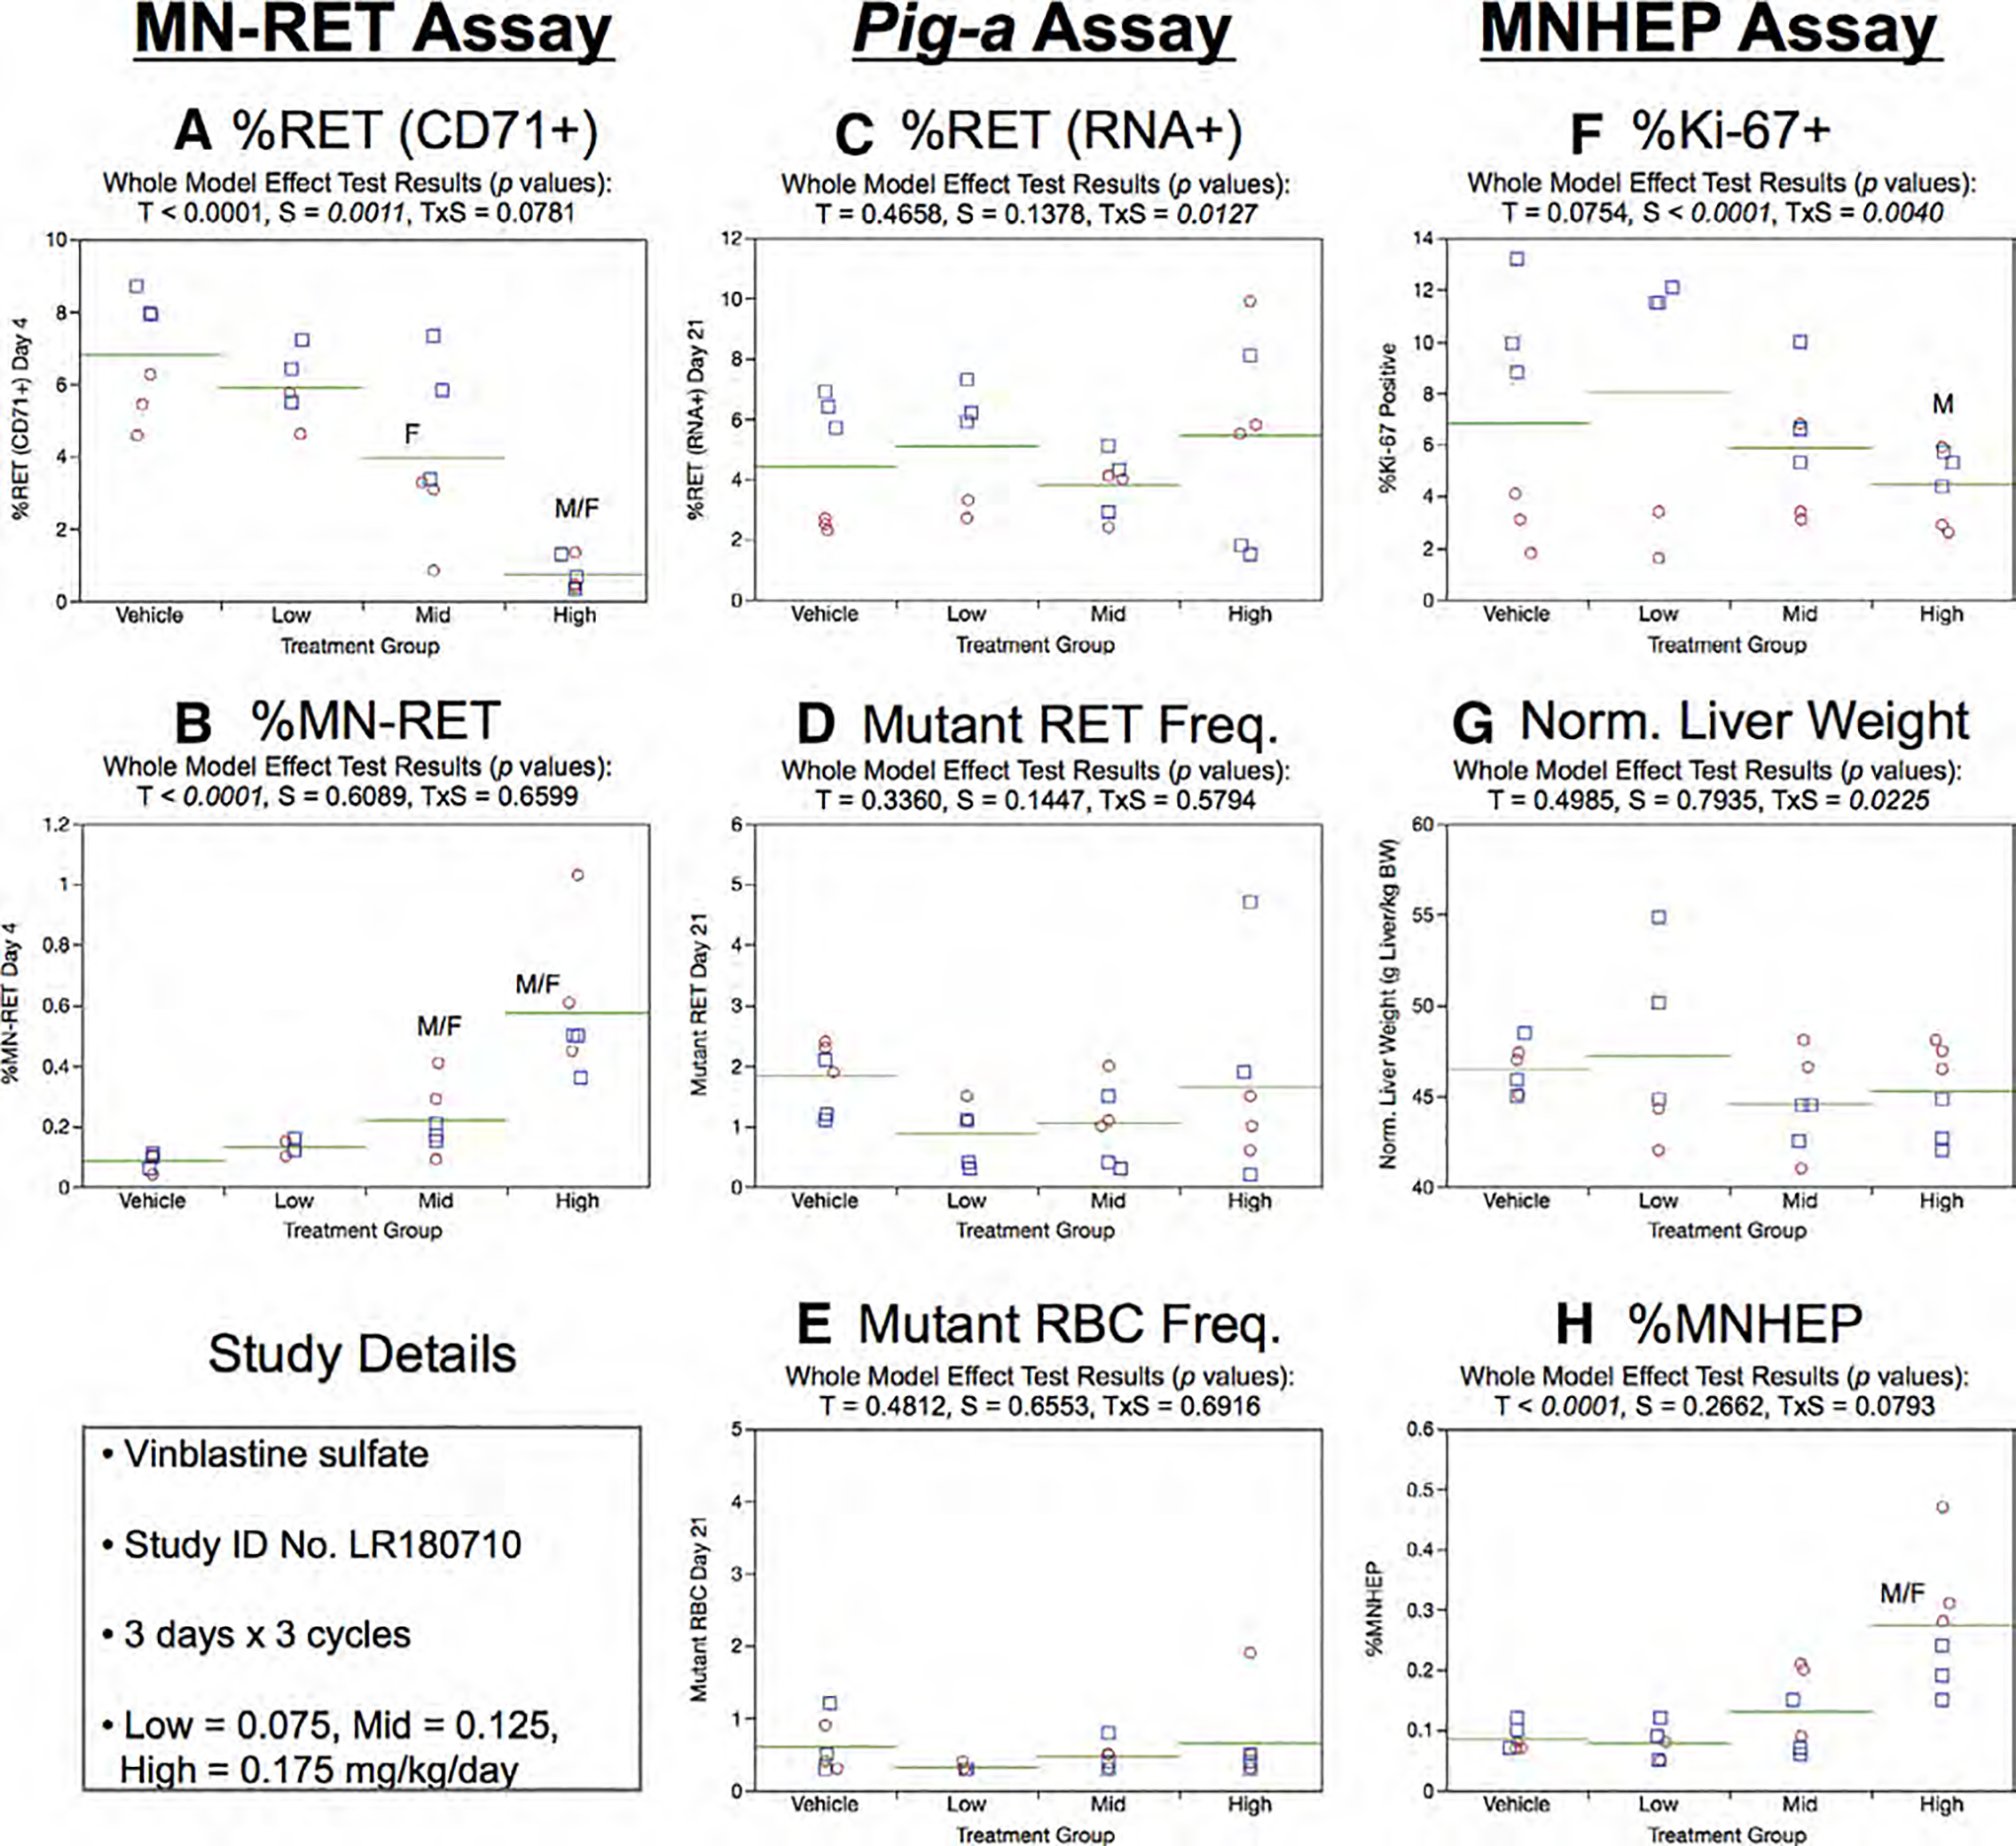
Results from the Vinblastine 3 × 3 study. The same abbreviations and graph formats described in Figure 2 legend are used here.
Day 21 Pig-a assay results were uniformly negative. That is, neither treatment nor sex effects were observed for %RET (RNA +) (Fig.27c), RETCD59− (Fig.27d), or RBCCD59− (Fig. 27e).
%Ki-67-positive nuclei values are provided in Figure 27f. Sex and treatment × sex interaction effects were statistically significant. This was related to males generally exhibiting higher frequencies compared to females, as well as the fact that only males appeared to respond (decrease) with high dose exposure. Normalized liver weights showed no statistically significant treatment or sex effects (Fig. 27g). MNHEP in both sexes were elevated in the high dose group (Fig. 27h).
DISCUSSION
The experiments described herein were conducted with relatively well-studied chemicals whose genotoxic potential is well documented in the safety assessment literature. Each is reported to produce positive genotoxicity findings in various rodent models (Rothfuss et al. 2010; Takasawa et al. 2010; Dertinger et al. 2012; Bhalli et al. 2013; Hamada et al. 2015). The purpose of the current investigation was to systematically investigate the influence that study design, tissue compartment, and choice of biological endpoint had on genotoxicity outcomes. Figure 28 provides an overview of the results, showing which agents were found to induce significant genotoxicity for each endpoint and experimental design studied. Several noteworthy observations are apparent.
Fig. 28.
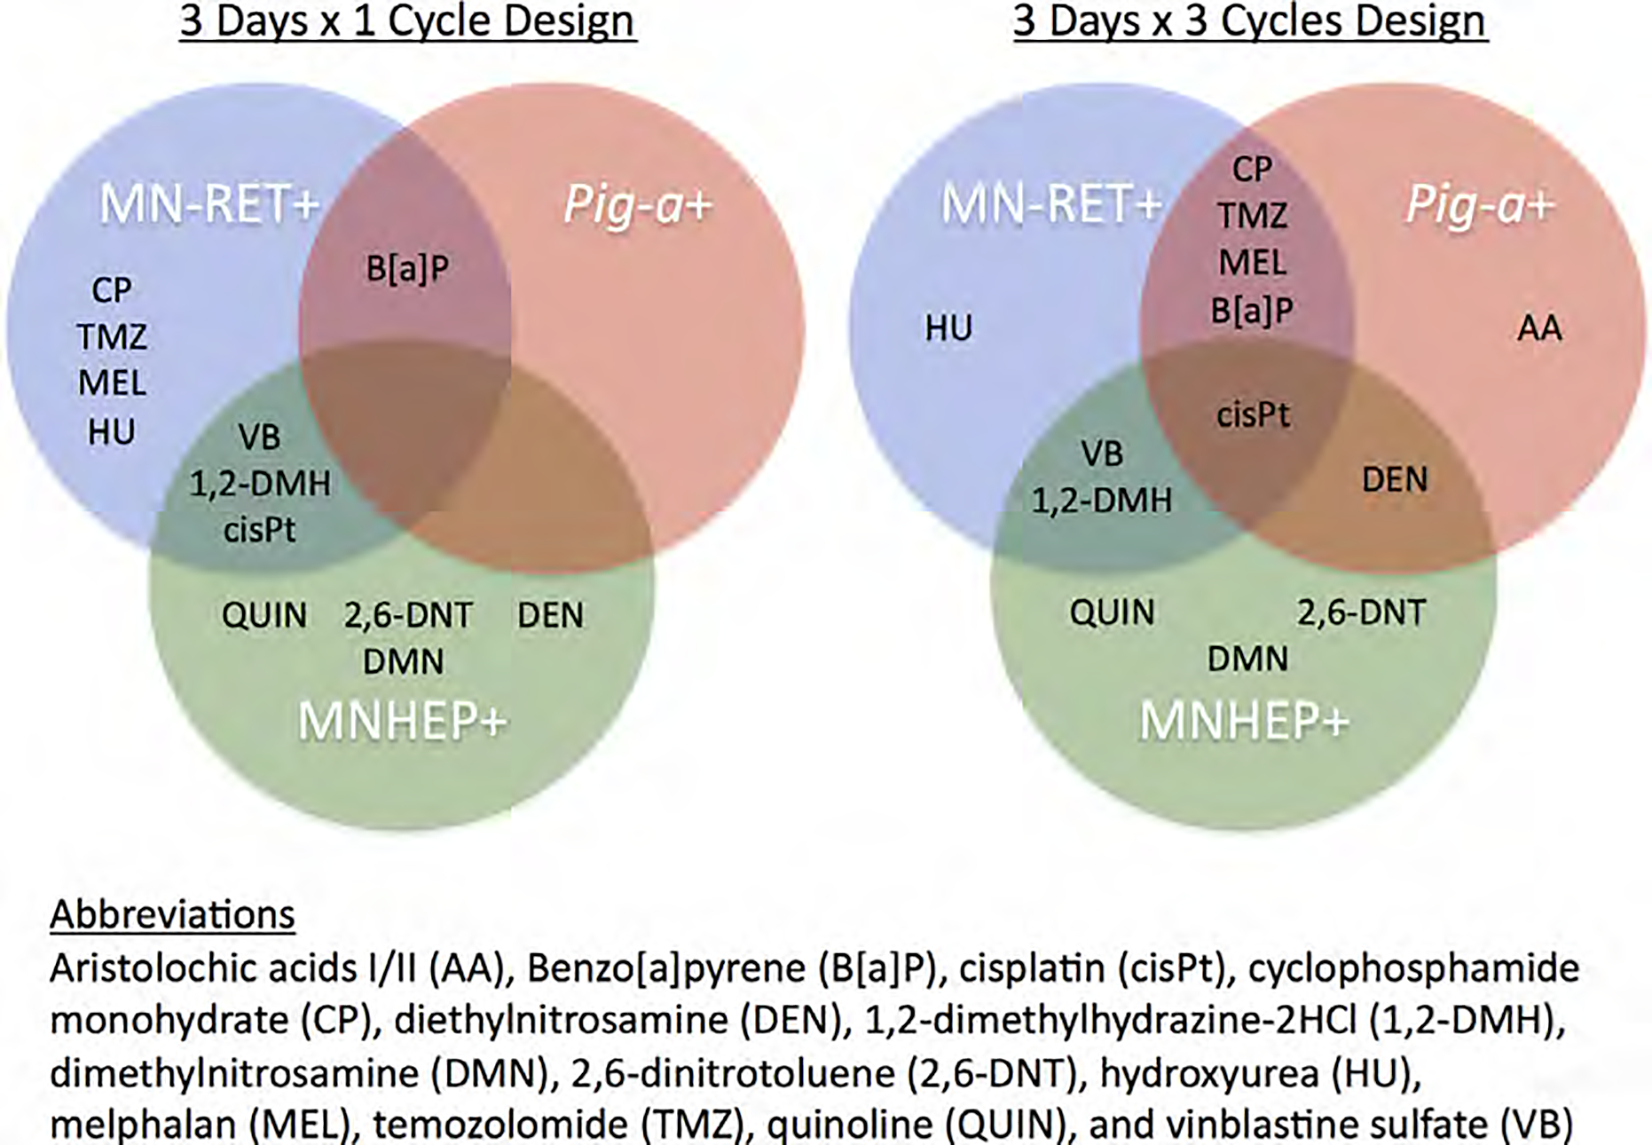
Venn diagrams identify the chemicals that were judged to clearly induce micronucleated reticulocytes (MN-RET+), Pig-a gene mutation (Pig-a+), and/or micronucleated hepatocytes (MNHEP+). Summaries are provided for both the 3 × 1 experimental design (left) as well as the 3 × 3 design (right). Chemical abbreviations are the same as those used in Table I.
First, the choice of study design clearly affected the Pig-a assay. With the 3 × 1 design significant mutation induction was observed for only 1 of 13 genotoxicants studied (cisPt), whereas 6 of 13 chemicals exhibited mutagenic activity when the 3 × 3 scheme was employed. This increased sensitivity was expected due to at least three characteristics of the 3 × 3 design: greater total exposures, lengthier mutant manifestation time, and perhaps for some of the test articles auto-induction of biotransformation enzyme(s).
Because 28 days of exposure are recommended for gene mutation assays by the Organization for Economic Cooperation and Development (OECD (Organisation for Economic Cooperation and Development) 2013) and the IWGT (Gollapudi et al. 2015), it is important to compare the sensitivity of the Pig-a assay when 3 × 1 and 3 × 3 designs are used versus comparable studies based on 4 weeks of treatment. Table II considers these several designs for five of the same chemicals previously studied in 28-day repeat dose rat experiments (note that all work was performed at the same laboratory, Litron; and each study used the same rat strain, Crl:CD[SD]). As shown by Table II and as discussed above, the 3 × 1 design exhibited poor sensitivity for the Pig-a endpoint. On the other hand, no qualitative differences were observed between 3 × 3 and 28-day studies—significant Pig-a induction was observed in all five cases. For the three most potent Pig-a responsive mutagens, B[a]P, cisPt, and MEL, maximum mean RETCD59− and RBCCD59− frequencies from the 3 × 3 design approached or exceeded 50% of the responses observed in the corresponding 28 day study. Although the 3 × 3 scheme provided fewer treatments and a slightly shorter mutant manifestation time relative to 28-day studies, it allowed for higher per day dose levels and therefore more similar mutation frequencies than might otherwise be expected from 9 versus 28 treatment days. Interestingly, these study variables combined to produce very similar mean RETCD59− and RBCCD59− frequencies across the 3 × 3 and 28-day study designs in the case of the two weakest mutagens, CP and DEN. Collectively, these results show that reasonable assay sensitivity is retained by the 3 × 3 protocol.
TABLE II.
Influence of Rat Dosing Schedule on Maximum Mean Pig-a Frequency
| Chemical | Dosing protocol | Harvest day | Max. daily dose (mg/kg/day); Total exposure (mg/kg) | Max. Mean RETCD59 −(×10−6)a | Max. Mean RBCCD59 −(×10−6) |
Study No., Citation |
|---|---|---|---|---|---|---|
| Benzo[a]pyrene | 3 day × 1 cycle | 7 | 250; 750 | 6.2 | 0.8 | LR180102, this article |
| 3 day × 3 cycles | 21 | 250; 2250 | 45.7 | 21.6 | LR180123, this article | |
| 28 day | 29 | 125; 3500 | 112.2 | 35.6 | PR111011, Torous et al. (2012) | |
| Cisplatin | 3 day × 1 cycle | 7 | 2; 6 | 1.6 | 0.5 | LR180529, this article |
| 3 day × 3 cycles | 21 | 2; 18 | 11.8 | 6.0 | LR180612, this article | |
| 28 day | 29 | 0.4; 11.2 | 26.3 | 6.2 | PR130702, Dertinger et al. (2014a) | |
| Cyclophosphamide | 3 day × 1 cycle | 7 | 15; 45 | 0.7 | 0.5 | LR180327, this article |
| 3 day × 3 cycles | 21 | 15; 135 | 7.4 | 2.3 | LR180206, this article | |
| 28 day | 29 | 5; 140 | 5.1 | 1.6 | PR110712, Dertinger et al. (2012) | |
| Diethylnitrosamine | 3 day × 1 cycle | 7 | 40; 120 | 0.6 | 0.5 | LR180306, this article |
| 3 day × 3 cycles | 21 | 40; 360 | 5.0 | 1.7 | LR180227, this article | |
| 28 day | 29 | 12.5; 350 | 4.2c | 1.0c | PR130910, Avlasevich et al. (2014) | |
| 28 day | 29 | 15; 420 | 3.9 | 1.1 | LR170717, Khanal et al. (2018) | |
| Melphalan | 3 day × 1 cycle | 7 | 1.5; 4.5 | 0.7 | 1.0 | LR180807, this article |
| 3 day × 3 cycles | 21 | 3; 27 | 10.0 | 4.1 | LR180904, this article | |
| 28 day | 29 | 0.75; 21 | 20.7 | 9.3 | PR110215, Dertinger et al. (2012) | |
| 28 day | 29 | 0.75; 21 | 11.1 | 4.4 | PR120904, Dertinger et al. (2014b) |
Abbreviations: RETCD59− = mutant phenotype reticulocytes; RBCCD59− = mutant phenotype erythrocytes.
As a point of reference, mean RETCD59−× 10−6 for vehicle control rats is generally within the range 0.5–1.5.
As a point of reference, mean RBCCD59−× 10−6 for vehicle control rats is generally within the range 0.5–1.5.
These group averages are based on n = 5 instead of 6; one severe outlier was removed.
Unlike the Pig-a results, qualitatively and quantitatively similar outcomes were observed for the blood micronucleus assays, irrespective of the 3 × 1 or 3 × 3 study design. This was expected, since Day 4 blood samples were studied in both protocols. Interestingly, the same was true for the liver-based assay—similarly induced MNHEP frequencies were observed across study designs (Table III). This was an unexpected finding, since previous reports have suggested MNHEP accumulate to some degree with repeated exposures (Narumi et al. 2012; Hamada et al. 2015).
TABLE III.
Influence of Rat Dosing Schedule on Maximum Mean MNHEP Frequency
| Chemical | Dosing protocol | Harvest day | Max. daily dose (mg/kg/day); Total exposure (mg/kg) | Max. Mean % MNHEPa | Study No., citation |
|---|---|---|---|---|---|
| Cisplatin | 3 day × 1 cycle | 7 | 250; 750 | 0.61 | LR180102, this article |
| 3 day × 3 cycles | 21 | 250; 2250 | 0.36 | LR180123, this article | |
| Diethylnitrosamine | 3 day × 1 cycle | 7 | 40; 120 | 1.36 | LR180306, this article |
| 3 day × 3 cycles | 21 | 40; 360 | 1.34 | LR180227, this article | |
| 28 day | 29 | 15; 420 | 1.28 | LR170717, Khanal et al. (2018) | |
| 1,2-Dimethylhydrazine | 3 day × 1 cycle | 7 | 15; 45 | 2.49 | LR180327, this article |
| 3 day × 3 cycles | 21 | 15; 135 | 2.30 | LR180206, this article | |
| Dimethylnitrosamine | 3 day × 1 cycle | 7 | 10; 30 | 0.68 | LR181016, this article |
| 3 day × 3 cycles | 21 | 10; 90 | 0.85 | LR181113, this article | |
| 2,6-Dinitrotoluene | 3 day × 1 cycle | 7 | 100; 300 | 0.37 | LR180612, this article |
| 3 day × 3 cycles | 21 | 100; 900 | 0.43 | LR180821, this article | |
| Quinoline | 3 day × 1 cycle | 7 | 125; 375 | 0.65 | LR171205, this article |
| 3 day × 1 cycle | 7 | 125; 375 | 0.46 | LR170822, Avlasevich et al. (2018) | |
| 3 day × 3 cycles | 21 | 125; 1125 | 0.97 | LR180320, this article | |
| 14 day | 15 | 100; 1400 | 0.62 | LR171002, Avlasevich et al. (2018) | |
| Vinblastine | 3 day × 1 cycle | 7 | 0.25; 0.75 | 0.38 | LR180605, this article |
| 3 day × 3 cycles | 21 | 0.175; 1.575 | 0.27 | LR180710, this article |
Abbreviation: MNHEP = micronucleated hepatocyte.
As a point of reference, mean %MNHEP for vehicle control rats is generally within the range 0.1–0.25.
The choice of endpoint impacted classification of an agent as genotoxic or not. For instance, whereas good systemic exposure is known to occur with orally administered HU (Rodriguez et al. 1998), only MN-RET were induced. Although the same target cells are considered in the Pig-a assay (erythrocyte precursors), no gene mutation effect was apparent. The reverse was true for AA—gene mutation was evident without an MN-RET response. These results highlight the importance of investigating a broad range of genomic lesions whenever it is feasible.
Results with AA, B[a]P, CP, DEN, DMN, 1,2-DMH, 2,6-DNT, and QUIN demonstrate the importance of choice of tissue compartment. These chemicals are generally considered genotoxic upon enzymatic activation (Rothfuss et al. 2010; Hamada et al. 2015; Kirkland et al. 2016). However, the situation for AA is likely more complex. While it is genotoxic in vitro in the absence of exogenous metabolic activation, its tumorigenicity has been attributed to enzymatic formation of a cyclic nitrenium ion with delocalized charge leading to the preferential formation of purine adducts [reviewed by Arlt et al. 2002]. Taken together, one might expect the hepatocyte micronucleus assay to be consistently positive for this group of chemicals. Indeed, the importance of including a liver-based assay was demonstrated by the fact that QUIN, DMN, and 2,6-DNT were uniquely positive for MNHEP. However, it is also important to note that three of the metabolically activated chemicals—AA, B[a]P, and CP—had no effect on %MNHEP, but rather produced responses in one or two blood-based assays. These negative MNHEP results, at least for B[a]P and CP, are consistent with several well-conducted rat studies that reported no effect on liver comets (Recio et al. 2010; Rothfuss et al. 2010; Bowen et al. 2011). The most compelling explanation for this observation attributed the lack of liver effects to efficient detoxification of reactive metabolites. Thus, a presumed or even known requirement for metabolic activation should not be used to restrict analyses to the liver compartment, as this would demonstrably adversely affect in vivo hazard characterization.
As noted in the ICH S2(R1) guidance document (ICH 2011), some concerns have been raised about integrating genetic toxicology endpoints into repeat-treatment toxicology studies when in vitro results show some evidence of genotoxic potential, and the maximum tolerated dose in a 28-day study is considerably less than what can be tolerated in a shorter-term study. Others contend that responses are generally comparable at similar fractions of the maximum tolerated dose in each specific exposure protocol (MacGregor 1991). In any event, there are situations in which genotoxicity studies will need to be conducted independent of toxicology studies, for example, when genotoxicity information is needed after general toxicology studies have been completed. Thus, it is important to have access to flexible, shorter-term, 3Rs-friendly study designs that are effective at detecting in vivo genotoxicants. Ideally, the treatment/harvest schedules and choice of endpoints can be tailored to the types of results observed from in vitro experiments. The data presented herein suggest the utility of two study designs. The 3 × 1 design was found to be highly effective at identifying micronucleus inducers in two key tissue compartments, and was shown to be sensitive to both clastogens and an aneugen. This represents a compelling approach for following up positive or equivocal in vitro micronucleus results. On the other hand, the 3 × 3 design provides additional exposures and manifestation times, characteristics that are especially important for the Pig-a assay. This broader consideration of genomic damage may be important when studying chemicals in the absence of in vitro data, and when in vitro mutagenicity results have generated positive or equivocal findings, and their relevance to intact animals is suspect.
In conclusion, the results presented herein indicate it is possible to significantly reduce animal and other resource requirements while improving assessments of in vivo genotoxicity potential. This is accomplished by concurrently evaluating two tissue compartments and as many as three assays using flexible, fit-for-purpose study designs in conjunction with flow cytometric scoring techniques.
Supplementary Material
ACKNOWLEDGMENTS
This work was funded by grants from the National Institute of Health/National Institute of Environmental Health Sciences (NIEHS; Grant Nos. R44ES026464 and R44ES028163). The contents are solely the responsibility of the authors, and do not necessarily represent the official views of the NIEHS. The authors would like to thank Makoto Hayashi for recommending hepatocyte micronuclei as a good candidate for automated scoring, Marie Vasquez and Shuichi Hamada for important technical advice, Vasily Dobrovolsky and Robert Heflich for chemical selection advice, David Lovell for helpful discussions about significance testing and approaches that accommodate multifactorial designs, Carol Gleason for advice about tolerance intervals, and Maik Schuler for suggesting the juvenile rat model.
Grant sponsor: National Institute of Health/National Institute of Environmental Health Sciences; Grant numbers: R44ES028163; R44ES026464.
Footnotes
CONFLICT OF INTERESTS
SDD, SLA, DKT, PS, SK, CK, AD, and JCB are employees of Litron Laboratories, and JTM is a paid consultant. Litron holds patents covering flow cytometric methods for scoring micronucleated erythrocytes and sells kits based on this technology (In Vivo MicroFlow®); Litron holds patents for scoring GPI anchor-deficient erythrocytes and sells kits based on this technology (In Vivo MutaFlow®); Litron plans to sell kits for scoring micronucleated hepatocytes via flow cytometry (In Vivo MicroFlow® PLUS RL Kits).
Additional Supporting Information may be found in the online version of this article.
REFERENCES
- Arlt VM, Stiborova M, Schmeiser HH. 2002. Aristolochic acid as a probable human cancer hazard in herbal remedies: a review. Mutagenesis 17:265–277. [DOI] [PubMed] [Google Scholar]
- Avlasevich SL, Phonethepswath S, Labash C, Carlson K, Torous DK, Cottom J, Bemis JC, MacGregor JT, Dertinger SD. 2014. Diethylnitrosamine genotoxicity evaluated in Sprague Dawley rats using Pig-a mutation and reticulocyte micronucleus assays. Environ Mol Mutagen 55:400–406. [DOI] [PubMed] [Google Scholar]
- Avlasevich SL, Khanal S, Singh P, Torous DK, Bemis JC, Dertinger SD. 2018. Flow cytometric method for scoring rat liver micronuclei with simultaneous assessments of hepatocyte proliferation. Environ Mol Mutagen 59:176–187. [DOI] [PMC free article] [PubMed] [Google Scholar]
- Bhalli JA, Ding W, Shaddock JG, Pearce MG, Dobrovolsky VN, Heflich RH. 2013. Evaluating the weak in vivo micronucleus response of a genotoxic carcinogen, Aritolochic acids. Mutat Res 753:82–92. [DOI] [PubMed] [Google Scholar]
- Bowen DE, Whitwell JH, Lillford L, Henderson D, Kidd D, McGarry S, Pearce G, Beevers C, Kirkland DJ. 2011. Evaluation of a multi-endpoint assay in rats, combining the bone-marrow micronucleus test, the Comet assay and the flow-cytometric peripheral blood micronucleus test. Mutat Res 722:7–19. [DOI] [PubMed] [Google Scholar]
- Dertinger SD, Camphausen K, MacGregor JT, Bishop ME, Torous DK, Avlasevich S, Cairns S, Tometsko CR, Menard C, Muanza T, et al. 2004. Three-color labeling method for flow cytometric measurement of cytogenetic damage in rodent and human blood. Environ Mol Mutagen 44:427–435. [DOI] [PubMed] [Google Scholar]
- Dertinger SD, Phonethepswath S, Franklin D, Weller P, Torous DK, Bryce SM, Avlasevich S, Bemis JC, Hyrien O, Palis J, et al. 2010. Integration of mutation and chromosomal damage endpoints into 28-day repeat dose toxicology studies. Toxicol Sci 115:401–411. [DOI] [PMC free article] [PubMed] [Google Scholar]
- Dertinger SD, Bryce SM, Phonethepswath S, Avlasevich SL. 2011. When pigs fly: Immunomagnetic separation facilitates rapid determination of Pig-a mutant frequencies by flow cytometric analysis. Mutat Res 72:163–170. [DOI] [PMC free article] [PubMed] [Google Scholar]
- Dertinger SD, Phonethepswath S, Avlasevich SL, Torous DK, Mereness J, Bryce SM, Bemis JC, Bell S, Weller P, MacGregor JT. 2012. Efficient monitoring of in vivo Pig-a gene mutation and chromosomal damage: Summary of 7 published studies and results from 11 new reference compounds. Toxicol Sci 130:328–348. [DOI] [PMC free article] [PubMed] [Google Scholar]
- Dertinger SD, Avlasevich SL, Torous DK, Bemis JC, Phonethepswath S, Labash C, Carlson K, Mereness J, Cottom J, Palis J, et al. 2014a. Persistence of cisplatin-induced mutagenicity in hematopoietic stems cells: Implications for secondary cancer risk following chemotherapy. Toxicol Sci 140:307–314. [DOI] [PMC free article] [PubMed] [Google Scholar]
- Dertinger SD, Phonethepswath S, Avlasevich SL, Torous DK, Mereness J, Cottom J, Bemis JC, MacGregor JT. 2014b. Pig-a gene mutation and micronucleated reticulocyte induction in rats exposed to tumorigenic doses of the leukemogenic agents chlorambucil, thiotepa, melphalan, and 1,3-propanse sultone. Environ Mol Mutagen 55:299–308. [DOI] [PubMed] [Google Scholar]
- Dertinger SD, Torous DK, Hall NE, Tometsko CR, Gasiewicz TA. Malaria-infected erythrocytes serve as biological standards to ensure reliable and consistent scoring of micronucleated erythrocytes by flow cytometry. Mutat Res. 2000; 464(2):195–200. [DOI] [PubMed] [Google Scholar]
- Gollapudi BB, Lynch AM, Heflich RH, Dertinger SD, Dobrovolsky VN, Froetschl R, Horibata K, Kenyon MO, Kimoto T, Lovell DP, et al. 2015. The in vivo Pig-a assay: A report of the International Workshop on Genotoxicity Testing (IWGT) Workgroup. Mutat Res 783:23–35. [DOI] [PubMed] [Google Scholar]
- Hamada S, Ohyama W, Takashima R, Shimada K, Matsumoto K, Kawakami S, Uno F, Sui H, Shimada Y, Imamura T, et al. 2015. Evaluation of the repeated-dose liver and gastrointestinal tract micronucleus assays with 22 chemicals using young adult rats: Summary of the collaborative study by the Collaborative Study Group for the Micronucleus Test (CSGMT)/The Japanese Environmental Mutagen Society (JEMS) Mammalian Mutagenicity Study Group (MMS). Mutat Res 780–781:2–17. [DOI] [PubMed] [Google Scholar]
- Khanal S, Sing P, Avlasevich SL, Torous DK, Bemis JC, Dertinger SD. 2018. Integration of liver and blood micronucleus and Pig-a gene mutation endpoints into rat 28-day repeat-treatment studies: Proof-of-principle with diethylnitrosamine. Mutat Res 828:30–35. [DOI] [PMC free article] [PubMed] [Google Scholar]
- Kimoto T, Horibata K, Miura D, Chikura S, Okada Y, Ukai A, Itoh S, Nakayama S, Sanada H, Koyama N, et al. 2016. The PIGRET assay, a method for measuring Pig-a gene mutation in reticulocytes, is reliable as a short-term in vivo genotoxicity test: Summary of the MMS/JEMS-collaborative study across 16 laboratories using 24 chemicals. Mutat Res 811:3–15. [DOI] [PubMed] [Google Scholar]
- Kirkland D, Kasper P, Martus H-J, Müller L, van Benthem J, Madia F, Corvi R. 2016. Updated recommended list of genotoxic and non-genotoxic chemicals for assessment of the performance of new or improved genotoxicity tests. Mutat Res 795:7–30. [DOI] [PubMed] [Google Scholar]
- Kissling GE, Dertinger S, Hayashi M, MacGregor JT. 2007. Sensitivity of the erythrocyte micronucleus assay: Dependence on number of cells scored and inter-animal variability. Mutat Res 634:235–240. [DOI] [PMC free article] [PubMed] [Google Scholar]
- ICH. 2011. S2(R1) Guidance on genotoxicity testing and data interpretation for pharmaceuticals intended for human use. International Conference on Harmonization of Technical Requirements for Registration of Pharmaceuticals for Human Use. ICH Harmonised Tripartite Guideline. Step 4, accessed November 9, 2011. [Google Scholar]
- MacGregor JT, Wehr CM, Henika PR, Shelby MD. 1990. The in vivo erythrocyte micronucleus test: Measurement at steady state increases assay efficiency and permits integration with toxicity studies. Environ Mol Mutagen 14:513–522. [DOI] [PubMed] [Google Scholar]
- MacGregor JT. 1991. Micronucleus assay protocols (Letter). Mutat Res 259:123–125. [DOI] [PubMed] [Google Scholar]
- Miller LR, Marks C, Becker JB, Hurn PD, Chen WJ, Woodruff T, McCarthy MM, Sohrabji F, Schiebinger L, Wetherington CL, et al. 2017. Considering sex as a biological variable in preclinical research. FASEB J 31:29–34. [DOI] [PMC free article] [PubMed] [Google Scholar]
- National Institutes of Health. 2015. Consideration of sex as a biological variable in NIH-funded research, Available at: https://grants.nih.gov/grants/guide/notice-files/NOT-OD-15-102.html, accessed December 18, 2018.
- Narumi K, Ashizawa K, Takashima R, Takasawa H, Katayama S, Tsuzuki Y, Tatemoto H, Morita T, Hayashi M, Hamada S. 2012. Development of a repeated-dose liver micronucleus assay using adult rats: An investigation of diethylnitrosamine and 2,4-diaminotoluene. Mutat Res 747:234–239. [DOI] [PubMed] [Google Scholar]
- OECD (Organisation for Economic Cooperation and Development). 2013. OECD Guidelines for the testing of chemicals: Test No. 488: Transgenic rodent somatic and germ cell gene mutations assays. Available at: https://www.oecd-ilibrary.org/environment/test-no-488-transgenic-rodent-somatic-and-germ-cell-gene-mutation-assays_9789264203907-en, accessed December 18, 2018.
- Pfuhler S, Kirkland D, Kasper P, Hayashi M, Vanparys P, Carmichael P, Dertinger S, Eastmond D, Elhajouji A, Krul C, et al. 2009. Reduction of use of animals in regulatory genotoxicity testing: Identification and implementation opportunities-Report from an ECVAM workshop. Mutat Res 680:31–42. [DOI] [PubMed] [Google Scholar]
- Phonethepswath S, Franklin D, Torous DK, Bryce SM, Bemis JC, Raja S, Avlasevich S, Weller P, Hyrien O, Palis J, et al. 2010. Pig-a mutation: Kinetics in rat erythrocytes following exposure to five prototypical mutagens. Toxicol Sci 114:59–70. [DOI] [PMC free article] [PubMed] [Google Scholar]
- Rodriguez GI, Kuhn JG, Weiss GR, Hilsenbeck SG, Eckardt JR, Thurman A, Rinaldi DA, Hodges S, Von Hoff DD, Rowinski EK. 1998. A bioavailability and pharmacokinetics study of oral and intravenous hydroxyurea. Blood 91:1533–1541. [PubMed] [Google Scholar]
- Recio L, Hobbs C, Caspary W, Witt KL. 2010. Dose-response assessment of four genotoxic chemicals in a combined mouse and rat micronucleus and comet assay protocol. J Toxicol Sci 35:149–162. [DOI] [PMC free article] [PubMed] [Google Scholar]
- Rothfuss A, O’Donovan M, De Boeck M, Brault D, Czich A, Custer L, Hamada S, Plappert-Helbig U, Hayashi M, Howe J, et al. 2010. Collaborative study on fifteen compounds in the rat-liver comet assay integrated into 2- and 4-week repeat-dose studies. Mutat Res 702:40–69. [DOI] [PubMed] [Google Scholar]
- Russell WMS, Burch RL. 1959. The Principles of Humane Experimental Technique. London: Methuen and Co. [Google Scholar]
- Stankowski LF Jr, Roberts DJ, Chen H, Lawlor T, McKeon M, Murli H, Thakur A, Xu Y. 2011. Integration of Pig-a, micronucleus, chromosome aberration, and comet assay endpoints in a 28-day rodent toxicity study with 4-nitroquinoline-1-oxide. Environ Mol Mutagen 52:738–747. [DOI] [PubMed] [Google Scholar]
- Takasawa H, Suzuki H, Ogawa I, Shimada Y, Kobayashi K, Terashima Y, Matsumoto H, Oshida K, Ohta R, Imamura T, et al. 2010. Evaluation of a liver micronucleus assay in young rats (IV): A study using a double-dosing/single-sampling method by the Collaborative Study Group for the Micronucleus Test (CSGMT)/Japanese Environmental Mutagen Society (JEMS)—Mammalian Mutagenicity Study Group (MMS). Mutat Res 698:24–29. [DOI] [PubMed] [Google Scholar]
- Tometsko AM, Torous DK, Dertinger SD. 1993. Analysis of micronucleated cells by flow cytometry. 1. Achieving high resolution with a malaria model. Mutat Res 292:129–135. [DOI] [PubMed] [Google Scholar]
- Torous DK, Hall NE, Murante FG, Gleason SE, Tometsko CR, Dertinger SD. 2003. Comparative scoring of micronucleated reticulocytes in rat peripheral blood by flow cytometry and microscopy. Toxicol Sci 74:309–314. [DOI] [PubMed] [Google Scholar]
- Torous DK, Phonethepswath S, Avlasevich SL, Mereness J, Bryce SM, Bemis JC, Weller P, Bell S, Gleason C, Custer LL, et al. 2012. In vivo flow cytometric Pig-a and micronucleus assays: Highly sensitive discrimination of the carcinogen/noncarcinogen pair benzo(a) pyrene and pyrene using acute and repeated-dose designs. Environ Mol Mutagen 53:420–428. [DOI] [PubMed] [Google Scholar]
- Uno Y, Morita T, Luijten M, Beevers C, Hamada S, Itoh S, Ohyama W, Takasawa H. 2015. Recommended protocols for the liver micronucleus test: Report of the IWGT working group. Mutat Res 783:13–18. [DOI] [PubMed] [Google Scholar]
- Zeller A, Pfuhler S, Albertini S, Bringezu F, Czich A, Dietz Y, Fautz R, Hewitt NJ, Kirst A, Kasper P. 2018. A critical appraisal of the sensitivity of in vivo genotoxicity assays in detecting human carcinogens. Mutagenesis 33:179–193. [DOI] [PubMed] [Google Scholar]
Associated Data
This section collects any data citations, data availability statements, or supplementary materials included in this article.


