Abstract
Enhanced oil processing aims to retrieve petroleum fluids from depleted reservoirs after traditional processing. Hydrogels and polymeric macromolecules are considered effective displacing agents in oil reservoirs. In the current work, the authors used hydrophilic hydrogels based on poly(ethylene glycol)/poly(propylene glycol) (PEG/PPG) surfmers for oil displacement processes. Statistical modeling of the rheological properties at 80 °C for the two hydrogels indicates that the viscosity–shearing profile obeys the power-law model. Also, shear stress scanning follows the Herschel–Bulkley and the Bingham plastic models. The two hydrogels exhibit an initial yield stress owing to the formation of a three-dimensional (3D) structure at zero shearings. Furthermore, PEG and PPG hydrogels can retain the viscosity after a shear rate of 64.68 S–1. On the scale of surface activity, the two hydrogels exhibit higher surface areas (Am) of 0.1088 and 0.1058 nm2 and lower surface excess concentrations (Γm) of 1.529 and 1.567 × 10¹⁰ mol/cm2, respectively. A molecular dynamics (MD) simulation was conducted to explore the Flory–Huggins chi parameter, the solubility parameter, and the cohesive energy density. The results indicate a negative magnitude of chi parameter (χij) for water and salt, which indicates that the two hydrogels have a good tendency toward saline formation water in the underground petroleum reservoir. Furthermore, the dissipative particle dynamics (DPD) was performed on a mesoscale to investigate the interfacial tension, the radius of gyration, the concentration profile, and the radial distribution function. The increased radius of gyration (Rg) confirms that the two hydrogels are more overextended and can align perpendicularly toward the water/oil boundary. Experimental displacement was operated on a linear sandpack model using different slug concentrations. The oil recovery factor, the water-cut, and the differential pressure data during the flooding process were estimated as a function of the injected pore volume. The obtained results show that the oil recovery factor reaches 72 and 88% in the cases of PEG and PPG hydrogels at 80 °C with concentrations of 1.0 and 1.5 g/L, which reveals that both hydrogels are effective enhanced oil recovery (EOR) agents for the depleted reservoirs. This study establishes a new route that employs MD and DPD simulation in the field of enhanced oil recovery and the petroleum industry.
1. Introduction
Chemical improved oil recovery through polymer displacement is a general procedure to boost recovered oil amounts in depleted reservoirs1 since they thicken the injection fluid and improve the conformance control.2 One of the widely used polymeric systems is the hydrogels and their modifiers.3 Hydrogels are non-Newtonian cross-linked polymeric networks used as water shutoff agents and profile modifiers in petroleum processing, especially enhanced oil recovery (EOR).4,5 Although polyacrylates are widely used in polymer flooding, they undergo chain disintegration at high ionic strength and thermal impact.5 As a result, the incorporation of monomers containing hydrophobic moieties such as sulfurated and poly(ethylene/propylene glycol) (PEG/PPG) into the hydrogel backbone will enhance its thermal and ionic resistance and exhibit excellent water solubility owing to excessive H-bonding formation. The occurrence of polar and nonpolar groups in the molecular architecture of amphiphilic substances is responsible for their self-assembly at the oil/water (O/W) interface.6 Furthermore, the presence of a ring structure, such as the groups of 1-vinyl-2-pyrrolidone, will decrease the thermal degradation of the amide group. Also, the cyclic monomers provide a robust steric hindrance, which reduces the thermal chain disintegration.7 Implementation of hydrogels as flooding agents results in their ability to modify the injection profiles’ conformance in heterogeneous thief zones.3 Previous literature reported the synthesis and application of hydrogels in the EOR process, as indicated by Alvarado et al.8 In this regard, Sabhapondit et al.9 reported a polymer with good salt-resistance through copolymerization of N,N-dimethyl acrylamide with 2-acrylamide-2-methylpropane sulfonic acid. Malik et al.10 implemented alkyl poly(ethylene glycol) ether based on nonionic surfactants for EOR applications. Sampora et al.11 used sulfonated poly(ethylene glycol) oleate as a polymeric surfactant for EOR processing. Jalil and Hussein12 reported the wettability alteration of carbonate rocks using a blend of PEG polymer, nanosilica suspension, and sodium lauryl sulfate. Zhang et al.7 used hydrophobically associated polyacrylates as flooding agents through free radical polymerization. Zhou et al.5 synthesized tetracopolymer of acrylamide/2-acrylamide-2-methylpropane sulfonic acid, diacetone acrylamide, and N,N-dimethyl acrylamide with enhanced resistance toward temperature, salinity, and shearing effect. Iborra et al.13 studied the emulsifying properties of lauryl methacrylate and poly(ethylene glycol)methylethermethacrylate copolymer, which was prepared through atom-transfer radical copolymerization. Wu et al.14 synthesized hyperbranched copolymers with surface-active properties for enhanced oil recovery. Aktar et al.6 investigated the interaction of poly(ethylene glycol) with Triton X-100 in salt and salt-free solutions. Recent advances are directed toward the use of solar energy in combination with composite materials for the enhancement of water production.15 Other studies have discussed the enhancements of photovoltaic (PV) cells through cooling with phase-change materials (PCMs) as well as nanofluids.16 These techniques can be upgraded to be applied in the process of enhanced oil recovery.
Although most of the published literature focus on the experimental setup, theoretical chemistry and molecular dynamics simulation have become a widespread trend in recent scientific research. Molecular dynamics simulation is an efficient facility to explain the orientation and arrangement of molecular structures and link the microscopic scale with the macroscopic scale.1,6,17 In this regard, Remesal et al.18 conducted a molecular dynamics simulation to investigate the effects of ionic strength and temperature on the interfacial tension (IFT) at the hydrocarbon/brine interface. Goodarzi and Zendehboudi19 used molecular dynamics to inspect the modification of interfacial properties at the O/W interface relevant to the temperature and salinity. El-hoshoudy et al.1,17 used molecular dynamics and Monte Carlo simulations to investigate the application of palmitate-guar gum and deep eutectic solvents as flooding agents in enhanced oil recovery.
The dissipative particle dynamics (DPD) is a mesoscale simulation conducted for forecasting the interfacial criteria at the water/oil boundaries.19 Rekvig et al.20 conducted DPD to scrutinize the impact of surfactant size and structure on interfacial tension reduction at the oil/water interface. Ginzburg et al.21 used DPD simulation and the self-consistent field theory to screen the interfacial tension in the ternary water/oil/surfactant system. Li et al.22 implemented a DPD simulation to model the adsorption of cetyltrimethylammonium bromide at the oil/water boundary. Wang et al.23 modeled the performance of water/oil/surfactant through DPD simulation using various combinations and concentrations of nonionic/ionic surfactants. Rezaei and Modarress24 conducted a DPD for simulating the IFT of cycloalkanes, aromatics, and aliphatic hydrocarbons. Goodarzi and Zendehboudi19 used DPD molecular dynamics strategies to model the dynamics and structural criteria of water/oil/surfactant systems relevant to surfactant concentration, water/oil ratio, ionic strength, and temperature. Wang et al.25 used DPD to investigate the flow behavior, rheological properties, phase behavior, and morphology of the polypropylene/polyethylene blend under a coupled extension and shearing flow field. The novel contribution of the current research comprises the synthesis of poly(ethylene/propylene glycol)-based hydrogels through the emulsion polymerization technique and then evaluates their rheological performance under stimulated reservoir conditions. Moreover, molecular dynamics simulation was implemented to assess some crucial parameters, including the Flory–Huggins chi parameter and cohesive energy density, which will be used as input for dissipative particle dynamics (DPD) to evaluate the interfacial tension behavior. Finally, polymer flooding experiments will be conducted on the lab scale to assess the polymer ability in EOR processes. The commercial impact of this study can guide petroleum engineers in maximizing the recovered oil amount through polymer flooding techniques. The theoretical impact comprises the employment of MD and DPD simulation in the field of enhanced oil recovery to investigate the hydrogel/oil miscibility and the interfacial properties, which in turn establish a novel foundation that links the theoretical and quantum studies to the field of EOR.
2. Results and Discussion
2.1. Assessment of Rheological Performance
Polymer flooding in underground reservoirs is affected by salinity, temperature, and shearing action of fluids. However, polymer assessment was conducted relative to these factors individually, as discussed in our previous studies.3,26−31 In this section, the performance of two hydrogels is screened as a function of simulated reservoir conditions collectively. The reservoir temperature is a constant value, while the salinity and shearing action vary vigorously depending on variation of the injection and producing zones, pumping action, and heterogeneous reservoir nature. Consequently, the rheological criteria were evaluated at different salinities and shearing behaviors at a constant temperature of 80 °C. Long-term thermal aging under high ionic strength reduces the viscosity of the gel system.32 During hydrogel injection in underground perforation, viscosity loss owing to mechanical, thermal, and ionic degradation takes place since the stress resistance of chemical bonds in the hydrogel architecture cannot resist the tensile stress enforced by severe underground conditions.4,5 With further temperature increase, the molecular associations deteriorate, and the internal movement of the single bond increases, leading to molecular chain curling.5Figure 1a–d displays the viscosity–shear rate profile of the PEG and PPG hydrogels at concentrations of 1.0 and 1.5 g/L, respectively. Both hydrogels follow the allometric power-law model according to eq 1 and exhibit shear-thinning behavior3 as indicated from the calculated parameters displayed in Figure 1.
| 1 |
The shear stress–shear rate profile was assessed at 80 °C and different polymer concentrations, as displayed in Figure 2. The result indicates that PEG and PPG hydrogels obey the Herschel–Bulkley and Bingham plastic models33 according to eqs 2 and 3, respectively, with a high precision degree.
| 2 |
| 3 |
PEG and PPG hydrogels exhibit initial yield stress (τ0) and shear-thinning performance. The presence of yield stress indicates the formation of a three-dimensional (3D) structure at zero shearings owing to the cross-linking density and hydrogen-bond formation in the hydrogel.3 The shear-thinning action reverts to dilation of the solution, and the disintegration of cross-linkage bonds by the shearing rate increases.3 PEG and PPG hydrogels can retain the viscosity after excessive shearing scission. This behavior is confirmed by the reduction of solution viscosity gradually by a shear rate increasing until 64.68 S–1; then, the solution viscosity reaches a nearby steady state. The effect of salinity on PEG and PPG performances was evaluated through monitoring viscosity values in different saline solutions (20, 40, and 80 g/L) at 80 °C. The saline solutions consist mainly of NaCl and CaCl2 salts. As salinity increases, the viscosity value diminishes to a specific limit owing to compression and collapsing of the hydrophobic associations through the polymeric network. By thermal treatment, hydrolyzed polyacrylates (HPMs) dissociate into a carboxylic acid (−COOH) group at temperatures >75 °C, so the solution viscosity is reduced.3 PEG and PPG hydrogels exhibit reasonable thermal stability owing to the occurrence of hydrophobic groups through the hydrogel matrix, which shields the interaction of Na+ and Ca2+ ions with polymer chains. Furthermore, it reduces the ability of Na+ and Ca2+ to compress the hydrodynamic volume of the polymeric network.5 Owing to the steric effect of the bulky branched groups of vinylpyrrolidone, the expansion degree of the polymeric network enriches, leading to enhancement of the solution viscosity.7 Moreover, the sulfonate groups boost the hydrogen bonding, thus enhancing the solution stability.7 The hydrophobic association is an endothermic process, which is boosted by heat intake and enhances the solution viscosity owing to the stretching of the macromolecular chain.14 The viscosity–shear rate profiles show that the PPG hydrogel exhibits higher viscosity values compared to the PEG hydrogel. This behavior may be justified by increasing the hydrophobic carbon chain in the PPG skeleton, thus giving rise to solution viscosity rather than the PEG hydrogel.
Figure 1.
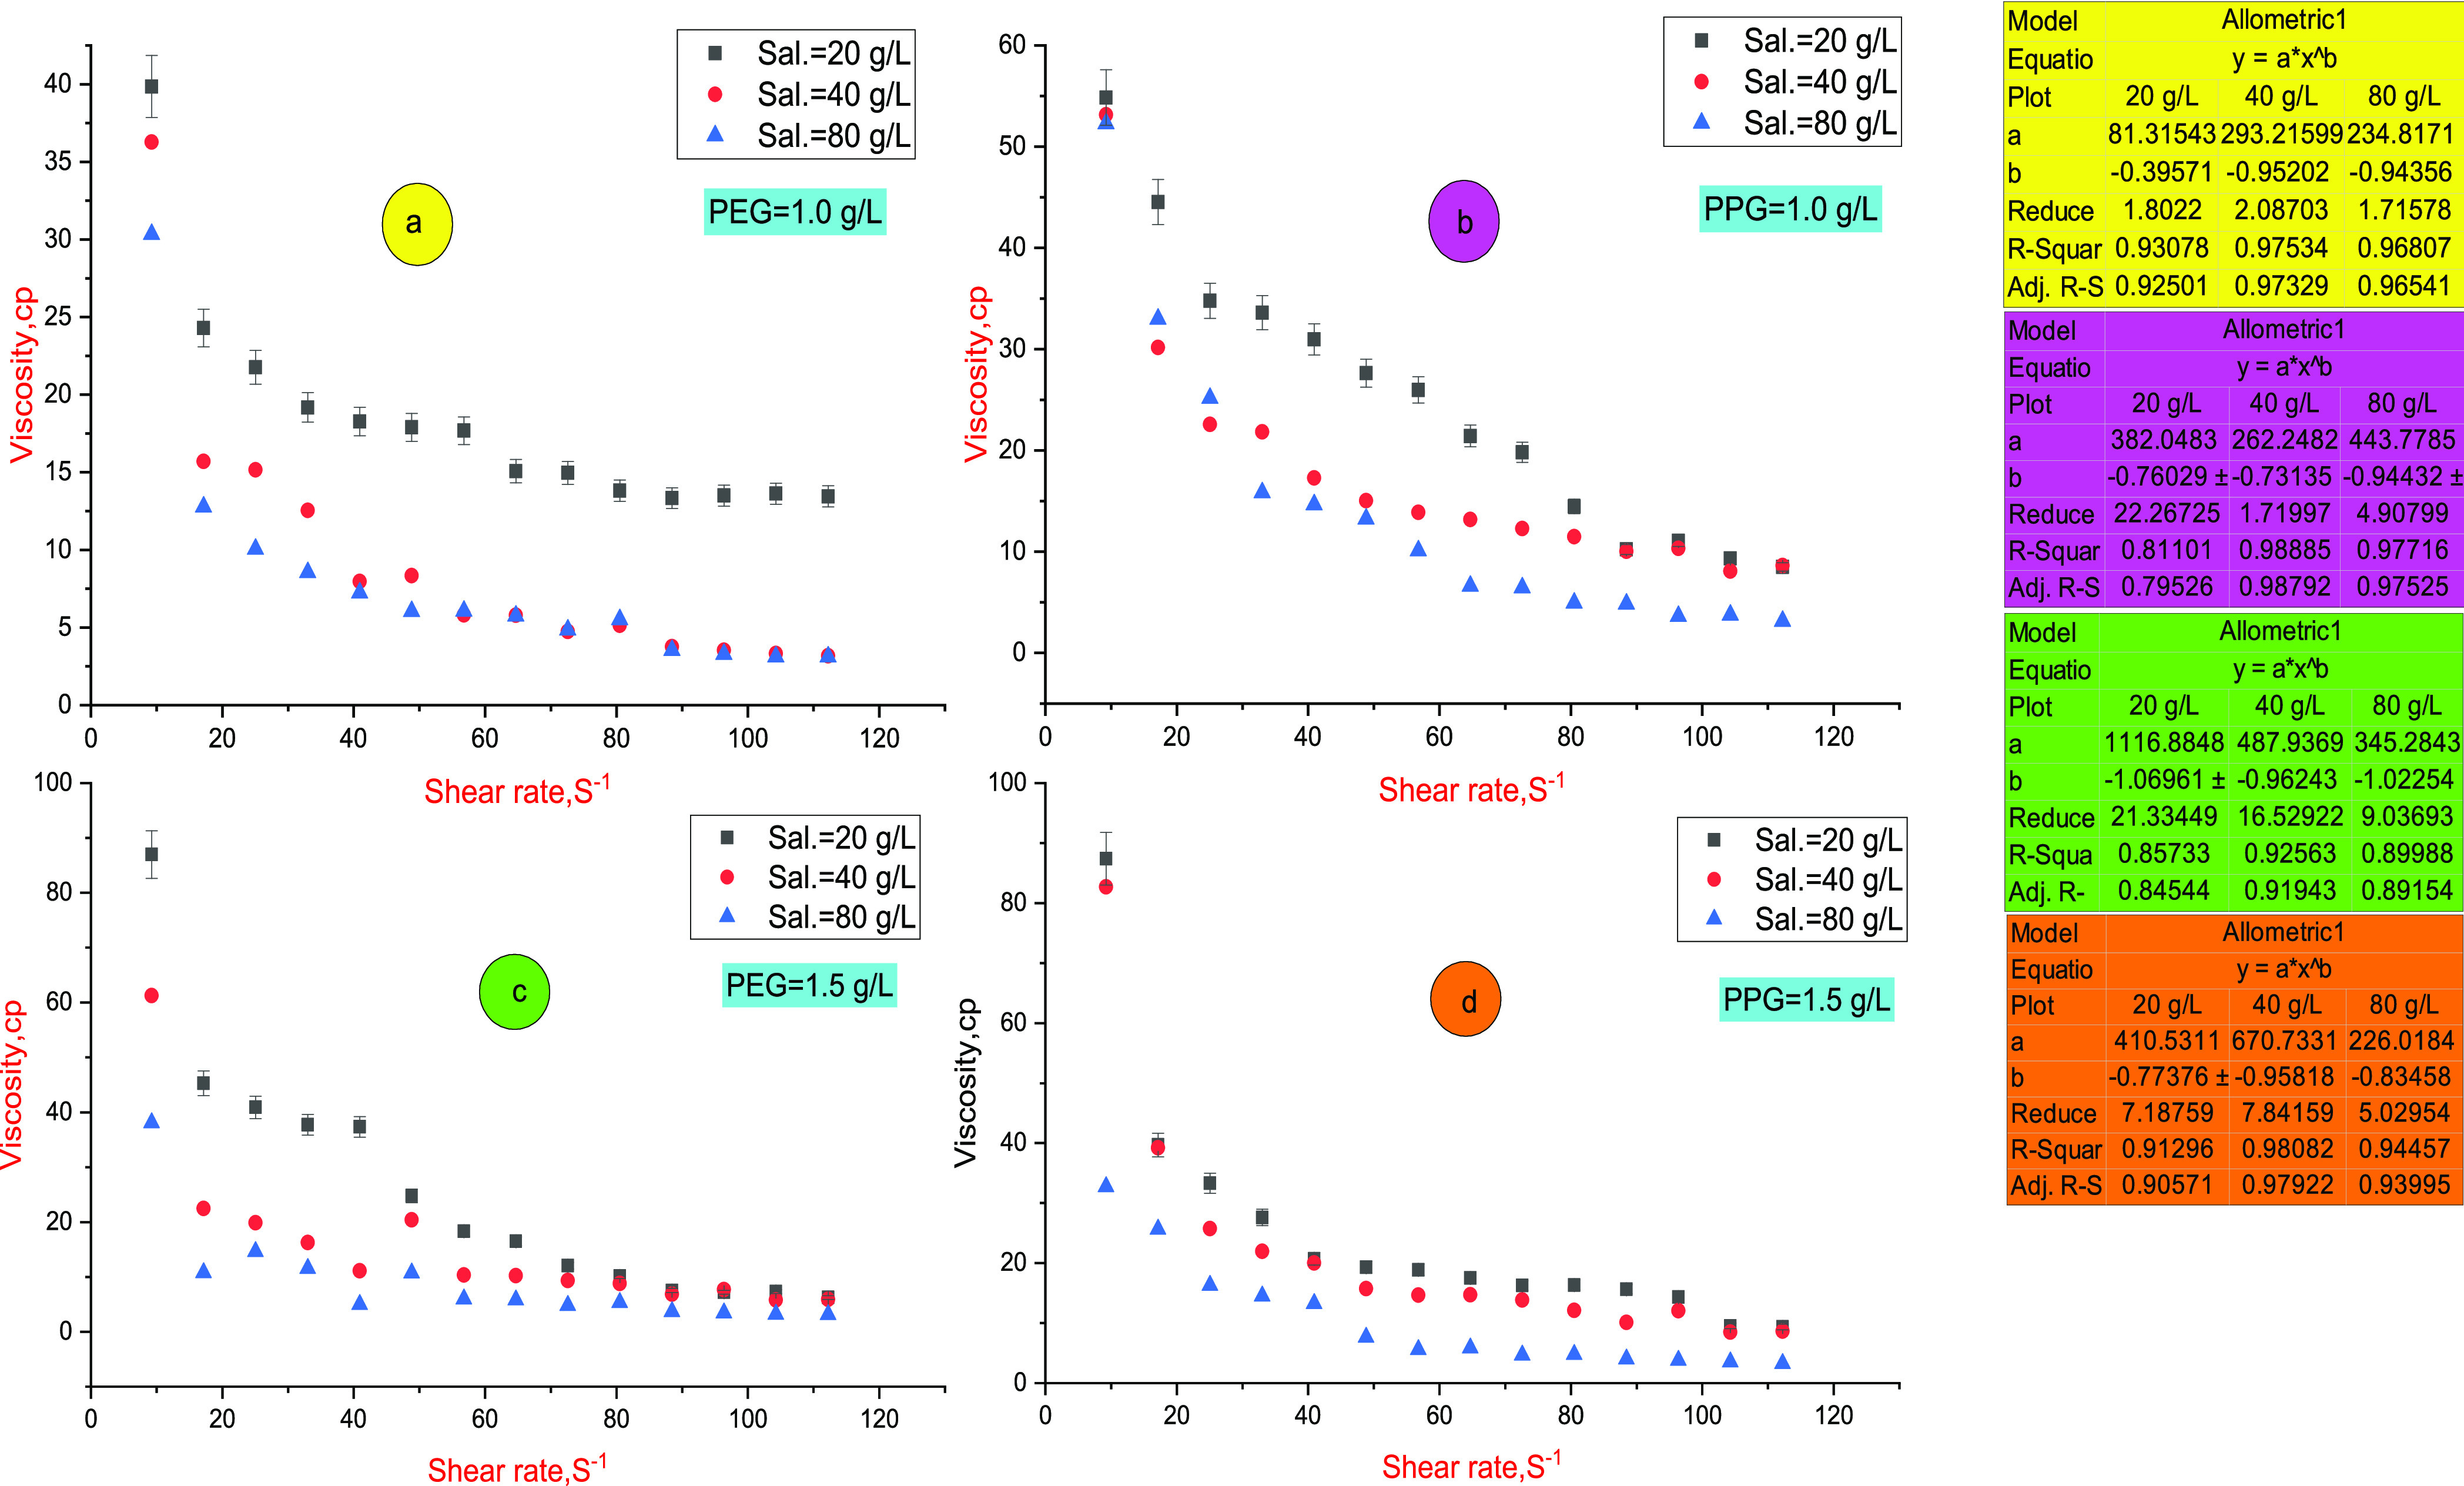
Viscosity–shear rate profile (power-law model) at different salinities and temperature of 80 °C; (a, b) viscosity profiles of PEG and PPG hydrogels, respectively, at a concentration of 1.0 g/L; (c, d) viscosity profiles of PEG and PPG hydrogels, respectively, at a concentration of 1.5 g/L. The calculated parameters were assigned to their consistent color.
Figure 2.
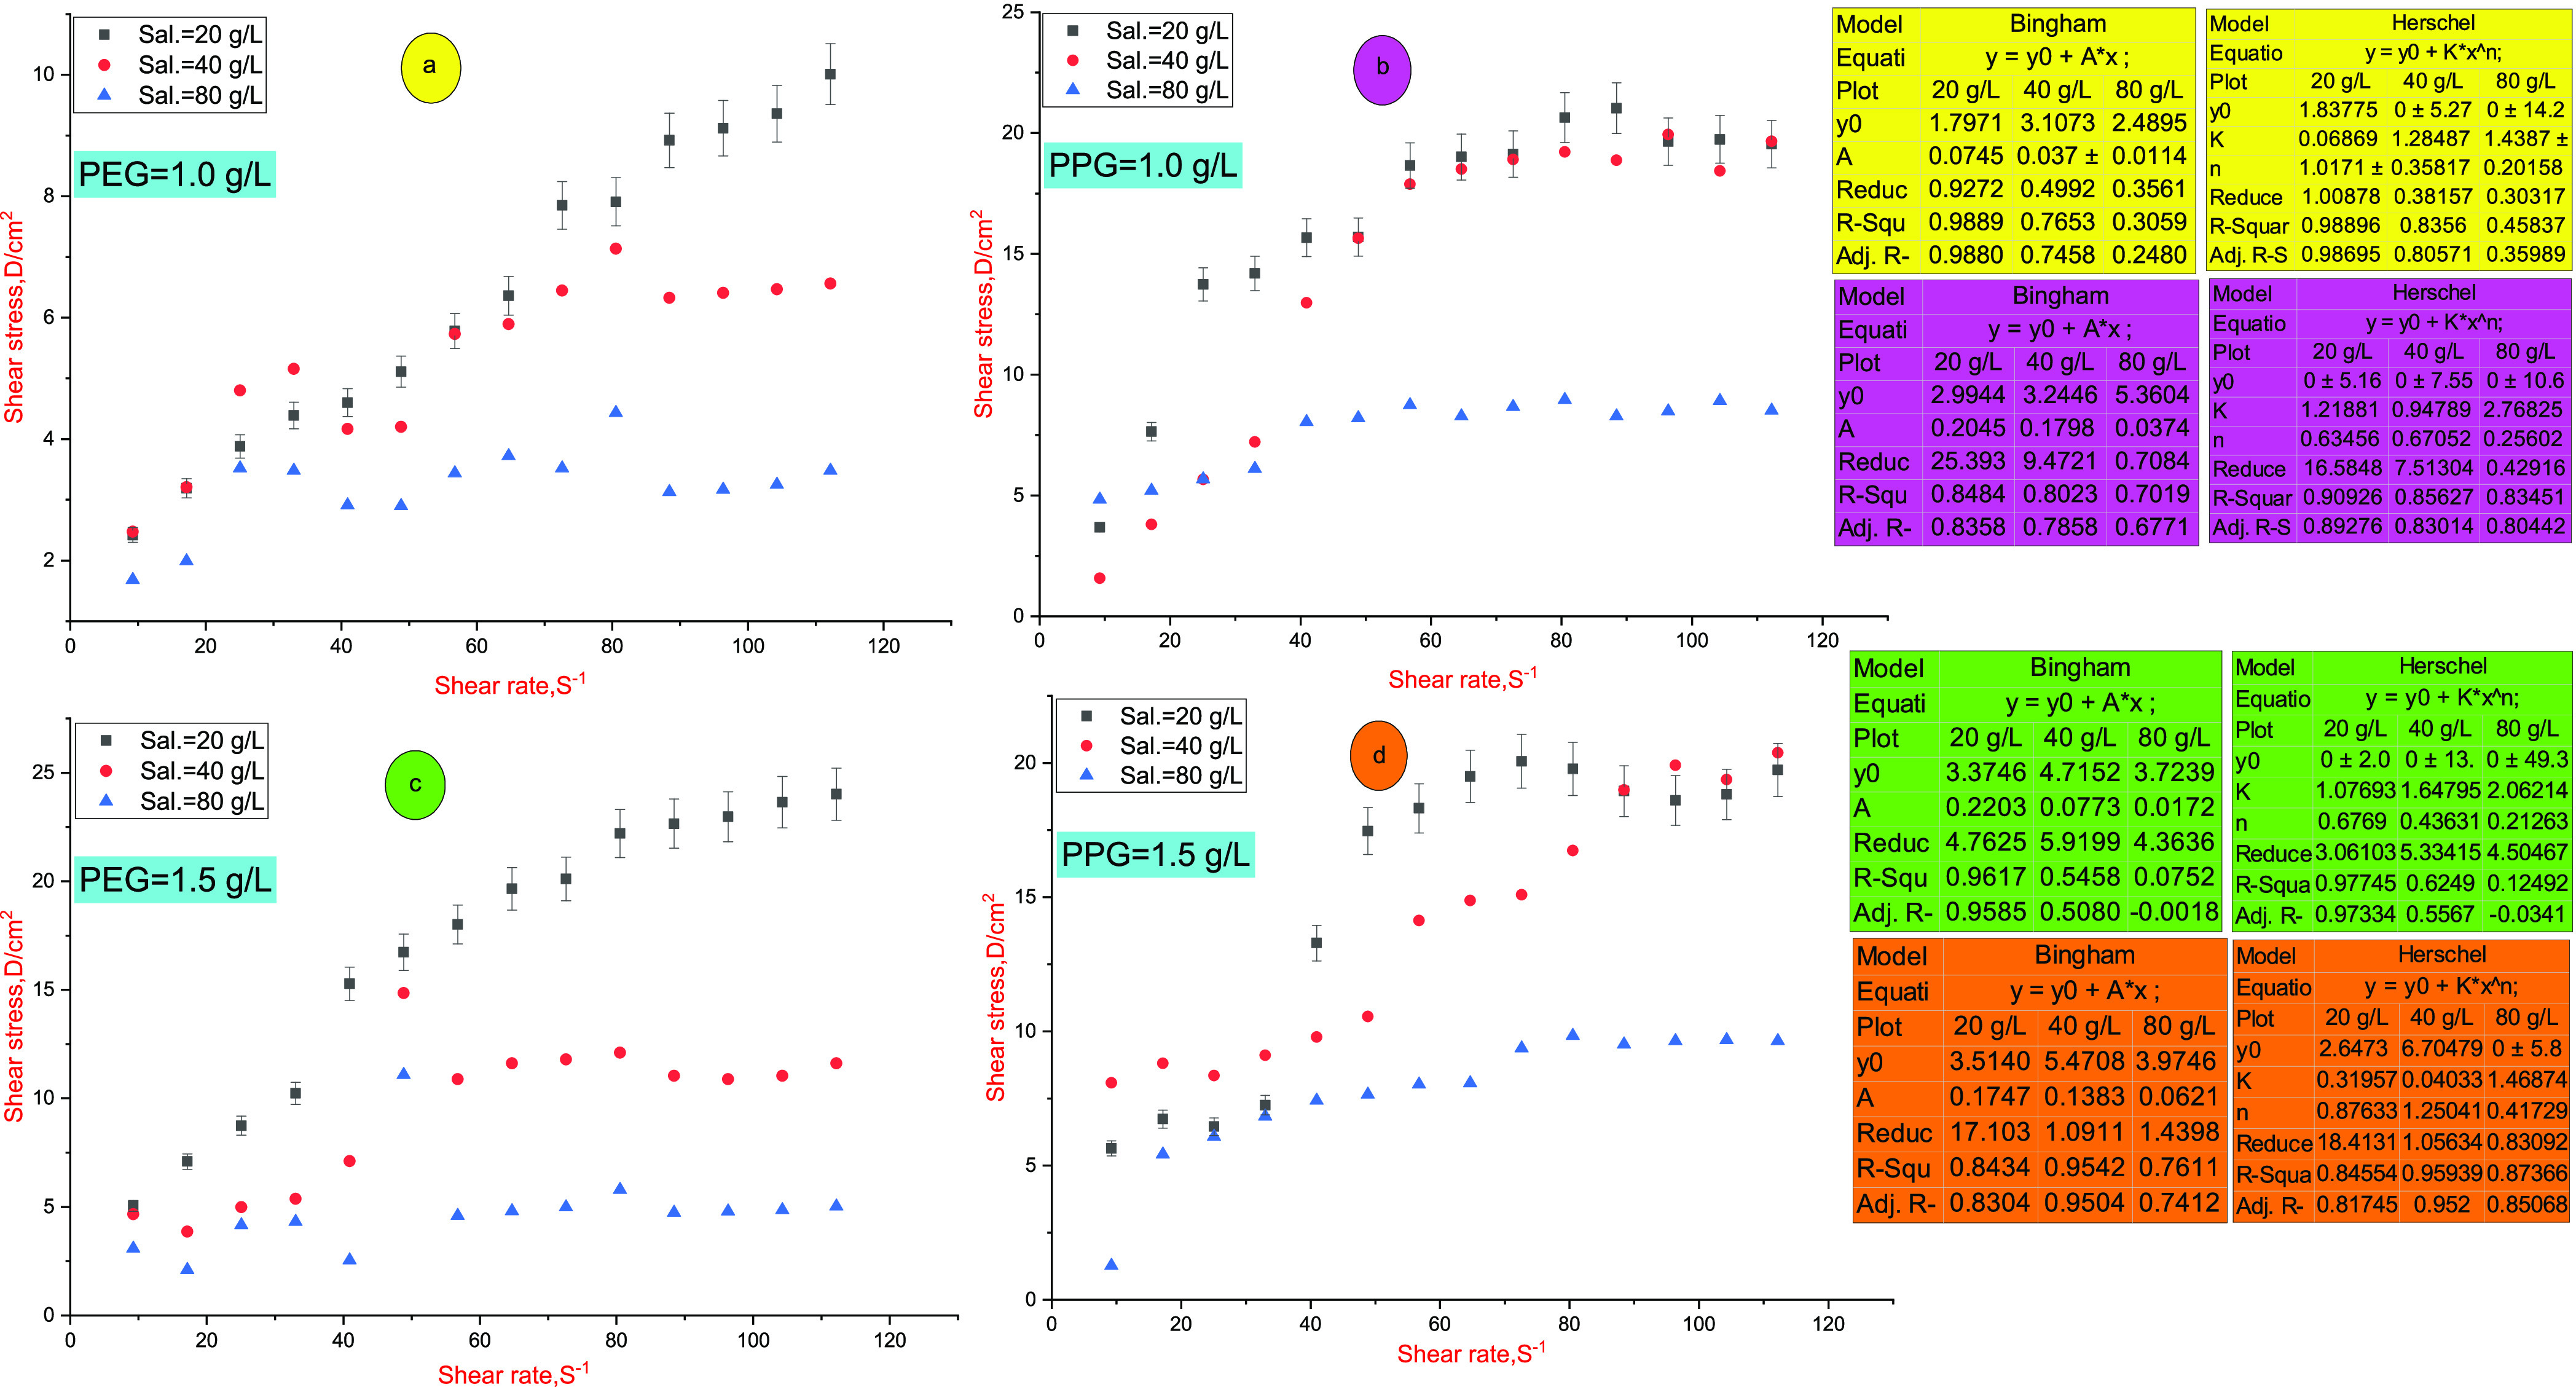
Shear rate–shear stress profiles (Bingham and Herschel–Bulkley models) at different salinities and temperature of 80 °C; (a, b) stress–shear profiles of PEG and PPG hydrogels, respectively, at a concentration of 1.0 g/L; (c, d) stress–shear profiles of PEG and PPG hydrogels, respectively, at a concentration of 1.5 g/L. The calculated parameters were assigned to their consistent color.
2.2. Interfacial Tension (IFT) and Surface Activity
IFT assesses the free energy required for an interface arrangement between two phases in a specific surface area.19 During EOR processing, IFT acts as a critical parameter adjusting the oil displacement efficiency34 and the conformance profile.35 The insertion of a surfactant in the polymer backbone structure enhances the surface activity at the oil/water interface, thus improving oil recovery.19,36 PEG and PPG hydrogels exhibit a higher surface activity at the O/W interface owing to the presence of PEG and PPG surfmers in their structures. The excess surface concentrations and the minimum surface area exerted by PEG and PPG hydrogels at the interface can be calculated from the Gibbs isothermal model, as formulated in eqs 4 and 5 and summarized in Table 1. Here, (δσ/δC)max,T is calculated from the slope of the plot of surface tension (σ) versus concentration (ln C) at constant temperature (T).37 The excess surface concentration (Γm) is the maximum value achieved by molecule adsorption and measures the effectiveness of the molecule adsorption at the O/W interface.13 According to the Gibbs adsorption equation, Γm is calculated according to eq 4. The minimum surface area (Am) per molecule at the interface is the minimum area occupied by that molecule and reveals the extent of packing degree and particle orientation at the O/W interface.13 It can be formulated as a function of the surface excess concentration (Γm) as formulated in eq 5, where Γm is inversely proportional to Am.3838
| 4 |
| 5 |
Table 1. Surface Properties of PEG and PPG Hydrogels.
| property | PEG hydrogel | PPG hydrogel |
|---|---|---|
| bulk concentration, g/L | 1.5 | 1.5 |
| surface tension, mN/m | 36.58 | 33.01 |
| Γm × 1010, mol/cm2 | 1.567 | 1.529 |
| Am, nm2 | 0.1058 | 0.1088 |
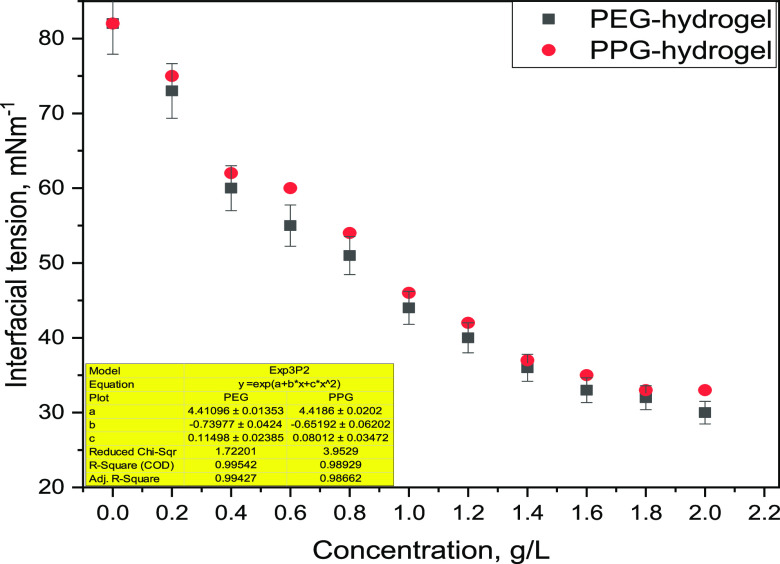
The higher surface area (Am) and lower surface excess concentrations (Γm) of both PEG and PPG hydrogels confirm their higher surface activity, which is a critical parameter through the EOR application.39 PPG exhibits more significant surface tension reduction at the critical micelle concentration. This behavior may result in increasing the surface activity by increasing the length of the hydrophobic carbon chains in poly(ethylene glycol)dimethacrylate (PEG) as well as poly(propylene glycol)dimethacrylate (PPG) surfmers.37 The interfacial tension of PEG and PPG hydrogels was assessed with different slug concentrations at a salinity of 80.0 g/L and a temperature of 80 °C displayed in Figure 3. The ability of interfacial tension reduction results in hydrophilic–lipophilic associations through the network of PEG and PPG hydrogels. Furthermore, the amphipathic nature of PEG and PPG surfmers owing to the presence of polar and nonpolar groups in their molecular architecture allows their self-assembly at the oil/water (O/W) interface,6 which in turn give rises to a micellelike structure or development at the O/W interface, thus reducing IFT.40 The interfacial tension (IFT) can be formulated as a function of PEG and PPG concentrations (Cp) through an empirical correlation,39 as expressed in eq 6, with its constants displayed in Figure 3. Validation of these developed models will be investigated in the upcoming work, where the model will be trained through an artificial neural network, or Aspen plus software,41 using single-factor and orthogonal experiments and compare the calculated results with the experimental one.
| 6 |
Figure 3.
Interfacial tension relevant to PEG and PPG hydrogel concentrations.
3. Molecular Modeling and Simulation
3.1. Molecular Dynamics (MD) Simulation
Molecular dynamics simulation was conducted to assess the Flory–Huggins chi parameter using the solubility parameter and cohesive energy calculations.19 The DPD repulsive interaction parameter (aij) was calculated from the dependence of the dimensionless chi parameter on the system temperature using molecular dynamics.19 The chi parameter (χbs), and the mixing energy between the base and screen, can be calculated using the following expression42
| 7 |
| 8 |
The PEG and PPG hydrogels built with Random Copolymer Builder were implemented in DS Biovia Material Studio43 with a chain length of 10.0 units after setting the geometry of the repeating monomers. The detailed computational summary for MD and DPD simulation is provided in Table 2. All calculations were conducted using the “COMPASS” forcefield assigned and the Berendsen thermostat at medium quality.43 Condensed-phase Optimized Molecular Potential for Atomistic Simulation Studies (COMPASS) is an ab initio forcefield conceived explicitly for polymer calculations.1,39 Geometry optimization for a mixture of water, NaCl salt, and PEG and PPG hydrogels was carried out using the forcite module. All molecules were geometry-optimized explicitly before calculation, where separated polymer molecules were first optimized and then the polymer was created. The amorphous cell module is used to construct an amorphous three-dimensional periodic configuration of polymeric construction using monomer repeating units, which will be used as inputs for the blend module.
Table 2. Computational Details of MD and DPD Simulation.
| (i) molecular dynamics (MD) simulation | |||
|---|---|---|---|
| Geometry Optimization | |||
| quality | medium | displacement | 0.5 Å |
| algorithms | smart | maximum iteration | 500 |
| energy convergence | 0.001 kcal/mol | forcefield | COMPASS |
| force | 0.005 kcal mol–1 Å–1 | charges | forcefield assigned |
| truncation | cubic spline | spline width | 1.0 Å |
| cutoff distance | 12.5 Å | buffer width | 0.5 Å |
| van der Waals interaction | atom-based | electrostatic interaction | group-based |
| Amorphous Cell Construction | |||
| lattice type | cubic | no. of configurations | 10 |
| temperature | 298 K | total density of final configurations | 1.0 g/cc |
| Ewald accuracy | 0.001 kcal/mol | ||
| Blend Module (Mixing Task) | |||
| cutoff | 12.5 Å | energy samples | 10 × 106 |
| spline width | 1.0 Å | energy bin width | 2.183 kcal/mol |
| algorithm | smart | cluster samples | 1000 |
| time step | 1.0 fs | iteration per cluster | 20 |
| simulation time | 5.0 ps | reference temperature | 298 K |
| Forcite Module (Cohesive Energy Density Task) | |||
| quality | medium | total simulation time | 5.0 ps |
| ensemble | NVT | thermostat | Berendsen |
| time step | 1.0 fs | temperature difference | 10.0 K |
| (ii) dissipative particle dynamics (DPD) simulation | |||
| bead density | 3.0 | interaction parameter | 25.61 |
| no. of beads | 8142 beads | bead mass | 54 amu |
| time step | 254.117 fs | radius | 3.23 Å in a physical unit |
| production run | 5000 steps | electrostatic interaction | Ewald summation |
| initial velocities | random configuration | van der Waals interaction | bead-based method |
| temperature | 298 K (kBT = 1) | truncation | cubic spline |
| cutoff method | 12.5 Å | dissipation strength | 0.08854 Å |
| spline width | 1.0 Å | dissipation radius | 8.0 Å |
| buffer width | 0.5 Å | ||
Blends provide a way to shorten the discovery process by estimating the miscibility behavior of binary mixtures. These include solvent–solvent, polymer–solvent, and polymer–polymer mixtures. Blends predict the thermodynamics of mixing directly from the chemical structures of the two components and, therefore, require only their molecular structures and a forcefield as inputs.43,44 Simulation boxes conducted using cubic lattice type with dimensions of 17.42 × 17.42 × 17.42 Å3, vacuum thickness of 20 Å, crystal thickness of 40.99 Å, and surface cleavage of (−1 1 1) at equilibration temperature of 298.0 K17 utilizing the NPT ensemble (consistent number of moles, pressure, and temperature) with periodic boundaries and initial random velocities to avoid truncation and miscalculations result from inhomogeneous box density.
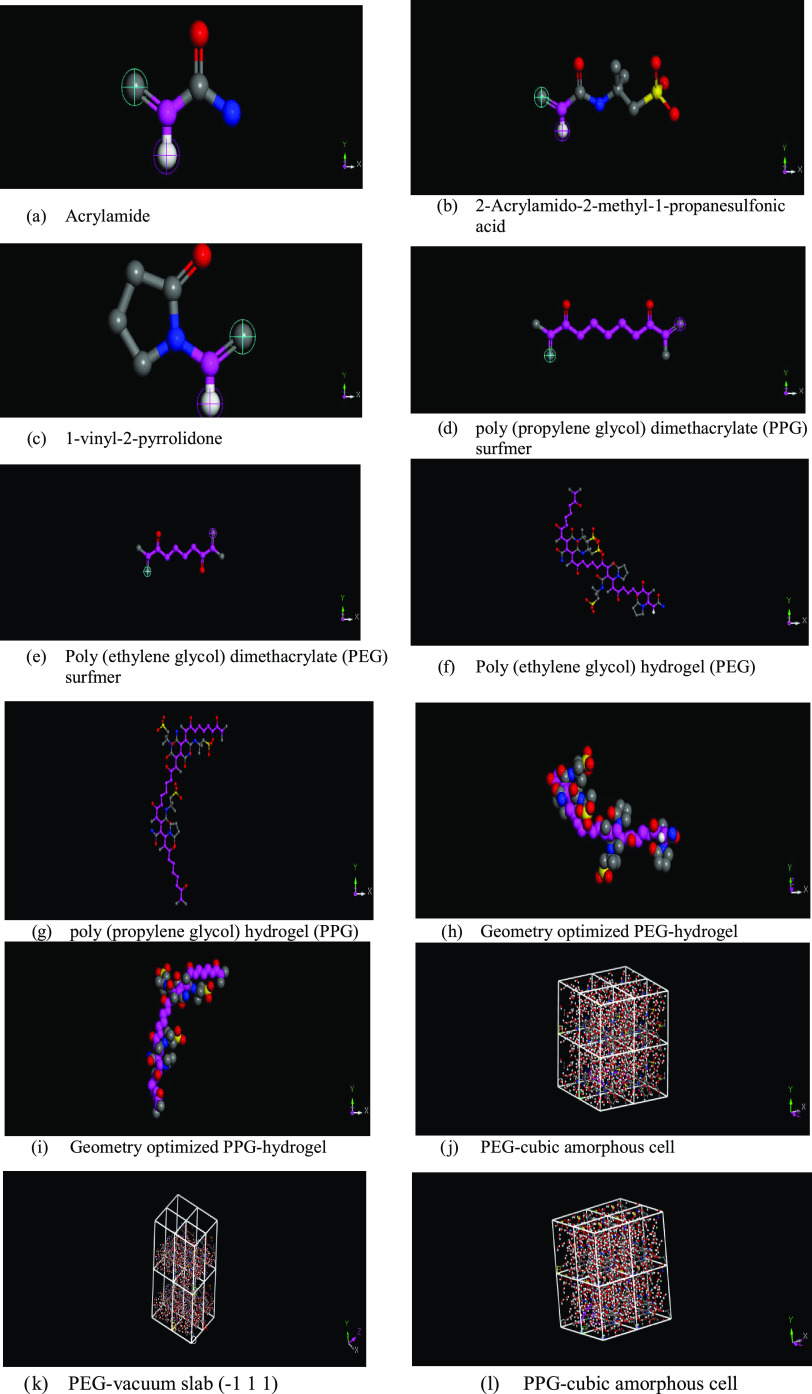
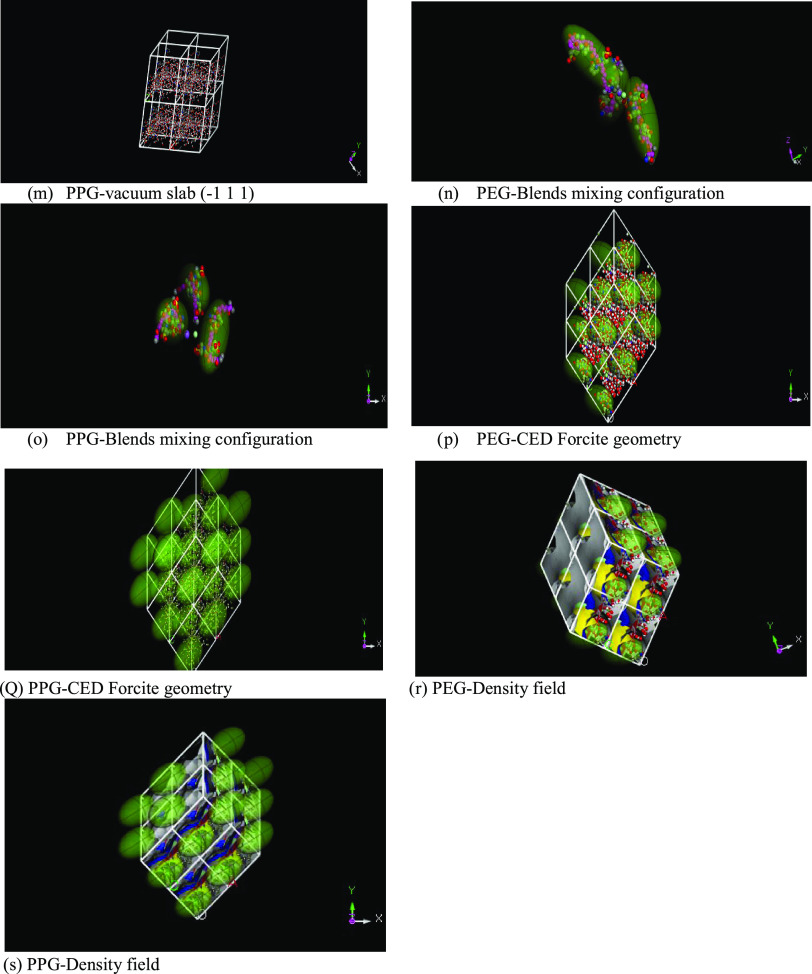
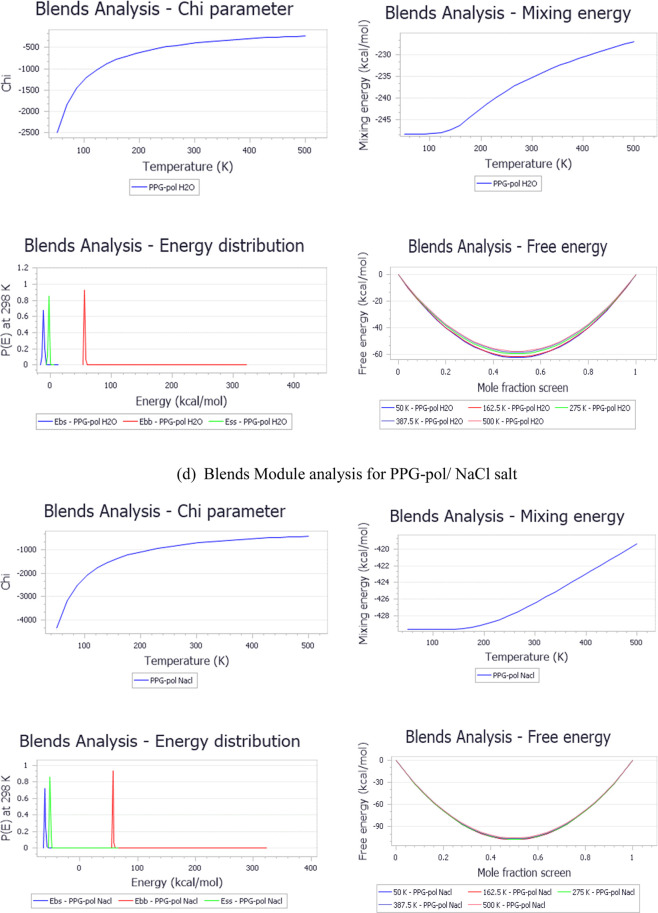
After equilibrating the initial geometries, the interaction energies, miscibility, and Flory–Huggins chi parameter were calculated through mixing tasks in the blend module. The blend module was employed to calculate the binary mixtures’ miscibility and the chi parameter depending on the molecular formula of the inputs (i and j beads) as well as the assigned forcefield, where PEG and PPG are the bases. At the same time, water and NaCl salt are the screens. After that, the forcite module runs to estimate the cohesive energy density and the solubility parameter. The solubility parameter is a temperature-dependent factor, which is employed to obtain the mixture solubility behavior based on the cohesive energy density.19 The output calculations of the blends and forcite module are summarized in Table 3. The obtained simulation results are in close agreement with the published literature data. Figure 4 summarizes the initial configurations and outputs obtained through conducting MD simulations (blends and forcite) on PEG and PPG hydrogels. Figure 4a–e are the input parameters, while Figure 4f–s are the outputs.
Table 3. Calculated Parameters of MD Simulation (Blends and Forcite Modules).
| calculation parameter | PEG hydrogel | PPG hydrogel | |||
|---|---|---|---|---|---|
| blend module analysis | base | PEG-pol | PEG-pol | PPG-pol | PPG-pol |
| screen | H2O | NaCl | H2O | NaCl | |
| energies | PEG-pol_H2O | PEG-pol_Nacl | PPG-pol_H2O | PPG-pol_Nacl | |
| chi (298 K) | –458.94 | –770.19 | –397.37 | –720.28 | |
| Emix (298 K) | –271.78 | –456.10 | –235.32 | –426.54 | |
| Ebb avg (298 K) | 70.03 | 70.03 | 56.92 | 56.92 | |
| Ebs avg (298 K) | –10.72 | –58.73 | –10.64 | –60.46 | |
| Ess avg (298 K) | –2.34 | –52.18 | –2.36 | –52.07 | |
| forcite module analysis | structure | PEG-pol (−1 1 1) | PPG-pol (−1 1 1) | ||
| cohesive energy density | 6.58 × 10⁸ | 6.32 × 10⁸ | |||
| solubility parameter | 25.65 | 25.14 | |||
| interpotential energy | –1310.68 | –1316.45 | |||
| inter van der Waals energy | 261.28 | 239.50 | |||
Figure 4.
Result of initial and output configurations from MD simulation.
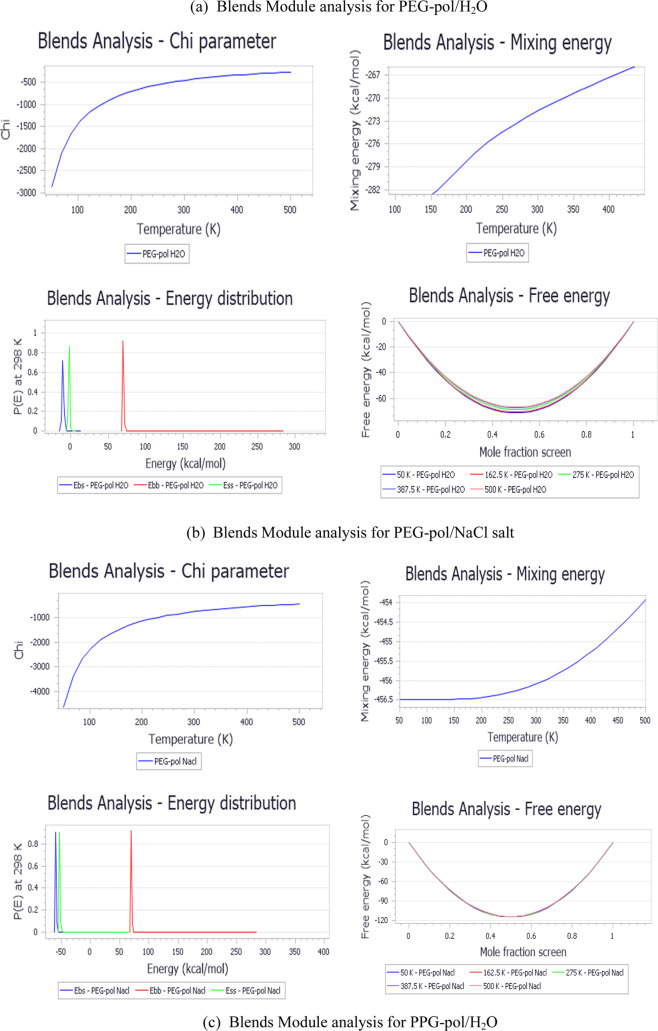
Figure 5 indicates that, by temperature increases, the magnitude of the chi parameter decreases, leading to an increase in the molecule’s miscibility. A higher cohesive energy density indicated the highest solubility.45 Typically, a small or negative value of χij for PEG and PPG hydrogel/water, PEG and PPG hydrogel/salt, means that the two hydrogels have a good tendency toward water and salt, which are the major components of a petroleum reservoir. These results confirm the possible implementation of these hydrogels in the EOR application. The analysis of MD simulation operated by the forcite module for PEG and PPG hydrogels at 298.0 K is provided in Figure S1, which indicates that an increase in the radius of gyration (Rg) confirms that the molecules are more overextended and aligned perpendicularly toward the water/oil boundary.
Figure 5.
Calculation analysis of the blend module including the chi parameter, mixing energy, energy distribution, and free energies for PEG and PPG hydrogels (base) relevant to H2O and salt screens.
3.2. Dissipative Particle Dynamics (DPD)
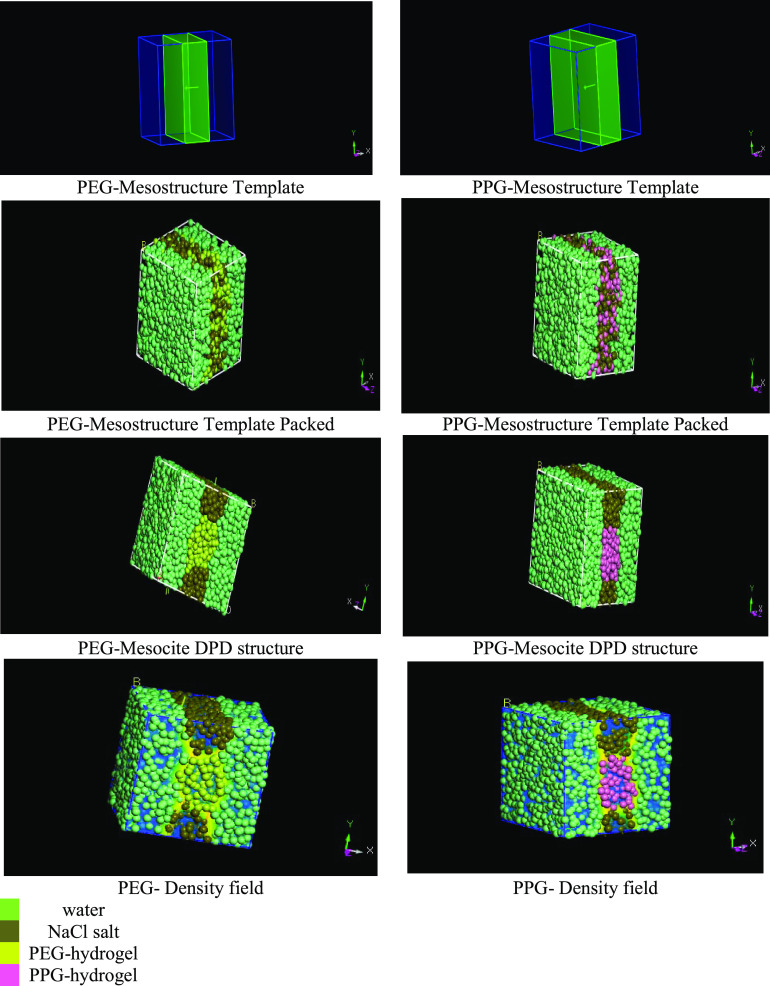
DPD is a mesoscopic coarse-graining molecular dynamics simulation. It relies on the coarseness of the grains for modeling the interfacial density and interfacial tension of complex fluids on a mesoscopic scale.25,46 DPD was developed to simulate complex fluids,47 polymer blends, petroleum fluids,19 and complex configurations.48 In this simulation, the water molecules, salt, and PEG and PPG hydrogels are represented by a set of soft beads (DPD particles) interacting with neighbor particles via soft potentials49 and move freely according to Newton’s second law19 as shown in Figure 6. The soft potential allows a longer time step and length scale than classical molecular dynamics (MD) simulation.22 The particles are subjected to a set of conservative, dissipative, and random momentum forces.50 Furthermore, DPD is employed to simulate the oil/water/hydrogel system.22 The concept, analysis theory, and the mathematical expressions used in DPD simulation are reported elsewhere for further reading.19,50 In DPD, conservative (fi), random (FijR), and dissipative (Fij) forces act between two particles i and j with rij apart represented by the following expressions
| 9 |
| 10 |
| 11 |
| 12 |
The combined effect of these two forces is a thermostat, which conserves momentum and, hence, gives the correct hydrodynamics. aij, σ, and η determine the amplitudes of the conservative, random, and dissipative forces, respectively.22 The DPD simulation was conducted using the mesocite module in the DS Biovia Materials Studio package. The calculation was performed in a simulated box of a 3D triclinic lattice of (90 × 90 × 90 Å3), where periodic boundary conditions are applied in (x,y,z) directions.22 The conservative interaction was correlated as a function of the Flory–Huggins parameters for polymers by the following expression25
| 13 |
Figure 6.
PEG- and PPG-hydrogel configurations resulting from the DPD simulation.
The self-assembled polymeric networks interconnect with each other leading to a flakelike micelle formation, which produces a percolated gel-like network under equilibrium conditions.25 At the simulation commencement, the PEG and PPG hydrogels are oriented at the interface, so the interface becomes saturated, and the interface bends to expand, leading to interfacial tension reduction.19 The relative concentration profiles and the radius of gyration values for different system beads are displayed in Figure S2. According to the concentration profile, the concentrations of PEG and PPG molecules increase at the interfaces. Furthermore, the beads (water molecules, salt, and PEG and PPG hydrogels) are tightly packed at the interface, leading to the IFT reduction. The structural behaviors of the beads are investigated as a function of the radius of gyration (Rg). Higher Rg values confirm that PEG and PPG hydrogels straighten and are oriented perpendicularly at the interface. The increase in Rg results in H-bonding and electrostatic interaction between hydrophilic and lipophilic groups in the hydrogel network.19 The DPD simulation indicates the ability of PEG and PPG hydrogels to reduce interfacial tension at the oil/brine interface, which in turn increases the displaced oil amount. These results are in agreement with those of Sharipova et al.51 and Li et al.22
3.3. Assessment of the Oil Recovery Factor
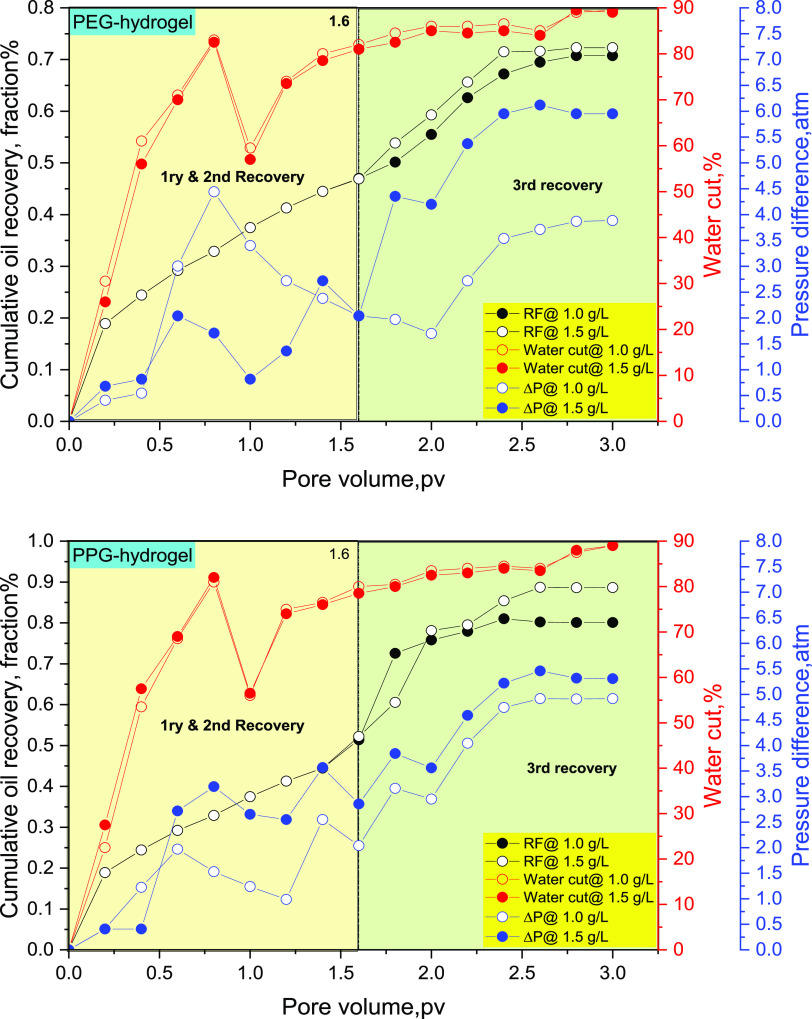
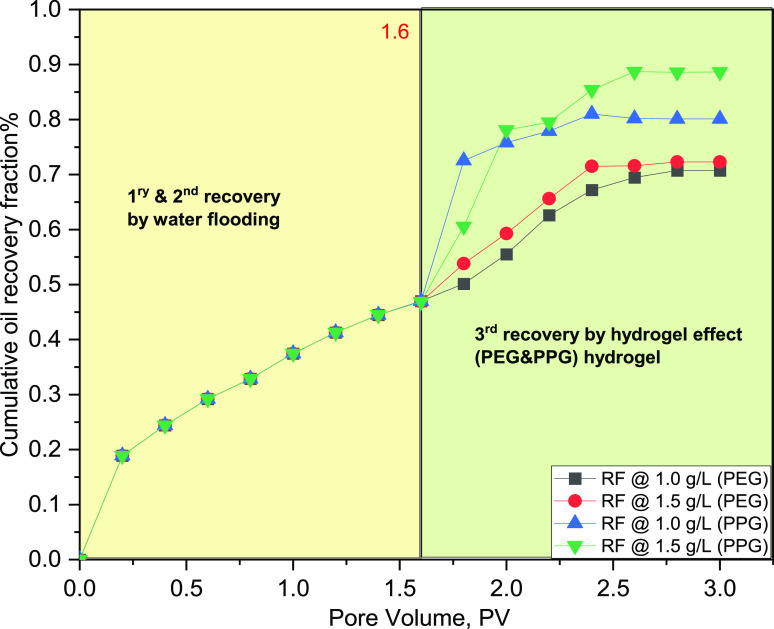
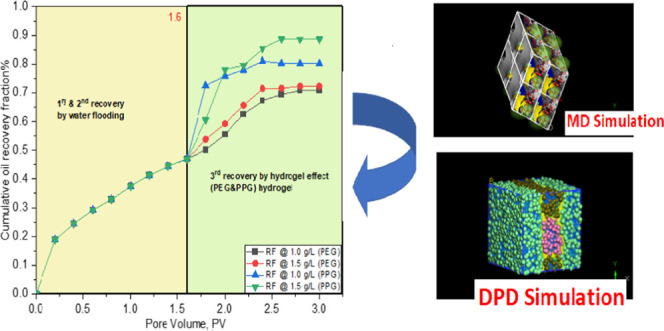
Experimental flooding was conducted on a linear model packed with unconsolidated sandstone. The criteria of the model, flooding conditions, the mathematical expression used in the calculation of the oil recovery factor, as well as the mechanisms of oil recovery enhancement and permeability reduction through hydrogel treatment have been reported in our previous studies.3,26 The flooding process was conducted at a temperature of 80 °C using a slug of PEG and PPG hydrogel solution with concentrations of 1.0 and 1.5 g/L. The oil recovery factor, pressure drop, and water-cut are reported through the flooding process3 as displayed in Figure 7. The flooding process commences with water displacement, which simulates the primary and secondary oil recovery stages on the field scale, where the amount of ejected oil is calculated on a volume basis until the oil cut reaches <1%. This stage is represented in Figure 7 with the data captured before 1.6 PV. After 1.6 PV, this stage simulates the tertiary recovery exerted by the effect of displacing fluid (PEG or PPG) in our case, where the flooding process sustained until the oil cut ceased. The reader will observe that the oil recovery fraction and water-cut seem weakly dependent on the concentrations of the hydrogels in the two cases (1.0 and 1.5 g/L). This behavior is attributed to the displacement process conducted on a narrow scale in the lab where the total pore volume does not exceed 490 cc as reported in the literature.26 Consequently, the oil recovery fraction and water-cut difference are weakly dependent on the hydrogel concentration. On the other hand, there is a significant pressure drop difference, which results in the tangible variation of the two-solution viscosity, thus exerting high ΔP between the inlet and outlet pressures. To investigate the effect of hydrogel chemistry on oil recovery, the oil recovery fraction curves of the two hydrogels were superimposed, as displayed in Figure 8.
Figure 7.
Oil recovery factor (RF), water-cut, and pressure difference in the cases of PEG and PPG hydrogels, respectively, at concentrations of 1.0 and 1.5 g/L.
Figure 8.
First, second, and third oil recovery factors (RFs), in the cases of PEG and PPG hydrogels, respectively, at concentrations of 1.0 and 1.5 g/L.
The flooding data shows that the oil recovery factor reaches 72 and 88% in the cases of PEG and PPG hydrogels, respectively. The ability of both hydrogels to displace the oil results in their surface activity, which in turn decreases the O/W interfacial tension, thus enhancing the displacement efficiency and improving the oil recovery factor.1,52 The increased oil recovery in the case of the PPG hydrogel rather than the PEG hydrogel results in excessive hydrophobic association in the PPG hydrogel, which in turn increases the solution viscosity, compared to the brine viscosity, thus improving the sweeping efficiency.31 During brine flooding, the initial water-cut increases incrementally to reach 90% after 1.6 PV.31 Increasing the pressure difference after brine flooding (>1.6 PV) indicates that PEG and PPG hydrogels can shut off the highly permeable zones owing to their gelling and elastic effects,53 which hinder early water breakthrough, thus enhancing the oil recovery factor.3
3.4. Cost Estimation and Feasibility Study
The process of enhanced oil recovery is a key function of the economic cost of the flooding chemical agents and capital expenditures. Although the feasibility study was conducted on a field scale as stated in our previous study,54 in this study, the economic cost will be conducted on a lab scale to assess the possibility of industrial application for the synthesized hydrogels. As a result, the capital expenditure and oil-well overheads will be omitted from this lab-scale study, while the amount of recovered oil (bbl) and the cost of displacing chemicals (hydrogel, lb) will be considered in this study. The cost of chemicals was calculated depending on their current prices taking into consideration the reaction conditions and yield amount, while the recovered oil amount was recorded from the experimental displacement after waterflooding (1st and 2nd recovery stages) (i.e., this is the recovered amount from residual oil by the effect of the hydrogel). The summary of the conducted feasibility study on the lab scale is summarized in Table 4.
Table 4. Summary of Economic Cost for PEG and PPG Hydrogels on the Lab Scale.
| hydrogel | PEG | PPG | ||
|---|---|---|---|---|
| hydrogel conc. g/L | 1 | 1.5 | 1 | 1.5 |
| hydrogel conc., lb | 0.0022 | 0.0033 | 0.0022 | 0.0033 |
| recovered oil volume after waterflooding (recovered from residual oil), cc | 10 | 12 | 18 | 22 |
| recovered oil volume after waterflooding (recovered from residual oil), bbl | 6.29 × 10⁻⁵ | 7.55 × 10⁻⁵ | 1.13 × 10⁻⁴ | 1.38 × 10⁻⁴ |
| slug efficiencya | 35.0 | 43.7 | 19.4 | 23.8 |
| cost of chemical, $ | 3.81 × 10⁻⁴ | 5.72 × 10⁻⁴ | 5.08 × 10⁻⁴ | 7.62 × 10⁻⁴ |
| cost of consumed hydrogel/oil barrelb, $ | 6.06 | 7.58 | 4.49 | 5.51 |
Slug efficiency was calculated by dividing the mass of injected chemical (pounds, lb) by the volume of recovered oil (barrels, bbl).
Cost of hydrogel/oil barrel was calculated by dividing the cost of chemical, $/recovered oil volume after waterflooding (recovered from residual oil), bbl.
The results displayed that the cost of consumed hydrogel/oil barrel ranges from $5.51 to $7.58 for each recovered barrel. Comparing this cost with the cost of oil barrel gave $63.479 at the time of writing this manuscript. We can conclude that both PEG and PPG can be used industrially in the field of chemical enhanced oil recovery and for achieving high economic profit.
4. Conclusions
Poly(ethylene glycol) and poly(propylene glycol) surfmers were used as base moieties to synthesize hydrophilic water-based hydrogels. The rheological performance was assessed under harsh reservoir conditions. Both hydrogels follow the allometric power-law model and exhibit shear-thinning (pseudoplastic) behavior with reasonable yield stress. The shear stress–shear rate profile assessed at 80 °C follows the Herschel–Bulkley and Bingham plastic models. On the scale of computational chemistry, both MD and DPD simulations were implemented to investigate the oil/water/hydrogel system. Based on the experimental and simulation outputs, the following concluding remarks can be reported.
-
(1)
The rheological performance of PEG and PPG hydrogels confirms their prosperous implementation in underground reservoirs up to 80 °C, at a shearing rate of 64.68 S–1, and a salinity of 80 000 ppm.
-
(2)
The surface activity represented through the surface area (Am) and surface excess concentrations (Γm) confirms that both hydrogels can reduce the W/O interfacial tension, thus improving the displacement efficiency and improving the oil recovery.
-
(3)
The negative magnitude of the chi parameter (χij) for PEG and PPG hydrogel/water, PEG and PPG hydrogel/salt, confirms their high miscibility with formation water in underground reservoirs, thus increasing the aqueous solution viscosity, leading to improvement of the sweeping efficiency.
-
(4)
DPD simulation indicates that PEG and PPG hydrogels are oriented at the interface, where the beads (water molecules, salt, and PEG and PPG hydrogels) are tightly packed, leading to IFT reduction. Furthermore, increasing the radius of gyration (Rg) confirms the high spread of hydrogels at the water/oil boundaries.
-
(5)
PEG and PPG hydrogels are effective EOR agents with enhanced oil recovery factors of 72 and 88%, respectively, and higher water shutoff values for the highly permeable zones, so they can be used industrially during polymer flooding processes on the field scale.
Finally, the combination of classical MD and DPD strategies was used to investigate the complex behaviors of hydrogels in underground reservoirs, leading to the development of a new foundation in theoretical research activities of enhanced oil recovery (EOR) and oil production.
5. Experimental Section
5.1. Materials and Equipment
Poly(ethylene glycol) (CAS no. 25322-68-3, average Mn ∼ 1450), poly(propylene glycol) (CAS no. 25322-69-4, average Mn ∼ 400), methacrylic acid (CAS no. 79-41-4), p-toluenesulfonic acid, benzene (analytical standard, CAS no. 71-43-2), acrylamide (AM ≥97%), 1-vinyl-2-pyrrolidone (VP ≥99%), 2-acrylamido-2-methyl-1-propanesulfonic acid (AMPS ∼99%), potassium persulfate (KPS ≥99%), acetone ≥97%, and ultrapure ethanol were used. All chemicals were analytical pure supplied from Merck and used without further purification. Poly(ethylene glycol)dimethacrylate (PEG) and poly(propylene glycol)dimethacrylate (PPG) surfmers were synthesized according to the method reported by Shukla and Rai.55 Spectroscopic characterization was conducted according to the literature.28,29,56,57 Thermogravimetric analysis (TGA) was performed by SDT Q600 V20.5 Build 15 (TA Instruments). PEG and PPG hydrogels with weight 10 mg were treated thermally on a platinum pan from 25 to 623.15 °C under a nitrogen atmosphere and a heating rate of 10 °C/min. Infrared peaks were observed through the American FTS-3000 FT-IR spectrometer (400–4000 cm–1) using KBr pellets. 1H nuclear magnetic resonance (NMR) chemical shifts were detected with a Bruker-NMR 400 MHz spectrometer using the CHCl3 solvent. Viscosity and rheology tests were performed on the Brookfield-LV Rheoclac V3.3 Build 49-1 model furnished with a temperature controlling unit and an SC4-18 spindle. The viscosity of solutions is monitored relevant to the salinity, temperature, and applied shearing effect, according to ASTM D2196-18. Interfacial tension (IFT) was assessed by the Du Noüy ring procedure with an uncertainty degree of 0.5 mN/m at 25 °C.
5.2. Syntheses of PEG and PPG Hydrogels
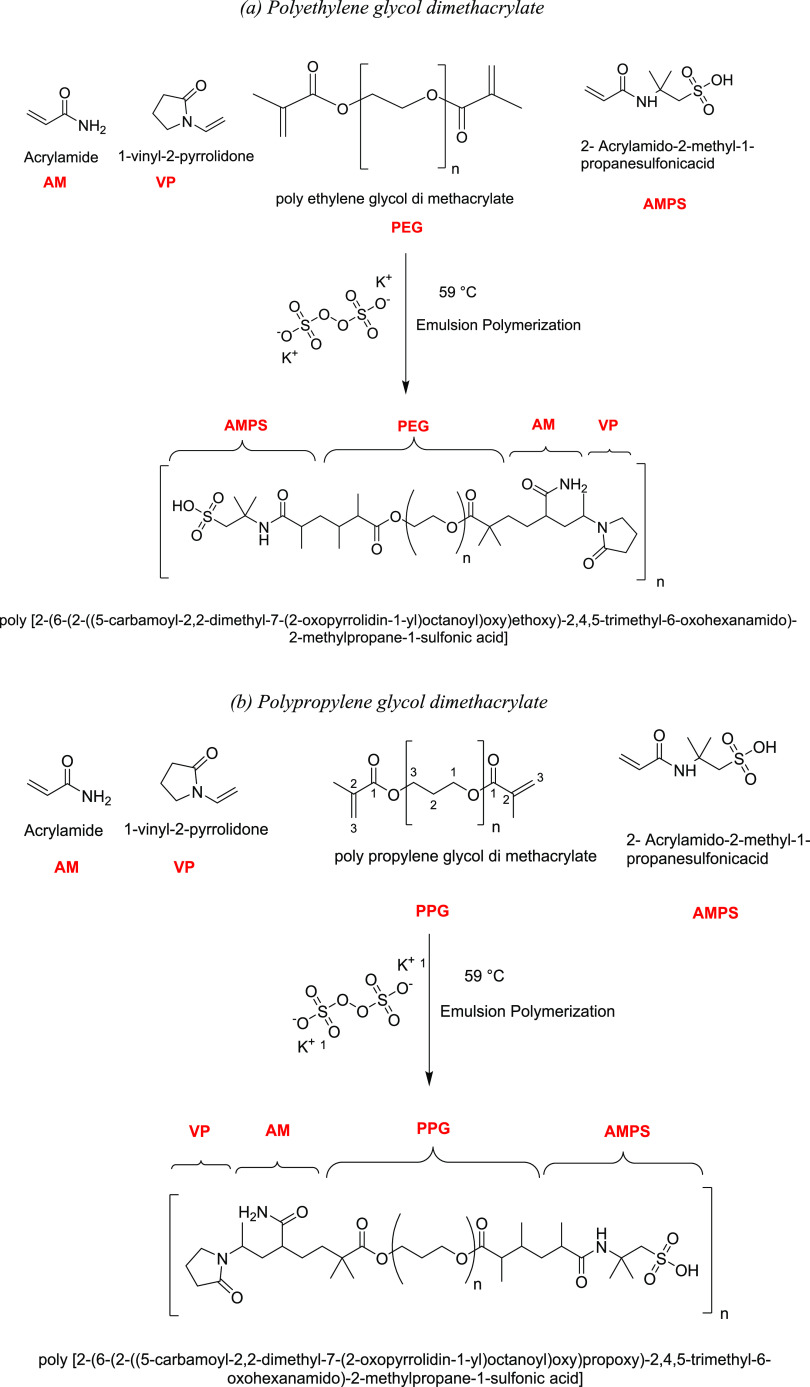
Under a nitrogen atmosphere, the process of hydrogel synthesis was conducted according to the literature.4 Typically, the assigned monomer amounts were polymerized through the emulsion polymerization technique at 59 °C for 11.0 h as indicated in Table 5. After reaction termination, the hydrogels were subjected to a series of solvent extractions by ethyl alcohol, followed by acetone. The final hydrogel was subjected to vacuum-drying using a rotary evaporator at 59 °C for 24 h to remove the unreacted monomers and extracting solvents. At the same time, the monomer conversion rate was assigned through the brominating method as stated elsewhere.26 The reaction steps are displayed in Scheme 1. The spectral analyses including Fourier transform infrared spectroscopy (FT-IR), 1H NMR spectra, and thermogravimetric analysis (TGA) are provided in Figures S3–S5.
Table 5. Assigned Weights of Monomers.
| monomer | PEG/PPG surfmer | AM | AMPS | VP | KPS | H2O |
|---|---|---|---|---|---|---|
| weight, g | 1.237 | 15.0 | 10.78 | 5.78 | 0.844 | 393.60 |
Scheme 1. Preparation of Hydrogel by Poly(ethylene glycol) Dimethacrylate and Poly(propylene glycol) Dimethacrylate Separately.
Acknowledgments
The author thanks the Egyptian Petroleum Research Institute for conducting the experimental flooding.
Glossary
Abbreviations
- μ
solution viscosity, cP
- τ
shear stress (Pa)
- γ
shear rate (s–1)
- τ0
yield stress (Pa)
- K
flow consistency coefficient (Pa·s–n)
- n
flow behavior index
- Γm
surface excess concentration, mol/cm2
- σ
equilibrium surface tension, mN/m
- C
hydrogel concentration, mol/L
- T
absolute temperature = 353 K
- R
general gas constant = 8.314 J mol–1 K–1
- Am
minimum surface area exerted by the molecule, nm2
- NA
Avogadro’s constant = 6.02214 × 10²³ mol–1
- fi
conservative force, expressed as the soft repulsive of FijC
- aij
maximum repulsion between particles i and j
- rij
distance between particles i and j

corresponding unit vector between particles i and j
- Rc
cutoff radius, which gives the extent of the interaction range
- νij
velocity difference between particles i and j
- θ
random number between 0 and 1
- W
weight function
- η
friction coefficient
- σ
noise amplitude
Supporting Information Available
The Supporting Information is available free of charge at https://pubs.acs.org/doi/10.1021/acsomega.1c01533.
Spectral analyses of the synthesized hydrogels including FT-IR spectra, 1H NMR shifts, and TGA analysis; and concentration profile, radial distribution function (RDF), scattering, and radius of gyration obtained from MD simulation as well as DPD simulation (PDF)
The author declares no competing financial interest.
Supplementary Material
References
- El-hoshoudy A. N.; Zaki E.; Elsaeed S. Experimental and Monte Carlo simulation of palmitate-guar gum derivative as a novel flooding agent in the underground reservoir. J. Mol. Liq. 2020, 302, 112502 10.1016/j.molliq.2020.112502. [DOI] [Google Scholar]
- Xu X.; Ouyang J.; Wang Y.; Wang C. Experimental investigation using an acrylamide-based polymer with emulsifying capability for enhanced oil recovery: A preliminary study. J. Ind. Eng. Chem. 2017, 55, 110–118. 10.1016/j.jiec.2017.06.034. [DOI] [Google Scholar]
- El-hoshoudy A. N.; Mohammedy M.; Ramzi M.; Desouky S.; Attia A. Experimental, modeling and simulation investigations of a novel surfmer-co-poly acrylates crosslinked hydrogels for water shut-off and improved oil recovery. J. Mol. Liq. 2019, 277, 142–156. 10.1016/j.molliq.2018.12.073. [DOI] [Google Scholar]
- El-hoshoudy A. N.; Hosny R.; Fathy M.; Abdelraheem O.; Gomaa S.; Desouky S. Enhanced oil recovery using polyacrylates/ACTF crosslinked composite: Preparation, characterization and coreflood investigation. J. Pet. Sci. Eng. 2019, 181, 106236 10.1016/j.petrol.2019.106236. [DOI] [Google Scholar]
- Zhou M.; Yi R.; Gu Y.; Tu H. Synthesis and evaluation of a Tetra-copolymer for oil displacement. J. Pet. Sci. Eng. 2019, 179, 669–674. 10.1016/j.petrol.2019.03.053. [DOI] [Google Scholar]
- Aktar S.; Saha M.; Mahbub S.; Halim M. A.; Rub M. A.; Hoque M. A.; Islam D. S.; Kumar D.; Alghamdi Y. G.; Asiri A. M. Influence of polyethylene glycol on the aggregation/clouding phenomena of cationic and non-ionic surfactants in attendance of electrolytes (NaCl & Na2SO4): An experimental and theoretical analysis. J. Mol. Liq. 2020, 306, 112880 10.1016/j.molliq.2020.112880. [DOI] [Google Scholar]
- Zhang P.; Bai S.; Chen S.; Li D.; Jia Z.; Zhou C. Preparation, solution characteristics and displacement performances of a novel acrylamide copolymer for enhanced oil recovery (EOR). Polym. Bull. 2018, 75, 1001–1011. 10.1007/s00289-017-2080-5. [DOI] [Google Scholar]
- Alvarado A.; Arellano M.; Rabelero M.; Puig J.; Sánchez-Díaz J. Effect of Particle Size on the Swelling and Compression Modulus of Nanostructured Polyacrylamide Hydrogels. J. Macromol. Sci., Part A 2015, 52, 381–386. 10.1080/10601325.2015.1018809. [DOI] [Google Scholar]
- Sabhapondit A.; Borthakur A.; Haque I. Water soluble acrylamidomethyl propane sulfonate (AMPS) copolymer as an enhanced oil recovery chemical. Energy Fuels 2003, 17, 683–688. 10.1021/ef010253t. [DOI] [Google Scholar]
- Malik I. A.; Al-Mubaiyedh U. A.; Sultan A. S.; Kamal M. S.; Hussein I. A. Rheological and thermal properties of novel surfactant-polymer systems for EOR applications. Can. J. Chem. Eng. 2016, 94, 1693–1699. 10.1002/cjce.22541. [DOI] [Google Scholar]
- Sampora Y.; Juwono A. L.; Haryono A.; Irawan Y. Study of Synthesis Polyethylene glycol oleate Sulfonated as an Anionic Surfactant for Enhanced Oil Recovery (EOR). J. Phys.: Conf. Ser. 2017, 909, 012078 10.1088/1742-6596/909/1/012078. [DOI] [Google Scholar]
- Jalil R. R.; Hussein H. Q. The Influence of Nano Fluid Compared With Polyethylene Glycol and Surfactant on Wettability Alteration of Carbonate Rock. IOP Conf. Ser.: Mater. Sci. Eng. 2018, 454, 012046 10.1088/1757-899X/454/1/012046. [DOI] [Google Scholar]
- Iborra A.; Salvatierra L.; Giussi J. M.; Azzaroni O. Synthesis of lauryl methacrylate and poly (ethylene glycol) methyl ether methacrylate copolymers with tunable microstructure and emulsifying properties. Eur. Polym. J. 2019, 116, 117–125. 10.1016/j.eurpolymj.2019.04.010. [DOI] [Google Scholar]
- Wu Q.; Gou S.; Huang J.; Fan G.; Li S.; Liu M. Hyper-branched structure—an active carrier for copolymer with surface activity, anti-polyelectrolyte effect and hydrophobic association in enhanced oil recovery. RSC Adv. 2019, 9, 16406–16417. 10.1039/C9RA01554J. [DOI] [PMC free article] [PubMed] [Google Scholar]
- Jamil F.; Ali H. M. Sustainable desalination using portable devices: a concise review. Sol. Energy 2019, 194, 815–839. 10.1016/j.solener.2019.10.085. [DOI] [Google Scholar]
- Ali H. M. Recent advancements in PV cooling and efficiency enhancement integrating phase change materials based systems–A comprehensive review. Sol. Energy 2020, 197, 163–198. 10.1016/j.solener.2019.11.075. [DOI] [Google Scholar]
- El-hoshoudy A. N.; Soliman F.; Mansour E.; Zaki T.; Desouky S. Experimental and theoretical investigation of quaternary ammonium-based deep eutectic solvent for secondary water flooding. J. Mol. Liq. 2019, 294, 111621 10.1016/j.molliq.2019.111621. [DOI] [Google Scholar]
- Remesal E. R.; Suárez J. A.; Márquez A. M.; Sanz J. F.; Rincón C.; Guitián J. Molecular dynamics simulations of the role of salinity and temperature on the hydrocarbon/water interfacial tension. Theor. Chem. Acc. 2017, 136, 66 10.1007/s00214-017-2096-9. [DOI] [Google Scholar]
- Goodarzi F.; Zendehboudi S. Effects of salt and surfactant on interfacial characteristics of water/oil systems: molecular dynamic simulations and dissipative particle dynamics. Ind. Eng. Chem. Res. 2019, 58, 8817–8834. 10.1021/acs.iecr.9b00504. [DOI] [Google Scholar]
- Rekvig L.; Kranenburg M.; Vreede J.; Hafskjold B.; Smit B. Investigation of surfactant efficiency using dissipative particle dynamics. Langmuir 2003, 19, 8195–8205. 10.1021/la0346346. [DOI] [Google Scholar]
- Ginzburg V. V.; Chang K.; Jog P. K.; Argenton A. B.; Rakesh L. Modeling the interfacial tension in oil–water–nonionic surfactant mixtures using dissipative particle dynamics and self-consistent field theory. J. Phys. Chem. B 2011, 115, 4654–4661. 10.1021/jp109234u. [DOI] [PubMed] [Google Scholar]
- Li Y.; Guo Y.; Xu G.; Wang Z.; Bao M.; Sun N. Dissipative particle dynamics simulation on the properties of the oil/water/surfactant system in the absence and presence of polymer. Mol. Simul. 2013, 39, 299–308. 10.1080/08927022.2012.724173. [DOI] [Google Scholar]
- Wang S.; Yang S.; Wang R.; Tian R.; Zhang X.; Sun Q.; Liu L. Dissipative particle dynamics study on the temperature dependent interfacial tension in surfactant-oil-water mixtures. J. Pet. Sci. Eng. 2018, 169, 81–95. 10.1016/j.petrol.2018.05.036. [DOI] [Google Scholar]
- Rezaei H.; Modarress H. Dissipative particle dynamics (DPD) study of hydrocarbon–water interfacial tension (IFT). Chem. Phys. Lett. 2015, 620, 114–122. 10.1016/j.cplett.2014.12.033. [DOI] [Google Scholar]
- Wang J.; Cao C.; Chen X.; Ren S.; Yu D.; Chen X. Extensional-shear coupled flow-induced morphology and phase evolution of polypropylene/ultrahigh molecular weight polyethylene blends: Dissipative particle dynamics simulations and experimental studies. Polymer 2019, 169, 36–45. 10.1016/j.polymer.2019.02.031. [DOI] [Google Scholar]
- El-hoshoudy A. N.; Desouky S.; Betiha M.; Alsabagh A. Use of 1-vinyl imidazole based surfmers for preparation of polyacrylamide–SiO2 nanocomposite through aza-Michael addition copolymerization reaction for rock wettability alteration. Fuel 2016, 170, 161–175. 10.1016/j.fuel.2015.12.036. [DOI] [Google Scholar]
- El-hoshoudy A. N.; Desouky S.; Al-Sabagh A.; Betiha M.; MY E.-k.; Mahmoud S. Evaluation of solution and rheological properties for hydrophobically associated polyacrylamide copolymer as a promised enhanced oil recovery candidate. Egypt. J. Pet. 2017, 26, 779–785. 10.1016/j.ejpe.2016.10.012. [DOI] [Google Scholar]
- El-hoshoudy A. N. Quaternary ammonium based surfmer-co-acrylamide polymers for altering carbonate rock wettability during water flooding. J. Mol. Liq. 2018, 250, 35–43. 10.1016/j.molliq.2017.11.119. [DOI] [Google Scholar]
- El-hoshoudy A. N.; Desouky S. Synthesis and evaluation of acryloylated starch-g-poly (Acrylamide/Vinylmethacrylate/1-Vinyl-2-pyrrolidone) crosslinked terpolymer functionalized by dimethylphenylvinylsilane derivative as a novel polymer-flooding agent. Int. J. Biol. Macromol. 2018, 116, 434–442. 10.1016/j.ijbiomac.2018.05.056. [DOI] [PubMed] [Google Scholar]
- El-hoshoudy A. N. Synthesis of acryloylated starch-g-poly acrylates crosslinked polymer functionalized by emulsified vinyltrimethylsilane derivative as a novel EOR agent for severe polymer flooding strategy. Int. J. Biol. Macromol. 2019, 123, 124–132. 10.1016/j.ijbiomac.2018.11.056. [DOI] [PubMed] [Google Scholar]
- El-hoshoudy A. N.; Desouky S.; Attia A. Synthesis of starch functionalized sulfonic acid co-imidazolium/silica composite for improving oil recovery through chemical flooding technologies. Int. J. Biol. Macromol. 2018, 118, 1614–1626. 10.1016/j.ijbiomac.2018.07.009. [DOI] [PubMed] [Google Scholar]
- Aalaie J.; Alvand E.; Hemmati M.; Sajjadian V. Preparation and probing of the steady shear flow and viscoelastic properties of weakly crosslinked hydrogels based on sulfonated polyacrylamide for oil recovery applications. Polym. Sci., Ser. A 2015, 57, 680–687. 10.1134/S0965545X15050016. [DOI] [Google Scholar]
- Kumar S.; Mandal A. Rheological properties and performance evaluation of synthesized anionic polymeric surfactant for its application in enhanced oil recovery. Polymer 2017, 120, 30–42. 10.1016/j.polymer.2017.05.051. [DOI] [Google Scholar]
- Brandvik P. J.; Daling P. S.; Leirvik F.; Krause D. F. Interfacial tension between oil and seawater as a function of dispersant dosage. Mar. Pollut. Bull. 2019, 143, 109–114. 10.1016/j.marpolbul.2019.04.019. [DOI] [PubMed] [Google Scholar]
- Yu L.; Dong M.; Ding B.; Yuan Y. Experimental study on the effect of interfacial tension on the conformance control of oil-in-water emulsions in heterogeneous oil sands reservoirs. Chem. Eng. Sci. 2018, 189, 165–178. 10.1016/j.ces.2018.05.033. [DOI] [Google Scholar]
- Paria S.; Khilar K. C. A review on experimental studies of surfactant adsorption at the hydrophilic solid–water interface. Adv. Colloid Interface Sci. 2004, 110, 75–95. 10.1016/j.cis.2004.03.001. [DOI] [PubMed] [Google Scholar]
- Atta A. M.; Ismail H.; Elsaaed A.; Fouad R.; Fada A.; Abdel-Rahman A.-H. Micellization and Adsorption Parameters of Poly (Propylene Oxide)/Poly (Ethylene Glycol) Block and Graft Copolymers in Aqueous Medium. J. Dispersion Sci. Technol. 2012, 33, 1525–1538. 10.1080/01932691.2011.623546. [DOI] [Google Scholar]
- El-hoshoudy A. N.; Ghanem A.; Desouky S. Imidazolium-based ionic liquids for asphaltene dispersion; experimental and computational studies. J. Mol. Liq. 2021, 324, 114698 10.1016/j.molliq.2020.114698. [DOI] [Google Scholar]
- El-hoshoudy A. N.; Mansour E. M.; Desouky S. M. Experimental, computational and simulation oversight of silica-co-poly acrylates composite prepared by surfactant-stabilized emulsion for polymer flooding in unconsolidated sandstone reservoirs. J. Mol. Liq. 2020, 308, 113082 10.1016/j.molliq.2020.113082. [DOI] [Google Scholar]
- Sinzato Y. Z.; Dias N. J. S.; Cunha F. R. An experimental investigation of the interfacial tension between liquid-liquid mixtures in the presence of surfactants. Exp. Therm. Fluid Sci. 2017, 85, 370–378. 10.1016/j.expthermflusci.2017.03.011. [DOI] [Google Scholar]
- Guo H.; Ali H. M.; Hassanzadeh A. Simulation study of flat-sheet air gap membrane distillation modules coupled with an evaporative crystallizer for zero liquid discharge water desalination. Appl. Therm. Eng. 2016, 108, 486–501. 10.1016/j.applthermaleng.2016.07.131. [DOI] [Google Scholar]
- Ryjkina E.; Kuhn H.; Rehage H.; Müller F.; Peggau J. Molecular Dynamic Computer Simulations of Phase Behavior of Non-Ionic Surfactants. Angew. Chem., Int. Ed. 2002, 41, 983–986. . [DOI] [PubMed] [Google Scholar]
- Materials Studio R2; Dassault Systèmes BIOVIA: San Diego, 2017.
- Olabis O.Polymer–Polymer Miscibility; Elsevier, 2012. [Google Scholar]
- Mohan M.; Naik P. K.; Banerjee T.; Goud V. V.; Paul S. Solubility of glucose in tetrabutylammonium bromide based deep eutectic solvents: Experimental and molecular dynamic simulations. Fluid Phase Equilib. 2017, 448, 168–177. 10.1016/j.fluid.2017.05.024. [DOI] [Google Scholar]
- Yeh P. D.; Alexeev A. Mesoscale modelling of environmentally responsive hydrogels: emerging applications. Chem. Commun. 2015, 51, 10083–10095. 10.1039/C5CC01027F. [DOI] [PubMed] [Google Scholar]
- Español P.; Warren P. Statistical mechanics of dissipative particle dynamics. Europhys. Lett. 1995, 30, 191 10.1209/0295-5075/30/4/001. [DOI] [Google Scholar]
- Goicochea A. G. Adsorption and disjoining pressure isotherms of confined polymers using dissipative particle dynamics. Langmuir 2007, 23, 11656–11663. 10.1021/la701791h. [DOI] [PubMed] [Google Scholar]
- Liang X.; Wu J.; Yang X.; Tu Z.; Wang Y. Investigation of oil-in-water emulsion stability with relevant interfacial characteristics simulated by dissipative particle dynamics. Colloids Surf., A 2018, 546, 107–114. 10.1016/j.colsurfa.2018.02.063. [DOI] [Google Scholar]
- Mai-Duy N.; Phan-Thien N.; Tran-Cong T. An improved dissipative particle dynamics scheme. Appl. Math. Model. 2017, 46, 602–617. 10.1016/j.apm.2017.01.086. [DOI] [Google Scholar]
- Sharipova A.; Aidarova S.; Fainerman V.; Stocco A.; Cernoch P.; Miller R. Dynamics of adsorption of polyallylamine hydrochloride/sodium dodecyl sulphate at water/air and water/hexane interfaces. Colloids Surf., A 2011, 391, 112–118. 10.1016/j.colsurfa.2011.02.052. [DOI] [Google Scholar]
- Soliman A. A.; El-hoshoudy A. N.; Attia A. M. Assessment of xanthan gum and xanthan-g-silica derivatives as chemical flooding agents and rock wettability modifiers. Oil Gas Sci. Technol. – Rev. d’IFP Energies Nouvelles 2020, 75, 12 10.2516/ogst/2020004. [DOI] [Google Scholar]
- Pu J.; Zhou J.; Chen Y.; Bai B. Development of Thermotransformable Controlled Hydrogel for Enhancing Oil Recovery. Energy Fuels 2017, 31, 13600–13609. 10.1021/acs.energyfuels.7b03202. [DOI] [Google Scholar]
- El-hoshoudy A. N.; Desouky S.. Hydrophobic Polymers for Enhanced Oil Recovery: Preparation, Characterization, Rheological Properties; LAP LAMBERT Academic Publishing, 2016. [Google Scholar]
- Shukla S.; Rai J. Synthesis and kinetic study of diacrylate and dimethacrylate. Int. J. Plast. Technol. 2013, 17, 182–193. 10.1007/s12588-013-9058-4. [DOI] [Google Scholar]
- El-hoshoudy A. N.; Desouky S.; Elkady M.; Alsabagh A.; Betiha M.; Mahmoud S. Investigation of optimum polymerization conditions for synthesis of cross-linked polyacrylamide-amphoteric surfmer nanocomposites for polymer flooding in sandstone reservoirs. Int. J. Polym. Sci. 2015, 2015, 318708 10.1155/2015/318708. [DOI] [Google Scholar]
- El-hoshoudy A. N. Synthesis of acryloylated starch-g-poly acrylates crosslinked polymer functionalized by emulsified vinyltrimethylsilane derivative as a novel EOR agent for severe polymer flooding strategy. Int. J. Biol. Macromol. 2019, 123, 124–132. 10.1016/j.ijbiomac.2018.11.056. [DOI] [PubMed] [Google Scholar]
Associated Data
This section collects any data citations, data availability statements, or supplementary materials included in this article.


