

Summary
Background
Determining the status of molecular pathways and key mutations in colorectal cancer is crucial for optimal therapeutic decision making. We therefore aimed to develop a novel deep learning pipeline to predict the status of key molecular pathways and mutations from whole-slide images of haematoxylin and eosin-stained colorectal cancer slides as an alternative to current tests.
Methods
In this retrospective study, we used 502 diagnostic slides of primary colorectal tumours from 499 patients in The Cancer Genome Atlas colon and rectal cancer (TCGA-CRC-DX) cohort and developed a weakly supervised deep learning framework involving three separate convolutional neural network models. Whole-slide images were divided into equally sized tiles and model 1 (ResNet18) extracted tumour tiles from non-tumour tiles. These tumour tiles were inputted into model 2 (adapted ResNet34), trained by iterative draw and rank sampling to calculate a prediction score for each tile that represented the likelihood of a tile belonging to the molecular labels of high mutation density (vs low mutation density), microsatellite instability (vs microsatellite stability), chromosomal instability (vs genomic stability), CpG island methylator phenotype (CIMP)-high (vs CIMP-low), BRAFmut (vs BRAFWT), TP53mut (vs TP53WT), and KRASWT (vs KRASmut). These scores were used to identify the top-ranked titles from each slide, and model 3 (HoVer-Net) segmented and classified the different types of cell nuclei in these tiles. We calculated the area under the convex hull of the receiver operating characteristic curve (AUROC) as a model performance measure and compared our results with those of previously published methods.
Findings
Our iterative draw and rank sampling method yielded mean AUROCs for the prediction of hypermutation (0·81 [SD 0·03] vs 0·71), microsatellite instability (0·86 [0·04] vs 0·74), chromosomal instability (0·83 [0·02] vs 0·73), BRAFmut (0·79 [0·01] vs 0·66), and TP53mut (0·73 [0·02] vs 0·64) in the TCGA-CRC-DX cohort that were higher than those from previously published methods, and an AUROC for KRASmut that was similar to previously reported methods (0·60 [SD 0·04] vs 0·60). Mean AUROC for predicting CIMP-high status was 0·79 (SD 0·05). We found high proportions of tumour-infiltrating lymphocytes and necrotic tumour cells to be associated with microsatellite instability, and high proportions of tumour-infiltrating lymphocytes and a low proportion of necrotic tumour cells to be associated with hypermutation.
Interpretation
After large-scale validation, our proposed algorithm for predicting clinically important mutations and molecular pathways, such as microsatellite instability, in colorectal cancer could be used to stratify patients for targeted therapies with potentially lower costs and quicker turnaround times than sequencing-based or immunohistochemistry-based approaches.
Funding
The UK Medical Research Council.
Introduction
Differing molecular pathways of colorectal cancer carcinogenesis can help to explain diversity in disease progression and tumour growth among patients.1 Chromosomal instability is associated with lower rates of overall and progression-free survival in colorectal cancer,2 whereas tumours with microsatellite instability or hypermutation are more likely to respond to immunotherapy.3, 4, 5, 6 Further classifications consider different subgroups of CpG island methylator phenotypes (CIMPs) and microsatellite instability1, 6, 7 based on responses to adjuvant therapy and survival. Increasing numbers of studies have subtyped colorectal cancer on the basis of shared and distinct molecular characteristics and pathways1, 8 and determined the association of these pathways with patient prognosis, overall survival, and response to specific treatments—particularly targeted therapy and immunotherapy.3, 9, 10
Research in context.
Evidence before this study
We queried Google Scholar without language restrictions and with the search terms “(Predicting OR assessing) and (((msi OR dMMR) status) OR (tumor mutation burden OR TMB)) in (colorectal cancer) AND (Machine OR Deep) Learning OR (Artificial Intelligence OR AI)”, and analysed the top 50 scientific articles published between Jan 1, 2018, and Dec 20, 2020, to examine evidence before undertaking this study. Studies have shown that deep learning can predict the presence of microsatellite instability and genetic driver mutations directly from whole-slide images of haematoxylin and eosin-stained slides of colorectal cancer and other cancer types. However, previous methods using a standard deep learning model and equal weighting of all tiles for these predictions performed only modestly, especially in The Cancer Genome Atlas colon and rectal cancer (TCGA-CRC-DX) multicentre cohort. In addition, existing models have not assessed the cellular composition of histological regions that contribute to the final prediction.
Added value of this study
Considering tissue heterogeneity, we hypothesised that all image tiles containing tissue contents in a whole-slide image are not equally predictive of the status of molecular pathways and key mutations. Therefore, in this retrospective study, we proposed a new, weakly supervised deep learning algorithm for whole-slide image classification based on non-annotated images and using only slide-level labels to predict the status of colorectal cancer pathways and mutations. We also cross-validated the microsatellite instability prediction in a completely unseen cohort. The histological contents of strongly predictive tiles were systematically analysed in a data-driven manner. Our iterative draw and rank sampling method outperformed previously published methods in the prediction of hypermutation, microsatellite instability, chromosomal instability, and BRAF and TP53 mutation status in the TCGA-CRC-DX cohort.
Implications of all the available evidence
After large-scale validation in multicentre cohorts, our prediction algorithm could be used to stratify patients for targeted therapies, with potentially lower costs and quicker turnaround times than with current approaches. Indeed, the prediction of slide labels and their spatial mapping to the tissue microenvironment has the potential to improve diagnostic practice and personalised treatment for several different types of cancer. Automated analysis of the cellular composition of predictive histological features could improve our understanding of the downstream impact of these features and lead to new insights into representative and discriminative morphological features corresponding to molecular pathways and mutations for cancer.
However, standard genetic (eg, PCR) and immunohistochemistry testing might incur time delays and additional costs,3, 4 and molecular testing assays (eg, diagnostic biopsies) often require tissue, the availability of which can be limited.11 As such, visual examination of haematoxylin and eosin-stained tissue slides remains the gold standard for diagnosis of colorectal cancer. With the uptake and validation of digital pathology for routine diagnosis,12 multi-gigapixel whole-slide images can be generated and interrogated to yield information beyond a simple diagnosis.
In histopathology, deep learning-based algorithms have been shown to predict clinically relevant molecular phenotypes,13 microsatellite instability,4, 14, 15 consensus molecular subtypes,4, 16 and outcomes17 in colorectal cancer. Indeed, Kather and colleagues4 developed a standard deep learning model using equal weighting of all tiles to stratify microsatellite instable and microsatellite stable colorectal cancer and achieved an area under the convex hull of the receiver operating characteristic curve (AUROC) of 0·77 (95% CI 0·62–0·87) on a test split of The Cancer Genome Atlas colon and rectal cancer (TCGA-CRC-DX) cohort. Kather and colleagues18 then extended this previously proposed computational pipeline4 to detect clinically actionable genetic alterations from haematoxylin and eosin-stained slides of multiple solid tumours. Echle and colleagues11 evaluated the use of deep learning models for the detection of microsatellite instability and mismatch repair deficiency on haematoxylin and eosin-stained slides from colorectal tumours, which showed a strong performance in intra-cohort validation in three large international training sets and the TCGA-CRC-DX cohort (n=426). The performance of these models in intra-cohort and inter-cohort validation11 in the TCGA-CRC-DX cohort matched, but did not improve upon, the state-of-the-art performance of the previous microsatellite instability prediction method developed by Kather and colleagues.4
The labelling of a digitised whole-slide image as positive or negative for a specific genetic mutation or molecular pathway without detailed annotations at the cellular and regional levels would be considered weakly supervised learning in the language of machine learning. Weakly supervised learning of slide-level labels for whole-slide images and the detection of clinically actionable genetic alterations from the analysis of haematoxylin and eosin-stained whole-slide images have been shown to be possible with deep learning.4, 11, 18 However, two fundamental questions remain unanswered. First, can deep learning be used to predict the status of molecular pathways and relevant genetic mutations from images of haematoxylin and eosin-stained sections of colorectal cancer tumours with a high degree of accuracy? And, second, can these predictions be mapped onto known or novel histological features?
Several weakly supervised learning methods for computational pathology have been proposed to maximise the use of available slide-level labels.19, 20, 21 For instance, Campanella and colleagues22 proposed a deep learning system based on multiple instance learning to discriminate between tumour and non-tumour whole-slide images using high-level image labels only. However, the multiple instance learning method22 required tens of thousands of whole-slide images to effectively train the model. Although the authors chose only a few representative top-ranked tiles from each slide, their method compared all tiles in the slide in each training epoch, which might be computationally expensive and requires a large amount of training data. Another weakly supervised method to classify whole-slide images proposed by Wang and colleagues23 requires pixel-level coarse annotations, which are labour-intensive and often unavailable, in addition to high-level image labels. Both these methods used an additional machine learning model to aggregate tile scores into a slide score.
We aimed to develop a novel, weakly supervised, deep learning pipeline that could effectively predict the status of slide labels, and, in particular, key molecular pathways and specific mutations, from haematoxylin and eosin-stained images of colorectal tumours, using only slide-level labels (and not cell-level or regional-level annotations) for algorithm training.
Methods
Study design
In this retrospective study, we developed a novel, weakly supervised, deep learning framework involving three separate convolutional neural network models (figure 1). Because tumour tissue blocks taken during tumour sampling are large and almost always contain non-tumour tissue, it is necessary to first identify the tumour areas. A fine-tuned convolutional neural network (ResNet18; model 1)24 was used as the tumour detection model (figure 1A) to identify tumour tiles in a given slide. These tumour tiles served as input to iterative draw and rank sampling (an adaptation of ResNet34; model 2), which learned the discriminative features of slide labels, molecular pathways, and mutations (ie, hypermutation, microsatellite instability, chromosomal instability, CIMP, BRAF, TP53, and KRAS status) to calculate a digital score of the corresponding molecular status for each tile of the whole-slide image and the whole-slide image's most predictive visual fields (figure 1B, C). The final convolutional neural network (HoVer-Net;25 model 3; figure 1D) used the top-ranked tiles (as predicted by iterative draw and rank sampling) to segment and classify different types of cell nuclei in each tile to analyse cellular composition. Then, the predicted digital scores of each pathway were investigated for their association with the status of colorectal cancer molecular pathways and key mutations. Both training and inference were used for the first two networks, whereas, for the third, only inferences were made by use of HoVer-Net, a state-of-the-art nuclear segmentation and classification model pre-trained on the publicly available PanNuke dataset.26
Figure 1.

IDaRS prediction pipeline and histopathological feature discovery of colorectal cancer pathways
(A) Tissue segmentation and tile extraction were performed to obtain informative tiles. Model 1 (ResNet18) was trained to separate tumour from non-tumour tiles. These tiles served as input to iterative draw and rank sampling (an adaptation of ResNet34; model 2), which was trained on tumour tiles for label prediction. (B) A concept diagram of iterative draw and rank sampling illustrating the training strategy for the fast labelling of whole-slide images. The deep learning model was trained iteratively for classification with a random draw (di) of the same number of tiles from each whole-slide image and the k top-ranked tiles of the same slide drawn in the previous iteration. (C) The trained iterative draw and rank sampling model gave a prediction score to each tile in the whole-slide image, which were used to obtain a slide score and identify the top-ranked tiles from each slide. (D) Model 3 (HoVer-Net) inference was used to segment and classify different types of nuclei in top-ranked representative tiles in a cellular composition analysis of colorectal cancer pathways. Histological patterns of the molecular characteristics of colorectal cancers are shown as a spider plot based on the feature importance of different cellular composition profiles modelled via a support vector machine. H&E=haematoxylin and eosin. IDaRS=iterative draw and rank sampling. NEP1=neoplastic epithelial type 1. NEP2=neoplastic epithelial type 2.
Data collection and preparation
We used 502 diagnostic slides of primary colorectal tumours (contributed by 36 different centres in the USA) from 499 patients in the TCGA-CRC-DX cohort, which has been used in previous studies (appendix 1 pp 2–3).4, 11, 18 For external validation of the microsatellite status results, our iterative draw and rank sampling model was trained on the TCGA-CRC-DX cohort and tested on the Pathology Artificial Intelligence Platform (PAIP) challenge cohort, which contains 47 slides (12 microsatellite instable and 35 microsatellite stable) from three different centres in South Korea. The microsatellite status of each tumour was determined by PCR assays. The TCGA-CRC-DX dataset was deidentified and publicly available, and participant consent had previously been obtained by The Cancer Genome Atlas consortium. For the PAIP cohort, all necessary participant consent had been obtained and all study patients had been previously deidentified by Seoul National University Hospital (Seoul National University Hospital IRB number H-1808-035-964). Institutional permissions were received to use the PAIP dataset and no further ethics approval was required.
The iterative draw and rank sampling deep neural network model was trained for binary classification. The ground truth labels of the TCGA-CRC-DX cohort for hypermutation (high mutation density vs low mutation density), microsatellite instability (highly microsatellite instable vs microsatellite stable), chromosomal instability (chromosomal instability vs genomic stability), and CIMP (high [CIMP-high] vs low [CIMP-low] frequencies of DNA hypermethylation) were obtained from, and defined by, Liu and colleagues.1 For prediction of BRAF, TP53, and KRAS mutation, the binary classifications were either mutant or wild-type and were obtained from Kather and colleagues.18 All slides were pre-processed for tissue segmentation by use of Otsu thresholding.27 Then, the segmented tissue region in each whole-slide image was divided into equally sized tiles (256 μm by 256 μm). Further details about ground truth labels and data pre-processing are provided in appendix 1 (pp 2–3).
Deep learning framework
A deep neural network (ResNet18; model 1) was trained on a balanced dataset of tumour and non-tumour tiles, comprising 35 436 tiles from seven arbitrarily selected slides from the TCGA-CRC-DX cohort combined with two publicly available datasets (from Kather and colleagues4 and Shaban and colleagues28), to extract tumour tiles from the TCGA-CRC-DX cohort slides (appendix 1 p 3). 24 843 (70·1%) of the tiles were used for training, 5380 (15·2%) were used for validation, and the remaining 5213 (14·7%) comprised an unseen test set, which contained 2493 (47·8%) non-tumour tiles and 2720 (52·2%) tumour tiles and was used to test model performance. We calculated accuracy and an F1 score to report the performance of the tumour segmentation model on the unseen test set.
The second neural network model was a fine-tuned version of ResNet34,24 pre-trained on ImageNet for the prediction of slide labels (ie, the status of molecular pathways and genetic mutations). Training was by Monte Carlo iterative draw and rank sampling and was done for 30 iterations, with a batch size of 256. Trained model 2 then calculated a prediction score for each tile in the whole-slide image, which can be considered the likelihood of a tile belonging to the positive class in our binary classification setting. These scores were used to identify the ten top-ranked tiles from each slide and to obtain a slide score by aggregating the scores of all tiles in a whole-slide image and reporting the average probability-based aggregation. Further details about training and aggregation are provided in appendix 1 (pp 3–4).
We used a final convolutional neural network (HoVer-Net;25 model 3) to segment and classify the different types of cell nuclei in the ten top-ranked tiles (as predicted by iterative draw and rank sampling) into five categories: neoplastic epithelial cells, non-neoplastic epithelial cells, inflammatory cells, mesenchymal cells, and necrotic cells. This step mimics the visual analysis of an expert pathologist who analyses nuclear composition in the tissue microenvironment subjectively under a microscope in a high-power field. The cell segmentation and classification results of HoVer-Net were visually examined by expert pathologists (AA and DS) for all cell types. We used the counts of individual cell types in each tile in a feature importance analysis to investigate potential associations between the cellular composition profile of top-ranked tiles for a given whole-slide image and molecular slide labels for hypermutation (high mutation density vs low mutation density), microsatellite instability (highly microsatellite instable vs microsatellite stable), chromosomal instability (chromosomal instability vs genomic stability), and CIMP (CIMP-high vs CIMP-low; appendix 1 pp 7–10). We calculated a tumour-infiltrating lymphocyte abundance score: the abundance of tumour-infiltrating lymphocytes in the vicinity of the tumour regions.
Statistical analysis
We used four-fold cross-validation in our prediction experiments to measure the mean iterative draw and rank sampling performance of the entire cohort. We used two folds for training, one fold as a validation set for keeping the best performing model, and one fold was kept aside as an unseen test set to measure model performance in a blinded way (appendix 1 p 5). We used the AUROC as a performance measure of the model predictions, and report the means and SDs of the AUROC values.
We compared our results with those of a state-of-the-art, automated microsatellite instability prediction model from a previous publication4 that used the same training-to-test dataset split in the TCGA-CRC-DX cohort. We also compared our algorithm's performance in a multi-fold cross-validation setting for microsatellite instability11 and other pathways and mutations (BRAF, TP53, and KRAS).18 Considering varying ratios of class imbalance (unequal samples in positive and negative classes) in the data, we also used average precision to calculate the area under the precision-recall curve (AUPRC). Both the AUROC and AUPRC were averaged for multiple runs and multiple folds of the experiments.
For internal validation of our microsatellite instability prediction results, we matched the split of the TCGA-CRC-DX cohort to that used by Kather and colleagues.4 For external validation, our iterative draw and rank sampling model was trained on the TCGA-CRC-DX cohort and tested on the PAIP challenge cohort, which contained 47 slides from three different centres. Tumour tiles (n=58 097) were obtained from the PAIP cohort by use of the expert pathologist annotations of the tumour region provided in the PAIP challenge dataset.
Because of the importance of clinical stage in routine histopathology and colorectal cancer pathways and mutations, we also divided the entire TCGA-CRC-DX cohort by TNM stage (stage I, stage II, stage III, and stage IV) and computed the AUROC for each group separately.
We overlaid local prediction heatmaps on top of whole-slide images to further analyse the relationship of our molecular labels (hypermutation, microsatellite instability, chromosomal instability, and CIMP) with the spatial features of the tumour microenvironment. In our correlation analysis, we analysed the correlation between the iterative draw and rank sampling-based digital scores for hypermutation, microsatellite instability, chromosomal instability, CIMP, BRAF, and TP53 status for each slide of the TCGA-CRC-DX test set used previously by Kather and colleagues,4 obtained by applying separately trained models on the same training set. Feature importance in the cellular composition analysis is shown as the mean value for each pathway, and presented as box and whisker plots. Statistical significance (p values) for the difference between tumour-infiltrating lymphocyte abundance scores was assessed via paired t tests. Correlation coefficients (r) and p values for the correlation analysis were obtained by use of Pearson correlation. More details about our visualisation and correlation analyses can be found in appendix 1 (pp 10–11). We used scipy.stats library (version 1.5.2) in Python to calculate statistics. The p value cutoff of less than 0·05 was used for defining statistical significance and an r value cutoff of 0·7 or –0·7 defined a strong correlation.
Role of the funding source
The funder of the study had no role in study design, data collection, data analysis, data interpretation, or writing of the report.
Results
Model 1 achieved an accuracy and F1 score of 99% for the test tiles. This model was then used to identify tumour tiles (a total of 448 595 tiles) in the entire TCGA-CRC-DX cohort (appendix 1 p 3).
For the prediction of hypermutation status, 67 slides labelled high mutation density and 363 labelled low mutation density were considered for binary classification, with our iterative draw and rank sampling method yielding a mean cross-validation AUROC of 0·81 (SD 0·03), compared with a previously published AUROC of 0·71 (table; figure 2).18 Among 62 slides labelled positive for high microsatellite instability and 366 labelled microsatellite instability low or microsatellite stable, our iterative draw and rank sampling method outperformed the method used by Echle and colleagues,11 with a mean cross-validated AUROC of 0·86 (SD 0·04) versus 0·74 (95% CI 0·66–0·80). Among 313 slides labelled as positive for chromosomal instability and 117 labelled as positive for genomic stability, our method outperformed the previously published method, with a mean AUROC of 0·83 (SD 0·02) versus 0·73.18 Among 55 slides labelled CIMP-high and 184 labelled CIMP-low, our mean AUROC was 0·79 (SD 0·05). Our iterative draw and rank sampling method also outperformed previously published methods for the prediction of BRAF mutation status (0·79 [SD 0·01] vs 0·66) and TP53 mutation status (0·73 [0·02] vs 0·64), and showed similar performance to previously published methods for predicting KRAS mutation status (0·60 [0·04] vs 0·60).18
Table.
Performance of the iterative draw and rank sampling method for prediction of hypermutation, microsatellite instability, chromosomal instability, and mutation status from haematoxylin and eosin-stained slides of colorectal cancer
|
Samples (n) |
Published AUROC (95% CI) | IDaRS AUROC (SD) | IDaRS AUPRC (SD) | |||
|---|---|---|---|---|---|---|
| Total | Positive | Negative | ||||
| Four-fold cross-validation in the TCGA-CRC-DX cohort | ||||||
| High vs low mutation density | 430 | 67 | 363 | 0·7118 | 0·81 (0·03) | 0·57 (0·09) |
| Microsatellite instability vs stability | 428 | 62 | 366 | 0·74 (0·66–0·80)11 | 0·86 (0·04) | 0·62 (0·10) |
| Chromosomal instability vs genomic stability | 430 | 313 | 117 | 0·7318 | 0·83 (0·02) | 0·92 (0·01) |
| CIMP-high vs CIMP-low | 239 | 55 | 184 | .. | 0·79 (0·05) | 0·51 (0·05) |
| BRAFmutvs BRAFWT | 502 | 59 | 443 | 0·6618 | 0·79 (0·01) | 0·33 (0·05) |
| TP53mutvs TP53WT | 502 | 294 | 208 | 0·6418 | 0·73 (0·02) | 0·78 (0·04) |
| KRASmutvs KRASWT | 502 | 208 | 294 | 0·6018 | 0·60 (0·04) | 0·53 (0·04) |
| Train-test splits of TCGA-CRC-DX from Kather and colleagues4 | ||||||
| High vs low mutation density | 359 | 66 | 293 | .. | 0·88 (0·02) | 0·66 (0·06) |
| Microsatellite instability vs stability | 359 | 62 | 297 | 0·774 (0·62–0·87) | 0·90 (0·01) | 0·72 (0·02) |
| Chromosomal instability vs genomic stability | 359 | 257 | 102 | .. | 0·85 (0·02) | 0·92 (0·02) |
| CIMP-high vs CIMP-low | 203 | 51 | 152 | .. | 0·84 (0·01) | 0·61 (0·02) |
| Validation of prediction on TCGA-CRC-DX and PAIP datasets | ||||||
| Microsatellite instability vs stability (internal) | 359 | 62 | 297 | 0·774 (0·62–0·87) | 0·90 | 0·72 |
| Microsatellite instability vs stability (external) | 47 | 12 | 35 | .. | 0·98 | 0·95 |
Labels considered positive were high mutation density, microsatellite instability, chromosomal instability, CIMP-high, and mutant (BRAFmut, TP53mut, and KRASmut). Labels considered negative were low mutation density, microsatellite stability, genomic stability, CIMP-low, and wild-type (BRAFWT, TP53WT, and KRASWT). Alongside our analysis, we list published results from previous studies11, 18 of three-fold cross-validation mean AUROCs and a train-to-test split4 AUROC in the TCGA-CRC-DX cohort. AUPRC=area under the precision-recall curve. AUROC=area under the convex hull of the receiver operating characteristic curve. CIMP=CpG island methylator phenotype. IDaRS=iterative draw and rank sampling. PAIP=Pathology Artificial Intelligence Platform. TCGA-CRC-DX=The Cancer Genome Atlas colon and rectal cancer.
Figure 2.

Iterative draw and rank sampling-based prediction of colorectal cancer pathways in the TCGA-CRC-DX cohort
AUROC plots of four-fold cross-validation for prediction of hypermutation (A), microsatellite instability (B), chromosomal instability (C), CpG island methylator phenotype (D), BRAF mutation status (E), and TP53 mutation status (F). The true positive rate represents sensitivity and the false positive rate represents 1–specificity. The blue shaded areas represent the SD. AUROC=area under the convex hull of the receiver operating characteristic curve. TCGA-CRC-DX=The Cancer Genome Atlas colon and rectal cancer.
As Kather and colleagues4 used a subset of the current version of the TCGA-CRC-DX cohort, which contained 62 slides with microsatellite instability and 297 with microsatellite stability, we used the same patient cohort and split the dataset into training and testing groups to compare our prediction of microsatellite instability with that by Kather and colleagues.4 Our iterative draw and rank sampling method outperformed the method used by Kather and colleagues,4 with a mean AUROC of 0·90 (SD 0·01) versus 0·77 (95% CI 0·62–0·87).
The highest AUPRC was obtained for predicting chromosomal instability, with relatively high values for predicting microsatellite instability, TP53 status, hypermutation, and CIMP (table). Generally, the higher the AUROC and the more balanced the dataset, the higher the AUPRC.
A breakdown of slide numbers from the TCGA-CRC-DX cohort by molecular label and cancer stage can be found in appendix 1 (p 2), as can AUROC plots by molecular label and stage (p 6). Among the individual stage groups, hypermutation, chromosomal instability, and BRAF mutation status were predicted with the highest AUROC in patients with stage IV cancer, whereas microsatellite instability was predicted with the highest AUROC in patients with stage I or II disease (appendix 1 pp 6–7). Our method was better at differentiating between CIMP-high and CIMP-low groups in patients with stage I, II, or III cancer than in patients with stage IV cancer (appendix 1 pp 6–7). We did not find any difference in accuracy for predicting TP53 status by cancer stage (appendix 1 pp 6–7).
Model 3 (HoVer-Net) segmented and classified the cell nuclei in each top-ranked tile into five categories (appendix 1 pp 7–8). Non-neoplastic epithelial cells identified by model 3 differed from those identified by the model as neoplastic epithelial cells, but all of these were categorised as tumour cells by the experts (as only tumour tiles were used). Therefore, neoplastic epithelial cells identified by HoVer-Net are called neoplastic epithelial type 1 (NEP1) cells, and non-neoplastic epithelial cells identified by the model are called neoplastic epithelial type 2 (NEP2) cells.
A relatively high proportion of inflammatory and necrotic cells and a relatively low proportion of NEP1, NEP2, and mesenchymal cells were associated with microsatellite instability (figure 3). A relatively high proportion of inflammatory and NEP1 cells and a relatively low proportion of NEP2, mesenchymal, and necrotic cells were associated with hypermutation (figure 3). A relatively high proportion of inflammatory, necrotic, and NEP1 cells and a relatively low proportion of mesenchymal and NEP2 cells were associated with CIMP-high status (figure 3). A relatively high proportion of NEP2, mesenchymal, and NEP1 cells and a relatively low proportion of necrotic and inflammatory cells were associated with chromosomal instability (figure 3). Our feature importance analysis of cellular composition profiles by molecular label, in addition to our analysis of tumour-infiltrating lymphocyte abundance score by molecular label, can be found in appendix 1 (pp 8–10). Figure 3 suggests infiltration by inflammatory cells as a key discriminating histological feature in microsatellite instable and hypermutated tumors. Paired t tests found tumour-infiltrating lymphocyte abundance scores to be significantly associated with the microsatellite instability pathway (p=0·0024) and hypermutation (p=0·024), but not with the CIMP (p=0·090) and the chromosomal instability (p=0·16) pathways. This finding suggests that high proportions of tumour-infiltrating lymphocytes are strongly associated with microsatellite instable and hypermutated tumours.
Figure 3.
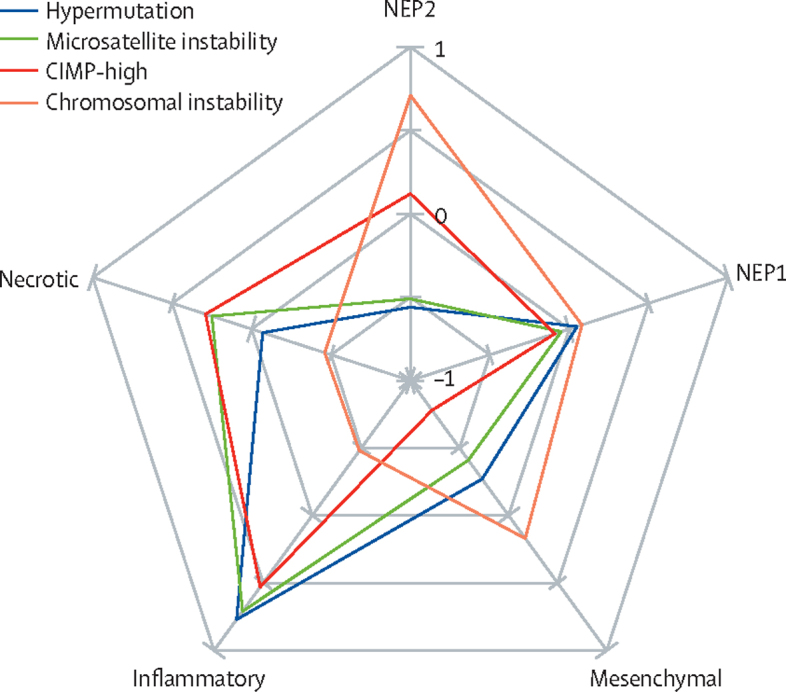
Spider chart of differential cellular compositions as histological features of colorectal cancer pathways
Normalised weights between –1 and 1 show the size of significance of the corresponding histological feature. CIMP-high=CpG island methylator phenotype of high frequencies of DNA hypermethylation. NEP1=neoplastic epithelial type 1. NEP2=neoplastic epithelial type 2.
As can be observed in our tile prediction heatmaps, similar tissue regions appear to be predictive of either a positive or negative status of the four colorectal cancer molecular labels or pathways (appendix 1 pp 10–11). However, tiles associated with the ground truth label differed in number between heatmaps (appendix 1 pp 10–11).
Iterative draw and rank sampling-based digital scores for microsatellite instability and hypermutation showed a strong positive correlation, and the scores for microsatellite instability and CIMP showed a moderate positive correlation, wherein the microsatellite stability score showed the highest positive correlation with the CIMP-low score (appendix 1 pp 11–12). The digital scores of microsatellite instability and CIMP showed strong negative correlations with chromosomal instability (appendix 1 pp 11–12). Microsatellite instability had the strongest negative correlation with genomic stability, CIMP-low had the strongest negative correlation with chromosomal instability, and chromosomal instability had the strongest positive correlation with TP53 mutation status (appendix 1 pp 11–12). Microsatellite instability and CIMP scores were positively correlated with BRAF mutation (appendix 1 pp 11–12).
Discussion
In this retrospective study, we developed and validated a deep learning pipeline using the TCGA-CRC-DX cohort with similar experimental setups to those reported in previously published studies.4, 11, 18 We showed that using a novel training strategy in a standard deep learning model can improve the prediction of key molecular characteristics and mutations in colorectal cancer tumours. Hypermutation, microsatellite instability, chromosomal instability, BRAF mutation status, and TP53 mutation status were predictable from digitised images of routine haematoxylin and eosin-stained slides with a higher accuracy than previously published state-of-the-art computational algorithms. We also optimised our tumour segmentation algorithm, which ensured that non-tumour colon mucosa was not included in the analysis.
We evaluated iterative draw and rank sampling for prediction of KRAS mutation status and BRAF mutation status, both of which could potentially be used for patient stratification for anti-epidermal growth factor receptor therapy. The US Food and Drug Administration have approved the use of immunotherapy for patients with colorectal cancers with high microsatellite instability, and so iterative draw and rank sampling could be used for patient selection using routine diagnostic histology slides. In the UK, the National Institute for Health and Care Excellence have also approved the use of encorafenib plus cetuximab for patients with previously treated, metastatic colorectal cancer positive for BRAF Val600Glu mutations. We hope that our algorithms might prove to be useful alternative tests for key mutations and pathways for patient stratification, potentially reducing turnaround time and saving resources.
Our analysis of stage-wise prediction accuracy (AUROC) indicated that the prediction of hypermutation, molecular pathways (microsatellite instability, chromosomal instability, and CIMP), and key mutations (BRAF and TP53) might vary by cancer stage. For example, the accuracy of microsatellite instability prediction decreased slightly from stage I cancers to stage IV cancers. This finding indicates that tumour stage might affect deep learning-based discrimination of predictive features. Because we interrogated sections of primary tumours only, features of early-stage cancers with microsatellite instability could differ subtly from those of advanced cancers with microsatellite instability, perhaps due to the increased heterogeneity of advanced tumours. Similarly, hypermutation, chromosomal instability, and BRAF mutation status were predicted with the highest AUROC in patients with stage IV cancer. Exploring the predictive value of deep learning features of early-stage cancers might allow for more aggressive and targeted treatment to prevent disease progression.
Key challenges for prediction of microsatellite instability are the trade-off between sensitivity and specificity for clinical gold-standard testing (immunohistochemistry) and inconsistencies among different assays. Further improvements in the AUROC for microsatellite instability prediction and comparison with other molecular and genetic labels are possible if the specificity and sensitivity of the corresponding test used for acquiring the slide-level ground truth labels are improved and known beforehand, and the size of the dataset is increased. The ground truth microsatellite instability labels used in this study were based on molecular data in the TCGA-CRC-DX cohort and PCR assays in the PAIP cohort. The sensitivity (94%) and specificity (88%)29 of gold-standard, immunohistochemistry-based testing should represent a minimum performance threshold that needs to be achieved by digital methods such as iterative draw and rank sampling for scoring microsatellite instability. Further large-scale validation of iterative draw and rank sampling on multiple international cohorts is necessary before it can be considered for clinical use.
We did a cellular composition analysis to mine differential histological features for each of the colorectal cancer pathways, leveraging the ability of iterative draw and rank sampling to produce and overlay a prediction confidence heatmap on the original whole-slide images. Confidence heatmaps have shown that the tiles of both positive and negative labels with varying confidence are often predicted in an image, which could be linked to the difficulty of predicting microsatellite instability, especially when the immunogenic response of microsatellite stability is similar to the histomorphology of microsatellite instability.30 It could also indicate that a more sophisticated aggregation method than a simple average or majority voting might be needed to correctly classify some molecular characteristics.
Knowledge regarding stratification of colorectal cancer into multiple molecular pathways, and the morphological correlates and clinical significance of these pathways, is still evolving, and most findings so far are inconclusive. Gao and colleagues31 found that microsatellite instability was associated with low inflammatory cell infiltration, but not with tumour necrosis, in colorectal cancers; however, others9, 32 found that tumour-infiltrating lymphocytes and an absence of tumour necrosis were strong predictors of microsatellite instability in colorectal cancers. In a study by Saller and colleagues,30 findings compatible with an immunogenic response were observed in the colorectal tumours of three patients, but different assays gave inconsistent interpretations of their microsatellite instability status. This contradiction can be attributed to the absence of an objective and systematic data-driven approach for analysis of the entire tissue slide for multicentre cohorts. In the existing literature, histological correlates of molecular characteristics (eg, microsatellite instability) are often examined only subjectively.6, 7, 9, 31, 32, 33, 34 We believe that our iterative draw and rank sampling-based analysis is a first step towards an objective, quantitative, and reproducible approach for analysing colorectal cancer pathways from routine histology slides and studying their corresponding histological correlates in a systematic and data-driven manner.
A relatively high proportion of NEP2, mesenchymal, and NEP1 cells and a relatively low proportion of necrotic and inflammatory cells were associated with chromosomal instability. This finding could explain the potential association of chromosomal instability with less favourable outcomes.2, 9 The strong association of CIMP-high with a high proportion of inflammatory cells and a low proportion of mesenchymal cells found in our cellular composition analysis might suggest the molecular characteristics of an active immune response, as reported previously.7 A relatively high proportion of inflammatory and necrotic cells and a relatively low proportion of NEP1, NEP2, and mesenchymal cells were associated with microsatellite instability. This finding could explain the favourable response of tumours with microsatellite instability to immunotherapy.35, 36 Our differential cellular composition analysis suggests that the infiltration scores of lymphocytes and necrosis within the tumour can serve as digital biomarkers for further stratification and the analysis of each pathway and its clinical impact. Our findings of a strong correlation between microsatellite instability and hypermutation,1, 3, 37 a moderate correlation between microsatellite instability and CIMP,6, 7 and a high infiltrate of inflammatory cells in microsatellite instable tumours9, 32, 34 are in line with existing literature. The cellular composition profiles of microsatellite instability, hypermutation, chromosomal instability, and CIMP groups potentially add new knowledge to the literature regarding the associations between molecular labels and cell types, requiring large validation and further exploration with subsequent studies.
Our iterative draw and rank sampling algorithm uses Monte Carlo sampling to iteratively select training data from each whole-slide image, leading to a slightly different trained model for each run. Therefore, we ran each experiment three times with the same data splits and report averaged measures. The number of randomly drawn tiles, top-ranked tiles, and maximum training iterations used in the iterative draw and rank sampling training algorithm might not have been optimal (appendix 1 p 6). These values might need to be adjusted for a given problem. Data imbalance—having a different number of positive and negative samples in a binary classification dataset—is another common issue with medical datasets, which can affect classification performance. We therefore reported the AUPRC results in addition to the AUROC results. External validation was done on 47 whole-slide images from the PAIP dataset obtained from three different centres, which is a relatively small dataset. A pre-trained HoVer-Net model—a state-of-the-art alogorithm—was used for nuclei segmentation and classification, which was followed by a review by expert pathologists (AA and DS). However, nuclear segmentation and classification from haematoxylin and eosin-stained images is known to be a challenging task; therefore, our classification of neoplastic and stromal cells for the TCGA-CRC-DX cohort might have been imperfect, affecting our interpretation of the importance of these cell types. Although the TCGA-CRC-DX cohort is a multicentre dataset and PAIP is an external cohort, further large-scale validation of these findings is required before implementation into diagnostic practice and patient management.
Data sharing
All images and the associated pathway and mutation status information for the TCGA-CRC-DX cohort (separated for colon adenocarcinoma and rectal adenocarcinoma) used in this study are publicly available at https://portal.gdc.cancer.gov/ and cBioPortal (https://www.cbioportal.org/). The TCGA-CRC-DX manifest file can be used to download all images for the TCGA-CRC-DX cohort and can be found in appendix 2. The ground truth labels of the TCGA-CRC-DX cohort for hypermutation, microsatellite instability, chromosomal instability, and CIMP were obtained from Liu and colleagues.1 A link to the spreadsheet containing the corresponding clinical and molecular data, including cancer stages, subtypes, and mutation and pathway status, can also be found in appendix 2. The scores generated by our algorithm are provided in appendix 2. Source code can be made available, subject to intellectual property constraints, by contacting the first (mohsin.bilal@warwick.ac.uk) or last (N.M.Rajpoot@warwick.ac.uk) authors. Deidentified pathology images and annotations from the PAIP cohort, which were used with institutional permissions in this study, can be obtained via appropriate data access requests at http://www.wisepaip.org/paip.
Declaration of interests
MI reports grants from Roche, outside the submitted work. DS reports personal fees from Royal Philips, outside the submitted work. NMR reports research funding from GlaxoSmithKline and is also part of the PathLAKE consortium, which is partly funded by Royal Philips. All other authors declare no competing interests.
Acknowledgments
Acknowledgments
The research reported in this Article was supported by the UK Medical Research Council (award MR/P015476/1). The results we report are in whole or in part based on data generated by The Cancer Genome Atlas Research Network. Deidentified pathology images and annotations from the PAIP cohort (used as an external validation cohort in this study) were prepared and provided by Seoul National University Hospital (Seoul, South Korea) by a grant from the Korea Health Technology Research and Development Project through the Korea Health Industry Development Institute, funded by the Ministry of Health and Welfare, South Korea (grant number HI18C0316). The PAIP data collection was funded by a grant of the Korea Health Technology Research and Development Project through the Korea Health Industry Development Institute, funded by the Ministry of Health and Welfare, South Korea (grant number HI18C0316). The content of this Article represents the personal views of the authors and does not necessarily represent the decisions, policy, or views of the authors' employers and associated institutions.
Contributors
MB and NMR conceived the study. FM and SEAR contributed to study design. MB, FM, SEAR, and NMR contributed to methodology design. NMR was responsible for overall project supervision. NMR and MB coordinated the study. MB provided informatics support and did the experiments. MB, FM, and NMR contributed to the literature search. MB contributed to data collection. AA contributed to data curation. MB, SG, FM, SEAR, and NMR contributed to data analysis. MB, SEAR, FM, and NMR contributed to figure design. IAC, MI, DS, AA, and NMR contributed to expert review. All authors contributed to data interpretation. MB and NMR accessed and verified the data underlying this Article. MB prepared the initial manuscript draft. All authors contributed to the writing, review, or revision of the manuscript. All authors had full access to all the data in the study and had final responsibility for the decision to submit for publication.
Supplementary Materials
References
- 1.Liu Y, Sethi NS, Hinoue T, et al. Comparative molecular analysis of gastrointestinal adenocarcinomas. Cancer Cell. 2018;33:721–735.e8. doi: 10.1016/j.ccell.2018.03.010. [DOI] [PMC free article] [PubMed] [Google Scholar]
- 2.Pino MS, Chung DC. The chromosomal instability pathway in colon cancer. Gastroenterology. 2010;138:2059–2072. doi: 10.1053/j.gastro.2009.12.065. [DOI] [PMC free article] [PubMed] [Google Scholar]
- 3.Singh MP, Rai S, Pandey A, Singh NK, Srivastava S. Molecular subtypes of colorectal cancer: an emerging therapeutic opportunity for personalized medicine. Genes Dis. 2019;8:133–145. doi: 10.1016/j.gendis.2019.10.013. [DOI] [PMC free article] [PubMed] [Google Scholar]
- 4.Kather JN, Pearson AT, Halama N, et al. Deep learning can predict microsatellite instability directly from histology in gastrointestinal cancer. Nat Med. 2019;25:1054–1056. doi: 10.1038/s41591-019-0462-y. [DOI] [PMC free article] [PubMed] [Google Scholar]
- 5.Al-Sohaily S, Biankin A, Leong R, Kohonen-Corish M, Warusavitarne J. Molecular pathways in colorectal cancer. J Gastroenterol Hepatol. 2012;27:1423–1431. doi: 10.1111/j.1440-1746.2012.07200.x. [DOI] [PubMed] [Google Scholar]
- 6.Bae JM, Kim JH, Kang GH. Molecular subtypes of colorectal cancer and their clinicopathologic features, with an emphasis on the serrated neoplasia pathway. Arch Pathol Lab Med. 2016;140:406–412. doi: 10.5858/arpa.2015-0310-RA. [DOI] [PubMed] [Google Scholar]
- 7.Advani SM, Advani P, DeSantis SM, et al. Clinical, pathological, and molecular characteristics of CpG island methylator phenotype in colorectal cancer: a systematic review and meta-analysis. Transl Oncol. 2018;11:1188–1201. doi: 10.1016/j.tranon.2018.07.008. [DOI] [PMC free article] [PubMed] [Google Scholar]
- 8.Guinney J, Dienstmann R, Wang X, et al. The consensus molecular subtypes of colorectal cancer. Nat Med. 2015;21:1350–1356. doi: 10.1038/nm.3967. [DOI] [PMC free article] [PubMed] [Google Scholar]
- 9.Shia J, Schultz N, Kuk D, et al. Morphological characterization of colorectal cancers in The Cancer Genome Atlas reveals distinct morphology-molecular associations: clinical and biological implications. Mod Pathol. 2017;30:599–609. doi: 10.1038/modpathol.2016.198. [DOI] [PMC free article] [PubMed] [Google Scholar]
- 10.Moreno V, Sanz-Pamplona R. Altered pathways and colorectal cancer prognosis. BMC Med. 2015;13:76. doi: 10.1186/s12916-015-0307-6. [DOI] [PMC free article] [PubMed] [Google Scholar]
- 11.Echle A, Grabsch HI, Quirke P, et al. Clinical-grade detection of microsatellite instability in colorectal tumors by deep learning. Gastroenterology. 2020;159:1406–1416. doi: 10.1053/j.gastro.2020.06.021. [DOI] [PMC free article] [PubMed] [Google Scholar]
- 12.Snead DR, Tsang Y-W, Meskiri A, et al. Validation of digital pathology imaging for primary histopathological diagnosis. Histopathology. 2016;68:1063–1072. doi: 10.1111/his.12879. [DOI] [PubMed] [Google Scholar]
- 13.Diao JA, Wang JK, Chui WF, et al. Human-interpretable image features derived from densely mapped cancer pathology slides predict diverse molecular phenotypes. Nat Commun. 2021;12:1613. doi: 10.1038/s41467-021-21896-9. [DOI] [PMC free article] [PubMed] [Google Scholar]
- 14.Yamashita R, Long J, Longacre T, et al. Deep learning model for the prediction of microsatellite instability in colorectal cancer: a diagnostic study. Lancet Oncol. 2021;22:132–141. doi: 10.1016/S1470-2045(20)30535-0. [DOI] [PubMed] [Google Scholar]
- 15.Schmauch B, Romagnoni A, Pronier E, et al. A deep learning model to predict RNA-Seq expression of tumours from whole slide images. Nat Commun. 2020;11:3877. doi: 10.1038/s41467-020-17678-4. [DOI] [PMC free article] [PubMed] [Google Scholar]
- 16.Sirinukunwattana K, Domingo E, Richman SD, et al. Image-based consensus molecular subtype (imCMS) classification of colorectal cancer using deep learning. Gut. 2021;70:544–554. doi: 10.1136/gutjnl-2019-319866. [DOI] [PMC free article] [PubMed] [Google Scholar]
- 17.Skrede O-J, De Raedt S, Kleppe A, et al. Deep learning for prediction of colorectal cancer outcome: a discovery and validation study. Lancet. 2020;395:350–360. doi: 10.1016/S0140-6736(19)32998-8. [DOI] [PubMed] [Google Scholar]
- 18.Kather JN, Heij LR, Grabsch HI, et al. Pan-cancer image-based detection of clinically actionable genetic alterations. Nat Cancer. 2020;1:789–799. doi: 10.1038/s43018-020-0087-6. [DOI] [PMC free article] [PubMed] [Google Scholar]
- 19.Rony J, Belharbi S, Dolz J, Ayed IB, McCaffrey L, Granger E. Deep weakly-supervised learning methods for classification and localization in histology images: a survey. arXiv. 2019 https://arxiv.org/abs/1909.03354 (preprint) published online Sept 8. [Google Scholar]
- 20.Lu MY, Williamson DFK, Chen TY, Chen RJ, Barbieri M, Mahmood F. Data-efficient and weakly supervised computational pathology on whole-slide images. Nat Biomed Eng. 2021;5:555–570. doi: 10.1038/s41551-020-00682-w. [DOI] [PMC free article] [PubMed] [Google Scholar]
- 21.Tellez D, Litjens G, van der Laak J, Ciompi F. Neural image compression for gigapixel histopathology image analysis. IEEE Trans Pattern Anal Mach Intell. 2021;43:567–578. doi: 10.1109/TPAMI.2019.2936841. [DOI] [PubMed] [Google Scholar]
- 22.Campanella G, Hanna MG, Geneslaw L, et al. Clinical-grade computational pathology using weakly supervised deep learning on whole slide images. Nat Med. 2019;25:1301–1309. doi: 10.1038/s41591-019-0508-1. [DOI] [PMC free article] [PubMed] [Google Scholar]
- 23.Wang X, Chen H, Gan C, et al. Weakly supervised deep learning for whole slide lung cancer image analysis. IEEE Trans Cybern. 2020;50:3950–3962. doi: 10.1109/TCYB.2019.2935141. [DOI] [PubMed] [Google Scholar]
- 24.He K, Zhang X, Ren S, Sun J. Deep residual learning for image recognition. The IEEE Conference on Computer Vision and Pattern Recognition; Las Vegas, NV, USA; June 27–30, 2016 (abstr 16541111).
- 25.Graham S, Vu QD, Raza SEA, et al. HoVer-Net: simultaneous segmentation and classification of nuclei in multi-tissue histology images. Med Image Anal. 2019;58:101563. doi: 10.1016/j.media.2019.101563. [DOI] [PubMed] [Google Scholar]
- 26.Gamper J, Koohbanani NA, Benet K, Khuram A, Rajpoot N. In: European Congress on Digital Pathology. Reyes-Aldasoro C, Janowczyk A, Veta M, Bankhead P, Sirinukunwattana K, editors. Springer; Cham: 2019. PanNuke: an open pan-cancer histology dataset for nuclei instance segmentation and classification; pp. 11–19. [Google Scholar]
- 27.Otsu N. A threshold selection method from gray-level histograms. IEEE Trans Sys, Man & Cybern. 1979;9:62–66. [Google Scholar]
- 28.Shaban M, Awan R, Fraz MM, et al. Context-aware convolutional neural network for grading of colorectal cancer histology images. IEEE Trans Med Imaging. 2020;39:2395–2405. doi: 10.1109/TMI.2020.2971006. [DOI] [PubMed] [Google Scholar]
- 29.Stjepanovic N, Moreira L, Carneiro F, et al. Hereditary gastrointestinal cancers: ESMO Clinical Practice Guidelines for diagnosis, treatment and follow-up†. Ann Oncol. 2019;30:1558–1571. doi: 10.1093/annonc/mdz233. [DOI] [PubMed] [Google Scholar]
- 30.Saller J, Qin D, Felder S, Coppola D. Microsatellite stable colorectal cancer with an immunogenic phenotype: challenges in diagnosis and treatment. Clin Colorectal Cancer. 2020;19:123–131. doi: 10.1016/j.clcc.2020.02.003. [DOI] [PubMed] [Google Scholar]
- 31.Gao J-F, Arbman G, Wadhra TI, Zhang H, Sun X-F. Relationships of tumor inflammatory infiltration and necrosis with microsatellite instability in colorectal cancers. World J Gastroenterol. 2005;11:2179–2183. doi: 10.3748/wjg.v11.i14.2179. [DOI] [PMC free article] [PubMed] [Google Scholar]
- 32.Greenson JK, Huang S-C, Herron C, et al. Pathologic predictors of microsatellite instability in colorectal cancer. Am J Surg Pathol. 2009;33:126–133. doi: 10.1097/PAS.0b013e31817ec2b1. [DOI] [PMC free article] [PubMed] [Google Scholar]
- 33.Hendry S, Salgado R, Gevaert T, et al. Assessing tumor-infiltrating lymphocytes in solid tumors: a practical review for pathologists and proposal for a standardized method from the International Immunooncology Biomarkers Working Group: part 1: assessing the host immune response, TILs in invasive breast carcinoma and ductal carcinoma in situ, metastatic tumor deposits and areas for further research. Adv Anat Pathol. 2017;24:235–251. doi: 10.1097/PAP.0000000000000162. [DOI] [PMC free article] [PubMed] [Google Scholar]
- 34.Smyrk TC, Watson P, Kaul K, Lynch HT. Tumor-infiltrating lymphocytes are a marker for microsatellite instability in colorectal carcinoma. Cancer. 2001;91:2417–2422. [PubMed] [Google Scholar]
- 35.Kang S, Na Y, Joung SY, Lee SI, Oh SC, Min BW. The significance of microsatellite instability in colorectal cancer after controlling for clinicopathological factors. Medicine (Baltimore) 2018;97:e0019. doi: 10.1097/MD.0000000000010019. [DOI] [PMC free article] [PubMed] [Google Scholar]
- 36.Sun BL. Current microsatellite instability testing in management of colorectal cancer. Clin Colorectal Cancer. 2021;20:e12–e20. doi: 10.1016/j.clcc.2020.08.001. [DOI] [PubMed] [Google Scholar]
- 37.Yuza K, Nagahashi M, Watanabe S, Takabe K, Wakai T. Hypermutation and microsatellite instability in gastrointestinal cancers. Oncotarget. 2017;8:112103–112115. doi: 10.18632/oncotarget.22783. [DOI] [PMC free article] [PubMed] [Google Scholar]
Associated Data
This section collects any data citations, data availability statements, or supplementary materials included in this article.
Supplementary Materials
Data Availability Statement
All images and the associated pathway and mutation status information for the TCGA-CRC-DX cohort (separated for colon adenocarcinoma and rectal adenocarcinoma) used in this study are publicly available at https://portal.gdc.cancer.gov/ and cBioPortal (https://www.cbioportal.org/). The TCGA-CRC-DX manifest file can be used to download all images for the TCGA-CRC-DX cohort and can be found in appendix 2. The ground truth labels of the TCGA-CRC-DX cohort for hypermutation, microsatellite instability, chromosomal instability, and CIMP were obtained from Liu and colleagues.1 A link to the spreadsheet containing the corresponding clinical and molecular data, including cancer stages, subtypes, and mutation and pathway status, can also be found in appendix 2. The scores generated by our algorithm are provided in appendix 2. Source code can be made available, subject to intellectual property constraints, by contacting the first (mohsin.bilal@warwick.ac.uk) or last (N.M.Rajpoot@warwick.ac.uk) authors. Deidentified pathology images and annotations from the PAIP cohort, which were used with institutional permissions in this study, can be obtained via appropriate data access requests at http://www.wisepaip.org/paip.