

Summary:
Rapid cell type identification by new genomic single-cell analysis methods has not been met with efficient experimental access to these cell types. To facilitate access to specific neural populations in mouse cortex, we collected chromatin accessibility data from individual cells and identified enhancers specific for cell subclasses and types. When cloned into recombinant adeno-associated viruses (AAVs) and delivered to the brain, these enhancers drive transgene expression in specific cortical cell subclasses. We extensively characterized several enhancer AAVs to show that they label different projection neuron subclasses as well as a homologous neuron subclass in human cortical slices. We also show how coupling enhancer viruses expressing recombinases to a newly generated transgenic mouse, Ai213, enables strong labeling of three different neuronal classes/subclasses in the brain of a single transgenic animal. This approach combines unprecedented flexibility with specificity for investigation of cell types in the mouse brain and beyond.
Keywords: AAV, enhancer, transgenic mouse, cell types, recombinase, ATAC-seq, cortex
EToc Blurb
Graybuck and Daigle et al., generated a single-cell chromatin accessibility dataset for adult mouse cortex and identified functional enhancer elements. They created a suite of enhancer-containing adeno associated viruses to label genetically defined cell populations in the mouse brain.
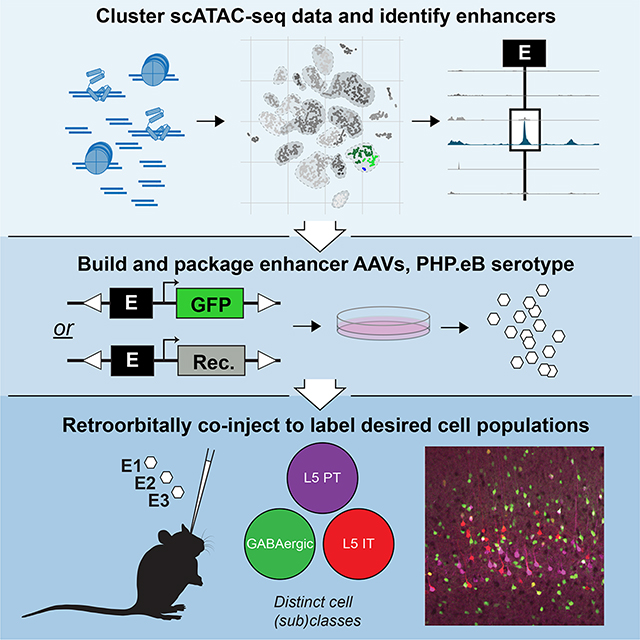
Graphical Abstract
Introduction
All complex multicellular organisms perform an almost miraculous feat: transforming a single genome into a multitude of highly specialized cell types and tissues. This diversity of interpretation of a single, finite source – the genome – is enabled, in part, by developmentally-regulated epigenetic programs that selectively reveal specific regions of the genome to enable specific gene expression (Klemm et al., 2019). Enhancers and other distal regulatory elements act as “adjectives” that modify the emphasis our cells place on genes to drive cell type-specific expression programs, thus regulating the construction of highly diverse and specialized tissues such as the brain (Attanasio et al., 2013; Preissl et al., 2018).
To understand brain function, we need to define brain cell types and build genetic tools to selectively label and perturb them for further study (Tasic et al., 2018; Zeng and Sanes, 2017). Recent advances in single-cell profiling, such as single-cell RNA sequencing (scRNA-seq) (Saunders et al., 2018; Tasic et al., 2016, 2018; Zeisel et al., 2018), have defined cell types on the basis of genome-wide gene expression and unsupervised clustering. In the mouse cortex, we have defined more than 100 cell types (Tasic et al., 2018), which were organized in a taxonomy with two major neuronal classes (GABAergic and glutamatergic) divided into many subclasses (groups of related cell types). This characterization included the discovery of many new marker genes for groups of cells at all levels of the taxonomy (classes, subclasses, and types). Experimental access to these cell populations in the brain still depends largely on transgenic lines generated on the basis of marker gene expression (Daigle et al., 2018; Gong et al., 2007; Taniguchi et al., 2011; Tasic et al., 2016, 2018). However, the creation, maintenance, and sharing of transgenic mouse lines is costly. Establishment of lines that label more than one cell type or class requires laborious crosses, which yield a low frequency of experimental animals with three or four transgenes because of the laws of Mendelian genetics.
Recombinant viruses have been used as an alternative to traditional transgenes to access specific cell populations (Dimidschstein et al., 2016; Hrvatin et al., 2019; Lee et al., 2014; Nair et al., 2020; Vormstein-Schneider et al., 2020), but a systematic approach to generating these tools for a genetically-defined cell population of interest in the mouse brain does not exist. The viral tool kit is limited to only a few cell classes in the mouse central nervous system and it is currently unknown whether a general approach for discovery and generation of cell class/subclass/type-specific viruses is possible.
Here, we provide a high-quality dataset for the single-cell version of the Assay for Transposase-Accessible Chromatin (scATAC-seq) for the adult mouse cortex to reveal genome-wide regions of open chromatin across cortical cell classes and subclasses. Then, we integrate these data with scRNA-seq data to identify functional enhancer elements that, when introduced into recombinant adeno-associated viruses (AAVs), consistently label genetically defined cell populations in mice (Figure 1). Moreover, here and in a companion study (Mich et al., 2021), we show that they work across mammalian species. Finally, we demonstrate that these enhancer viruses can be co-delivered into transgenic reporter animals, including a newly generated Ai213, to strongly and with varied sparseness label multiple cell types simultaneously.
Figure 1. Overview of enhancer discovery for viral tool development.

1–4) To build cell type-specific labeling tools, we isolated cells from adult mouse cortex, performed scATAC-seq, clustered the samples, and compared them to scRNA-seq datasets to assign identity to the scATAC-seq clusters and cells. 5–8) Putative enhancers differentially accessible in scATAC-seq clusters were identified, cloned into recombinant AAVs and screened for desired expression patterns. 8–9) Promising viruses were further evaluated by scRNA-seq, RNAscope, and/or in binary expression systems. 10) Three enhancer viruses were delivered to an Ai213 transgenic animal to label three distinct cell types in a single animal.
Results
Single-cell ATAC-seq of adult mouse cortex
We isolated individual neuronal and non-neuronal cells from transgenically labeled mouse cortex using fluorescence-activated cell sorting (FACS) and examined them using scATAC-seq (Figure 1) (Buenrostro et al., 2015; Cusanovich et al., 2015). To generate scATAC-seq data that would be directly comparable to our recently published scRNA-seq dataset (Tasic et al., 2018), we dissected adult primary visual cortex (VISp) for glutamatergic cell types. We allowed broader cortical sampling for GABAergic cell types based on our observation that GABAergic cell types are shared across the mouse cortex, whereas the glutamatergic types differ between regions (Tasic et al., 2018). To access both abundant and rare cell types, we utilized 25 transgenic Cre or Flp recombinase-expressing driver lines or their combinations crossed to appropriate reporter lines (Figure S1A and see Key Resources Table), many of which we previously characterized by single-cell RNA-seq (Tasic et al., 2018). To selectively examine VISp neurons with projections into specific brain regions, we injected these regions in reporter mice with recombinase-expressing viruses (Retro-ATAC-seq; Figure S1, see Key Resources Table, Table S1, and Table S2), collected cells from VISp and performed scATAC-seq.
KEY RESOURCES TABLE.
| REAGENT or RESOURCE | SOURCE | IDENTIFIER |
|---|---|---|
| Antibodies | ||
| Rabbit anti-GFP primary antibody | Abcam | Cat#ab6556 |
| Bacterial and Virus Strains | ||
| CAV-Cre | Miguel Chillon Rodrigues, Hnasko, et al. 2016 | N/A |
| mscRE1-SYFP2 | This paper | N/A |
| mscRE2-SYFP2 | This paper | N/A |
| mscRE3-SYFP2 | This paper | N/A |
| mscRE4-SYFP2 | This paper | N/A |
| mscRE4-minCMVprim-SYFP2 | This paper | N/A |
| 3xCore-mscRE4-minCMVprim-SYFP2 | This paper | N/A |
| mscRE4-FlpO | This paper | N/A |
| mscRE10-FlpO | This paper | N/A |
| mscRE13-FlpO | This paper | N/A |
| mscRE16-FlpO | This paper | N/A |
| mscRE4-iCre | This paper | N/A |
| mscRE10-iCre | This paper | N/A |
| mscRE13-iCre | This paper | N/A |
| mscRE16-iCre | This paper | N/A |
| mscRE4-tTA2 | This paper | N/A |
| mscRE10-tTA2 | This paper | N/A |
| mscRE13-tTA2 | This paper | N/A |
| mscRE16-tTA2 | This paper | N/A |
| mscRE1-EGFP | This paper | N/A |
| mscRE2-EGFP | This paper | N/A |
| mscRE3-EGFP | This paper | N/A |
| mscRE4-EGFP | This paper | N/A |
| mscRE10-EGFP | This paper | N/A |
| mscRE11-EGFP | This paper | N/A |
| mscRE12-EGFP | This paper | N/A |
| mscRE13-EGFP | This paper | N/A |
| mscRE15-EGFP | This paper | N/A |
| mscRE16-EGFP | This paper | N/A |
| hl56i-iCre-4X2C | This paper | N/A |
| Syn-Cre | This paper | N/A |
| Syn-FlpO | This paper | N/A |
| Syn-oNigri | This paper | N/A |
| mscRE16-oNigri | This paper | N/A |
| mscRE75-SYFP2 | This paper | N/A |
| mscRE76-SYFP2 | This paper | N/A |
| mscRE77-SYFP2 | This paper | N/A |
| mscRE78-SYFP2 | This paper | N/A |
| mscRE79-SYFP2 | This paper | N/A |
| mscRE79-SYFP2 | This paper | N/A |
| hDlx56i-H2B-nsSYFP2 | This paper | N/A |
| hl56i-iCre | This paper | N/A |
| DIO-EGFP | This paper | N/A |
| mscRE4-dgCre | This paper | N/A |
| Chemicals, Peptides, and Recombinant Proteins | ||
| Trehalose dihydrate | Sigma-Aldrich | Cat#T9531 |
| Tagment DNA TDE1 Enzyme and Buffer Kits | Illumina | Cat#FC-121-1030 |
| Agencourt AMPure XP beads | Beckman Coulter | Cat#A63881 |
| 2X Kapa HiFi HotStart ReadyMix | Kapa Biosystems | Cat# KK2602 |
| Phusion high-fidelity polymerase | NEB | Cat#M0530S |
| Opti-MEM I media with reduced serum and GlutaMAX | ThermoFisher Scientific | Cat#51985034 |
| Polyethylenimine (PEI) | Polysciences | Cat#23966-1 |
| Antibiotic-Antimycotic solution | Gibco | Cat#15240062 |
| Benzonase nuclease | Sigma-Aldrich | Cat#E8263 |
| SMART-Seq lysis buffer with RNase inhibitor | Takara | Cat#ST0764 |
| Critical Commercial Assays | ||
| Quant-iT PicoGreen assay | Thermo Fisher | Cat#P7589 |
| RNAscope HiPlex Assays | Advanced Cell Diagnostics | Cat#324100 |
| Fam84b probe | ACD | Cat#500991-T1 |
| Rorb probe | ACD | Cat#444271-T3 |
| Scnn1a probe | ACD | Cat#441391-T5 |
| Hsd11b1 probe | ACD | Cat#496231-T7 |
| SYFP2 probe | ACD | Cat#590291-T1 |
| TdTomato probe | ACD | Cat#317041-T2 |
| BioAnalyzer High Sensitivity DNA kit | Agilent | Cat#5067-4626 |
| SMART-Seq v4 Ultra Low Input RNA kit | Takara | Cat#634894 |
| NexteraXT DNA Library Preparation kit | Illumina | Cat#FC-131-1096 |
| NexteraXT Index Kit V2 Set A | Illumina | Cat#FC-131-2001 |
| Quick-DNA 96 Plus Kit | Zymo Research | Cat#D4071 |
| Deposited Data | ||
| ENCODE whole cortex DNase-seq HotSpot peaks | Yue et al., 2014 | sample ID ENCFF651EAU from experiment ID ENCSR00COF |
| Tasic et al. 2018 scRNA-seq dataset | Tasic et al., 2018 | https://assets.nemoarchive.org/dat-7qjdj84 |
| GEO accession for Camk2a, Pvalb, and Vip neuron populations | Gray et al., 2017 | GSE63137 |
| GEO accession for Cux2, Scnn1a-Tg3, Rbp4, Ntsr1, Gad2, mES, and genomic controls | Gray et al., 2017 | GSE87548 |
| GEO accession data | Cusanovich et al., 2015 | GSE67446 |
| GEO accession data | Buenrostro et al., 2015 | GSE65360 |
| GEO accession data | Pliner et al., 2018 | GSE109828 |
| GM12878 DNA-seq HotSpot | ENCODE | Experiment ID ENCSR000EJD |
| hg19 | ENCODE | File ID ENCFF206HYT |
| hg38 | ENCODE | File ID ENCFF773SCF |
| scATAC-seq dataset | This paper | https://assets.nemoarchive.org/dat-7qjdj84 |
| RefSeq Gene annotations | UCSC Genome Browser database | N/A |
| scRNA-seq dataset | This paper | https://assets.nemoarchive.org/dat-7qjdj84 |
| Experimental Models: Cell Lines | ||
| B-Lymphocytes | Coriell Institute | Cat#GM12878 |
| HEK293T cells | ATCC | Cat#CRL-3216 |
| 129S6B6F1 cell line, G4 | George et al., 2007 | N/A |
| Bxb1 landing pad into TIGRE locus ES cell line | Daigle et al., unpublished | N/A |
| Experimental Models: Organisms/Strains | ||
| Mouse: Cck-IRES-Cre: Ccktm1.1(cre)Zjh/J | The Jackson Laboratory | RRID:IMSR_JAX:012706 |
| Mouse: Chat-IRES-Cre: B6;129S6-Chattm1(cre)Lowl/J | The Jackson Laboratory | RRID:IMSR_JAX:006410 |
| Mouse: Ctgf-T2A-dgCre: B6.Cg-Ccn2tm1.1(folA/cre)Hze/J | The Jackson Laboratory | RRID:IMSR_JAX:028535 |
| Mouse: Cux2-CreERT2: B6(Cg)-Cux2tm3.1(cre/ERT2)Mull/Mmmh | MMRRC | RRID:MMRRC_032779-MU |
| Mouse: Gad2-IRES-Cre: Gad2tm2(cre)Zjh/J | The Jackson Laboratory | RRID:IMSR_JAX:010802 |
| Mouse: Gng7-Cre_KH71: B6.FVB(Cg)-Tg(Gng7-cre)KH71Gsat/Mmucd | MMRRC | RRID:MMRRC_037413-UCD |
| Mouse: Ndnf-IRES2-dgCre: B6.Cg-Ndnftm1.1(folA/cre)Hze/J | The Jackson Laboratory | RRID:IMSR_JAX:028536 |
| Mouse: Nkx2.1-CreERT2: Nkx2-1tm1.1(cre/ERT2)ZJh/J | The Jackson Laboratory | RRID:IMSR_JAX:014552 |
| Mouse: Nos1-CreERT2: B6;129S-Nos1tm1.1(cre/ERT2)Zjh/J | The Jackson Laboratory | RRID:IMSR_JAX:014541 |
| Mouse: Nr5a1-Cre: FVB-Tg(Nr5a1-cre)2Lowl/J | The Jackson Laboratory | RRID:IMSR_JAX:006364 |
| Mouse: Ntsr1-Cre_GN220: B6.FVB(Cg)-Tg(Ntsr1-cre)GN220Gsat/Mmucd | MMRRC | RRID:MMRRC_030648-UCD |
| Mouse: Penk-IRES2-Cre: B6;129S-Penktm2(cre)Hze/J | The Jackson Laboratory | RRID:IMSR_JAX:025112 |
| Mouse: Pvalb-IRES-Cre: B6;129P2-Pvalbtm1(cre)Arbr/J | The Jackson Laboratory | RRID:IMSR_JAX:008069 |
| Mouse: Pvalb-T2A-CreERT2: Pvalbtm1.1(cre/ERT2)Hze/J | The Jackson Laboratory | RRID:IMSR_JAX:021189 |
| Mouse: Rbp4-Cre_KL100: Tg(Rbp4-Cre)KL100Gsat/Mmucd | MMRRC | RRID:MMRRC_031125-UCD |
| Mouse: Scnn1a-Tg2-Cre: B6;C3-Tg(Scnn1a-cre)2Aibs/J | The Jackson Laboratory | RRID:IMSR_JAX:009112 |
| Mouse: Scnn1a-Tg3-Cre: B6;C3-Tg(Scnn1a-cre)3Aibs/J | The Jackson Laboratory | RRID:IMSR_JAX:009613 |
| Mouse: Slc17a6-IRES-Cre: Slc17a6tm2(cre)Lowl/J | The Jackson Laboratory | RRID:IMSR_JAX:016963 |
| Mouse: Slc17a7-IRES2-Cre: B6;129S-Slc17a7tm1.1(cre)Hze/J | The Jackson Laboratory | RRID:IMSR_JAX:023527 |
| Mouse: Slc17a8-IRES2-Cre: B6;129S-Slc17a8tm1.1(cre)Hze/J | The Jackson Laboratory | RRID:IMSR_JAX:028534 |
| Mouse: Slc32a1-T2A-FlpO: B6.Cg-Slc32a1tm1.1(flpo)Hze/J | The Jackson Laboratory | RRID:IMSR_JAX:029591 |
| Mouse: Sst-IRES-Cre: Ssttm2.1(cre)ZJh/J | The Jackson Laboratory | RRID:IMSR_JAX:013044 |
| Mouse: Sst-IRES-FlpO: Ssttm3.1(flpo)Zjh/J | The Jackson Laboratory | RRID:IMSR_JAX:028579 |
| Mouse: Tac1-IRES2-Cre: B6;129S-Tac1tm1.1(cre)Hze/J | The Jackson Laboratory | RRID:IMSR_JAX:021877 |
| Mouse: Vip-IRES-Cre: Viptm1(cre)Zjh/J | The Jackson Laboratory | RRID:IMSR_JAX:010908 |
| Mouse: Vip-IRES-FlpO: Viptm2.1(flpo)Zjh/J | The Jackson Laboratory | RRID:IMSR_JAX:028578 |
| Mouse: Vipr2-IRES2-Cre: B6.Cg-Vipr2em1.1(cre)Hze/J | The Jackson Laboratory | RRID:IMSR_JAX:031332 |
| Mouse: Ai14(RCL-tdT): B6.Cg-Gt(ROSA)26Sortm14(CAG-tdTomato)Hze/J | The Jackson Laboratory | RRID:IMSR_JAX:007914 |
| Mouse: Ai63(TIT-tdT): N/A | Available by request | N/A |
| Mouse: Ai65(RCF-tdT): B6;129S-Gt(ROSA)26Sortm65.1(CAG-tdTomato)Hze/J | The Jackson Laboratory | RRID:IMSR_JAX:021875 |
| Mouse: Ai139(TIT2L-GFP-ICL-TPT): B6.Cg-Igs7tm139.1(tetO-EGFP,CAG-tdTomato,-tTA2)Hze/J | The Jackson Laboratory | RRID:IMSR_JAX:030219 |
| Mouse: Snap25-LSL-F2A-GFP: B6.Cg-Snap25tm1.1Hze/J | The Jackson Laboratory | RRID:IMSR_JAX:021879 |
| Mouse: Ai213 (TICL-EGFP-ICF-mOrange2-ICN-mKate2): B6;129S6-Igs7tm213(CAG-EGFP,CAG-mOrange2,CAG-mKate2)Hze/J | The Jackson Laboratory | RRID:IMSR_JAX: 034113 |
| Recombinant DNA | ||
| pHelper plasmid (encodes adenoviral replication proteins) | Agilent | Cat#240071 |
| pUCmini-iCAP-PHP.eB plasmid (encodes engineered PHP.eB capsid protein) | Chan et al., 2017 | Addgene Cat#103005 |
| AiP1269-scAAV-mscRE4-minBGpromoter- SYFP2-WPRE3-bGHpA | This paper | Addgene Cat#163471 |
| AiP978-pAAV-mscRE4-minBGpromoter- FlpO-WPRE-hGHpA | This paper | Addgene Cat#163472 |
| AiP1036-pAAV-mscRE10-minBGpromoter- FlpO-WPRE-hGHpA | This paper | Addgene Cat#163473 |
| AiP1037-pAAV-mscRE13-minBGpromoter- FlpO-WPRE-hGHpA | This paper | Addgene Cat#163474 |
| AiP1038-pAAV-mscRE16-minBGpromoter- FlpO-WPRE-hGHpA | This paper | Addgene Cat#163475 |
| AiP1010-pAAV-mscRE4-minBGpromoter- iCre-WPRE-hGHpA | This paper | Addgene Cat#163476 |
| AiP1046-pAAV-mscRE13-minBGpromoter- iCre-WPRE-hGHpA | This paper | Addgene Cat#163478 |
| AiP1047-pAAV-mscRE16-minBGpromoter- iCre-WPRE-hGHpA | This paper | Addgene Cat#163479 |
| AiP1011-pAAV-mscRE4-minBGpromoter- tTA2-WPRE-hGHpA | This paper | Addgene Cat#163480 |
| AiP1048-pAAV-mscRE10-minBGpromoter- tTA2-WPRE-hGHpA | This paper | Addgene Cat#163481 |
| AiP1049-pAAV-mscRE13-minBGpromoter- tTA2-WPRE-hGHpA | This paper | Addgene Cat#163482 |
| AiP1050-pAAV-mscRE16-minBGpromoter- tTA2-WPRE-hGHpA | This paper | Addgene Cat#163483 |
| AiP981-pAAV-mscRE4-minBGpromoter- EGFP-WPRE-hGHpA | This paper | Addgene Cat#163484 |
| AiP995-pAAV-mscRE10-minBGpromoter- EGFP-WPRE-hGHpA | This paper | Addgene Cat#163485 |
| AiP1002-pAAV-mscRE16-minBGpromoter- EGFP-WPRE-hGHpA | This paper | Addgene Cat#163486 |
| AiP1078-pAAV-mscRE16-minBGpromoter- oNigri-WPRE-hGHpA | This paper | Addgene Cat#163490 |
| CN1294-scAAV-hI56i-minBglobin-iCre-WPRE3-BGHpA | This paper | Addgene Cat#164451 |
| CN1496-rAAV-hDlxI56i-minBglobin-H2B-nsSYFP2-WPRE3-BGHpA | This paper | Addgene Cat#164449 |
| CN1818-rAAV-3x(core)mscRE4-minCMV-SYFP2-WPRE3-BGHpA | This paper | Addgene Cat#164458 |
| CN1851-rAAV-hI56i-minBglobin-iCre-4X2C-WPRE3-BGHpA | This paper | Addgene Cat#164450 |
| CN2014-rAAV-mscRE4-minCMV-SYFP2-WPRE3-BGHpA | This paper | Addgene Cat#164457 |
| CN2249-rAAV-eHGT_451m-minBglobin-SYFP2-WPRE3-BGHpA | This paper | Addgene Cat#164452 |
| CN2251-rAAV-eHGT_453m-minBglobin-SYFP2-WPRE3-BGHpA | This paper | Addgene Cat#164453 |
| CN2254-rAAV-eHGT_459m-minBglobin-SYFP2-WPRE3-BGHpA | This paper | Addgene Cat#164454 |
| CN2255-rAAV-eHGT_460m-minBglobin- SYFP2 SYFP2-WPRE3-BGHpA (Synthetic) | This paper | Addgene Cat#164455 |
| CN2256-rAAV-eHGT_462m-minBglobin-SYFP2-WPRE3-BGHpA | This paper | Addgene Cat#164456 |
| AiP1266-scAAV-mscRE1-minBGprom-SYFP2-WPRE3-BGHpA | This paper | N/A |
| AiP1267-scAAV-mscRE2-minBGprom-SYFP2-WPRE3-BGHpA | This paper | N/A |
| AiP1268-scAAV-mscRE3-minBGprom-SYFP2-WPRE3-BGHpA | This paper | N/A |
| AiP1101-pAAV-eHGT_340m-minBGprom-FlpO-WPRE-hGHpA | This paper | N/A |
| AiP996-pAAV-MGT_E11 -minGprom_EGFP-WPRE-hGHpA | This paper | N/A |
| AiP997-pAAV-MGT_E12-minBGprom-EGFP-WPRE-hGHpA | This paper | N/A |
| AiP999-pAAV-MGT_E13-minGprom_EGFP-WPRE-hGHpA | This paper | N/A |
| AiP1000-pAAV-MGT_E14-minBGprom-EGFP-WPRE-hGHpA | This paper | N/A |
| AiP1009-pAAV-MGT_E4-minBGprom-dgCre-WPRE-hGHpA | This paper | N/A |
| Software and Algorithms | ||
| Bowtie v1.1.0 | Langmead et al., 2009 | https://github.com/BenLangmead/bowtie |
| samtools rmdup | Li et al., 2009 | http://www.htslib.org/doc/samtools-rmdup.html |
| RPhenograph | Levine et al., 2015 | https://github.com/JinmiaoChenLab/Rphenograph |
| limma | Ritchie et al., 2015 | https://bioconductor.org/packages/release/bioc/html/limma.html |
| HOMER | Heinz et al., 2010 | http://homer.ucsd.edu/homer/ |
| DiffBind | Stark et al., 2011 | https://bioconductor.org/packages/release/bioc/html/DiffBind.html |
| STAR v2.5.3 | Dobin et al., 2013 | https://github.com/alexdobin/STAR |
| scrattch.hicat | Tasic et al., 2018 | https://github.com/AllenInstitute/scrattch.hicat |
| Igor Pro | Wavemetrics | https://www.wavemetrics.com/ |
| HiPlex Registration software | Advanced Cell Diagnostics | https://acdbio.com/product-type2/software-rnascope-hiplex-image-registration |
| CellProfiler | Lamprecht et al., 2007 | https://cellprofiler.org/ |
| R v.3.5.0 and greater | R project | https://www.r-project.org/ |
| Rstudio IDE (Integrated Development Environment for R) | Rstudio | https://rstudio.com/products/rstudio/#:~:text=RStudio%20is%20an%20integrated%20development,to%20see%20more%20RStudio%20features. |
| Rstudio Server Open Source Edition | Rstudio | https://rstudio.com/products/rstudio/download-server/ |
| data.table | Dowle, 2019 | https://cran.r-project.org/web/packages/data.table/index.html |
| dplyr | Wickham, 2018 | https://cran.r-project.org/web/packages/dplyr/index.html |
| Matrix | Bates, 2018 | https://cran.r-project.org/web/packages/Matrix/index.html |
| matrixStats | Bengtsson, 2018 | https://cran.rstudio.com/web/packages/matrixStats/index.html |
| purrr | Henry, 2019 | https://cran.r-project.org/web/packages/purrr/index.html |
| reshape2 | Wickham, 2007 | https://cran.r-project.org/web/packages/reshape2/index.html |
| GenomicAlignments | Lawrence et al., 2013 | https://bioconductor.org/packages/release/bioc/html/GenomicAlignments.html |
| GenomicRanges | Lawrence et al., 2013 | https://bioconductor.org/packages/release/bioc/html/GenomicRanges.html |
| rtracklayer | Lawrence et al., 2009 | https://bioconductor.org/packages/release/bioc/html/rtracklayer.html |
| cowplot | Wilke, 2018 | https://cran.r-project.org/web/packages/cowplot/index.html |
| ggbeeswarm | Clarke, 2017 | https://github.com/eclarke/ggbeeswarm |
| ggExtra | Attali, 2018 | https://cran.r-project.org/web/packages/ggExtra/index.html |
| ggplot2 | Wickham, 2016 | https://ggplot2.tidyverse.org/ |
| rgl | Adler, 2018 | https://cran.r-project.org/web/packages/rgl/index.html |
| Rtsne | Krijthe, 2015 | https://cran.r-project.org/web/packages/Rtsne/index.html |
| scrattch.io | Tasic et al., 2018 | https://github.com/AllenInstitute/scrattch.io |
| metacodeR | Foster, 2016 | https://grunwaldlab.github.io/metacoder_documentation/ |
| taxa | Foster, 2018 | https://github.com/ropensci/taxa |
| plater | Hughes, 2016 | https://docs.ropensci.org/plater/ |
| phastCons | Siepel and Haussler, 2005 | http://compgen.cshl.edu/phast/ |
| Other | ||
| Nanoject II | Drummond Scientific Company | Cat#3-000-204 |
| Allen Institute data portal | Allen Institute, http://celltypes.brain-map.org/ | N/A |
In total, we collected 3,602 single cells from 60 mice, 126 retrogradely labeled cells from three injection targets across seven donors, and 96 cells labeled by retro-orbital (RO) injection of a viral tool generated in this study (Table S3). After FACS, cells were subjected to scATAC-seq and were sequenced in 60–96 sample batches (see STAR Methods). We performed quality-control (QC) to select 2,509 samples with >10,000 uniquely mapped fragments (median fragments per cell = 113,184), with >10% of fragments longer than 250 base pairs (bp), and with >25% of fragments overlapping high-depth cortical DNase-seq peaks generated by ENCODE (Yue et al., 2014) (Figure 2A, Figure S1A–C, and Table S3). Our method yielded a scATAC-seq dataset of comparable quality to several previously published datasets (Buenrostro et al., 2015; Cusanovich et al., 2015; Cusanovich et al., 2018) (Figure S1D–K).
Figure 2. Identification of cell classes, subclasses, and types in scATAC-seq data by correlation with scRNA-seq.

(A) For scATAC-seq analysis, we retained samples with >10,000 uniquely mapped fragments (QC1) that overlapped ENCODE whole-cortex DNase-seq peaks with >25% of fragments (QC2), and which had nucleosomal structure identified by >10% of all aligned fragments with an insert size >250bp (QC3). (B) Samples were down-sampled to 10,000 unique fragments, which were extended to 1 kb, and overlaps were merged for comparison between samples using a Jaccard distance. Distances were used as input for t-SNE projection. (C) Samples were clustered in t-SNE space using RPhenograph clustering. Cells from each cluster were pooled and fragments within 20 kb of each TSS were counted. Marker genes for transcriptomic clusters from Tasic et al. (Tasic et al., 2018) were correlated between ATAC TSS counts and log-transformed gene expression. Each ATAC cluster was assigned identity based on its best-correlated transcriptomic cluster. (D) t-SNE as in (C) labeled according to cell source. (E–H) Native fluorescence images of live coronal brain sections of Ai14 reporter mice retrogradely injected by CAV-Cre into various brain locations. (E) Left: full hemisphere with injection site (RT, reticular nucleus of thalamus). Right, VISp containing retrogradely labeled cells collected for scRNA-seq. (F) As in (E) for a superior colliculus (SC) retrograde injection. (G) t-SNE of scATAC-seq samples colored according to source: Rbp4-Cre (Rbp4, blue); retro-RT (orange), retro-SC (red). (H) As in (E) for a VISp-contralateral (VISp-c) retrograde injection. One hemisphere was injected (left), and cells were collected only from the opposite hemisphere (right). Asterisk, tissue lost in sectioning. Right: closer view of collection site. (I) t-SNE of samples colored to highlight cells collected from Cux2-CreERT2 (Cux2, green) and retrograde labeling from VISp-c (purple).
Identification of cell classes and subclasses in scATAC-seq data
To define cell classes (i.e., GABAergic and glutamatergic), subclasses (related subpopulations of GABAergic and glutamatergic cells), and types (e.g., Pvalb Vipr2 or Sst Chodl types; only select types can be defined due to the inherent limitations in the resolution of our and other scATAC-seq datasets), we clustered the scATAC-seq data using a feature-free method for computation of pairwise distances (Figure 2B and STAR Methods). These distances were used for principal component analysis (PCA) and t-distributed stochastic neighbor embedding (t-SNE), followed by Phenograph clustering (Levine et al., 2015) (Figure 2C and STAR Methods). This procedure segregated cells into clusters as expected based on previous transcriptomic analyses (Figure 2D). For quantitative comparison to scRNA-seq data at the cluster level, we computed accessibility scores for each gene by counting the number of reads in each cluster near each RefSeq transcription start site (TSS ± 20 kb). These scores were correlated with median marker gene expression values for each VISp scRNA-seq cluster from Tasic et al. (Tasic et al., 2018) and scATAC-seq cluster and cell identity was assigned based on the scRNA-seq cluster with the highest correlation (Figure 2C, Table S4, and STAR Methods). For many driver lines examined, we found that subclass-level composition in scATAC-seq data was similar to that from scRNA-seq data (Figure S2).
Transcriptomic types of glutamatergic neurons in the cortex preferentially reside in specific layers and project to specific brain areas. In VISp, intratelencephalic (IT, also called cortico-cortical) neurons reside in all layers except L1 and send axon projections to other cortical regions. Pyramidal tract (PT, also called extra-telencephalic or subcerebral projection neurons) neurons reside in L5 and project subcortically to the thalamus (TH) and tectum, whereas an additional subclass of subcortically-projecting neurons, termed cortico-thalamic (CT) neurons, reside in L6 and project to the thalamus (Harris et al., 2019). Previously, we associated transcriptomic identity with neuronal projection patterns by Retro-seq, which combines retrograde tracing with scRNA-seq (Economo et al., 2018; Tasic et al., 2016; Tasic et al., 2018).
To examine if our cell-type assignment in scATAC-seq was congruent with neuronal projection properties, we performed scATAC-seq on retrogradely labeled neurons (Retro-ATAC-seq, Figure 2E–I). We injected a virus into a cortical or subcortical projection target and processed cells collected from VISp (see STAR Methods). We focused on injections that would differentiate subcortically projecting neurons (project from VISp to TH and superior colliculus [SC]) from cortico-cortically projecting neurons (project from VISp to contralateral VISp [VISp-c]). Consistent with our annotation of ATAC-seq clusters by comparison to scRNA-seq above, cells labeled by injections into TH (Figure 2E) and SC (Figure 2F) clustered with cells labeled as L6 CT and L5 PT subclasses (Figure 2G), whereas injections into VISp-c (Figure 2H) labeled cells in the L2/3 IT, L4 IT, and L5 IT subclasses (Figure 2I). Likewise, our subclass assignments for L5, L2/3, and L6 subclasses agreed with the transgenic sources from which the cells were derived. For example, cells derived from Rbp4-Cre were mostly present in L5 IT and L5 PT subclasses (Figure 2G), whereas cells derived from Cux2-CreERT2 fell into L2/3 IT and L4 IT subclasses (Figure 2I) (Gray et al., 2017).
Identification of putative subclass-specific enhancers
We aggregated the data from different scATAC-seq clusters for examination of chromatin accessibility patterns within cell classes, subclasses, and select types (Figure S3A, B; Table S4). The aggregated scATAC-seq profiles displayed expected relatedness among each other and with published ATAC-seq from cortical cell populations (Gray et al., 2017; Mo et al., 2015) (Figure S3A, B). To identify putative enhancers, which we term mouse single-cell regulatory elements (mscREs), we defined peaks in chromatin accessibility in the neighborhoods of marker genes identified in our previous transcriptomic study (Tasic et al., 2018). For this study, we focused on L5 PT, L5 IT, L6 IT Car3, or L6 IT cell subclasses because there are currently no viral genetic tools to target these specific populations. We identified 16 mscREs that were ~500–600 bp-long (Table S5), conserved across mammals (Siepel et al., 2005), and preferentially accessible in each target subclass compared to all others (Figure S3C) including four that were extensively characterized in this study: mscRE4, mscRE10, mscRE13, and mscRE16 (Figure 3A–D).
Figure 3. Example mscREs.

Chromatin accessibility in clusters on the basis of single-cell ATAC-seq data for select genomic regions containing (A) mscRE4, (B) mscRE16, (C) mscRE10, and (D) mscRE13. The nearby gene, which is the likely target of each enhancer (shaded), with the transcription start site (TSS) and the direction of transcription designated by a small arrow. The distance between each TSS and mscRE is indicated by a dashed line with a large arrow. For a complete set of mscREs examined in this study, see Figure S3C.
Enhancer-driven fluorophore viruses for cell subclass labeling
To functionally test mscREs, we cloned them upstream of a minimal β-globin promoter (Yee and Rigby, 1993) driving fluorescent proteins SYFP2 or EGFP in a recombinant AAV genome (Figure 4A; see Key Resources Table) and packaged PHP.eB-serotyped viruses to enable blood-brain barrier (BBB) crossing (Chan et al., 2017). We screened nine mscREs for the L5 PT subclass, two for L5 IT, three for L6 IT Car3, and two for L6 IT (Figure S4; Table S2 and S8). Two weeks after RO injection of virus, we analyzed native or anti-GFP-enhanced fluorescence in brain slices and defined the success rate by subclass or type using three criteria: 1) labeling within the desired cortical layer (“L”), 2) morphology (“M”) of the labeled cells, and 3) transcriptomics (“T”; Figure S4A, B). We found that seven out of nine L5 PT viruses (78%), one out of two L5 IT viruses (50%), one out of two L6 IT viruses (50%), and zero out of three L6 IT Car3 viruses exhibited desired labeling based on at least two criteria (L+M or L+T). The remaining viruses did not label any cells in the sections analyzed or labeled cells non-specifically (38% failure rate; Figure S4B and Table S8). We selected several enhancers with specificity for different cell subclasses for additional examination of the specificity and completeness of labeling with these viral tools (mscRE4, mscRE10, mscRE13, and mscRE16).
Figure 4. Direct fluorophore labeling of L5 PT neurons by enhancer viruses.

(A) Experimental workflow for testing the enhancer virus containing a putative Fam84b enhancer, mscRE4, in a self-complementary AAV backbone (scAAV) with a beta-globin minimal promoter (pBGmin) driving SYFP2. WPRE3: short woodchuck hepatitis virus posttranscriptional regulatory element; pA: polyadenylation site. (B) Live tissue section (250 μm-thick) imaged on a dissecting microscope shows fluorescently labeled cells in L5. (C) L5 was dissected and analyzed by scRNA-seq (n = 219 cells from n = 2 animals were mapped to the Tasic et al. (Tasic et al., 2018) cell type reference). ~92% mapped to L5 PT cell types. (D) scATAC-seq samples in a t-SNE projection with subclass and type labels for reference – same as in rightmost panel in Figure 2C, included here for ease of comparison. (E) Cells in (D), highlighting samples collected for mscRE4-SYFP2, VISp L5 dissection, and FACS (n = 61 QC-qualified cells from n = 1 animal; 90% of cells cluster with L5 PT subclass). (F) Electrophysiological characterization of cells in cortical slices from animals in (A). Left: Example voltage responses to a series of hyperpolarizing and depolarizing current injections for a YFP(+) neuron from VISp and unlabeled PT-like and IT-like neurons from somatosensory cortex. Middle: Example impedance amplitude (Z) for same neurons including a nearby YFP(−) neuron in VISp. Right: Resonance frequency (fR) plotted as a function of input resistance (RN, right) for same neurons. (G) Input resistance (RN), sag ratio, and resonance frequency (fR) for the four neuronal groups in (F). (H) Schematics of viral genomes constructed to evaluate concatenation of mscRE4. A CMV minimal promoter and a non-self-complementary AAV backbone was used. Center, Tn5 transposon footprinting of the genomic region including mscRE4 (blue bars). The Core-mscRE4 subregion (orange bars) was selected based on differential accessibility in L5 PT scATAC-seq cluster (green) vs. non-L5 PT scATAC-seq samples (gray) and conservation (PhastCons scaled between 0–1 (black)). Accessibility tracks are scaled to Footprints per Million Reads (FpPM). (I) Native fluorescence imaged with identical settings in VISp of labeling by titer-matched mscRE4-pCMVmin-SYFP2 and the 3xCore-mscRE4-pCMVmin-SYFP2 viruses delivered by RO injections three weeks earlier. (J) RNAscope analysis workflow performed after experimental workflow in (A) but on 20 μm-sections (detailed in STAR Methods). (K) In-tissue positions of cells labeled by RNAscope from an animal RO injected with mscRE4-pCMVmin-SYFP2. Black dashed lines indicate the calculated L5 boundaries based on Fam84b expression. Each spot is a single cell: gray, unlabeled; SYFP2+ only (brown); Fam84b+ only (magenta); Rorb+ only (yellow); SYFP2+ and Fam84b+ (green); SYFP2+ and Rorb+ (dark blue); Fam84b+ and Rorb+ (orange). (L) Data from (K) plotted as cell counts (top) relative to pia for cells positive for each combination of probes (below the plot). Cell counts for the full cortical depth (FD) or restricted to L5 are provided above the plot. Completeness and specificity were calculated based on L5 counts. Points are jittered on the x-axis using quasirandom positioning. (M) Same as (K) but for 3xCore-mscRE4-pCMVmin-SYFP2 virus. (N) Data from (M) plotted as in (L).
To determine the specificity of the enhancer viruses driving fluorophores, we performed additional RO injections, dissected L5 of VISp, isolated labeled cells by FACS, and performed SMART-Seq v4-based scRNA-seq as described previously (Figure 4A) (Tasic et al., 2018). We classified these scRNA-seq expression profiles by mapping to our reference transcriptomic taxonomy (see STAR Methods) (Tasic et al., 2018). We observed labeling in L5 and found that the mscRE4-SYFP2 virus yielded >91% specificity for L5 PT cells within L5 (Figure 4B,C and Table S6). Using the same strategy, we collected cells labeled by mscRE4-SYFP2 for scATAC-seq. As previously observed by scRNA-seq analysis, 55 of 61 mscRE4 scATAC-seq profiles clustered with other L5 PT samples (90%, Figure 4D,E). We also confirmed labeling of L5 PT cells by electrophysiological characterization of labeled versus unlabeled cells in mouse cortex (Figure 4F,G). Cells labeled by mscRE4-SYFP2 had physiological characteristics of thick-tufted cortical L5 PT neurons (high resonance frequency and low input resistance), whereas unlabeled cells matched L5 IT neurons (Baker et al., 2018; Dembrow et al., 2010). These data collectively demonstrate that L5 PT neurons are labeled and can be examined reliably by the mscRE4-SYFP enhancer virus.
We next tested stereotaxic injection of the mscRE4 and mscRE16 fluorophore viruses directly into VISp and found we could achieve bright labeling, but specificity assessed by scRNA-seq was lower than with RO delivery (Figure S5). Therefore, we sought to enhance the efficacy of RO injection-based labeling by optimizing the design of viral genomes using complementary approaches: a stronger minimal promoter (cytomegalovirus, CMV) and multiple enhancer copies. To ensure additional copies of mscRE4 would fit in the AAV genome with diverse gene expression cargo, we selected a short “core” sequence (155 bp) from the mscRE4 enhancer and inserted three copies in a construct driving SYFP2 (“3xCore”, Figure 4H). The labeling of L5 PT cells by the 3xCore virus appeared brighter compared to the original, single-copy mscRE4-SYFP virus (Figure 4I).
While scRNA-seq is suitable for examination of labeling specificity, we know that some cell types, such as L5 PT neurons, are sensitive to cell isolation and may be partially depleted among profiled neurons (Tasic et al., 2018). To assess specificity and completeness of mscRE4-SYFP2 or 3xCore-mscRE4-SYFP2 viral labeling in situ, we used single molecule RNA fluorescence in situ hybridization with RNAscope (Figure 4J). Probes against SYFP2 were used to detect virus-labeled cells, Fam84b for L5 PT subclass and to delineate L5 borders, and Rorb for L4 and most L5 IT subclasses (STAR Methods). We found that mscRE4-SYFP2 was highly specific for L5 PT neurons (94% on-target in L5; n = 45 Fam84b+/SYFP2+ cells out of 48 total SYFP2+ cells; n = 2 sections; one section shown in Figure 4K,L; Table S7), but labeled only 30% of the total Fam84+ L5 PT cells (n = 45 Fam84b+/SYFP2+ cells out of 149 total Fam84b+ cells). By comparison, the 3xCore-mscRE4-SYFP2 virus labeled 33% of the total Fam84b+ L5 PT cell population (n = 56 Fam84b+/SYFP2+ cells out of 169 total Fam84b+ cells; n = 1 section; shown in Figure 4M,N; Table S7) and also had high specificity for L5 PT neurons (95% on-target in L5; n = 56 Fam84b+/SYFP2+ cells out of 59 total SYFP2+ cells). We conclude that the 3xCore-mscRE4 AAV design may improve the brightness of L5 PT labeling with SYFP2 compared to the single copy mscRE4 virus without compromising the specificity of labeling.
Viral enhancer-driven recombinases
We next sought to determine whether enhancer viruses expressing an exogenous recombinase or transcription factor could be combined with transgenic reporter lines to enable high and reliable reporter gene expression (Daigle et al., 2018; Madisen et al., 2015). We generated mscRE4 viruses that expressed a destabilized Cre (dgCre), a mouse codon-optimized Cre or Flp (iCre or FlpO), or a tetracycline-dependent transcriptional activator (tTA2), and delivered these into corresponding reporter mice: Ai14 (Madisen et al., 2010), Ai65F, or Ai63 (Daigle et al., 2018) (Figure 5A). tTA2 and FlpO viruses achieved highest specificity for L5, with tTA2 giving the most restricted and sparsest labeling. The iCre-expressing virus labeled excitatory types mainly in L5 and L6, with sparser expression observed in L2/3, whereas the dgCre-expressing virus gave widespread non-specific labeling and was not pursued further.
Figure 5. Cell subclass labeling by enhancer-driven recombinase or transcription factor viruses.

(A) Schematics of enhancer-driven FlpO, dgCre, iCre, or tTA2 viruses. E: enhancer, pBGmin: minimal beta-globin promoter; WPRE: woodchuck hepatitis virus posttranscriptional regulatory element; pA: polyadenylation site. Viral genomes were packaged into PHP.eB-serotype rAAVs and RO injected into reporter mice. Images show native reporter fluorescence in VISp, 2–3 weeks post-injection. (B-E) Representative images of native reporter fluorescence from VISp in mice RO injected with indicated FlpO viruses (left). Lines indicate approximate layer boundaries. tdTomato+ cells from full cortical depth were collected by FACS for scRNA-seq, and their transcriptomic profiles were mapped to reference cell types from Tasic et al. (Tasic et al., 2018). (F-G) Representative RNAscope images from VISp of animals injected with mscRE4-FlpO or mscRE16-FlpO viruses probed for Fam84b, Rorb, and tdTomato expression. (H) Positions of individual cells (dots) relative to the pial surface from animal in (F) examined by RNAscope: unlabeled (gray); tdTomato+ only (magenta); Fam84b+ only (cyan); Rorb+ only (yellow); tdTomato+ and Fam84b+ (purple); tdTomato+ and Rorb+ (orange); Fam84b+ and Rorb+ (green). Cell counts and probe combinations are shown above and below, respectively, for whole cortical depth and L5 only (n = 1 brain slice analyzed per genotype/virus combination). Black dashed lines indicate calculated L5 boundaries based on Fam84b expression. Points are jittered on the x-axis using quasirandom positioning. (I) Same as in (H) for animal in (G).
We then evaluated mscRE10, mscRE13, and mscRE16 as drivers of FlpO, iCre, and/or tTA2 by RO injection at two different amounts (1×10¹⁰ and 1×10¹¹ total genome copies, GC). We found that the specificity and completeness of labeling depended on the total GC of virus delivered, the recombinase-reporter combination used in these experiments (Figure S6), and the age of mice at the time of injection (young mice have more overall labeling; data not shown). Based on these experiments, we chose a single titer for mscRE4, mscRE10, mscRE13, and mscRE16 FlpO viruses for in-depth characterization by scRNA-seq (Figure 5B–E). Three out of four of these viruses showed high degree of layer- and subclass-specificity in the cortex. Among cells labeled by mscRE4-FlpO, 87.5% matched L5 PT cells (Figure 5B), and 42% of cells labeled by mscRE16-FlpO matched L5 IT cells (Figure 5E). The mscRE13-FlpO virus proved to be largely non-specific (18% of cells mapping to expected L6 IT subclass with many other types labeled, Figure 5D). The mscRE10-FlpO labeled L6 cells (75% L6 CT or L6b), as predicted by scATAC-seq (Figure 5C and Figure S3C). However, this virus did not label L6 IT Car3 cells, despite mscRE10 accessibility in this cell type in scATAC-seq and the proximity of mscRE10 to the Car3 gene (Figure S3C).
To assess the specificity and completeness of mscRE4-FlpO and mscRE16-FlpO in situ, we injected each virus into Ai65F reporter mice and analyzed the tissue by RNAscope as described above (Figure 5F–I, Table S7). mscRE4-FlpO was highly specific for L5 PT, with 89% of labeled cells matching L5 PT (n = 50 tdT+/Fam84b+ cells out of 56 total tdT+ cells; n = 2 sections, Table S7; one section shown in Figure 5H), consistent with scRNA-seq results in Figure 5B, and similar to direct labeling by mscRE4-pCMVmin-SYFP2 in Figure 4K–L. While specific, labeling was incomplete: only 27% of the cells belonging to L5 PT subclass were labeled (n = 50 tdT+/Fam84b+ cells out of 185 total Fam84b+ cells; Figure 5H, Table S7). mscRE16-FlpO labeled only 9% of the total Rorb+ L5 IT cell population (n = 23 Rorb+/tdT+ cells out of 262 total Rorb+ cells; n = 2 sections; Table S7; one section shown in Figure 5I), and had moderate specificity for L5 IT neurons (64% on-target in L5; n = 23 Rorb+/tdT+ cells out of 33 total tdT+ cells; Figure 5I, Table S7). Co-labeling of tdT+ with Fam84b+ was counted as off-target labeling (19% L5 PT cells; n= 45 tdT+/Fam84b+ cells out of 233 total Fam84b+ cells, Figure 5I), consistent with scRNA-seq (7 of 48 cells, 15%, Figure 5E). Imaging, scRNA-seq, and RNAscope results are summarized in Table S8 for the 35 enhancer viruses tested.
Lastly, we investigated if RO virus delivery and transgene expression affected endogenous gene expression by comparing scRNA-seq from matched virus-labeled and transgene-labeled cell types. We found no significant induction of innate immune genes when virus was RO-injected (Figure S7A–E). In contrast, and as observed previously (Daigle et al., 2018), we found viral volume-dependent innate immune gene induction after stereotaxic injection (Figure S7F–I). Therefore, RO delivery of AAV does not induce an obvious inflammatory response compared to direct brain injection in VISp.
Combinatorial labeling of cell subclasses
To simplify breeding and experimental schemes, we tested if enhancer viruses could be combined with one another and with transgenic reporter lines to label multiple cell types simultaneously in mouse brain in vivo (Figure 6A). mscRE4-iCre (for L5 PT neurons) and mscRE16-FlpO (for L5 IT neurons) viruses were RO co-injected into Ai65F/wt;Ai140/wt double reporter mice (Figure 6B) and labeling was examined two weeks post-injection. We found largely distinct labeling of L5 PT (in green) and L5 IT (in red) cells throughout the cortex (Figure 6B–C), demonstrating that enhancer-driven viruses can be used simultaneously to label defined neuronal subclasses in one animal.
Figure 6. Combinatorial cell subclass labeling.

(A) Schematic representation of strategy to label single- (red or green) or dual recombinase-expressing (yellow) cell types. (B) Representative native fluorescence images from an Ai65F;Ai140 dual-reporter mouse injected with mscRE16-FlpO and mscRE4-iCre viruses showing mostly mutually exclusive labeling in L5. White box = inset image (right). (C) Cell counts within each layer for all cortical regions containing EGFP and tdTomato cells.
While the above strategy enabled two color labeling, it required the creation of double-transgenic reporter animals. To simplify breeding and expand the number of cell types that could be differentially and robustly labeled within a single animal, we generated Ai213 (Figure 7A; STAR Methods), a new triple-recombinase reporter transgenic mouse line with independent recombinase (Cre, Flp, or Nigri) gating of three different fluorophores in the TIGRE locus (Zeng et al., 2008). We evaluated Ai213 by RO delivery of rAAVs with synapsin promoter-driven Cre, FlpO, or a mouse codon-optimized Nigri recombinase (oNigri, Figure 7B). We observed robust expression (a single fluorophore per recombinase) as expected and very little cross-recombination (Figure 7C). When these viruses were mixed and RO-delivered into Ai213 mice, we observed strong expression of all three fluorophores in the cortex, with most cells labeled by individual fluorophores (Figure 7C–D). Despite matching titers, more EGFP+ (Cre+) cells were observed relative to mOrange2+ (FlpO+) and mKate2+ (Nigri+; Figure 7C–D), which is likely a reflection of higher Cre recombinase efficiency compared with FlpO and oNigri, as reported previously (Karimova et al., 2016). To test if we could increase fluorophore co-labeling by improving transduction efficiency, we delivered the same combination of viruses directly into the cerebral ventricle of Ai213 neonates (Figure S8), an approach previously shown to yield widespread transduction throughout the mouse brain (Kim et al., 2014). As expected, we observed more cells labeled by each fluorophore from intracerebroventricular (ICV)-injected Ai213 mice (Figure S8B–D). However, the number of triple-labeled cells was still low (~13%) and cross-recombination at unintended sites occurred (data not shown). To determine if low co-labeling was due to Ai213 transgene silencing, we crossed Ai213 to Gad2-IRES-Cre and Slc31a1-T2A-FlpO transgenic driver lines and analyzed EGFP and mOrange2 expression in triple transgenic animals (Figure S8E–F). We observed expected pan-inhibitory expression patterns for both recombinases and near-perfect overlap of the two fluorophores, demonstrating that the Cre- and Flp-dependent transcriptional units are fully active in Ai213, at least in the inhibitory cell types in the cortex.
Figure 7. Combinatorial cell (sub)class labeling with a new three-color reporter line, Ai213.

(A) Schematic representation of the Ai213 reporter transgene in the TIGRE locus. mOrange2 and mKate2 were tagged with the HA and P2A epitopes, respectively. (B,C) Ai213 heterozygous mice were RO-injected with either pSyn-Cre (B, left panel), pSyn-FlpO (B, middle panel), or pSyn-oNigri (B, right panel) viruses or all three viruses in combination (C); 1×10¹¹ genome copies (GCs) per each virus. Native reporter fluorescence was imaged with the same instrument settings in VISp. (D) Numbers of cells labeled with specified fluorophores in VISp from genotypes and viruses indicated on the left from images in (B) and (C). EGFP counts represent all cells expressing EGFP including double and triple positive cells; same applies to counts for other fluorophore labels. Data are expressed as mean cell counts ± S.E.M (n ≥ 2 images per n = 3 mice per group). Second scale for % total cells labeled is provided. (E) Ai213 heterozygous mice were RO-injected with a mixture of the hl56i-iCre-4X2C (pan-GABAergic), mscRE4-FlpO (L5 PT), and mscRE16-oNigri (L5 IT) viruses with 1×10¹¹ GCs per each virus. Native reporter fluorescence was imaged in VlSp. (F) The number of labeled cells for each fluorophore was quantified as in (D) for n = 2 images per n = 3 mice.
To determine if distinct cell types could be labeled simultaneously with Ai213, we RO co-injected three subclass-specific enhancer-driven recombinase viruses into an adult Ai213 mouse (Figure 7E): rAAV-mscRE4-FlpO, which targets FlpO to L5 PT cells (magenta, mOrange2); rAAV-mscRE16-oNigri, which targets oNigri expression to L5 IT cells (red, mKate2); and rAAV-hi56i-iCre-4X2C, which targets iCre expression to GABAergic cells (green, EGFP). The rAAV-hi56i-iCre-4X2C vector incorporates a micro RNA-binding element (mAGNET) that suppresses expression in excitatory cells (Sayeg et al., 2015) and is described in greater detail in Figure S8. Two weeks after injection, we observed mostly non-overlapping expression of the three fluorophores with expected layer specificity: EGFP broadly labeled GABAergic cells throughout the cortex, while mOrange2 and mKate2 were found primarily in L5 in mostly non-overlapping cell populations in VISp (Figure 7F). Collectively, these data demonstrate the broad utility of Ai213 with enhancer viruses for robust labeling of three distinct cell classes or subclasses in a single transgenic animal.
Labeling of L5 PT neurons in human ex vivo slices
To determine if an enhancer element discovered in mouse is functional in human tissue, we tested whether the mscRE4 enhancer can label L5 PT neurons in human neocortical slice culture. In human neocortex, L5 PT neurons are rare, constituting <1% of all neurons in middle temporal gyrus (MTG) (Hodge et al., 2020). To label this rare neuronal population, we applied the mscRE4-FlpO virus together with a Flp-dependent EGFP reporter virus directly to human MTG ex-vivo slice cultures (Figure 8A). Labeled neurons were sparsely observed throughout L2–L6, and thus labeling was not as specific as observed in mouse VISp. However, sparse neurons labeled in L5 had large somata, suggesting they were human PT neurons. Example biocytin fills demonstrated that these large EGFP+ neurons were thick-tufted neurons (Figure 8B) with apical dendrites extending ~2 mm to reach the pial surface. These neurons exhibited electrophysiological properties consistent with PT neurons in rodents, including a low Rn and a resonant frequency of ~5 Hz. In contrast, non-labeled neurons possessed properties consistent with non-PT neurons in rodents (i.e., a higher RN and a lower resonant frequency; Figure 8C–F). For a subset of neurons, we extracted the nucleus through the recording pipette at the end of electrical recording for RNA sequencing. Three of four EGFP+ neurons mapped to a putative PT transcriptomic type, and one of seven EGFP- neurons mapped to a putative L6 IT cluster (Figure 8G; (Hodge et al., 2020)). Other EGFP+ and EGFP− neurons did not yield sufficiently high-quality RNA-seq data to enable high-confidence mapping. These results demonstrate the feasibility of applying the mscRE4 enhancer in an AAV vector to label and functionally characterize L5 PT neurons across species.
Figure 8. mscRE4-based virus labels L5 PT neurons in human middle temporal gyrus.

(A) mscRE4-Cre enhancer virus in combination with a conditional reporter virus drives fluorescent protein expression in human MTG. EGFP+ neurons were targeted for Patch-seq/standard patch-clamp experiments. (B) Biocytin fills of two double labeled neurons in human MTG. (C) Example voltage responses to a chirp stimulus for an EGFP+ neuron and a non-labeled EGFP- L5 pyramidal neuron. (D) Impedance amplitude profiles for the neurons in (C). (E) Voltage response to a suprathreshold depolarizing current injection and hyperpolarizing current injection for the neurons in (C). (F) Resonance frequency as a function of input resistance. (G) Representative EGFP-labeled neuron mapped to a putative PT transcriptomic cell type while the non-labeled neuron mapped to a L6 IT transcriptomic cell type.
Discussion
We have provided a foundational scATAC-seq dataset for adult mouse cortex and demonstrated that it can be integrated with scRNA-seq data to identify functional cell subclass-specific enhancers and create subclass-specific viral tools.
Most methods for generation of enhancer-based genetic tools rely on various approaches for DNA fragment selection followed by screening of those fragments for expression in recombinant viruses or transgenes. Fragments with potential enhancer activity can be selected based on a variety of criteria including: 1) conservation (Dickel et al., 2018), 2) proximity to genes (Pfeiffer et al., 2008), 3) presence of open chromatin in a specific set of cells from a cell line (Arnold et al., 2013), tissue (Blankvoort et al., 2018), experimentally derived cell population (Hartl et al., 2017) or computationally derived cell class from single cell data (Cusanovich et al., 2018), or 4) a combination of criteria (Juttner et al., 2019). Screening can be performed at various levels of multiplexing from “one-at-a-time” to multiplexed approaches (Arnold et al., 2013; Hartl et al., 2017; Kishi et al., 2019; Shen et al., 2016).
Inspired by these studies, we aimed to shorten the path from defining to experimentally accessing specific transcriptomic or epigenomic cell classes or subclasses. We relied on single cell epigenetic profiling to define specific enhancers for cell subclasses in mouse cortex at high resolution and specificity. That allowed us to translate these enhancers into tools for specific cell subclasses of interest with relatively high frequency by one-at-a-time viral tool screening/characterization. The success rate of enhancer virus tool discovery largely depended on the cell class targeted; 78% for L5 PT cells (L+M criteria; Figure S4) and 50% for L5 IT and L6 IT cells (L+T criteria; Figure S4). Future identification of functional enhancers for tool building across a range of cell types, especially for rare cell types or types with considerable continuity in gene expression profiles, may require improvements in the data quality (e.g., the number of nuclei and/or read-depth) and may depend on discreteness of separation for the cell type of interest compared to the most related other types.
Current limitations of enhancer viruses
Several key limitations must be carefully considered in experimental designs using the viral tools presented here: variations in the extent (completeness) and specificity of labeling due to virus titer, virus delivery method, and animal age. We have noticed marked variation in the completeness and specificity of labeling at different titers of RO virus injection (Figure S6), decreased specificity at high multiplicity of infection in stereotaxic injection experiments (Figure S5), perturbations in transcriptomic state in stereotaxic experiments (Figure S5), and increased infectivity in younger animals (P28 vs P56, data not shown). As a reference, all results are summarized in Table S8 for the 35 enhancer viruses tested in the present study. It is imperative that any researcher using these viral tools perform experiments to select the appropriate conditions, while relying on our results for each virus as a general guide.
In experiments with the Ai213 conditional reporter line, the RO delivery of synapsin promoter- driven viruses, which should label all neurons, resulted in incomplete labeling and notable differences in recombination efficiency between recombinases (Figure 7C). The latter was expected as efficiency of recombination was reported to be highest for Cre and lowest for Nigri (Cre>Flp>Nigri) (Karimova et al., 2016). ICV delivery of pan-neuronal viruses to neonates improved the extent of labeling observed in the brain (Figure S8A–D) and therefore may be an alternative approach to consider when higher transduction efficiency and more complete labeling of a given cell class or type is needed. It is notable, however, that neither viral delivery method resulted in a majority of cells labeled by two or three fluorophores even when the same promoter (synapsin, in this case) was used to drive each of the three recombinases. At best, we found double labeling to be 33% for EGFP/mOrange2-positive cells and triple labeling to be ~15% of the total number of fluorescently labeled cells in sections analyzed (Figure 7D). This result cannot be attributed to partial transgene silencing because near perfect overlap of EGFP and mOrange2 fluorophores was observed in Ai213 triple transgenic animals with Cre and Flp expressed in all inhibitory neurons of the cortex (Figure S8E–F). Rather, it may be due to incomplete viral infection and may be improved by delivering more Flp and Nigri viruses relative to Cre virus to compensate for the differences in recombinase efficiency, as well as employment of virus serotypes with better BBB-penetration than PHP.eB that are likely to be discovered.
Combinatorial and cross-species studies
It is possible that viral tools have a potential to supersede germline transgenesis for labeling and perturbation of specific cell types. L5 PT cells can be labeled using retrograde tracing (Economo et al., 2018) or transgenic lines (Sorensen et al., 2015), though the latter may include off-target expression in other cell subclasses or types (Porrero et al., 2010; Tasic et al., 2016). Our mscRE4-viruses provide an alternative approach to highly specific labeling of L5 PT cells in the cortex, with the added flexibility provided by RO delivery of a virus. In addition, the mscRE4-FlpO virus labels L5 PT cells in human neocortical slices (Figure 8) and therefore may be portable for use across species as has been shown for other enhancer-based viral tools (Dimidschstein et al., 2016; Mich et al., 2019; Vormstein-Schneider et al., 2020).
To complement the quickly evolving landscape of viral drivers, we developed Ai213, the first triple-recombinase reporter contained in a single genomic locus. By using Ai213, we demonstrated that multiple enhancer viruses can be combined to label mutually exclusive cell classes in vivo without interfering with the function of one another. In addition, the use of Cre- and Flp-dependent fluorophores in Ai213 makes this line compatible with existing transgenic driver lines (as shown in Figure S8E–F), further expanding the possibilities for cell-type specific labeling by combination of well-characterized recombinase drivers and new viral tools. It is important to note that it may be possible to combine direct fluorophore-expressing enhancer viruses with wild-type mice to achieve similar results to Ai213. Although this approach may be desirable due to its simplicity, the main advantage of a transgenic reporter like Ai213 is that one can achieve high and consistent fluorophore expression across diverse, genetically defined cell types at varied sparseness. Similar transgenes in the future may enable conditional expression of different tools (e.g. opsins, calcium, and voltage reporters) at consistently high levels to monitor and perturb a diversity of cell types. The diversity of enhancer-driven viral reagents and compatibility with new and existing transgenic mouse lines opens new frontiers for the combinatorial exploration of brain cell types in mouse and beyond.
STAR Methods
RESOURCE AVAILABILITY
Lead Contact
Further information and requests for resources and reagents should be directed to and will be fulfilled by the Lead Contact, Bosiljka Tasic (bosiljkat@alleninstitute.org).
Materials Availability
Most plasmids generated in this study have been deposited to Addgene. The Ai213 transgenic line has been deposited to the Jackson Laboratory.
Data and Code Availability
Newly generated scATAC-seq and scRNA-seq data have been deposited to NeMO: https://assets.nemoarchive.org/dat-7qjdj84. Software code used for data analysis and visualization is available from GitHub at https://github.com/AllenInstitute/graybuck2019analysis/. An R package for analysis of low-coverage accessibility and transcriptomics (lowcat) is available on GitHub at https://github.com/AllenInstitute/lowcat/, and an R package for generating figures based on the Allen Institute Common Coordinate Framework (cocoframer) is available at https://github.com/AllenInstitute/cocoframer/.
EXPERIMENTAL MODEL AND SUBJECT DETAILS
Mouse breeding and husbandry
Adult mice were housed under Institutional Care and Use Committee protocols 1508, 1802, and 1806 at the Allen Institute for Brain Science, with no more than five animals per cage, maintained on a 12 h day/night cycle, with food and water provided ad libitum. Both male and female mice were used for experiments and the minimal number of animals were used for each experimental group. Animals with anophthalmia or microphthalmia were excluded from experiments. Animals were maintained on a C57BL/6J genetic background.
Primary single-cell preparation
Single-cell suspensions of cortical neurons were generated as described previously (Gray et al., 2017). In brief, donor mice were anesthetized using isoflurane, decapitated, and brains were immediately removed to ice-cold artificial cerebrospinal fluid (ACSF: 20 mM dextrose, 3 mM KCl, 126 mM NaCl, 20 mM NaHCO3, 1.25 mM NaH2PO4, 2 mM CaCl2, 2 mM MgCl2, 50 μM DL-AP5 sodium salt, 20 μM DNQX, and 0.1 μM tetrodotoxin bubbled with 95% O2/5% CO2 carbogen gas) with or without the addition of trehalose as indicated in Table S2. Where trehalose was used, we made a 132 mM trehalose stock solution by mixing 12.49 g trehalose dihydrate (Sigma-Aldrich Cat#T9531) with 250 mL of water. ACSF + trehalose solutions were made by mixing 50 mL of trehalose stock solution with 450 mL artificial cerebrospinal fluid (ACSF). When used, ACSF + trehalose was used in place of all ACSF solutions. A digestion solution was prepared by adding 4.17 mL ACSF (with or without trehalose) to a 125 U vial of papain (Worthington Biochemical PDS Kit Cat#LK003176) for a final concentration of 30 U/mL. Brains were sectioned to 400 μm-thick using a Leica VT1000S vibratome in a chilled chamber, and then held in ice-cold carbogen bubbled ACSF. Slices were microdissected in a Petri dish under ACSF using a fluorescence dissecting microscope. Tissue was transferred to a 1.5 mL microcentrifuge tube containing digestion solution for 30 min 32°C. After incubation, the digestion solution was exchanged twice with ACSF containing 1% fetal bovine serum (FBS). Cells were dissociated by trituration using Pasteur pipettes with polished openings of 600 μm-, 300 μm-, and 150 μm-diameter. Just before sorting, DAPI was added to cell suspensions at a final concentration of 2 ng/mL (DAPI*2HCl, Life Technologies Cat#D1306). We then sorted individual cells using FACS with gating of DAPI-negative and fluorophore-positive labeling (tdTomato, EGFP, or SYFP2) to select for live neuronal cells or DAPI-negative and fluorophore-negative labeling for live non-neuronal cells.
Cell culture single-cell preparation
For single cell ATAC (scATAC), GM12878 cells were obtained from Coriell Institute (Cat#GM12878), and were grown in T25 culture flasks in RPMI 1640 Medium (Gibco, Thermo Fisher Cat#11875093) supplemented with 10% fetal bovine serum (FBS; Hyclone Cat#SH30070.03) and 1% Penicillin Streptomycin (Life Technologies Cat#15140–122). At ~80% confluence, cells were transferred to a 15 mL conical tube, centrifuged, and washed with PBS containing 1% FBS. Cells were then resuspended in PBS with 1% FBS and 2 ng/mL DAPI for FACS sorting of DAPI-negative live cells.
Human slice culture
Human neurosurgical specimens were obtained from a 45-year-old female patient that underwent temporal cortex resection for the treatment of drug resistant temporal lobe. Upon surgical resection, human neurosurgical tissue was immediately placed in NMDG artificial cerebral spinal (ACSF) solution (containing (in mM): 92 NMDG, 2.5 KCl, 1.25 NaH2PO4, 30 NaHCO3, 20 HEPES, 25 glucose, 2 thiourea, 5 Na-ascorbate, 3 Na-pyruvate, 0.5 CaCl2·4H2O and 10 MgSO4·7H2O) and transported from the hospital to the Institute.
METHOD DETAILS
Retrograde Injections
We performed stereotaxic injection of CAV-Cre (gift of Miguel Chillon Rodrigues, Universitat Autònoma de Barcelona) (Hnasko et al., 2006) into brains of heterozygous or homozygous Ai14 mice using stereotaxic coordinates obtained from the Paxinos adult mouse brain atlas (Paxinos and Franklin, 2013). Specific coordinates used for each injection are provided in Table S3. tdTomato-positive single cells were isolated from VISp by FACS. Example FACS gating is provided in Figure S1.
Single cell ATAC-seq
Single cells were sorted by FACS into 200 μL 8-well strip tubes containing 1.5 μL tagmentation reaction mix (0.75 μL Tagment DNA Buffer (Illumina Cat# 15027866), 0.2 μL Nextera Tn5 Enzyme (Illumina TDE1, Cat# 15027865), 0.55 μL water). After collection, cells were briefly spun down in a bench-top centrifuge, then immediately tagmented at 37 °C for 30 minutes in a thermocycler. After tagmentation, we added 0.6 μL Proteinase K stop solution to each tube (5 mg/mL Proteinase K solution (Qiagen Cat#19131), 50 mM EDTA, 5 mM NaCl, 1.25% SDS) followed by incubation at 40°C for 30 minutes in a thermocycler. We then purified the tagmented DNA using Agencourt AMPure XP beads (Beckman Coulter Cat#A63881) at a ratio of 1.8:1 resuspended beads to reaction volume (3.8 μL added to 2.1 μL), with a final elution volume of 11 μL of Buffer EB (Qiagen Cat# 19086). Libraries were indexed and amplified by the addition of 15 μL 2X Kapa HiFi HotStart ReadyMix (Kapa Biosystems, Cat# KK2602) and 2 uL Nextera i5 and i7 indexes (Illumina Cat# FC-121–1012) to each tube, followed by incubation at 72°C for 3 minutes and PCR (95°C for 1 minute, 22 cycles of 98°C for 20 seconds, 65°C for 15 seconds, and 72°C for 15 seconds, then final extension at 72°C for 1 minute). After amplification, sample concentrations were measured using a Quant-iT PicoGreen assay (Thermo Fisher Cat#P7589) in duplicate. For each sample, the mean concentration was calculated by comparison to a standard curve, and the mean and standard deviation of concentrations was calculated for each batch of samples. Samples with a concentration greater than two standard deviations above the mean were not used for downstream steps, as these were found in early experiments to dominate sequencing runs. These cells have high, non-specific sequence diversity and low overlap with ENCODE peaks, suggesting that they have lost coherent chromatin structure. All other samples were pooled by combining 5 μL of each sample in a 1.5 mL-tube. We then purified the combined library by adding Ampure XP beads in a 1.8:1 ratio, with final elution in 50 μL of Buffer EB (Qiagen Cat# 19086). The mixed library was then quantified using a BioAnalyzer High Sensitivity DNA kit (Agilent Cat# 5067–4626) according to manufacturer’s instructions.
scATAC sequencing, alignment, and filtering
Mixed libraries, containing 60 to 96 samples, were sequenced on an Illumina MiSeq at a final quantity of 20–30 pmol in paired-end mode with 50 nt reads. After sequencing, raw FASTQ files were aligned to the GRCm38 (mm10) mouse genome using Bowtie v1.1.0 (Langmead et al., 2009) as described previously (Gray et al., 2017). After alignment, duplicate reads were removed using samtools rmdup (Li et al., 2009), which yielded only single copies of uniquely mapped paired reads in BAM format. For analysis, we removed samples with fewer than 10,000 paired-end fragments (20,000 reads) and with more than 10% of sequenced fragments longer than 250 bp. An additional filter was created using ENCODE whole cortex DNase-seq HotSpot peaks (sample ID ENCFF651EAU from experiment ID ENCSR00COF) (Yue et al., 2014). Samples with less than 25% of paired-end fragments that overlapped DNase-seq peaks were removed from downstream analysis. Cells passing these criteria had sufficient number of unique reads for downstream analysis, as well as high-quality chromatin accessibility profiles as assessed by fragment size analysis (Figure S2). As an additional QC check, we compared aggregate scATAC-seq data to bulk ATAC-seq data from matching Cre-driver lines, where available. We found that aggregate single-cell datasets matched well to previously published bulk datasets (Figure S6).
Jaccard distance calculation, PCA and tSNE embedding, and density-based clustering
To compare scATAC-seq samples, we downsampled all cells to an equal number of uniquely aligned fragments (10,000 per sample), extended these fragments to a total length of 1 kb centered on the middle of each fragment, then collapsed any overlapping fragments within each sample into regions based on the outer boundaries of overlapping fragments. We then counted the number of overlapping regions between every pair of samples and divided that number by the total number of regions in both samples to obtain a Jaccard similarity score. These scores were converted to Jaccard distances (1 − Jaccard similarity), and the resulting matrix was used as input for PCA, followed by t-distributed stochastic neighbor embedding (t-SNE). After t-SNE, samples were clustered in the t-SNE space using the RPhenograph package (Levine et al., 2015) with k = 6 to obtain small groups of similar neighbors (Levine et al., 2015). Phenograph cluster assignments used for correlation with transcriptomic data are shown in Table S6.
Correlation of scATAC-seq with scRNA-seq
Phenograph-defined neighborhoods were assigned to cell subclasses and clusters by comparison of accessibility near transcription start site (TSS) to median expression values of scRNA-seq clusters at the cell type level (e.g., L5 CF Chrna6) from mouse primary visual cortex (Tasic et al., 2018). To score each TSS, we retrieved TSS locations from the RefSeq Gene annotations provided by the UCSC Genome Browser database, and generated windows from TSS ± 20kb. We then counted the number of fragments for all samples within each cluster that overlapped these windows. For comparison, we selected differentially expressed marker genes from the Tasic et al. scRNA-seq dataset (Tasic et al., 2018) using the scrattch.hicat package for R. We then correlated the Phenograph cluster scores with the log-transformed median exon read count values for this set of marker genes for each scRNA-seq cluster from primary visual cortex and assigned the transcriptomic cell type with the highest-scoring correlation. We found that this strategy of neighbor assignment and correlation allowed us to resolve cell types within the scATAC-seq data close to the resolution of the scRNA-seq data, as types that were split too far would be assigned to the same transcriptomic subclass or type by correlation.
scATAC-seq grouping and peak calling
For downstream analysis, we grouped cell type assignments to the subclass level, except for highly distinct cell types (Lamp5 Lhx6, Sst Chodl, Pvalb Vipr2, L6 IT Car3, CR, and Meis2). Unique fragments for all cells within each of these subclass/distinct type groups were aggregated to BAM files for analysis. Aligned reads from single cell subclasses/clusters were used to create tag directories and peaks of chromatin accessibility were called using HOMER (Heinz et al., 2010) with settings “findPeaks -region -o auto”. The resulting peaks were converted to BED format.
Population ATAC of Sst neurons
We performed population ATAC-seq of neurons from Sst-IRES2-Cre/wt;Ai14/wt mice as described previously (Gray et al., 2017). Briefly, cells from the visual cortex of an adult mouse were microdissected and FACS-isolated into 8-well strips as described above, but with 500 cells per well instead of single cells as for scATAC-seq. Cell membranes were lysed by addition of 25 μL cell lysis buffer (10 mM Tris-HCl pH 7.4, 10 mM NaCl, 3 mM MgCl2, and 0.1% IGEPAL CA-630) to ~5 μL of FACS-sorted cells, and nuclei were pelleted before resuspension in the same tagmentation buffer described above at a higher volume (25 μL). Tagmentation was carried out at 37°C for 1 h, followed by addition of 5 μl of Cleanup Buffer (900 mM NaCl, 300 mM EDTA), 2 μl 5% SDS, and 2 μl Proteinase K and incubation at 40°C for 30 min., and cleanup with AMPure XP beads at a ratio of 1.8:1 beads to reaction volume. Samples were amplified using KAPA HotStart Ready Mix and 2 μl each of Nextera i5 and i7 primers (Illumina), quantified using a Bioanalyzer, and sequenced on an Illumina MiSeq in paired-end mode with 50 nt reads.
Comparisons to bulk ATAC-seq data
For comparison to previously published studies, we used data from GEO accession GSE63137 for Camk2a, Pvalb, and Vip neuron populations, and GEO accession GSE87548 (Gray et al., 2017) for Cux2, Scnn1a-Tg3, Rbp4, Ntsr1, Gad2, mES, and genomic controls. For these comparisons, we also included population ATAC-seq of Sst neurons, described above. For each population, we merged reads from all replicates and down-sampled each region to 6.4 million reads. We then called peaks using HOMER as described for aggregated scATAC-seq data, above. We used the BED-formatted peaks for scATAC-seq aggregates with or without bulk ATAC-seq datasets as input for comparisons using the DiffBind package for R as described previously (Gray et al., 2017). For all samples, bulk genomic DnA ATAC-seq was used as a background control from (Gray et al., 2017).
Identification of mouse single-cell regulatory elements
We performed a targeted search for mouse single cell regulatory elements (mscREs) by performing pairwise differential expression analysis of scRNA-seq clusters from (Tasic et al., 2018) to identify uniquely expressed genes in L5 PT, L5 IT, and L6 IT subclasses as well as the L6 IT Car3 cell type across all glutamatergic subclasses. We then searched for unique peaks within 1 Mbp of each marker gene, and manually inspected these peaks for low or no accessibility in off-target cell types and for conservation (phastCons scores, Siepel and Haussler, 2004). If a region of high conservation overlapped the peak region, but the peak was not centered on the highly conserved region, we adjusted the peak selection to include neighboring highly conserved sequence. For cloning, we centered our primer search on 500 bp regions centered at the middle of the selected peak regions, and we included up to 100 bp on either side for primer selection. Final region selections and PCR primers are provided in Table S6.
Recombinant viral genome construction
Enhancers were cloned from C57BL/6J mouse genomic DNA using enhancer-specific primers (Table S6) and Phusion high-fidelity polymerase (NEB Cat#M0530S). Individual enhancers were then inserted into an rAAV or scAAV backbone that contained a minimal beta-globin promoter or minimal CMV promoter, gene, a bovine growth hormone polyA (BGHpA), and a woodchuck post-transcriptional regulatory element (WPRE or WPRE3) using standard molecular cloning approaches. Viral genome construct details are available in Table S7. The 3xCore of the mscRE4 enhancer was created by custom gene synthesis and inserted into the rAAV backbone. For AAV vectors with the DLX enhancer, the DlX enhancer sequence was PCR amplified from human genomic DNA and cloned into the rAAV or scAAV backbone. To create rAAV-DLX-minBglobin-iCre-4X2C-WPRE-BGHpA, the 4X2C sequence (Sayeg et al., 2015) was generated by custom gene synthesis and inserted 3’ of the iCre cDNA sequence in rAAV-DLX-minBglobin-iCre-WPRE-BGHpA. All plasmid sequences were verified via Sanger sequencing and restriction digests were performed to confirm intact inverted terminal repeat (ITR) sites.
Viral packaging and titering
To generate purified rAAVs of the PHP.eB serotype, 105 μg of AAV viral genome plasmid, 190 μg of the pHelper plasmid (encodes adenoviral replication proteins; Agilent Cat#240071), and 105 μg of the pUCmini-iCAP-PHP.eB plasmid (encodes engineered PHP.eB capsid protein; Addgene Cat#103005) (Chan et al., 2017) were mixed with 5 mL of Opti-MEM I media with reduced serum and GlutaMAX (ThermoFisher Scientific Cat#51985034) and 1.1 mL of a solution of 1 mg/mL 25 kDa linear Polyethylenimine (PEI; Polysciences Cat#23966–1) in PBS at pH 4–5. This co-transfection mixture was incubated at room temperature for 10 minutes, then 0.61 mL of this co-transfection mixture was added to one 15-cm dish of ~70–80%% confluent HEK293T cells (ATCC Number CRL-3216). A total of ten, 15 cm plates of cells were transfected for a small-scale packaging run. 24 hours post-transfection, cell medium was replaced with DMEM containing high glucose, L-glutamine and sodium pyruvate (ThermoFisher Scientific Cat# 11995073) and supplemented with 4% fetal bovine serum (FBS;Hyclone Cat#SH30070.03) and 1% Antibiotic-Antimycotic solution (Thermo Fisher Cat#15240062). Cells were collected 72 hours post-transfection by manually scraping them from the culture dish into 5 mL of culture medium and were then pelleted by centrifugation at 1500 rpm at 4°C for 15 minutes. The cell pellet was resuspended in a buffer containing 150 mM NaCl, 10 mM Tris, and 10 mM MgCl2, pH 7.6, and was frozen in dry ice. Samples were thawed quickly in a 37°C water bath, then passed through a syringe with a 21–23 gauge needle 5 times, followed by 3 more freeze/thaw cycles, and a 30 minute incubation with 50 U/ml Benzonase nuclease (Sigma- Aldrich Cat#E8263) at 37°C to degrade DNA and RNA not contained within the viral particles.
The suspension was then centrifuged at 3,000 × g to remove cellular debris and the virus-containing supernatant was purified using a layered iodixanol step gradient (15%, 25%, 40%, and 60%) by centrifugation at 58,000 rpm in a Beckman 70Ti rotor for 90 minutes at 18°C. Following ultracentrifugation, the virus-containing layer at the 40–60% interface was collected and concentrated using an Amicon Ultra-15 centrifugal filter unit (100 kDa cutoff; EMD Millipore Cat#UFC910024) and by centrifugation at 3,000 rpm at 4°C. The concentrated virus was diluted in PBS containing 5% glycerol and 35 mM NaCl before storage at −80°C.
Crude lysate preps of rAAVs of the PHP.eB serotype were generated using a late harvest protocol similar to that found in (Jüttner et al., 2019). In brief, the same plasmids specified above were used at a ratio of 1:1:2 viral genome plasmid:serotype plasmid:helper plasmid to transfect one, 15 cm dish of HEK293T cells at ~70–80% conf. 24 hours post-transfection, the cell culture medium was changed from DMEM containing sodium pyruvate and supplemented with 10% FBS to DMEM containing sodium pyruvate and supplemented with 1% FBS to serum starve the cells. 120 hours post-transfection, the media and cells were harvested, subjected to three freeze/thaw rounds, incubated with Benzonase nuclease, and concentrated to ~150 μl using the Amicon Ultra-15 centrifugal filter unit. Virus titers were measured using qPCR or ddPCR. For qPCR, a primer pair that recognizes a region of 117 bp in the AAV2 ITRs (Forward: 5’-GGAACCCCTAGTGATGGAGTT-3’; Reverse: 5’-CGGCCTCAGTGAGCGA-3’) was utilized and reactions were performed using QuantiTect SYBR Green PCR Master Mix (Qiagen Cat#204145) and 500 nM of each primer. A positive control AAV with known titer and newly produced viruses with unknown titers were treated with DNase I (NEB Cat#M0303S) to degrade any plasmid DNA and serial dilutions (1/10, 1/100, 1/500, 1/2500, 1/12500, and 1/62500) were made and loaded onto the same qPCR plate. A standard curve of virus particle concentrations vs. quantitation cycle (Cq) values was generated from the positive control virus and the titers of the new viruses were calculated based on this standard curve. To measure virus titers by ddPCR, an instrument manufactured by Bio-Rad and the AAV2 ITR primer pair specified above and a FAM-labeled probe (5’ 6-FAM/CGCGCAGAG/ZEN/AGGGAGTGG/3’ IABkFQ) was utilized. Serial dilutions of AAV samples (2.50E-05, 2.50E-06, 2.50E-07, and 2.50E-08) were used for measurement to fit the dynamic linear range of the ddPCR assay. ddPCR reaction assembly, droplet generation, PCR amplification of the droplets, plate scanning and data analysis were conducted according to the manufacturer’s instructions. Virus concentration was calculated for each diluted sample within the dynamic linear range of ddPCR, and AAV titer was reported as the mean of the calculated concentrations.
Retro-orbital (RO) injections
We used 21 day-old (P21) or older C57BL/6J, Ai14, Ai65F, Ai63, or Ai213 mice (Daigle et al., 2018; Madisen et al., 2015; Madisen et al., 2010). Mice were briefly anesthetized using isoflurane, and 1×10¹⁰ to 1×10¹¹ viral genome copies (GC) were delivered into the RO sinus in a volume of 50 μL or less. This approach has been utilized previously to deliver AAVs across the blood-brain barrier and into the murine brain with high efficiency (Chan et al., 2017). For delivery of multiple viruses into one animal, the rAAVs were mixed beforehand and then delivered into the retro-orbital sinus in a total volume of 50 μL or less. Animals recovered the same day due to the minimally invasive nature of the procedure and were euthanized 1–3 weeks post-infection for analysis. For injection details, see Table S3.
Stereotaxic and intracerebroventricular (ICV) injections
Purified PHP.eB serotyped rAAVs were produced as described above for mscRE4-SYFP2 (titer = 1.34 × 10¹³ GC/ml), mscRE4-EGFP (1.64 × 10¹⁴ GC/ml), mscRE16-EGFP (1.94 × 10¹³ GC/ml), Syn-Cre (2.0 × 10¹³ GC/ml), Syn-FlpO (3.0 × 10¹³ GC/ml), or Syn-oNigri (2.4 × 10¹³ GC/ml). For stereotaxic injections, each virus was delivered bilaterally at 250 nl, 50 nl, or 25 nl volumes into the primary visual cortex (VISp; coordinates: A/P: −3.8, ML: −2.5, DV: 0.6) of C57BL/6J mice using a pressure injection system (Nanoject II, Drummond Scientific Company, Cat# 3–000-204). To mark the injection site, a DJ serotyped rAAV expressing dTomato from the EF1α promoter was co-injected at a dilution of 1:10 with the enhancer-driven fluorophore virus. For ICV injections, the three rAAVs (Syn-Cre, Syn-FlpO, and Syn-oNigri) were mixed together to yield a final concentration of 2.0 × 10¹⁰ GC of each virus and injected into the right cerebral ventricle of Ai213 heterozygous mice at P3. All mice were sacrificed 1–3 weeks post-injection; see Table S3 for a list of donors and injection details. To evaluate the extent of viral labeling in the brain, mice were transcardially perfused with PBS followed by 4% paraformaldehyde (PFA) and the dissected brains were subsequently post-fixed in 4% PFA overnight at 4°C followed by cryoprotection for 1–2 days in a 30% sucrose solution. 50 μm sections were prepared using a freezing microtome (Leica SM2000R) and epifluorescence or confocal images were acquired from mounted sections using a Nikon Eclipse Ti epifluorescence microscope or a Fluoview FV3000 series confocal laser scanning microscope. For scRNA-seq, virally infected, reporter-expressing cells were processed and analyzed as described below.
Immunohistochemistry
Mice were anesthetized with isoflurane and transcardially perfused with 0.1 M phosphate buffered saline (PBS) followed by 4% PFA. Brains were removed, post-fixed in 4% PFA overnight, followed by an additional incubation for 2–3 days in 30% sucrose. Coronal sections (50 μm) were cut using a freezing microtome (Leica SM2000R) and native fluorescence or antibody-enhanced fluorescence was analyzed in mounted sections. To enhance the EGFP fluorescence, a rabbit anti-GFP antibody was used to stain free floating brain sections. Briefly, sections were rinsed three times in PBS, blocked for 1 hour in PBS containing 5% goat serum (Sigma-Aldrich Cat#G9023–10ML), 2% bovine serum albumin (BSA; Sigma-Aldrich Cat#A9418–50G) and 0.2% Triton X-100 (Sigma-Aldrich Cat#X100–500ML), and incubated overnight at 4°C in the anti-GFP primary antibody (1:3000; Abcam Cat#ab6556). The following day, sections were washed three times in PBS and incubated in blocking solution containing an Alexa 488 conjugated secondary antibody (1:1500; Invitrogen Cat#A-11034), washed in PBS, and mounted in Vectashield containing DAPI (Vector Labs Cat#H-1500). Epifluorescence images of native or antibody-enhanced fluorescence were acquired on a Nikon Eclipse Ti microscope.
Single-cell RNA sequencing (scRNA-seq) and cell type mapping
scRNA-seq was performed using the SMART-Seq v4 kit (Takara Cat#634894) as described previously (Tasic et al., 2018). In brief, single cells were sorted into 8-well strips containing SMART-Seq lysis buffer with RNase inhibitor (0.17 U/uL; Takara Cat#ST0764), and were immediately frozen on dry ice for storage at −80°C. SMART-Seq reagents were used for reverse transcription and cDNA amplification. Samples were tagmented and indexed using a NexteraXT DNA Library Preparation kit (Illumina Cat#FC-131–1096) with NexteraXT Index Kit V2 Set A (Illumina Cat#FC-131–2001) according to manufacturer’s instructions except for decreases in volumes of all reagents, including cDNA, to 0.4x recommended volume. Full documentation for the scRNA-seq procedure is available in the ‘Documentation’ section of the Allen Institute data portal at http://celltypes.brain-map.org/. Samples were sequenced on an Illumina HiSeq 2500 as 50 bp paired-end reads. Reads were aligned to GRCm38 (mm10) using STAR v2.5.3 (Dobin et al., 2013) with the parameter “twopassMode,” and exonic read counts were quantified using the GenomicRanges package for R as described in Tasic et al. (Tasic et al., 2018). To determine the corresponding cell type for each scRNA-seq dataset, we utilized the scrattch.hicat package for R (Tasic et al., 2018). We selected marker genes that distinguished each cluster, then used this panel of genes in a bootstrapped centroid classifier which performed 100 rounds of correlation using 80% of the marker panel selected at random in each round. For plotting, we retained only cells that were assigned to the same cluster in ≥ 80 of 100 rounds. Mapping results and scRNA-seq sample metadata, including the most-frequently assigned cell type and the fraction of times each cell was assigned to that type, are included in Table S8.
Differential gene expression analysis
To identify changes in gene expression induced by our viral genetic tools, we performed pairwise differential gene expression tests between virally labeled cells and cells labeled by transgenic mouse driver and reporter lines. For each viral scRNA-seq experiment, we selected all cell types to which at least 10 cells were reliably mapped (above), then used the DE_genes_pw() function from the scrattch.hicat package (Tasic et al., 2018) to perform differential gene expression analysis. This function utilized the limma package for R (Ritchie et al., 2015, Tasic et al., 2018) to perform differential expression tests, along with some additional processing.
Comparisons to previous scATAC-seq studies
For comparisons to GM12878 datasets, raw data from Cusanovich et al. (Cusanovich et al., 2015) was downloaded from GEO accession GSE67446, Buenrostro et al. (Buenrostro et al., 2015) from GEO accession GSE65360, and Pliner et al. (Pliner et al., 2018) from GEO accession GSE109828. Processed 10x Genomics data was retrieved from the 10x Genomics website for the experiment “5k 1:1 mixture of fresh frozen human (GM12878) and mouse (A20) cells.” Buenrostro, Cusanovich, Pliner, and our own GM12878 samples were aligned to the hg38 human genome using the same bowtie pipeline described above for mouse samples to obtain per-cell fragment locations. 10x Genomics samples were analyzed using fragment locations provided by 10x Genomics aligned to hg19. For comparison to TSS regions, we used the RefSeq Genes tables provided by the UCSC Genome Browser database for hg19 (for 10x data) and for hg38 (for other datasets). To compare to ENCODE peaks, we used ENCODE GM12878 DNA-seq HotSpot results from ENCODE experiment ID ENCSR000EJD aligned to hg19 (ENCODE file ID ENCFF206HYT) or hg38 (ENCODE file ID ENCFF773SCF).
Electrophysiology
Brain slice preparation:
Human and mouse brain slices were prepared using the NMDG protective recovery method (Ting et al., 2014; Ting et al., 2018). The human slices were obtained from the left temporal lobe of a 45-year old female diagnosed with epilepsy. Mice were deeply anesthetized by intraperitoneal administration of avertin (20 mg/kg) and were perfused through the heart with an artificial cerebral spinal (ACSF) solution containing (in mM): 92 NMDG, 2.5 KCl, 1.25 NaH2PO4, 30 NaHCO3, 20 HEPES, 25 glucose, 2 thiourea, 5 Na-ascorbate, 3 Na-pyruvate, 0.5 CaCl2 · 4H2O and 10 MgSO4·7H2O. Slices (300 μm) were sectioned on a Compresstome VF-200 (Precisionary Instruments) using a zirconium ceramic blade (EF-INZ10, Cadence). Human brain slices were prepared under sterile conditions in a biosafety hood. Mouse brains were sectioned coronally, and human tissue was sectioned such that the angle of slicing was perpendicular to the pial surface. After sectioning, slices were transferred to a warmed (32–34°C) recovery chamber filled with NMDG ACSF under constant carbogenation. After 12 minutes, slices were transferred to a holding chamber containing an ACSF made of (in mM) 92 NaCl, 2.5 KCl, 1.25 NaH2PO4, 30 NaHCO3, 20 HEPES, 25 glucose, 2 thiourea, 5 Na-ascorbate, 3 Na-pyruvate,128 CaCl2·4H2O and 2 MgSO4·7H2O continuously bubbled with 95/5 O2/CO2. Mouse slices were held in this solution for use in acute recordings whereas human slices were transferred to a 6-well plate for long-term culture and viral transduction.
Human slice culture and viral transduction:
Human brain slices were placed on membrane inserts and wells were filled with culture medium consisting of 8.4 g/L MEM Eagle medium, 20% heat-inactivated horse serum, 30 mM HEPES, 13 mM D-glucose, 15 mM NaHCO3, 1 mM ascorbic acid, 2 mM MgSO4·7H2O, 1 mM CaCl2.4H2O, 0.5 mM GlutaMAX-I, and 1 mg/L insulin (Ting et al., 2018). The slice culture medium was carefully adjusted to pH 7.2–7.3, osmolality of 300–310 mOsmoles/Kg by addition of pure H2O, sterile-filtered and stored at 4°C for up to two weeks. Culture plates were placed in a humidified 5% CO2 incubator at 35°C and the slice culture medium was replaced every 2–3 days until end point analysis. 1–3 hours after brain slices were plated on cell culture inserts, brain slices were infected by direct application of concentrated AAV viral particles over the slice surface (Ting et al., 2018).
Patch clamp physiology and analysis:
For patch clamp recordings, slices were placed in a submerged, heated (32–34°C) recording chamber that was continually perfused with ACSF under constant carbogenation containing (in mM): 119 NaCl, 2.5 KCl, 1.25 NaH2PO4, 24 NaHCO3, 12.5 glucose, 2 CaCl2·4H2O and 2 MgSO4 7H2O (pH 7.3–7.4). Neurons were viewed with an Olympus BX51WI microscope and infrared differential contrast optics and a 40× water immersion objective. Patch pipettes (3–6 MΩ) were pulled from borosilicate glass using a horizontal pipette puller (P1000, Sutter Instruments). EGFP+ and/or SYFP+ neurons were identified using appropriate excitation/emission filter sets. The pipette solution for mouse experiments consisted of (in mM): 130 K-gluconate, 10 HEPES, 0.3 EGTA, 4 Mg-ATP, 0.3 Na2-GTP and 2 MgCl2 and 0.5% biocytin, pH 7.3. The pipette solution for human experiments was modified for patch-seq analysis and consisted of: 110 K-gluconate, 10.0 HEPES, 0.2 EGTA, 4 KCl, 0.3 Na2-GTP, 10 phosphocreatine disodium salt hydrate, 1 Mg-ATP, 20 μg/ml glycogen, 0.5U/μL RNAse inhibitor (Takara, 2313A) and 0.5% biocytin (Sigma B4261), pH 7.3. Electrical signals were acquired using a Multiclamp 700B amplifier and PClamp 10 data acquisition software (Molecular Devices). Signals were digitized (Axon Digidata 1550B) at 10–50 kHz and filtered at 2–10 kHz. Pipette capacitance was compensated and the bridge balanced throughout whole-cell current clamp recordings. Access resistance was 8–25 MΩ).
Data were analyzed using custom scripts written in Igor Pro (Wavemetrics). All measurements were made at resting membrane potential. Input resistance (RN) was calculated from the linear portion of the voltage-current relationship generated in response to a series of 1s current injections. The maximum and steady state voltage deflections were used to determine the maximum and steady state of RN, respectively. Voltage sag was defined as the ratio of maximum to steady-state RN. Resonance frequency (fR) was determined from the voltage response to a constant amplitude sinusoidal current injection that either linearly increased from 1–15 Hz over 15 s or increased logarithmically from .2–40 Hz over 20 s. Impedance amplitude profiles were constructed from the ratio of the fast Fourier transform of the voltage response to the fast Fourier transform of the current injection. fR corresponded to the frequency at which maximum impedance was measured. While the majority of neurons we included in this study were located in primary visual cortex (n=10 YFP+, 10 YFP−), we also made recordings from motor cortex (n=1 YFP+) and primary somatosensory cortex (n=4 YFP). For illustrative purposes, we also compared the properties of YFP+ and YFP− neurons to 32-L5 pyramidal neurons located in somatosensory cortex from an uninfected mouse. To classify these neurons as IT-like or PT-like, we used Ward’s method of clustering. Ih-related membrane properties are known to differentiate IT and PT neurons across many brain regions (Baker et al., 2018). As such, features included in clustering were restricted to the Ih- related membrane properties - sag ratio, Rn and fR.
Processing of patch-seq samples:
For experiments in human slice cultures, the nucleus was extracted into the recording pipette at the end of the whole cell recording for RNA-sequencing. Prior to data collection, all surfaces were thoroughly cleaned with RNase Zap. The contents of the pipette were expelled into a PCR tube containing lysis buffer. cDNA libraries were produced using the SMART-Seq v4 Ultra Low Input RNA kit for Sequencing according to the manufacturer’s instructions. These data were then used to map each cell to a reference cell type in a previously published transcriptomic cell type taxonomy (Hodge et al., 2020) using the same tree-based mapping approach used for mapping single cell RNA sequencing samples described above.
RNAscope
We RO injected mscRE4-FlpO or mscRE16-FlpO rAAVs into brains for Ai65F mice, as well as mscRE4-SYFP2 AAV into brains of wildtype mice. Mice were sacrificed two weeks post-injection. Fresh brains were dissected and immediately embedded in optimum cutting temperature compound (OCT; TissueTek Cat#4583). The OCT blocks were stored at −80°C until they were sectioned. Coronal sections (20 μm) were cut using a cryostat and collected on SuperFrost slides (ThermoFisher Scientific Cat#J3800AMNZ). RNA fluorescent in situ hybridization (FISH) with RNAscope HiPlex Assays (Advanced Cell Diagnostics Cat#324100) was performed according to the manufacturer’s instructions. All the probes were hybridized and amplified together, and the detection was performed in two rounds of up to three targets per round. Probes against Fam84b (ACD #500991-T1) were used to label L5 PT cells and probes against Rorb (ACD #444271-T3) were used to label L5 IT cells. We also used probes against Scnn1a (ACD #441391-T5) and Hsd11b1 (ACD #496231-T7) to further confirm delineation of L4 and L5 boundaries for analysis (data not shown). The SYFP2 protein from the virus and tdTomato protein from the Ai65F conditional reporter degrade in fresh frozen sections, making native fluorescence in the tissue undetectable. Therefore, probes against the SYFP2 mRNA (ACD #590291-T1) and tdTomato mRNA (ACD #317041-T2) were used instead. Mounted sections were imaged using a 40× objective on a Leica SP8 confocal microscope and maximum intensity projections of z-stacks (1-μm intervals, for the middle 6 stacks) were created from each round of imaging. Nuclei were labeled by DAPI prior to imaging and nuclear signal was used for registration across experimental rounds using the HiPlex Registration software (Advanced Cell Diagnostics). CellProfiler (http://www.cellprofiler.org) (Lamprecht et al., 2007) was used to segment DAPI stained nuclei and to identify spots from the FISH signal. The depth of each cell was assessed as the distance from the center of the nucleus to the pial surface in each image. To cover the spatial area occupied by mRNA of a cell, segmented DAPI borders were expanded by 20 pixels or until touching an adjacent border. Identified mRNA spots were assigned to a cell using the expanded nuclear border as the cell boundary. The number of detected mRNA spots per gene per cell and centroid coordinates of each segmented nucleus were used as input into R for plotting and quantification. Thresholds above background labeling were manually determined for each probe and tissue section and are provided in Table S7. Quantification was performed on whole depth or restricted to cortical L5. L5 was defined by examining the expression density of Fam84b throughout the cortical depth starting from pia, setting a depth threshold such that L5 began when at least two cells showed Fam84b expression and ended once fewer than three cells showed Fam84b expression. For mscRE4-pCMV and 3xCore-mscRE4-pCMV minimal promoter-SYFP2 viruses, on-target specificity was calculated as the percent of Fam84b+/SYFP2+ co-expressing cells out of SYFP2+ expressing cells, and on-target completeness was calculated as the percent of Fam84b+/SYFP2+ co-expressing cells out of Fam84b+ expressing cells. For the mscRE4-FlpO virus, on-target specificity was calculated as the percent of Fam84b+/tdTomato+ co-expressing cells out of tdTomato+ expressing cells, and on-target completeness was calculated as the percent of Fam84b+/tdTomato+ co-expressing cells out of Fam84b+ only and Fam84b+/tdTomato+ co-expressing cells. For the mscRE16-FlpO virus, on-target specificity was calculated as the percent of Rorb+/tdTomato+ co-expressing cells out of tdTomato+ expressing cells, and on-target completeness was calculated as the percent of Rorb+/tdTomato+ co-expressing cells out of Rorb+ only and Rorb+/tdTomato+ co-expressing cells.
Generation of the Ai213 transgenic line
To target multiple transgene expression units into the TIGRE locus (Zeng et al., 2008) we employed a recombinase-mediated cassette exchange (RMCE) strategy similar to that previously described (Madisen et al., 2015), but instead of using Flp recombinase for targeting, Bxb1 integrase (Zhu et al., 2014) was used to “free-up” Flp for transgene expression control. A new landing pad mouse embryonic stem (ES) cell line was generated by taking the 129S6B6F1 cell line, G4 (George et al., 2007), and engineering it to contain the components from 5’ to 3’ Bxb1 AttP-PhiC31 AttB-PGK promoter-gb2 promoter-Neomycin gene-pGK polyA-Bxb1 AttP-splice acceptor-3’ partial hygromycin gene-SV40 polyA-PhiC31 AttP within the TIGRE genomic region. Southern blot, qPCR, and junctional PCR analyses were performed on genomic DNA (gDNA) samples from modified ES cell clones to confirm proper targeting, copy number, and orientation of the components within the TIGRE locus. A Bxb1-compatible targeting vector with three independent and conditional expression units was then generated by standard molecular cloning techniques. The vector contained the following components from 5’ to 3’: gb2 promoter- Neo gene-Bxb1 AttB-partial GFP-2X HS4 Insulators-CAG promoter-LoxP-stop-LoxP-EGFP-WPRE-BGH polyA-2X HS4 Insulators-CAG promoter-FRT-stop-FRT-mOrange2-HA-WPRE-BGH polyA-PhiC31 AttB-WPRE-BGH polyA-2X HS4 Insulators-CAG-nox-stop-nox-mKate2-P2A-WPRE-PGK polyA-PhiC31 AttB-PGK promoter-5’ hygromycin gene-splice donor-Bxb1 AttB. The sequence and integrity of the targeting vector was confirmed by Sanger sequencing, restriction digests and in vitro testing performed in HEK293T cells. The targeting vector (30 μg of DNA) was then co-electroporated with a plasmid containing a mouse codon optimized Bxb1 gene under the control of the cytomegalovirus (CMV) promoter (100 μg of DNA) into the Bxb1-landing pad ES cell line and following hygromycin drug selection at 100–150 μg/ml for 5 days, monoclonal populations of cells were hand-picked and expanded. gDNA was prepared from the modified ES cell clones using a kit (Zymo Research Cat#D4071) and it was screened by qPCR and junctional PCR assays to confirm proper targeting into the TlGRE locus. Correctly targeted clones were injected into fertilized blastocysts at the University of Washington Transgenic Research Program (TRP) core to generate high percentage chimeras and then the chimeras were imported to the Institute, bred to C57BL/6J mice to produce F1 heterozygous reporter mice, and subsequently maintained in a C57BL/6J congenic background.
QUANTIFICATION AND STATISICAL ANALYSIS
Data analysis and visualization software
Analysis and visualization of scATAC-seq and transcriptomic datasets was performed using R v.3.5.0 and greater in the Rstudio IDE (Integrated Development Environment for R) or using the Rstudio Server Open Source Edition as well as the following packages: for general data analysis and manipulation, data.table (Dowle, 2019), dplyr (Wickham, 2018), Matrix (Bates, 2018), matrixStats (Bengtsson, 2018), purrr (Henry, 2019), and reshape2 (Wickham, 2007); for analysis of genomic data, GenomicAlignments (Lawrence et al., 2013), GenomicRanges (Lawrence et al., 2013), and rtracklayer (Lawrence et al., 2009); for plotting and visualization, cowplot (Wilke, 2018), ggbeeswarm (Clarke, 2017), ggExtra (Attali and Baker, 2019), ggplot2 (Wickham, 2016), and rgl (Adler, 2018); for clustering and dimensionality reduction, Rphenograph (Chen, 2015) and Rtsne (Krijthe, 2015); for analysis of transcriptomic datasets: scrattch.hicat and scrattch.io (Tasic et al., 2018); for taxonomic analysis and visualization, metacodeR (Foster, 2016) and taxa (Foster, 2018); and plater (Hughes, 2016) for management of plate-based experimental results and metadata.
Supplementary Material
Single-cell ATAC-seq mouse donor information, related to Figure 2. Information about 68 donor mice used for scATAC-seq experiments using cells labeled by transgenic drivers, reporters and/or viruses, with donor IDs, full genotypes, sex, birth date, age at euthanasia, final FACS gate used for sorting, the protease used for cell dissociation, and whether trehalose was included in dissociation and sorting buffers as described in STAR Methods.
Stereotaxic, retro-orbital, and intracerebroventricular injection donor metadata, related to Figures 2,4,5,6 and 7. Information about 14 stereotaxic and 64 retro-orbital injection experiments, with donor IDs, full genotypes, sex, age at injection, age at euthanasia, virus incubation time, injected material, injection target, Paxinos stereotaxic coordinates (Paxinos and Franklin, 2013), injection titers and volumes, and the experimental modalities for which each donor was used.
scATAC-seq sample information, related to Figure 2. Metadata for 3,602 scATAC-seq samples, including sample IDs, donor IDs corresponding to Table S1 or Table S2, dissected region, dissected cortical layer(s), dissection date, age at dissection, MiSeq batch, total sequenced reads, number of mapped reads, number of mapped fragments, percent of reads mapped to the mm10 genome, percent of mapped reads, percent of unmapped reads, number of unique reads, number of unique fragments (used for QC1), percent unique fragments, percent duplicate fragments, number of unique fragments overlapping ENCODE DNase-Seq peaks, fraction of unique fragments overlapping ENCODE DNase-Seq peaks (used for QC2), fraction of unique fragments with insert size > 250bp (used for QC3), and pass/fail flags for QC criteria.
scATAC-seq clustering, cell type mapping, and t-SNE embedding coordinates, related to Figure 2. Results for the 2,509 scATAC-seq samples passing QC criteria that were used for t-SNE embedding, Phenograph clustering, and mapping to scRNA-seq cell types, including scATAC-seq sample IDs corresponding to Table S3, group IDs, labels, and colors used for plots in figures, Phenograph cluster IDs and colors used for scRNA-seq correlation, correlation scores for the highest-scoring scRNA-seq cluster for each Phenograph cluster, cluster IDs, cluster labels, cluster colors used for plotting, and t-SNE embedding coordinates (tSNE1 and tSNE2).
mscRE genomic locations and cloning primers, related to Figure 3. Information about 16 putative regulatory elements that were cloned and tested, with region IDs, coordinates in the mm10 genome, targeted cell subclass/type populations, nearest gene, cloned genomic sequence length, and 5’ and 3’ primer sequences used for cloning.
scRNA-seq sample mapping, related to Figures 4 and 5. Metadata for 989 scRNA-seq samples labeled by enhancer-driven viruses by stereotaxic or retro-orbital injections, including experiment IDs, sample IDs, mapping results for cell type assignments based on Tasic et al. (Tasic et al., 2018) (mapping confidence, cluster IDs, cluster labels, cluster colors, class IDs, class labels, class colors, subclass IDs, subclass labels, and subclass colors), donor metadata (donor IDs, sex, and genotype), injection type (ro = retro-orbital; st = stereotaxic), injected virus, dissected hemisphere, dissected ROI, sorted FACS population, FACS container (an ID for each FACS strip), FACS well, RNA amplification set ID and library prep set ID (batches used during sample processing), number of PCR cycles, fraction of cDNA with length > 400 bp, RNA amplification pass/fail flag, ng of amplified cDNA, library multiplexing level, sequencing batch ID, pooled library tube ID, average final sequence length, sequencing sample quantification (quantification2_ng, quantification_fmol, quantification2_nM), library prep pass/fail flag, alignment statistics (total reads, percent of reads aligned to exons/rRNA/tRNA/introns/intergenic regions/E. coli/synthetic constructs, percent unique reads, percent aligned to any listed target), number of genes detected (including intronic reads = premRNA_genes_detected; including only exonic reads = mRNA_genes_detected).
RNAscope quantification, related to Figures 4 and 5. Counts, thresholds, and on/off-target criteria, counts, and percentages for each RNA ISH experiment. Probe channel, specificity, and cutoffs are shown in columns beginning with R[round number]C[channel number] (e.g. R1C1 Probe is the probe used in round 1, channel 1). Probes are described using fluorescence wavelength and target gene (e.g. 488 Fam84b corresponds to a probe for the Fam84b gene with 488 nm excitation). For mscRE4-pCMV and 3xCore-mscRE4-pCMV minimal promoter-SYFP2 viruses, on-target specificity was calculated as the percent of Fam84b+/SYFP2+ co-expressing cells out of SYFP2+ expressing cells, and on-target completeness was calculated as the percent of Fam84b+/SYFP2+ co-expressing cells out of Fam84b+ expressing cells. For the mscRE4-FlpO virus, on-target specificity was calculated as the percent of Fam84b+/tdTomato+ co-expressing cells out of tdTomato+ expressing cells, and on-target completeness was calculated as the percent of Fam84b+/tdTomato+ co-expressing cells out of Fam84b+ only and Fam84b+/tdTomato+ co-expressing cells. For the mscRE16-FlpO virus, on-target specificity was calculated as the percent of Rorb+/tdTomato+ co-expressing cells out of tdTomato+ expressing cells, and on-target completeness was calculated as the percent of Rorb+/tdTomato+ co-expressing cells out of Rorb+ only and Rorb+/tdTomato+ co-expressing cells.
Summary of results for enhancer viruses, related to Figures 4 and 5. A total of 35 enhancer viruses were generated and analyzed. Information was parcellated into four general groups: epifluorescence imaging, morphology, scRNA-seq, and RNAscope. The key describes the imaging results found throughout the manuscript: w, i, s = weak, intermediate, and strong fluorescence, respectively; *, **, *** = few, some, and many labeled cells, respectively, L5 = L5 cortical excitatory neurons; L6 = L6 cortical excitatory neurons; and M = cells in multiple cortical layers. Desired morphology indicated by Y(yes) = thick-tufted cortical L5 PT neuron with apical dendrite bifurcation in L2/3. scRNA-seq and RNAscope results are presented throughout the manuscript in river and violin plots, respectively. % on-target (or specificity) and % complete were calculated as described in STAR Methods. Shaded boxes = not tested.
Highlights.
High quality single-cell ATAC-seq dataset for adult mouse visual cortex
Enhancer AAVs targeting distinct subclasses of excitatory projection neurons
New TIGRE-based transgenic reporter line with three-color readout
Combined enhancer AAVs label up to three distinct cell populations in one brain
Acknowledgments:
We could not have performed this study without the support of the following Allen Institute teams and departments: Lab Animal Services, Transgenic Colony Management, Tissue Processing, FACS core, Molecular Biology, Molecular Genetics, and Human Cell Types. We thank Aaron Oster for Addgene reagent submission; Dr. Andrew Ko and Dr. C. Dirk Keene and associated teams at Harborview Medical Center (UW Medicine) for providing the human surgical tissue specimen in this study; Andrew Hill and Darren Cusanovich for assistance with data from Cusanovich and Hill et al. (Cusanovich et al., 2018) and Advanced Cell Diagnostics for early access to RNAscope HiPlex.
Funding: The project described was supported by award number R01DA036909 from the National Institute on Drug Abuse to B.T. and H.Z., by NIH BRAIN Initiative awards RF1MH121274 to B.T., T.L.D., and H.Z., and by RF1MH114126 to B.P.L, J.T., E.L, and B.T. from the National Institute of Mental Health. Its contents are solely the responsibility of the authors and do not necessarily represent the official views of the National Institutes of Health, the National Institute on Drug Abuse, or the National Institute of Mental Health. The authors thank the Allen Institute founder, Paul G. Allen, for his vision, encouragement, and support.
Footnotes
Declaration of interests: L.T.G., T.L.D., J.T.T., J.K.M., B.P.L., E.L., B.K., H.Z., and B.T. are inventors on several U.S. provisional patent applications related to this work. All authors declare no other competing interests.
Publisher's Disclaimer: This is a PDF file of an unedited manuscript that has been accepted for publication. As a service to our customers we are providing this early version of the manuscript. The manuscript will undergo copyediting, typesetting, and review of the resulting proof before it is published in its final form. Please note that during the production process errors may be discovered which could affect the content, and all legal disclaimers that apply to the journal pertain.
References
- Adler D, Murdoch D, et al. (2018). rgl: 3D Visualization Using OpenGL. [Google Scholar]
- Arnold CD, Gerlach C, Stelzer C, Boryri LM, Rath M, and Stark A (2013). Genome-Wide Quantitative Enhancer Activity Maps Identified by STARR-seq. Science 339, 1074–1077. [DOI] [PubMed] [Google Scholar]
- Attali D, and Baker C (2019). ggExtra: Add Marginal Histograms to “ggplot2”, and More “ggplot2” Enhancements. [Google Scholar]
- Attanasio C, Nord AS, Zhu Y, Blow MJ, Li Z, Liberton DK, Morrison H, Plajzer-Frick I, Holt A, Hosseini R, et al. (2013). Fine tuning of craniofacial morphology by distant-acting enhancers. Science 342, 1241006. [DOI] [PMC free article] [PubMed] [Google Scholar]
- Baker A, Kalmbach B, Morishima M, Kim J, Juavinett A, Li N, and Dembrow N (2018). Specialized Subpopulations of Deep-Layer Pyramidal Neurons in the Neocortex: Bridging Cellular Properties to Functional Consequences. J Neurosci 38, 5441–5455. [DOI] [PMC free article] [PubMed] [Google Scholar]
- Bates D, and Maechler M (2018). Matrix: Sparse and Dense Matrix Classes and Methods. [Google Scholar]
- Bengtsson H (2018). matrixStats: Functions that Apply to Rows and Columns of Matrices (and to Vectors). [Google Scholar]
- Blankvoort S, Witter MP, Noonan J, Cotney J, and Kentros C (2018). Marked Diversity of Unique Cortical Enhancers Enables Neuron-Specific Tools by Enhancer-Driven Gene Expression. Curr Biol 28, 2103–2114 e2105. [DOI] [PMC free article] [PubMed] [Google Scholar]
- Buenrostro JD, Wu B, Litzenburger UM, Ruff D, Gonzales ML, Snyder MP, Chang HY, and Greenleaf WJ (2015). Single-cell chromatin accessibility reveals principles of regulatory variation. Nature 523, 486–490. [DOI] [PMC free article] [PubMed] [Google Scholar]
- Chan KY, Jang MJ, Yoo BB, Greenbaum A, Ravi N, Wu WL, Sanchez-Guardado L, Lois C, Mazmanian SK, Deverman BE, and Gradinaru V (2017). Engineered AAVs for efficient noninvasive gene delivery to the central and peripheral nervous systems. Nat Neurosci 20, 1172–1179. [DOI] [PMC free article] [PubMed] [Google Scholar]
- Chen H (2015). Rphenograph: R implementation of the phenograph algorithm. [Google Scholar]
- Clarke E, and Sherrill-Mix S (2017). ggbeeswarm: Categorical scatter (Violin plots) Plots. [Google Scholar]
- Cusanovich DA, Daza R, Adey A, Pliner HA, Christiansen L, Gunderson KL, Steemers FJ, Trapnell C, and Shendure J (2015). Multiplex single cell profiling of chromatin accessibility by combinatorial cellular indexing. Science 348, 910–914. [DOI] [PMC free article] [PubMed] [Google Scholar]
- Cusanovich DA, Hill AJ, Aghamirzaie D, Daza RM, Pliner HA, Berletch JB, Filippova GN, Huang X, Christiansen L, DeWitt WS, et al. (2018). A Single-Cell Atlas of In Vivo Mammalian Chromatin Accessibility. Cell 174, 1309–1324.e1318. [DOI] [PMC free article] [PubMed] [Google Scholar]
- Daigle TL, Madisen L, Hage TA, Valley MT, Knoblich U, Larsen RS, Takeno MM, Huang L, Gu H, Larsen R, et al. (2018). A Suite of Transgenic Driver and Reporter Mouse Lines with Enhanced Brain-Cell-Type Targeting and Functionality. Cell 174, 465–480 e422. [DOI] [PMC free article] [PubMed] [Google Scholar]
- Dembrow NC, Chitwood RA, and Johnston D (2010). Projection-specific neuromodulation of medial prefrontal cortex neurons. J Neurosci 30, 16922–16937. [DOI] [PMC free article] [PubMed] [Google Scholar]
- Dickel DE, Ypsilanti AR, Pla R, Zhu Y, Barozzi I, Mannion BJ, Khin YS, Fukuda-Yuzawa Y, Plajzer-Frick I, Pickle CS, et al. (2018). Ultraconserved Enhancers Are Required for Normal Development. Cell 172, 491–499.e415. [DOI] [PMC free article] [PubMed] [Google Scholar]
- Dimidschstein J, Chen Q, Tremblay R, Rogers SL, Saldi G-A, Guo L, Xu Q, Liu R, Lu C, Chu J, et al. (2016). A viral strategy for targeting and manipulating interneurons across vertebrate species. Nature Neuroscience 19, 1743. [DOI] [PMC free article] [PubMed] [Google Scholar]
- Dobin A, Davis CA, Schlesinger F, Drenkow J, Zaleski C, Jha S, Batut P, Chaisson M, and Gingeras TR (2013). STAR: ultrafast universal RNA-seq aligner. Bioinformatics 29, 15–21. [DOI] [PMC free article] [PubMed] [Google Scholar]
- Dowle M, Srinivasan A (2019). data.table: Extension of ‘data.frame’. [Google Scholar]
- Economo MN, Viswanathan S, Tasic B, Bas E, Winnubst J, Menon V, Graybuck LT, Nguyen TN, Smith KA, Yao Z, et al. (2018). Distinct descending motor cortex pathways and their roles in movement. Nature 563, 79–84. [DOI] [PubMed] [Google Scholar]
- Foster Z, Chamberlain S, and Grunwald N (2018). Taxa: An R package implementing data standards and methods for taxonomic data. F1000Research 7. [DOI] [PMC free article] [PubMed] [Google Scholar]
- Foster ZSL, Sharpton T, Grunwald NJ (2016). MetacodeR: An R package for manipulation and heat tree visualization of community taxonomic data from metabarcoding. BioRxiv. [Google Scholar]
- George SH, Gertsenstein M, Vintersten K, Korets-Smith E, Murphy J, Stevens ME, Haigh JJ, and Nagy A (2007). Developmental and adult phenotyping directly from mutant embryonic stem cells. Proc Natl Acad Sci U S A 104, 4455–4460. [DOI] [PMC free article] [PubMed] [Google Scholar]
- Gong S, Doughty M, Harbaugh CR, Cummins A, Hatten ME, Heintz N, and Gerfen CR (2007). Targeting Cre recombinase to specific neuron populations with bacterial artificial chromosome constructs. J Neurosci 27, 9817–9823. [DOI] [PMC free article] [PubMed] [Google Scholar]
- Gray LT, Yao Z, Nguyen TN, Kim TK, Zeng H, and Tasic B (2017). Layer-specific chromatin accessibility landscapes reveal regulatory networks in adult mouse visual cortex. Elife 6. [DOI] [PMC free article] [PubMed] [Google Scholar]
- Harris JA, Mihalas S, Hirokawa KE, Whitesell JD, Choi H, Bernard A, Bohn P, Caldejon S, Casal L, Cho A, et al. (2019). Hierarchical organization of cortical and thalamic connectivity. Nature 575, 195–202. [DOI] [PMC free article] [PubMed] [Google Scholar]
- Hartl D, Krebs AR, Jüttner J, Roska B, and Schubeler D (2017). Cis-regulatory landscapes of four cell types of the retina. Nucleic Acids Res 45, 11607–11621. [DOI] [PMC free article] [PubMed] [Google Scholar]
- Heinz S, Benner C, Spann N, Bertolino E, Lin YC, Laslo P, Cheng JX, Murre C, Singh H, and Glass CK (2010). Simple combinations of lineage-determining transcription factors prime cis-regulatory elements required for macrophage and B cell identities. Mol Cell 38, 576–589. [DOI] [PMC free article] [PubMed] [Google Scholar]
- Henry L, and Wickham H (2019). purrr: Functional Programming Tools. [Google Scholar]
- Hnasko TS, Perez FA, Scouras AD, Stoll EA, Gale SD, Luquet S, Phillips PE, Kremer EJ, and Palmiter RD (2006). Cre recombinase-mediated restoration of nigrostriatal dopamine in dopamine-deficient mice reverses hypophagia and bradykinesia. Proc Natl Acad Sci U S A 103, 8858–8863. [DOI] [PMC free article] [PubMed] [Google Scholar]
- Hodge RD, Miller JA, Novotny M, Kalmbach BE, Ting JT, Bakken TE, Aevermann BD, Barkan ER, Berkowitz-Cerasano ML, Cobbs C, et al. (2020). Transcriptomic evidence that von Economo neurons are regionally specialized extratelencephalic-projecting excitatory neurons. Nat Commun 11, 1172. [DOI] [PMC free article] [PubMed] [Google Scholar]
- Hrvatin S, Tzeng CP, Nagy MA, Stroud H, Koutsioumpa C, Wilcox OF, Assad EG, Green J, Harvey CD, Griffith EC, and Greenberg ME (2019). A scalable platform for the development of cell-type-specific viral drivers. Elife 8. [DOI] [PMC free article] [PubMed] [Google Scholar]
- Hughes SM (2016). plater: Read, Tidy, and Display Data from Microtiter Plates. Journal of Open Source Software, 106. [Google Scholar]
- Jüttner J, Szabo A, Gross-Scherf B, Morikawa RK, Rompani SB, Hantz P, Szikra T, Esposti F, Cowan CS, Bharioke A, et al. (2019). Targeting neuronal and glial cell types with synthetic promoter AAVs in mice, non-human primates and humans. Nat Neurosci 22, 1345–1356. [DOI] [PubMed] [Google Scholar]
- Karimova M, Splith V, Karpinski J, Pisabarro MT, and Buchholz F (2016). Discovery of Nigri/nox and Panto/pox site-specific recombinase systems facilitates advanced genome engineering. Sci Rep 6, 30130. [DOI] [PMC free article] [PubMed] [Google Scholar]
- Kim JY, Grunke SD, Levites Y, Golde TE, and Jankowsky JL (2014). Intracerebroventricular viral injection of the neonatal mouse brain for persistent and widespread neuronal transduction. J Vis Exp, 51863. [DOI] [PMC free article] [PubMed] [Google Scholar]
- Kishi JY, Lapan SW, Beliveau BJ, West ER, Zhu A, Sasaki HM, Saka SK, Wang Y, Cepko CL, and Yin P (2019). SABER amplifies FISH: enhanced multiplexed imaging of RNA and DNA in cells and tissues. Nat Methods 16, 533–544. [DOI] [PMC free article] [PubMed] [Google Scholar]
- Klemm SL, Shipony Z, and Greenleaf WJ (2019). Chromatin accessibility and the regulatory epigenome. Nat Rev Genet 20, 207–220. [DOI] [PubMed] [Google Scholar]
- Krijthe JH (2015). {Rtsne}: T-Distributed Stochastic Neighbor Embedding using Barnes-Hut Implementation. [Google Scholar]
- Lamprecht MR, Sabatini DM, and Carpenter AE (2007). CellProfiler: free, versatile software for automated biological image analysis. Biotechniques 42, 71–75. [DOI] [PubMed] [Google Scholar]
- Langmead B, Trapnell C, Pop M, and Salzberg SL (2009). Ultrafast and memory-efficient alignment of short DNA sequences to the human genome. Genome Biol 10, R25. [DOI] [PMC free article] [PubMed] [Google Scholar]
- Lawrence M, Gentleman R, and Carey V (2009). rtracklayer: an R package for interfacing with genome browsers. Bioinformatics 25, 1841–1842. [DOI] [PMC free article] [PubMed] [Google Scholar]
- Lawrence M, Huber W, Pages H, Aboyoun P, Carlson M, Gentleman R, Morgan MT, and Carey VJ (2013). Software for computing and annotating genomic ranges. PLoS Comput Biol 9, e1003118. [DOI] [PMC free article] [PubMed] [Google Scholar]
- Lee JH, Daugharthy ER, Scheiman J, Kalhor R, Yang JL, Ferrante TC, Terry R, Jeanty SS, Li C, Amamoto R, et al. (2014). Highly multiplexed subcellular RNA sequencing in situ. Science 343, 1360–1363. [DOI] [PMC free article] [PubMed] [Google Scholar]
- Levine JH, Simonds EF, Bendall SC, Davis KL, Amir e.-A., Tadmor MD, Litvin O, Fienberg HG, Jager A, Zunder ER, et al. (2015). Data-Driven Phenotypic Dissection of AML Reveals Progenitor-like Cells that Correlate with Prognosis. Cell 162, 184–197. [DOI] [PMC free article] [PubMed] [Google Scholar]
- Li H, Handsaker B, Wysoker A, Fennell T, Ruan J, Homer N, Marth G, Abecasis G, Durbin R, and Genome Project Data Processing S (2009). The Sequence Alignment/Map format and SAMtools. Bioinformatics 25, 2078–2079. [DOI] [PMC free article] [PubMed] [Google Scholar]
- Madisen L, Garner AR, Shimaoka D, Chuong AS, Klapoetke NC, Li L, van der Bourg A, Niino Y, Egolf L, Monetti C, et al. (2015). Transgenic mice for intersectional targeting of neural sensors and effectors with high specificity and performance. Neuron 85, 942–958. [DOI] [PMC free article] [PubMed] [Google Scholar]
- Madisen L, Zwingman TA, Sunkin SM, Oh SW, Zariwala HA, Gu H, Ng LL, Palmiter RD, Hawrylycz MJ, Jones AR, et al. (2010). A robust and high-throughput Cre reporting and characterization system for the whole mouse brain. Nat Neurosci 13, 133–140. [DOI] [PMC free article] [PubMed] [Google Scholar]
- Mich JK, Hess EE, Graybuck LT, Somasundaram S, Miller JA, Ding Y, Shapovalova NV, Fong O, Yao S, Mortrud M, et al. (2019). Epigenetic landscape and AAV targeting of human neocortical cell classes. bioRxiv, 555318. [Google Scholar]
- Mo A, Mukamel EA, Davis FP, Luo C, Henry GL, Picard S, Urich MA, Nery JR, Sejnowski TJ, Lister R, et al. (2015). Epigenomic Signatures of Neuronal Diversity in the Mammalian Brain. Neuron 86, 1369–1384. [DOI] [PMC free article] [PubMed] [Google Scholar]
- Nair RR, Blankvoort S, Lagartos MJ, and Kentros C (2020). Enhancer-Driven Gene Expression (EDGE) Enables the Generation of Viral Vectors Specific to Neuronal Subtypes. iScience 23, 100888. [DOI] [PMC free article] [PubMed] [Google Scholar]
- Paxinos G, and Franklin KBJ (2013). Paxinos and Franklin’s the mouse brain in stereotaxic coordinates, 4th edn (Amsterdam: Elsevier/AP; ). [Google Scholar]
- Pfeiffer BD, Jenett A, Hammonds AS, Ngo TT, Misra S, Murphy C, Scully A, Carlson JW, Wan KH, Laverty TR, et al. (2008). Tools for neuroanatomy and neurogenetics in Drosophila. Proc Natl Acad Sci U S A 105, 9715–9720. [DOI] [PMC free article] [PubMed] [Google Scholar]
- Pliner HA, Packer JS, McFaline-Figueroa JL, Cusanovich DA, Daza RM, Aghamirzaie D, Srivatsan S, Qiu X, Jackson D, Minkina A, et al. (2018). Cicero Predicts cis-Regulatory DNA Interactions from Single-Cell Chromatin Accessibility Data. Molecular Cell 71, 858–871.e858. [DOI] [PMC free article] [PubMed] [Google Scholar]
- Porrero C, Rubio-Garrido P, Avendano C, and Clasca F (2010). Mapping of fluorescent protein-expressing neurons and axon pathways in adult and developing Thy1-eYFP-H transgenic mice. Brain Res 1345, 59–72. [DOI] [PubMed] [Google Scholar]
- Preissl S, Fang R, Huang H, Zhao Y, Raviram R, Gorkin DU, Zhang Y, Sos BC, Afzal V, Dickel DE, et al. (2018). Single-nucleus analysis of accessible chromatin in developing mouse forebrain reveals cell-type-specific transcriptional regulation. Nat Neurosci 21,432–439. [DOI] [PMC free article] [PubMed] [Google Scholar]
- Ritchie ME, Phipson B, Wu D, Hu Y, Law CW, Shi W, Smyth GK limma powers differential expression analyses for RNA-sequencing and microarray studies. Nucleic. Acids Res. 2015; 43: e47 10.1093/nar/gkv007 [DOI] [PMC free article] [PubMed] [Google Scholar]
- Saunders A, Macosko EZ, Wysoker A, Goldman M, Krienen FM, de Rivera H, Bien E, Baum M, Bortolin L, Wang S, et al. (2018). Molecular Diversity and Specializations among the Cells of the Adult Mouse Brain. Cell 174, 1015–1030 e1016. [DOI] [PMC free article] [PubMed] [Google Scholar]
- Sayeg MK, Weinberg BH, Cha SS, Goodloe M, Wong WW, and Han X (2015). Rationally Designed MicroRNA-Based Genetic Classifiers Target Specific Neurons in the Brain. ACS Synth Biol 4, 788–795. [DOI] [PMC free article] [PubMed] [Google Scholar]
- Shen SQ, Myers CA, Hughes AE, Byrne LC, Flannery JG, and Corbo JC (2016). Massively parallel cis-regulatory analysis in the mammalian central nervous system. Genome Res 26, 238–255. [DOI] [PMC free article] [PubMed] [Google Scholar]
- Siepel A, Bejerano G, Pedersen JS, Hinrichs AS, Hou M, Rosenbloom K, Clawson H, Spieth J, Hillier LW, Richards S, et al. (2005). Evolutionarily conserved elements in vertebrate, insect, worm, and yeast genomes. Genome Res 15, 1034–1050. [DOI] [PMC free article] [PubMed] [Google Scholar]
- Siepel A, Haussler D Computational identification of evolutionarily conserved exons. RECOMB ’04: Proceedings of the eighth annual international conference on Research in computational molecular biology. 2004; : 177–186 10.1145/974614.974638 [DOI] [Google Scholar]
- Sorensen SA, Bernard A, Menon V, Royall JJ, Glattfelder KJ, Desta T, Hirokawa K, Mortrud M, Miller JA, Zeng H, et al. (2015). Correlated gene expression and target specificity demonstrate excitatory projection neuron diversity. Cereb Cortex 25, 433–449. [DOI] [PubMed] [Google Scholar]
- Stark R, and Brown G (2011). DiffBind: differential binding analysis of ChIP-Seq peak data. [Google Scholar]
- Taniguchi H, He M, Wu P, Kim S, Paik R, Sugino K, Kvitsiani D, Fu Y, Lu J, Lin Y, et al. (2011). A resource of Cre driver lines for genetic targeting of GABAergic neurons in cerebral cortex. Neuron 71, 995–1013. [DOI] [PMC free article] [PubMed] [Google Scholar]
- Tasic B, Menon V, Nguyen TN, Kim TK, Jarsky T, Yao Z, Levi B, Gray LT, Sorensen SA, Dolbeare T, et al. (2016). Adult mouse cortical cell taxonomy revealed by single cell transcriptomics. Nat Neurosci 19, 335–346. [DOI] [PMC free article] [PubMed] [Google Scholar]
- Tasic B, Yao Z, Graybuck LT, Smith KA, Nguyen TN, Bertagnolli D, Goldy J, Garren E, Economo MN, Viswanathan S, et al. (2018). Shared and distinct transcriptomic cell types across neocortical areas. Nature 563, 72–78. [DOI] [PMC free article] [PubMed] [Google Scholar]
- Ting JT, Daigle TL, Chen Q, and Feng G (2014). Acute brain slice methods for adult and aging animals: application of targeted patch clamp analysis and optogenetics. Methods Mol Biol 1183, 221–242. [DOI] [PMC free article] [PubMed] [Google Scholar]
- Ting JT, Kalmbach B, Chong P, de Frates R, Keene CD, Gwinn RP, Cobbs C, Ko AL, Ojemann JG, Ellenbogen RG, et al. (2018). A robust ex vivo experimental platform for molecular-genetic dissection of adult human neocortical cell types and circuits. Sci Rep 8, 8407. [DOI] [PMC free article] [PubMed] [Google Scholar]
- Vormstein-Schneider D, Lin JD, Pelkey KA, Chittajallu R, Guo B, Arias-Garcia MA, Allaway K, Sakopoulos S, Schneider G, Stevenson O, et al. (2020). Viral manipulation of functionally distinct interneurons in mice, non-human primates and humans. Nature Neuroscience 23, 1629–1636. [DOI] [PMC free article] [PubMed] [Google Scholar]
- Wickham H (2007). Reshaping Data with the {reshape} Package. Journal of Statistics Software 21, 1–20. [Google Scholar]
- Wickham H (2016). ggplot2: Elegant Graphics for Data Analysis. Springer-Verlag New York. [Google Scholar]
- Wickham H, François R, Henry L, and Müller K (2018). dplyr: A Grammar of Data Manipulation. [Google Scholar]
- Wilke CO (2018). cowplot: Streamlined Plot Theme and Plot Annotations for “ggplot2.”. [Google Scholar]
- Yee SP, and Rigby PW (1993). The regulation of myogenin gene expression during the embryonic development of the mouse. Genes Dev 7, 1277–1289. [DOI] [PubMed] [Google Scholar]
- Yue F, Cheng Y, Breschi A, Vierstra J, Wu W, Ryba T, Sandstrom R, Ma Z, Davis C, Pope BD, et al. (2014). A comparative encyclopedia of DNA elements in the mouse genome. Nature 515, 355–364. [DOI] [PMC free article] [PubMed] [Google Scholar]
- Zeisel A, Hochgerner H, Lonnerberg P, Johnsson A, Memic F, van der Zwan J, Haring M, Braun E, Borm LE, La Manno G, et al. (2018). Molecular Architecture of the Mouse Nervous System. Cell 174, 999–1014 e1022. [DOI] [PMC free article] [PubMed] [Google Scholar]
- Zeng H, Horie K, Madisen L, Pavlova MN, Gragerova G, Rohde AD, Schimpf BA, Liang Y, Ojala E, Kramer F, et al. (2008). An inducible and reversible mouse genetic rescue system. PLoS Genet 4, e1000069. [DOI] [PMC free article] [PubMed] [Google Scholar]
- Zeng H, and Sanes JR (2017). Neuronal cell-type classification: challenges, opportunities and the path forward. Nat Rev Neurosci 18, 530–546. [DOI] [PubMed] [Google Scholar]
- Zhu F, Gamboa M, Farruggio AP, Hippenmeyer S, Tasic B, Schule B, Chen-Tsai Y, and Calos MP (2014). DICE, an efficient system for iterative genomic editing in human pluripotent stem cells. Nucleic Acids Res 42, e34. [DOI] [PMC free article] [PubMed] [Google Scholar]
Associated Data
This section collects any data citations, data availability statements, or supplementary materials included in this article.
Supplementary Materials
Single-cell ATAC-seq mouse donor information, related to Figure 2. Information about 68 donor mice used for scATAC-seq experiments using cells labeled by transgenic drivers, reporters and/or viruses, with donor IDs, full genotypes, sex, birth date, age at euthanasia, final FACS gate used for sorting, the protease used for cell dissociation, and whether trehalose was included in dissociation and sorting buffers as described in STAR Methods.
Stereotaxic, retro-orbital, and intracerebroventricular injection donor metadata, related to Figures 2,4,5,6 and 7. Information about 14 stereotaxic and 64 retro-orbital injection experiments, with donor IDs, full genotypes, sex, age at injection, age at euthanasia, virus incubation time, injected material, injection target, Paxinos stereotaxic coordinates (Paxinos and Franklin, 2013), injection titers and volumes, and the experimental modalities for which each donor was used.
scATAC-seq sample information, related to Figure 2. Metadata for 3,602 scATAC-seq samples, including sample IDs, donor IDs corresponding to Table S1 or Table S2, dissected region, dissected cortical layer(s), dissection date, age at dissection, MiSeq batch, total sequenced reads, number of mapped reads, number of mapped fragments, percent of reads mapped to the mm10 genome, percent of mapped reads, percent of unmapped reads, number of unique reads, number of unique fragments (used for QC1), percent unique fragments, percent duplicate fragments, number of unique fragments overlapping ENCODE DNase-Seq peaks, fraction of unique fragments overlapping ENCODE DNase-Seq peaks (used for QC2), fraction of unique fragments with insert size > 250bp (used for QC3), and pass/fail flags for QC criteria.
scATAC-seq clustering, cell type mapping, and t-SNE embedding coordinates, related to Figure 2. Results for the 2,509 scATAC-seq samples passing QC criteria that were used for t-SNE embedding, Phenograph clustering, and mapping to scRNA-seq cell types, including scATAC-seq sample IDs corresponding to Table S3, group IDs, labels, and colors used for plots in figures, Phenograph cluster IDs and colors used for scRNA-seq correlation, correlation scores for the highest-scoring scRNA-seq cluster for each Phenograph cluster, cluster IDs, cluster labels, cluster colors used for plotting, and t-SNE embedding coordinates (tSNE1 and tSNE2).
mscRE genomic locations and cloning primers, related to Figure 3. Information about 16 putative regulatory elements that were cloned and tested, with region IDs, coordinates in the mm10 genome, targeted cell subclass/type populations, nearest gene, cloned genomic sequence length, and 5’ and 3’ primer sequences used for cloning.
scRNA-seq sample mapping, related to Figures 4 and 5. Metadata for 989 scRNA-seq samples labeled by enhancer-driven viruses by stereotaxic or retro-orbital injections, including experiment IDs, sample IDs, mapping results for cell type assignments based on Tasic et al. (Tasic et al., 2018) (mapping confidence, cluster IDs, cluster labels, cluster colors, class IDs, class labels, class colors, subclass IDs, subclass labels, and subclass colors), donor metadata (donor IDs, sex, and genotype), injection type (ro = retro-orbital; st = stereotaxic), injected virus, dissected hemisphere, dissected ROI, sorted FACS population, FACS container (an ID for each FACS strip), FACS well, RNA amplification set ID and library prep set ID (batches used during sample processing), number of PCR cycles, fraction of cDNA with length > 400 bp, RNA amplification pass/fail flag, ng of amplified cDNA, library multiplexing level, sequencing batch ID, pooled library tube ID, average final sequence length, sequencing sample quantification (quantification2_ng, quantification_fmol, quantification2_nM), library prep pass/fail flag, alignment statistics (total reads, percent of reads aligned to exons/rRNA/tRNA/introns/intergenic regions/E. coli/synthetic constructs, percent unique reads, percent aligned to any listed target), number of genes detected (including intronic reads = premRNA_genes_detected; including only exonic reads = mRNA_genes_detected).
RNAscope quantification, related to Figures 4 and 5. Counts, thresholds, and on/off-target criteria, counts, and percentages for each RNA ISH experiment. Probe channel, specificity, and cutoffs are shown in columns beginning with R[round number]C[channel number] (e.g. R1C1 Probe is the probe used in round 1, channel 1). Probes are described using fluorescence wavelength and target gene (e.g. 488 Fam84b corresponds to a probe for the Fam84b gene with 488 nm excitation). For mscRE4-pCMV and 3xCore-mscRE4-pCMV minimal promoter-SYFP2 viruses, on-target specificity was calculated as the percent of Fam84b+/SYFP2+ co-expressing cells out of SYFP2+ expressing cells, and on-target completeness was calculated as the percent of Fam84b+/SYFP2+ co-expressing cells out of Fam84b+ expressing cells. For the mscRE4-FlpO virus, on-target specificity was calculated as the percent of Fam84b+/tdTomato+ co-expressing cells out of tdTomato+ expressing cells, and on-target completeness was calculated as the percent of Fam84b+/tdTomato+ co-expressing cells out of Fam84b+ only and Fam84b+/tdTomato+ co-expressing cells. For the mscRE16-FlpO virus, on-target specificity was calculated as the percent of Rorb+/tdTomato+ co-expressing cells out of tdTomato+ expressing cells, and on-target completeness was calculated as the percent of Rorb+/tdTomato+ co-expressing cells out of Rorb+ only and Rorb+/tdTomato+ co-expressing cells.
Summary of results for enhancer viruses, related to Figures 4 and 5. A total of 35 enhancer viruses were generated and analyzed. Information was parcellated into four general groups: epifluorescence imaging, morphology, scRNA-seq, and RNAscope. The key describes the imaging results found throughout the manuscript: w, i, s = weak, intermediate, and strong fluorescence, respectively; *, **, *** = few, some, and many labeled cells, respectively, L5 = L5 cortical excitatory neurons; L6 = L6 cortical excitatory neurons; and M = cells in multiple cortical layers. Desired morphology indicated by Y(yes) = thick-tufted cortical L5 PT neuron with apical dendrite bifurcation in L2/3. scRNA-seq and RNAscope results are presented throughout the manuscript in river and violin plots, respectively. % on-target (or specificity) and % complete were calculated as described in STAR Methods. Shaded boxes = not tested.
Data Availability Statement
Newly generated scATAC-seq and scRNA-seq data have been deposited to NeMO: https://assets.nemoarchive.org/dat-7qjdj84. Software code used for data analysis and visualization is available from GitHub at https://github.com/AllenInstitute/graybuck2019analysis/. An R package for analysis of low-coverage accessibility and transcriptomics (lowcat) is available on GitHub at https://github.com/AllenInstitute/lowcat/, and an R package for generating figures based on the Allen Institute Common Coordinate Framework (cocoframer) is available at https://github.com/AllenInstitute/cocoframer/.