Abstract
Background and Objectives
To determine whether CSF synaptic biomarkers are altered in the early preclinical stage of the Alzheimer continuum and associated with Alzheimer disease (AD) risk factors, primary pathology, and neurodegeneration markers.
Methods
This cross-sectional study was performed in the Alzheimer's and Families (ALFA+) cohort, comprising middle-aged cognitively unimpaired participants. CSF neurogranin and growth-associated protein-43 (GAP-43) were measured with immunoassays, and synaptosomal-associated protein-25 (SNAP-25) and synaptotagmin-1 were measured with immunoprecipitation mass spectrometry. AD CSF biomarkers β-amyloid (Aβ)42/40, phosphorylated tau (p-tau), and total tau and the neurodegeneration biomarker neurofilament light chain (NfL) were also measured. Participants underwent structural MRI and fluorodeoxyglucose and Aβ PET imaging. General linear modeling was used to test the associations between CSF synaptic biomarkers and risk factors, Aβ pathology, tau pathology, and neurodegeneration markers.
Results
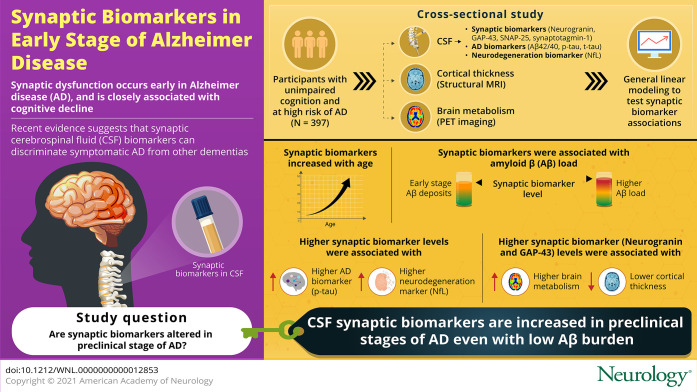
All CSF synaptic biomarkers increased with age. CSF neurogranin was higher in females, while CSF SNAP-25 was higher in APOE ε4 carriers. All CSF synaptic biomarkers increased with higher Aβ load (as measured by CSF Aβ42/40 and Aβ PET Centiloid values), and it is important to note that the synaptic biomarkers were increased even in individuals in the earliest stages of Aβ deposition. Higher CSF synaptic biomarkers were also associated with higher CSF p-tau and NfL. Higher CSF neurogranin and GAP-43 were significantly associated with higher brain metabolism but lower cortical thickness in AD-related brain regions.
Discussion
CSF synaptic biomarkers increase in the early preclinical stages of the Alzheimer continuum even when a low burden of Aβ pathology is present, and they differ in their association with age, sex, APOE ε4, and markers of neurodegeneration.
Trial Registration Information
ClinicalTrials.gov Identifier NCT02485730.
Synaptic dysfunction is an early process in Alzheimer disease (AD) pathogenesis,1,2 and pathologic studies have shown that synapse loss is closely related to cognitive decline.3 Therefore, it is crucial to further understand synaptic dysfunction occurring in early stages of AD.
Several synapse-specific proteins involved in distinct synaptic pathways can be measured in CSF. Among them, the most extensively studied include the postsynaptic protein neurogranin and presynaptic proteins synaptosomal-associated protein-25 (SNAP-25), growth-associated protein-43 (GAP-43) and synaptotagmin-1.4 There is clear evidence of an increase of these CSF synaptic biomarkers in symptomatic patients with AD (including prodromal AD and AD dementia).5-14 A recent study showed that these 4 CSF synaptic biomarkers accurately discriminate symptomatic AD from other dementias.6 However, less is known about the preclinical stage of the Alzheimer continuum.
Neurogranin is a postsynaptic protein highly expressed in the dendritic spines of hippocampus, amygdala, caudate, and putamen, and it is involved in calcium signaling regulation and synaptic plasticity.15 CSF neurogranin accurately differentiates individuals with AD, even in its prodromal phase, from healthy controls or individuals with other neurologic diseases.5,8,16 CSF neurogranin has also been investigated in the preclinical Alzheimer continuum but with conflicting results. Whereas some studies demonstrated a significant increase in individuals with preclinical AD compared with controls,17,18 others did not observe this finding.19-21
CSF SNAP-25, GAP-43, and synaptotagmin-1 have been less investigated, but most studies show that they also increase in symptomatic AD.6,9-11,14 SNAP-25 is a component of the SNAP receptor complex, which is located in the synaptic vesicles and is critical for the exocytosis process.22 Two studies investigated CSF SNAP-25 in preclinical AD and did not observe changes in this biomarker.19,23 GAP-43 is a presynaptic protein expressed mainly in the hippocampus, entorhinal cortex, neocortex, , and olfactory bulb, and it is involved in synaptogenesis in the adult brain.24 Two studies showed an increase of CSF GAP-43 in preclinical AD.25,26 Finally, synaptotagmin-1 is a calcium sensor protein located in the presynaptic plasma membrane and participates in synaptic vesicles exocytosis and neurotransmitter release.27 To the best of our knowledge, synaptotagmin-1 has not been investigated in preclinical AD.
Overall, previous evidence on CSF synaptic biomarkers in preclinical AD is scarce and unclear. Studying preclinical AD is hampered by the difficulty of recruiting individuals at this early stage of the disease. The main aim of this study was to determine whether CSF synaptic biomarkers are altered in individuals at the preclinical stage of the Alzheimer continuum. We hypothesize that synaptic biomarkers levels will be altered in this early stage. Moreover, we sought to determine whether these synaptic biomarkers differ in their association with AD risk factors and neurodegeneration biomarkers.
Methods
Study Participants
The Alzheimer's and Families (ALFA) study28 (45-65/FPM2012 study) includes 2,743 middle-aged (45–74 years old) cognitively unimpaired individuals enriched for family history of AD (47.4%) and APOE ε4 carriership (32.5%). The ALFA+ study is a nested longitudinal study that includes 450 participants who were invited to participate on the basis of their specific AD risk profile, determined by an algorithm in which participants' AD parental history and APOE status, verbal episodic memory score, and CAIDE (cardiovascular risk factors, aging and dementia) score were taken into consideration. A detailed phenotyping was performed in ALFA+ participants, including a lumbar puncture for the measurement of CSF biomarkers and imaging (MRI and PET) biomarkers acquisition.28 ALFA+ inclusion criteria were (1) previous participation in the ALFA study; (2) age between 45 and 65 years at inclusion in ALFA; and (3) long-term commitment to the study (i.e., inclusion and follow-up visits and all tests and study procedures [MRI, PET, and lumbar puncture]). ALFA+ exclusion criteria were (1) cognitive impairment (Clinical Dementia Rating score >0, Mini-Mental State Examination score <27 or semantic fluency <12); (2) any significant systemic illness or unstable medical condition that could lead to difficulty complying with the protocol; (3) any contraindication to any test or procedure; and (4) family history of monogenic AD. All participants included in the study were visited and examined (lumbar puncture, MRI and PET imaging acquisition) between 2016 and 2019. For the present study, we included the 397 first consecutive ALFA+ participants with available CSF biomarkers.
CSF β-amyloid (Aβ) status was defined by the CSF Aβ42/40 ratio, and participants were classified as CSF Aβ-positive (A+) if CSF Aβ42/40 < 0.071. Participants were defined as CSF tau-positive (T+) if CSF phosphorylated tau (p-tau) was >24 pg/mL.29 These cutoffs were previously derived with a 2-gaussian mixture modeling.29 Each cutoff was defined as the mean plus 2 SDs of the nonpathologic gaussian distribution.
To study very early changes in the continuum (when there are changes in soluble Aβ, as indicated by the CSF Aβ42/40 ratio, but not overt Aβ pathology, as indicated by Aβ PET), we defined the following 3 groups based on both CSF and PET Aβ status,30 referred herein as CSF/PET Aβ status groups: (1) CSF/PET Aβ-negative group (negative CSF Aβ42/40 and Aβ PET <30 Centiloids), (2) group with low burden of Aβ pathology (positive CSF Aβ42/40 but Aβ PET <30 Centiloids), and (3) CSF/PET Aβ-positive (positive CSF Aβ42/40 and Aβ PET  30 Centiloids).
CSF Collection, Processing, and Storage and Biomarker Measurements
CSF samples were obtained by lumbar puncture following standard procedures.29,31 Measurements of total tau (t-tau) and p-tau were performed with the electrochemiluminescence Elecsys Total-Tau CSF and Phospho-Tau(181P) CSF immunoassays on a fully automated COBAS E 601 module (Roche Diagnostics International Ltd, Rotkreuz, Switzerland). CSF Aβ40, Aβ42, neurogranin, and neurofilament light chain (NfL) were measured with the exploratory Roche NeuroToolKit assays, a panel of automated immunoassays (Roche Diagnostics International Ltd), on a COBAS E 411 analyzer.29
CSF SNAP-25 and synaptotagmin-1 concentrations were measured by immunoprecipitation mass spectrometry following a previously established protocol.6 In particular, the longer soluble forms of SNAP-25 including at least amino acids 32 through 40 (SNAP-25aa40) were evaluated herein. CSF GAP-43 was measured by ELISA as previously described.14
All the measurements were conducted at the Clinical Neurochemistry Laboratory, Sahlgrenska University Hospital, Mölndal, Sweden, on coded and randomized samples. All analyses were performed with the same batch of reagents by board-certified laboratory technicians (neurogranin and GAP-43) or by one of the authors (A. Brinkmalm) (SNAP-25 and synaptotagmin-1).
[18F]flutemetamol and [18F]fluorodeoxyglucose PET Acquisition and Quantification
Participants underwent [18F]flutemetamol (Aβ) and [18F]fluorodeoxyglucose (FDG) PET scans after a cranial CT scan for attenuation correction on a Biograph mCT scanner (Siemens Healthcare, Erlangen, Germany) at Hospital Clínic, Barcelona, Spain. For Aβ PET scans, participants received an IV bolus dose of 185 MBq (range 104.25–218.3 MBq, mean ± SD 191.75 ± 14.04 MBq), and 90 minutes after injection, PET data were acquired for 20 minutes (4 frames of 5 minutes each, mean ± SD 90.15 ± 7.36 minutes). FDG PET scans were acquired for 20 minutes (4 frames of 5 minutes each) 45 minutes after injection (mean ± SD 45.69 ± 4.67 minutes) of 185 MBq (range 181.3–222 MBq, mean ± SD 200.83 ± 12.83 MBq). PET images were reconstructed in 4 frames of 5 minutes using the 3-dimensional Ordered Subset Expectation Maximization algorithm by incorporating time of flight and point spread function modeling.
Aβ PET processing was performed following a validated Centiloid pipeline32 with SPM12.33 Centiloid values were calculated from the mean values of the standard Centiloid target region using the previously calibrated transformation.33
Quantification of FDG PET AD signature was performed by calculating the standardized uptake value ratio (SUVr) within a meta-region of interest (meta-ROI composite). We used the same methodology as that used in a previous study,34 determined by identifying regions cited frequently in FDG PET studies of patients with AD and mild cognitive impairment (MCI). This composite consists of 5 subregions, including right and left angular gyri, middle/inferior temporal gyrus, and bilateral posterior cingulate gyrus. To this end, images were normalized into standard Montreal Neurologic Institute space with the use of their corresponding MRI scans; the SPM12 algorithm and SUVr values were calculated as the ratio between the average FDG uptake in the meta-ROI voxels and those of the pons, as the reference region. SUVr values were calculated for the whole meta-ROI and for all of the individual regions.
MRI Scans Acquisition and Quantification
MRI scans were obtained with a 3T scanner (Ingenia CX, Philips, the Netherlands) at the neuroimaging unit at Barcelonaβeta Brain Research Center. The MRI protocol was identical for all participants and included a high-resolution 3-dimensional T1-weighted turbo field echo sequence (voxel size 0.75 × 0.75 × 0.75 mm3, repetition time/echo time 9.90/4.6 milliseconds, flip angle 8°).
T1-weighted images were automatically segmented, and cortical thickness was measured in the regions from the Desikan-Killiany cortical atlas using FreeSurfer version 6.0.35 Segmentation results were visually quality controlled by an expert. The cortical AD signature was then estimated for each participant from the thickness of the following areas: entorhinal, inferior temporal, middle temporal, and fusiform. The signature was calculated as the mean thickness across these regions weighted by their surface area, as previously proposed.36,37 Cortical thickness was calculated for the whole signature and for all the individual regions.
Quality Control and Visual Assessment of MRI and PET Scans
Quality control of the T1-weighted MRI and Aβ and FDG PET images and ROI placements was carried out by specialists. A trained radiologist validated the image quality of MRI scans and the incidental findings.38
Statistical Analysis
The normality of each biomarker distribution was assessed with visual inspection of the histogram and the Kolmogorov-Smirnov test. CSF p-tau, t-tau, NfL, neurogranin, SNAP-25, GAP-43, and synaptotagmin-1 did not follow a normal distribution and were log10-transformed. The correlation between the 4 CSF synaptic biomarkers was analyzed with the bivariate Spearman rank correlation coefficients test.
To assess the effect of demographic variables on CSF synaptic biomarkers, a linear regression model was performed with age, sex, years of education, and APOE ε4 status as predictors variables. Associations between CSF synaptic biomarkers and age, Aβ pathology (CSF Aβ42/40 or Aβ PET Centiloid) or tau pathology (CSF p-tau) were tested using linear regression models adjusted by age and sex. The interaction terms age × Aβ status and Aβ biomarker × Aβ status were also added to each model. Moreover, we conducted multivariate analyses with both Aβ pathology and CSF p-tau as predictors in the model.
One-way analysis of covariance adjusted for the effect of age and sex was performed to compare CSF synaptic biomarker levels between CSF/PET Aβ-negative, low-burden, and CSF/PET Aβ-positive groups. Significant comparisons were followed by Dunnett-corrected post hoc pairwise comparisons, with the CSF/PET Aβ-negative group as the reference group.
Last, we tested in a linear regression model the effect of CSF synaptic biomarkers on neurodegeneration biomarkers (CSF NfL and structural and functional neuroimaging variables), adjusting by age and sex. The interaction term between the neurodegeneration biomarkers and CSF Aβ status or, alternatively, CSF/PET Aβ status was also tested.
We performed stratified analyses within the Aβ status groups when significant interactions were identified. Yet, in the neuroimaging analyses, due to its exploratory nature and the fact that the expected effects were small, we performed stratified analyses regardless of the significance of interaction terms.
All tests were 2 tailed, with a significance level of α = 0.05. A false discovery rate (FDR) multiple-comparison correction was applied following the Benjamini-Hochberg procedure39 for all analyses. Statistical analyses were performed in IBM SPSS version 20.0 (IBM, Armonk, NY) statistical software and the open-source statistical software R (R Foundation for Statistical Computing, Vienna, Austria). Figures were built with R.
Standard Protocol Approvals, Registrations, and Patient Consents
The ALFA+ study (ALFA-FPM-0311) was approved by the Independent Ethics Committee “Parc de Salut Mar,” Barcelona, and registered at ClinicalTrials.gov (identifier: NCT02485730). All participants signed the study's informed consent form that had also been approved by the Independent Ethics Committee “Parc de Salut Mar,” Barcelona.
Data Availability
Due to participant privacy, individual-level data cannot be made publicly available. Researchers who wish to use data from the ALFA study must obtain approval from the ALFA study management team.
Results
Participants' Characteristics and Correlations Between CSF Synaptic Biomarkers
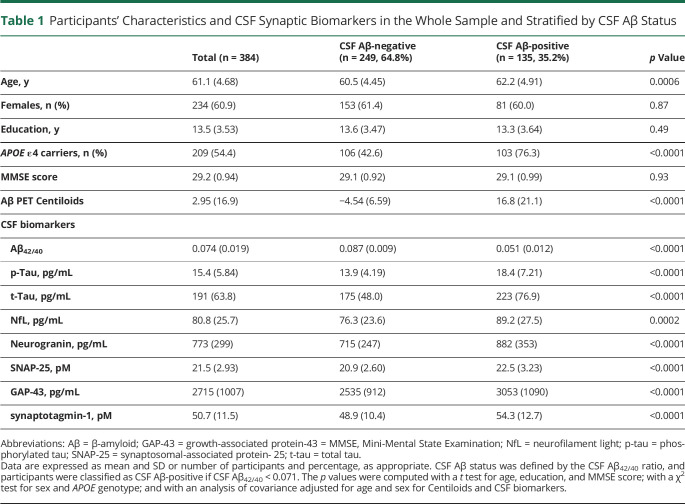
Three hundred ninety-seven ALFA+ participants with available CSF biomarkers were initially included in the study. Among the 397 participants, 13 participants who were CSF Aβ-negative but tau-positive (i.e., non-AD pathologic change) and therefore not within the Alzheimer continuum were excluded. Thus, 384 participants were finally included (Table 1). Among them, 327 (85.2%) participants had Aβ and FDG PET, and 365 (95.1%) had structural MRI with automatic segmentation available.
Table 1.
Participants' Characteristics and CSF Synaptic Biomarkers in the Whole Sample and Stratified by CSF Aβ Status
Participants' characteristics and CSF biomarker levels are summarized in Table 1. CSF Aβ-positive participants were older and showed a higher prevalence of APOE ε4 carriership. As expected, Aβ PET Centiloid values and all the CSF biomarkers were significantly higher (but the Aβ42/40 ratio lower) in the CSF Aβ-positive than in the CSF Aβ-negative group (Table 1). Still, the average Centiloid value for the CSF Aβ-positive group was only 16.8 Centiloids, thus reinforcing the notion that Aβ-positive individuals in this cohort show minimal Aβ deposition in the brain.
CSF synaptic biomarkers were strongly correlated in the whole sample, as well as in CSF Aβ-negative and Aβ-positive participants when examined separately (Spearman ρ = 0.66–0.92, p < 0.0001; eTable 1 and eFigure 1, doi.org/10.5061/dryad.vdncjsxv4).
Effect of Demographic Variables and Main AD Risk Factors on CSF Synaptic Biomarkers
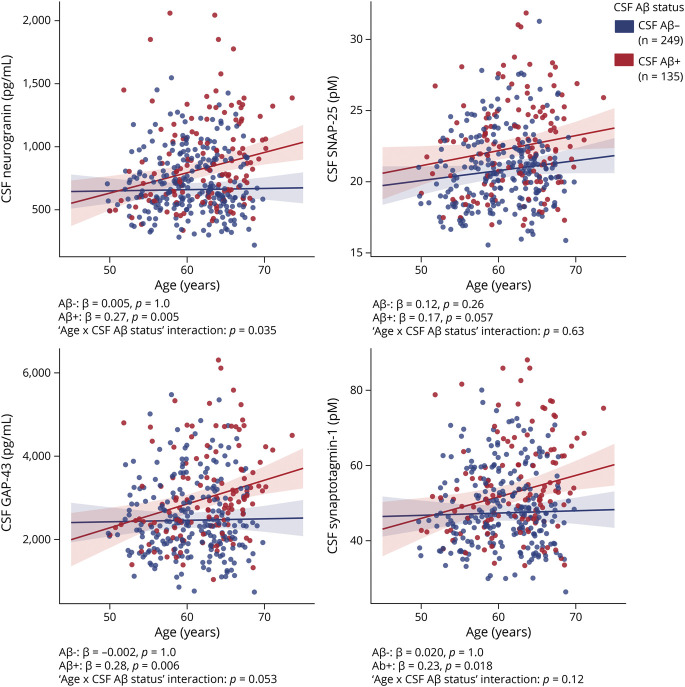
The effect of age, sex, APOE genotype, and years of education on the CSF synaptic biomarkers was tested. In the whole sample, CSF neurogranin, SNAP-25, GAP-43, and synaptotagmin-1 significantly increased with age (eTable 2, doi.org/10.5061/dryad.vdncjsxv4). This association was modified by CSF Aβ status for CSF neurogranin, and a trend toward the same direction was seen for CSF GAP-43 (as shown by the age × CSF Aβ status interaction term, Figure 1). In the stratified analyses, CSF neurogranin, GAP-43, and synaptotagmin-1 significantly increased with age only in CSF Aβ-positive participants. In contrast, CSF SNAP-25 showed a tendency to increase with age in the CSF Aβ-positive group but without reaching statistical significance (Figure 1).
Figure 1. Association of CSF Synaptic Biomarkers With Age.
Scatterplots representing the association of each of the CSF synaptic biomarkers with age in the CSF β-amyloid (Aβ)–negative (A−; blue) and the Aβ-positive (A+; red) groups. CSF Aβ status was defined by the CSF Aβ42/40 ratio and participants were classified as CSF Aβ-positive if CSF Aβ42/40 <0.071. Each point depicts the value of the CSF biomarker of an individual, and the solid lines indicate the regression line for each of the groups. The standardized regression coefficients (β) and p values are shown and were computed using a linear model adjusting for sex. In addition, the age × CSF Aβ status interaction term was computed. All p values are corrected for multiple comparisons with the false discovery rate approach. GAP-43 = growth-associated protein-43; SNAP-25 = synaptosomal-associated protein-25.
CSF neurogranin was higher in female than in male participants (p = 0.021), and CSF SNAP-25 was higher in APOE ε4 carriers than in noncarriers (p = 0.020). Education had a nominal effect on CSF synaptotagmin-1 (p = 0.035), although it did not survive multiple-comparison correction (eTable 2, doi.org/10.5061/dryad.vdncjsxv4).
Association With Aβ Pathology and Tau Pathology
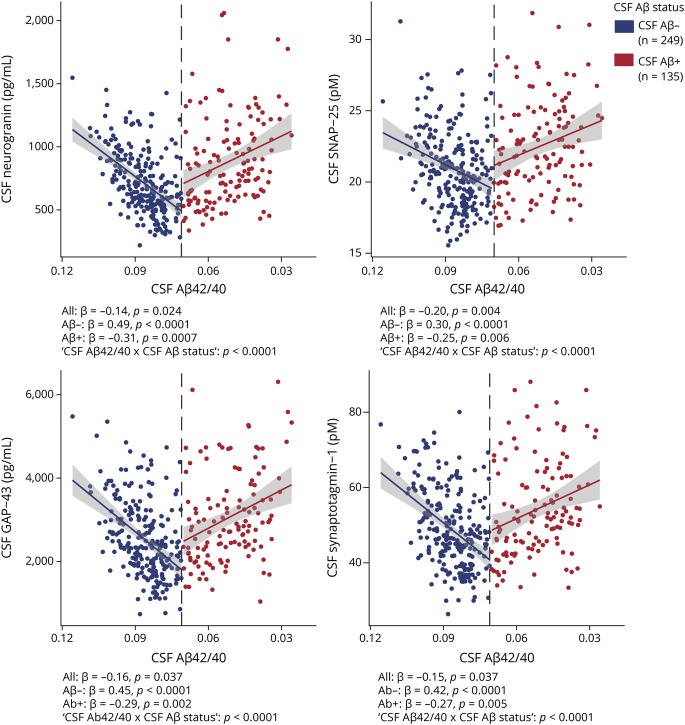
First, the CSF synaptic biomarkers association with Aβ pathology, as measured with CSF Aβ42/40, was analyzed. In the whole sample, higher levels of the 4 CSF synaptic biomarkers were significantly associated with higher Aβ pathology (i.e., lower CSF Aβ42/40; Figure 2). These associations were modified by CSF Aβ status (as shown by the significant CSF Aβ42/40 × CSF Aβ status interaction terms; Figure 2). When stratified by Aβ status according to CSF Aβ42/40 positivity, the 4 CSF synaptic biomarkers were positively associated with CSF Aβ42/40 in CSF Aβ-negative participants and negatively associated with CSF Aβ42/40 in CSF Aβ-positive participants (Figure 2). The 4 CSF synaptic biomarkers also significantly increased as a function of Aβ PET Centiloids (eFigure 2, doi.org/10.5061/dryad.vdncjsxv4).
Figure 2. Association of CSF Synaptic Biomarkers With CSF Aβ Pathology.
Scatterplots representing the association of each CSF synaptic biomarker with CSF β-amyloid (Aβ)42/40 in the CSF Aβ-negative (A−; blue) and Aβ-positive (A+; red) groups. Each point depicts the value of the CSF biomarker of an individual, and the solid lines indicate the regression line for each of the groups. The x-axis is reversed. The vertical dashed line indicates the cutoff for CSF Aβ42/40 positivity of 0.071. The standardized regression coefficients (β) and the p values for the total and stratified analyses are shown and were computed with a linear model adjusting for age and sex. In addition, the CSF Aβ42/40 × CSF Aβ status interaction term was computed. All p values are corrected for multiple comparisons with the false discovery rate approach. GAP-43 = growth-associated protein-43; SNAP-25 = synaptosomal-associated protein-25.
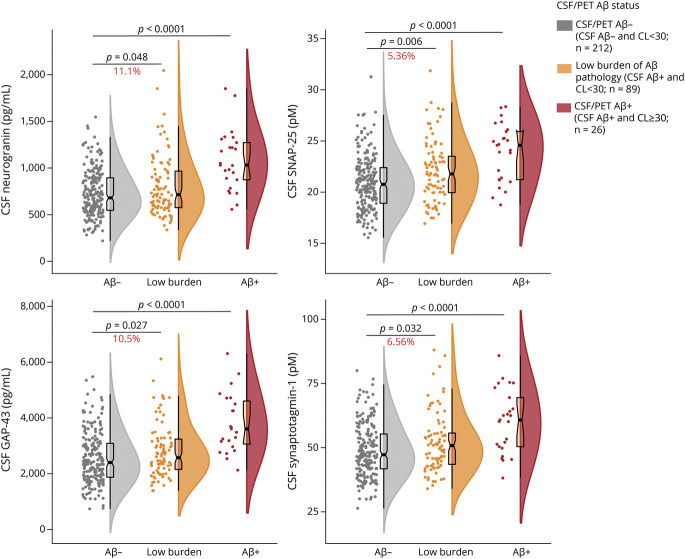
To test whether the CSF biomarkers are altered early in the Alzheimer continuum, their levels were evaluated in the group of participants with low burden of Aβ pathology (eTable 3 for demographics of the groups compared, doi.org/10.5061/dryad.vdncjsxv4). This group was defined using a combination of CSF and PET Aβ (CSF/PET Aβ status), namely those participants with a positive CSF Aβ42/40 but <30 Centiloids in Aβ PET. It is important to note that CSF neurogranin, SNAP-25, GAP-43, and synaptotagmin-1 were all significantly increased in the low-burden group (n = 89) and in the CSF/PET Aβ-positive group (n = 26) compared to the CSF/PET Aβ-negative group (n = 212; Figure 3).
Figure 3. CSF Synaptic Biomarkers by CSF/PET Aβ Status.
Boxplots depicting the median (horizontal bar), interquartile range (IQR; hinges), and 1.5 IQR (whiskers). Group differences were assessed by a 1-way analysis of covariance adjusted by age and sex, followed by Dunnett-corrected post hoc pair-wise comparisons. The percentage of change between the low-burden group and the CSF/PET β-amyloid (Aβ)–negative group is shown. eTable 3 (doi.org/10.5061/dryad.vdncjsxv4) shows the demographics of the 3 groups compared. All p values are corrected for multiple comparisons with the false discovery rate approach. GAP-43 = growth-associated protein-43; SNAP-25 = synaptosomal-associated protein-25.
Next, the association of CSF synaptic biomarkers with tau pathology, as measured by CSF p-tau, was analyzed. Similar to Aβ pathology results, higher levels of CSF synaptic biomarkers were significantly associated with increased CSF p-tau (CSF neurogranin: β = 0.94; CSF SNAP-25: β = 0.79; CSF GAP-43: β = 0.96; CSF synaptotagmin-1: β = 0.93; p < 0.0001 for all analyses). We additionally performed multivariate analyses including as predictors both Aβ pathology biomarkers (CSF Aβ42/40 or Aβ PET) and CSF p-tau. The main effect of CSF p-tau on the 4 CSF synaptic biomarkers remained significant when accounting for the effect of Aβ pathology biomarkers (p < 0.0001 for all analyses). In contrast, the significant increase of CSF synaptic biomarkers as a function of higher Aβ pathology was lost after accounting for CSF p-tau. These results suggest that the effect of Aβ pathology in the CSF synaptic biomarkers depends on tau pathology. Using CSF t-tau as a predictor instead of CSF p-tau yielded similar results.
Association With Neurodegeneration Biomarkers
Last, associations between CSF synaptic biomarkers and neurodegeneration biomarkers, including CSF NfL and brain metabolism and cortical thickness in specific AD-related brain regions, were studied.
The 4 CSF synaptic biomarkers were positively associated with CSF NfL (p < 0.0001 for all associations), and these associations were not modified by CSF or CSF/PET Aβ status, as shown by the not statistically significant CSF synaptic biomarker × CSF Aβ status or CSF synaptic biomarker × CSF/PET Aβ status interaction terms (eTable 4, doi.org/10.5061/dryad.vdncjsxv4).
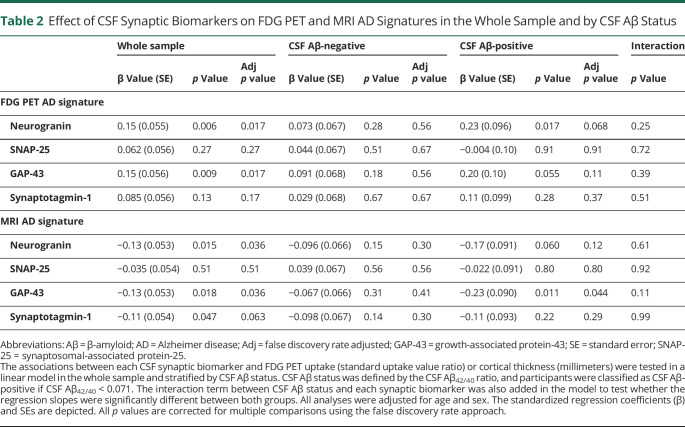
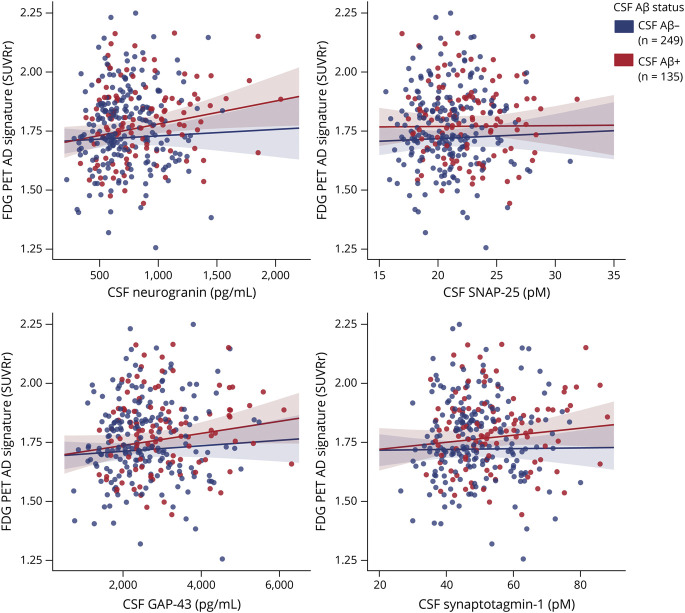
In relation to neuroimaging neurodegeneration outcomes, CSF neurogranin and GAP-43 were significantly and positively associated with brain metabolism in the FDG PET AD signature (Table 2 and Figure 4). These associations were not modified by CSF or CSF/PET Aβ status (Table 2 and eTable 5, doi.org/10.5061/dryad.vdncjsxv4). After stratifying by CSF Aβ status, a significant association for CSF neurogranin in the CSF Aβ-positive group and a trend for a significant result for GAP-43 was observed (Table 2). After stratifying by CSF/PET Aβ status, we observed the same result in the low-burden group but not in the CSF/PET Aβ-positive group (eTable 5 and eFigure 3). However, the results of the stratified analyses did not survive FDR multiple-comparison correction and should be interpreted cautiously.
Table 2.
Effect of CSF Synaptic Biomarkers on FDG PET and MRI AD Signatures in the Whole Sample and by CSF Aβ Status
Figure 4. Association of CSF Synaptic Biomarkers With FDG PET AD Signature.
Scatterplots representing the association of each of the CSF synaptic biomarker with FDG PET uptake (standardized uptake value ratio) Alzheimer disease (AD) signature in the CSF β-amyloid (Aβ)–negative (A−; blue) and the CSF Aβ-positive (A+; red) groups. CSF Aβ status was defined by the CSF Aβ42/40 ratio, and participants were classified as CSF Aβ-positive if CSF Aβ42/40 <0.071. Each point depicts the value of the CSF biomarker of an individual, and the solid lines indicate the regression line for each of the groups. The associations were computed with a linear model adjusted for age and sex. GAP-43 = growth-associated protein-43; SNAP-25 = synaptosomal-associated protein-25.
Analyses of the individual regions that compose the FDG PET AD signature in the whole sample showed that the positive association of CSF neurogranin and GAP-43 with brain metabolism occurred mainly in angular and temporal regions (eTable 6, doi.org/10.5061/dryad.vdncjsxv4).
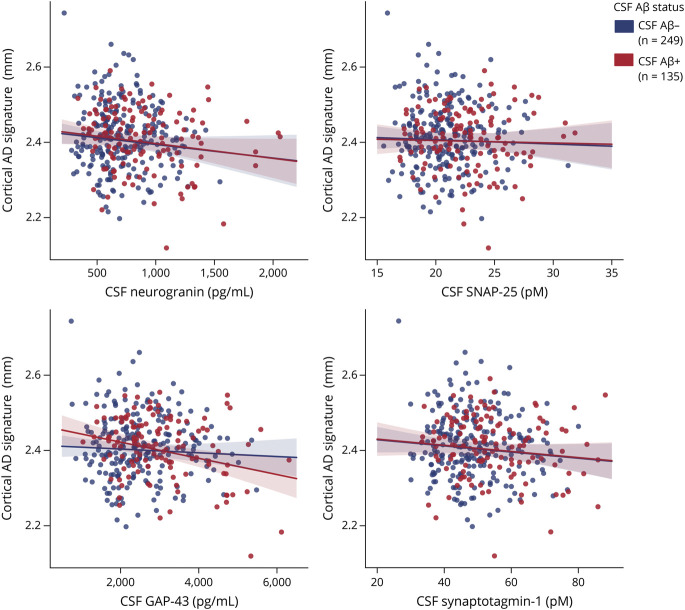
In the MRI AD signature analyses in the whole sample, higher CSF neurogranin and GAP-43 were associated with lower cortical thickness (Table 2 and Figure 5). Higher CSF synaptotagmin-1 was also nominally associated with lower cortical thickness (p = 0.047), but it did not survive FDR multiple-comparison correction. Similar to the FDG PET analyses, these associations were not modified by CSF Aβ status or CSF/PET Aβ status (Table 2 and eTable 7, doi.org/10.5061/dryad.vdncjsxv4). In the sample stratified by CSF Aβ status, the negative association with cortical thickness was significant in CSF Aβ-positive participants for CSF GAP-43, while a trend in the same direction was observed for CSF neurogranin (p = 0.060; Table 2 and Figure 5). After stratification by CSF/PET Aβ status, the same result was observed in the CSF/PET Aβ-positive group, although it did not survive FDR correction (eTable 7 and eFigure 4).
Figure 5. Association of CSF Synaptic Biomarkers With Cortical MRI AD Signature.
Scatter plots representing the association of each of the CSF synaptic biomarker with the cortical thickness (millimeters) Alzheimer disease (AD) signature in the CSF β-amyloid (Aβ)–negative (A−; blue) and the CSF Aβ-positive (A+; red) groups. CSF Aβ status was defined by the CSF Aβ42/40 ratio, and participants were classified as CSF Aβ-positive if CSF Aβ42/40 <0.071. Each point depicts the value of the CSF biomarker of an individual, and the solid lines indicate the regression line for each of the groups. The associations were computed with a linear model adjusted for age and sex. GAP-43 = growth-associated protein-43; SNAP-25 = synaptosomal-associated protein-25.
Individual region analyses showed that these significant negative associations between CSF neurogranin and GAP-43 and cortical thickness occurred in entorhinal and middle-temporal areas (eTable 8, doi.org/10.5061/dryad.vdncjsxv4).
Discussion
The aim of our study was to investigate CSF synaptic biomarkers in the preclinical stage of the Alzheimer continuum. First, synaptic biomarkers were found to be altered early in the Alzheimer continuum, as shown by their increase as a function of higher Aβ pathology and in individuals with low burden of Aβ pathology. Second, CSF neurogranin, SNAP-25, GAP-43, and synaptotagmin-1 had some specific features: CSF neurogranin was higher in females; APOE ε4 genotype had an effect on SNAP-25; and CSF neurogranin and GAP-43 were associated with changes in brain metabolism and structure.
Despite the evidences of altered CSF synaptic biomarkers in symptomatic AD, studies in the preclinical stage of the Alzheimer continuum are sparse and generally include reduced numbers of participants. We demonstrate that CSF neurogranin, SNAP-25, GAP-43, and synaptotagmin-1 are increased during this stage. These results are consistent with those that previously showed an increased in CSF neurogranin and CSF GAP-43 in preclinical AD.17,18,25,26 Yet, other studies could not find a significant increase in CSF neurogranin19-21 or SNAP-2519,23 at this stage. This may be explained by a lack of power because these studies included relatively few individuals with preclinical AD (< 50), whereas 135 individuals were included in this study. Recently, a study in BioFINDER showed that CSF neurogranin, SNAP-25, and GAP-43 significantly increased in A+T− individuals compared to A−T−, also suggesting an early increase of CSF synaptic biomarkers.40 The current study differs in the fact that all individuals included were cognitively unimpaired, and therefore, the preclinical stage of the Alzheimer continuum could be specifically studied. Moreover, the CSF presynaptic protein synaptotagmin-1 was also analyzed.
CSF synaptic biomarkers are associated with Aβ pathology in symptomatic individuals.14,16,17,20,41 In preclinical AD, CSF neurogranin correlates with mean cortical binding potential on Aβ PET in Aβ-positive, cognitively normal controls.42 In the BioFINDER cohort, CSF neurogranin, but not CSF SNAP-25 or GAP-43, was associated with Aβ PET in A−T− and A+T− individuals.40 In the current study, the association between 4 different CSF synaptic biomarkers and Aβ pathology (as measured by CSF Aβ42/40 and Aβ PET) was confirmed in a larger cohort of individuals with preclinical AD. This association appeared to be driven mainly by the presence of tau pathology because the effect of Aβ was lost when accounting for CSF p-tau. It is important to note that all CSF synaptic biomarkers were increased among participants with a low burden of Aβ pathology. In other words, as soon as there are changes in soluble Aβ and p-tau and before there is overt Aβ pathology, there are observable changes in CSF synaptic biomarkers. These results suggest a very early role of synaptic dysfunction in AD pathogenesis.
An important unanswered question is whether the different CSF synaptic biomarkers reflect different mechanistic aspects of synaptic dysfunction in AD and neurodegeneration. This is an important question because, if they all provide similar information on the mechanisms of the disease, it would be reasonable to choose only one as a routine CSF synaptic biomarker. It is beyond the scope of this observational study to investigate possible differences on the mechanistic information that each biomarker provides. Nonetheless, this study assessed whether these CSF synaptic biomarkers differ in their association with age, sex, and APOE ε4 and neurodegeneration biomarkers. CSF neurogranin, GAP-43, and synaptotagmin-1, but not SNAP-25, significantly increased throughout age in the Aβ-positive group. Sex differences were observed only in CSF neurogranin, with female patients having higher levels than male patients. Higher levels of CSF neurogranin in females have been previously found.17,20,43 CSF neurogranin was also found to be associated with AD-related atrophy only in female participants.44 Whether these findings reflect a higher susceptibility to dendritic dysfunction in female patients needs further investigation. CSF SNAP-25 was higher in APOE ε4 carriers, a result that had previously been reported in patients with MCI and dementia6,41 but not in cognitively normal individuals. We should note that all CSF synaptic biomarkers were strongly associated with the neurodegeneration biomarker CSF NfL, regardless of Aβ status, which suggests that these CSF synaptic biomarkers also may be affected by other factors that need to be studied further (e.g., vascular factors, copathology, other sources of neuronal injury).
Last, our study assessed whether CSF synaptic biomarkers were associated with imaging biomarkers of neurodegeneration, namely FDG PET uptake and cortical thickness in AD-specific areas. Both CSF neurogranin and GAP-43 were positively associated with brain glucose metabolism and negatively associated with cortical thickness in the studied AD signatures. Previous studies have shown that baseline CSF neurogranin levels predict a longitudinal decrease in FDG PET brain metabolism in patients with MCI and AD21 and, in a more recent study, in cognitively unimpaired individuals.17 In our cross-sectional study, the association between CSF neurogranin and GAP-43 and brain glucose metabolism may reflect synaptic dysfunction in very initial stages of the disease, when there may be brain metabolic increases in response to early Aβ pathology. In fact, there is a trend suggesting that these associations are driven by Aβ-positive participants, although the analysis did not survive multiple-comparison correction. Despite the fact that AD is typically characterized by glucose hypometabolism, previous studies have found an hypermetabolism in some brain areas in Aβ-positive individuals in early stages of the disease.45-47 It may be argued that the CSF neurogranin and GAP-43 association with glucose hypermetabolism found herein reflects this early stage. In contrast to FDG PET brain metabolism, higher levels CSF neurogranin and GAP-43 were associated with lower cortical thickness in the AD signature meta-composite. Previous literature showed that higher CSF neurogranin levels were associated with brain atrophy in symptomatic AD.21,42 In preclinical AD, CSF neurogranin levels were associated with cortical thinning in the left caudal middle frontal gyrus and right precuneus.48 As far as we know, no earlier studies have assessed the association of CSF GAP-43, SNAP-25, or synaptotagmin-1 with brain metabolism or structure in preclinical AD. The fact that CSF neurogranin and GAP-43 are the 2 biomarkers significantly associated with brain FDG PET and cortical thickness measures might suggest that they reflect synaptic dysfunction more closely related to brain metabolic and structural changes.
Our results also have some practical implications in the design of therapeutic interventions in preclinical stages of the disease. The CSF synaptic biomarkers could potentially be used to measure target engagement in clinical trials testing drugs that target synaptic dysfunction, assess safety (whether drugs cause synaptic toxicity), or, considering their association with markers of neurodegeneration, as a secondary outcome measure. However, to determine whether CSF synaptic biomarkers are also useful to stage the disease, studies that include the whole continuum of the disease are needed. Longitudinal studies also are needed to determine whether they have prognostic value.
These findings should be considered in light of some limitations. First, this is a cross-sectional study, and thus no statement can be made regarding biomarker trajectories over time. Second, other CSF synaptic biomarkers were not included (e.g., Synaptic Vesicle Glycoprotein 2, Neuronal Pentraxin 2). Third, PET measures of tau pathology (tau PET) or synaptic density (e.g., Synaptic Vesicle Glycoprotein 2 PET) were not available.
Nevertheless, this study has significant strengths. First, 4 different CSF synaptic biomarkers were analyzed in the same cohort, while most reports include single biomarkers. Second, a very well characterized cohort of cognitively unimpaired individuals was studied, of whom 135 were Aβ-positive and therefore fall into in the preclinical stage of the Alzheimer continuum. This is in striking contrast to previous studies, which include a smaller number of individuals with preclinical AD. Third, this is a multimodal study in which the associations of CSF synaptic biomarkers with biomarkers of Aβ pathology and with FDG PET brain metabolism and structural MRI AD signatures were assessed.
Overall, these results suggest that the 4 CSF synaptic biomarkers studied are increased early in the preclinical stage of the Alzheimer continuum and might reflect different aspects of synaptic dysfunction at this stage, differentially associating with AD risk factors, pathology, and neurodegeneration outcomes. These biomarkers should be considered in both observational and interventional future studies in preclinical AD.
Acknowledgment
COBAS, COBAS E, and ELECSYS are trademarks of Roche. The exploratory Roche NeuroToolKit assays are a panel of automated robust prototype immunoassays and are for research purposes only.
Glossary
- Aβ
β-amyloid
- AD
Alzheimer disease
- ALFA
Alzheimer's and Families
- CAIDE
cardiovascular risk factors, aging and dementia
- FDG
[18F]fluorodeoxyglucose
- FDR
false discovery rate
- GAP-43
growth-associated protein-43
- MCI
mild cognitive impairment
- NfL
neurofilament light chain
- p-tau
phosphorylated tau
- ROI
region of interest
- SNAP-25
synaptosomal-associated protein-25
- SUVr
standardized uptake value ratio
Appendix 1. Authors

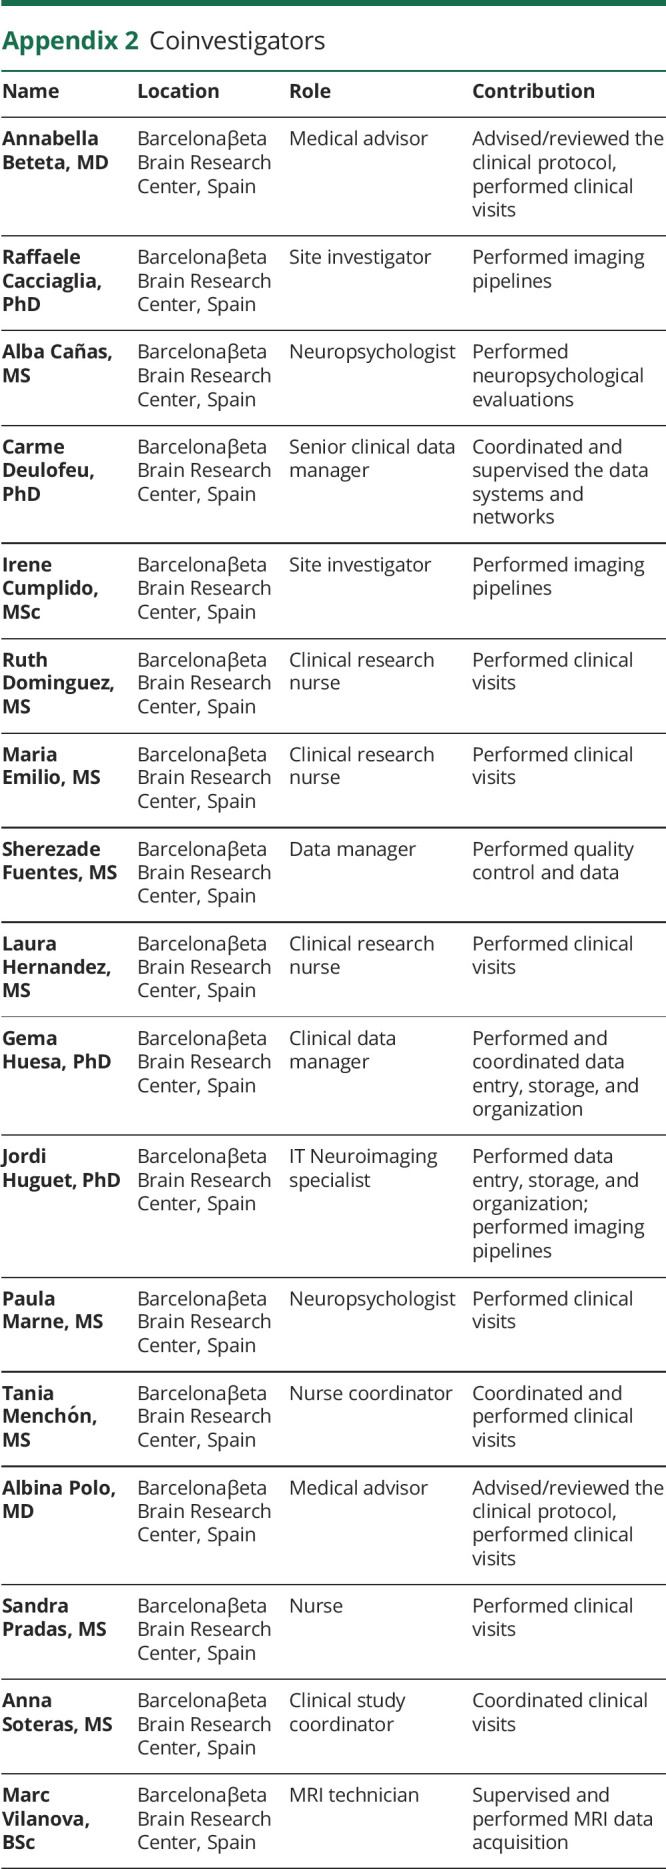
Appendix 2. Coinvestigators
Footnotes
Infographic: links.lww.com/WNL/B652
Study Funding
The research leading to these results has received funding from “la Caixa” Foundation (LCF/PR/GN17/10300004) and the Alzheimer's Association and an international anonymous charity foundation through the TriBEKa Imaging Platform project (TriBEKa-17-519007). Additional support has been received from the Universities and Research Secretariat, Ministry of Business and Knowledge of the Catalan Government under grant 2017-SGR-892. J.D.G. holds a “Ramón y Cajal” fellowship (RYC-2013-13054). E. Arenaza-Urquijo is supported by the Spanish Ministry of Science, Innovation and Universities–Spanish State Research Agency (RYC2018-026053-I). N. Vilor-Tejedor is funded by a postdoctoral grant, Juan de la Cierva Programme (FJC2018-038085-I), Ministry of Science and Innovation– Spanish State Research Agency. Her research has received additional support of “la Caixa” Foundation (LCF/PR/GN17/10300004) and the Health Department of the Catalan Government (Health Research and Innovation Strategic Plan 2016–2020 grant SLT002/16/00201). All Centre for Genomic Regulation authors acknowledge the support of the Spanish Ministry of Science, Innovation and Universities to the EMBL partnership, the Centro de Excelencia Severo Ochoa, and the CERCA Programme/Generalitat de Catalunya. O. Grau-Rivera is supported by the Spanish Ministry of Science, Innovation and Universities (FJCI-2017-33437) and receives funding from the Alzheimer's Association Research Fellowship Program (2019-AARF-644568). A. Sala-Vila is the recipient of an Instituto de Salud Carlos III Miguel Servet II fellowship (CP II 17/00029). H. Zetterberg is a Wallenberg Scholar supported by grants from the Swedish Research Council (No. 2018-02532), European Research Council (No. 681712), Swedish State Support for Clinical Research (No. ALFGBG-720931), Alzheimer Drug Discovery Foundation (No. 201809-2016862), and the UK Dementia Research Institute at UCL. K. Blennow is supported by the Swedish Research Council (No. 2017-00915), Alzheimer Drug Discovery Foundation (No. RDAPB-201809-2016615), Swedish Alzheimer Foundation (No. AF-742881), Hjärnfonden, Sweden (No. FO2017-0243), the Swedish state under the agreement between the Swedish government and the county councils, the ALF agreement (No. ALFGBG-715986), European Union Joint Program for Neurodegenerative Disorders (JPND2019-466-236), and NIH (No. 1R01AG068398-01). M. Suárez-Calvet receives funding from the European Research Council under the European Union's Horizon 2020 Research and Innovation Programme (grant agreement 948677). M. Suárez-Calvet also receives funding from the Instituto de Salud Carlos III (PI19/00155) and from the Spanish Ministry of Science, Innovation and Universities (Juan de la Cierva Programme grant IJC2018-037478-I).
Disclosure
M. Milà-Alomà, A. Brinkmalm, N. J. Ashton, H. Kvartsberg, M. Shekari, G. Operto, G. Salvadó, C. Falcon, J. D. Gispert, N. Vilor-Tejedor, E. Arenaza-Urquijo, O. Grau-Rivera, A. Sala-Vila, G. Sánchez-Benavides, J. M. González-de-Echávarri, C. Minguillón, K. Fauria, A. Niñerola-Baizán and A. Perissinotti report no disclosures relevant to the manuscript. G. Kollmorgen is a full-time employee of Roche Diagnostics GmbH. I. Suidjan is a full-time employee and shareholder of Roche Diagnostics International Ltd. H. Zetterberg has served on scientific advisory boards for Denali, Roche Diagnostics, Wave, Samumed, Siemens Healthineers, Pinteon Therapeutics, and CogRx; has given lectures in symposia sponsored by Fujirebio, Alzecure, and Biogen; and is a cofounder of Brain Biomarker Solutions in Gothenburg AB, which is a part of the GU Ventures Incubator Program (outside submitted work). J.L. Molinuevo is currently a full-time employee of H. Lundbeck A/S and previously has served as a consultant or on advisory boards for the following for-profit companies or has given lectures in symposia sponsored by the following for-profit companies: Roche Diagnostics, Genentech, Novartis, Lundbeck, Oryzon, Biogen, Lilly, Janssen, Green Valley, MSD, Eisai, Alector, BioCross, GE Healthcare, and ProMIS Neurosciences. K. Blennow has served as a consultant, on advisory boards, or on data monitoring committees for Abcam, Axon, Biogen, JOMDD/Shimadzu, Julius Clinical, Lilly, MagQu, Novartis, Roche Diagnostics, and Siemens Healthineers, and is a cofounder of Brain Biomarker Solutions in Gothenburg AB, which is a part of the GU Ventures Incubator Program. M. Suárez-Calvet has served as a consultant and on advisory boards for Roche Diagnostics International Ltd and has given lectures in symposia sponsored by Roche Diagnostics, S.L.U, and Roche Farma, S.A. Go to Neurology.org/N for full disclosures.
References
- 1.Selkoe DJ. Alzheimer's disease is a synaptic failure. Science. 2002;298(5594):789-791. [DOI] [PubMed] [Google Scholar]
- 2.Arendt T. Synaptic degeneration in Alzheimer's disease. Acta Neuropathol. 2009;118(1):167-179. [DOI] [PubMed] [Google Scholar]
- 3.DeKosky ST, Scheff SW. Synapse loss in frontal cortex biopsies in Alzheimer's disease: correlation with cognitive severity. Ann Neurol. 1990;27(5):457-464. [DOI] [PubMed] [Google Scholar]
- 4.Camporesi E, Nilsson J, Brinkmalm A, et al. Fluid biomarkers for synaptic dysfunction and loss. Biomark Insights. 2020;15:1177271920950319.. [DOI] [PMC free article] [PubMed] [Google Scholar]
- 5.Wellington H, Paterson RW, Portelius E, et al. Increased CSF neurogranin concentration is specific to Alzheimer disease. Neurology. 2016;86(9):829-835. [DOI] [PMC free article] [PubMed] [Google Scholar]
- 6.Tible M, Sandelius Å, Höglund K, et al. Dissection of synaptic pathways through the CSF biomarkers for predicting Alzheimer disease. Neurology. 2020;95(8):e953-e961. [DOI] [PubMed] [Google Scholar]
- 7.De Vos A, Jacobs D, Struyfs H, et al. . C-terminal neurogranin is increased in cerebrospinal fluid but unchanged in plasma in Alzheimer's disease. Alzheimers Dement. 2015;11(12):1461-1469. [DOI] [PubMed] [Google Scholar]
- 8.Kvartsberg H, Duits FH, Ingelsson M, et al. Cerebrospinal fluid levels of the synaptic protein neurogranin correlates with cognitive decline in prodromal Alzheimer's disease. Alzheimers Dement. 2015;11(10):1180-119.0 [DOI] [PubMed] [Google Scholar]
- 9.Brinkmalm A, Brinkmalm G, Honer WG, et al. SNAP-25 is a promising novel cerebrospinal fluid biomarker for synapse degeneration in Alzheimer's disease. Mol Neurodegener. 2014;9(1):53.. [DOI] [PMC free article] [PubMed] [Google Scholar]
- 10.Sjögren M, Davidsson P, Gottfries J, et al. . The cerebrospinal fluid levels of tau, growth-associated protein-43 and soluble amyloid precursor protein correlate in Alzheimer's disease, reflecting a common pathophysiological process. Dement Geriatr Cogn Disord. 2001;12(4):257-264. [DOI] [PubMed] [Google Scholar]
- 11.Öhrfelt A, Brinkmalm A, Dumurgier J, et al. The pre-synaptic vesicle protein synaptotagmin is a novel biomarker for Alzheimer's disease. Alzheimers Res Ther. 2016;8(1):41.. [DOI] [PMC free article] [PubMed] [Google Scholar]
- 12.Galasko D, Xiao M, Xu D, et al. Synaptic biomarkers in CSF aid in diagnosis, correlate with cognition and predict progression in MCI and Alzheimer's disease. Alzheimers Dement. 2019;5:871-882. [DOI] [PMC free article] [PubMed] [Google Scholar]
- 13.Thorsell A, Bjerke M, Gobom J, et al. Neurogranin in cerebrospinal fluid as a marker of synaptic degeneration in Alzheimer's disease. Brain Res. 2010;1362:13-22. [DOI] [PubMed] [Google Scholar]
- 14.Sandelius Å, Portelius E, Källén Å, et al. Elevated CSF GAP-43 is Alzheimer's disease specific and associated with tau and amyloid pathology. Alzheimers Dement. 2019;15(1):55-64. [DOI] [PMC free article] [PubMed] [Google Scholar]
- 15.Xia Z, Storm DR. The role of calmodulin as a signal integrator for synaptic plasticity. Nat Rev Neurosci. 2005;6(4):267-276. [DOI] [PubMed] [Google Scholar]
- 16.Portelius E, Olsson B, Höglund K, et al. Cerebrospinal fluid neurogranin concentration in neurodegeneration: relation to clinical phenotypes and neuropathology. Acta Neuropathol. 2018;136(3):363-376. [DOI] [PMC free article] [PubMed] [Google Scholar]
- 17.Xue M, Sun FR, Ou YN, et al. Association of cerebrospinal fluid neurogranin levels with cognition and neurodegeneration in Alzheimer's disease. Aging. 2020;12(10):9365-9379. [DOI] [PMC free article] [PubMed] [Google Scholar]
- 18.Höglund K, Kern S, Zettergren A, et al. Preclinical amyloid pathology biomarker positivity: effects on tau pathology and neurodegeneration. Transl Psychiatry. 2017;7(1):e995.. [DOI] [PMC free article] [PubMed] [Google Scholar]
- 19.Sutphen CL, McCue L, Herries EM, et al. Longitudinal decreases in multiple cerebrospinal fluid biomarkers of neuronal injury in symptomatic late onset Alzheimer's disease. Alzheimers Dement. 2018;14(7):869-879. [DOI] [PMC free article] [PubMed] [Google Scholar]
- 20.Mattsson N, Insel PS, Palmqvist S, et al. Cerebrospinal fluid tau, neurogranin, and neurofilament light in Alzheimer's disease. EMBO Mol Med. 2016;8(10):1184-1196. [DOI] [PMC free article] [PubMed] [Google Scholar]
- 21.Portelius E, Zetterberg H, Skillbäck T, et al. Cerebrospinal fluid neurogranin: relation to cognition and neurodegeneration in Alzheimer's disease. Brain. 2015;138(11):3373-3385. [DOI] [PMC free article] [PubMed] [Google Scholar]
- 22.Sutton RB, Fasshauer D, Jahn R, Brunger AT. Crystal structure of a SNARE complex involved in synaptic exocytosis at 2.4 Å resolution. Nature. 1998;395(6700):347-353. [DOI] [PubMed] [Google Scholar]
- 23.Zhang H, Therriault J, Kang MS, et al. Cerebrospinal fluid synaptosomal-associated protein 25 is a key player in synaptic degeneration in mild cognitive impairment and Alzheimer's disease. Alzheimers Res Ther. 2018;10(1):80. [DOI] [PMC free article] [PubMed] [Google Scholar]
- 24.Neve RL, Finch EA, Bird ED, Benowitz LI. Growth-associated protein GAP-43 is expressed selectively in associative regions of the adult human brain. Proc Natl Acad Sci USA. 1988;85(10):3638-3642. [DOI] [PMC free article] [PubMed] [Google Scholar]
- 25.Andersson A, Remnestål J, Nellgård B, et al. Development of parallel reaction monitoring assays for cerebrospinal fluid proteins associated with Alzheimer's disease. Clin Chim Acta. 2019;494:79-93. [DOI] [PubMed] [Google Scholar]
- 26.Remnestål J, Just D, Mitsios N, et al. CSF profiling of the human brain enriched proteome reveals associations of neuromodulin and neurogranin to Alzheimer's disease. Proteomics Clin Appl. 2016;10(12):1242-1253. [DOI] [PMC free article] [PubMed] [Google Scholar]
- 27.Südhof TC, Rizo J. Synaptotagmins: C2-domain proteins that regulate membrane traffic. Neuron. 1996;17(3):379-388. [DOI] [PubMed] [Google Scholar]
- 28.Molinuevo JL, Gramunt N, Gispert JD, et al. The ALFA project: a research platform to identify early pathophysiological features of Alzheimer's disease. Alzheimers Dement. 2016;2(2):82-92. [DOI] [PMC free article] [PubMed] [Google Scholar]
- 29.Milà‐Alomà M, Salvadó G, Gispert JD, et al. . Amyloid beta, tau, synaptic, neurodegeneration, and glial biomarkers in the preclinical stage of the Alzheimer's continuum. Alzheimers Dement. 2020;16(10):1358-1371. [DOI] [PMC free article] [PubMed] [Google Scholar]
- 30.Milà-Alomà M, Shekari M, Salvadó G, et al. . Cognitively unimpaired individuals with a low burden of Aβ pathology have a distinct CSF biomarker profile. Alzheimers Res Ther. 2021;13(1):134.. [DOI] [PMC free article] [PubMed] [Google Scholar]
- 31.Teunissen CE, Tumani H, Engelborghs S, Mollenhauer B. Biobanking of CSF: international standardization to optimize biomarker development. Clin Biochem. 2014;47(4-5):288-292. [DOI] [PubMed] [Google Scholar]
- 32.Klunk WE, Koeppe RA, Price JC, et al. The Centiloid project: standardizing quantitative amyloid plaque estimation by PET. Alzheimers Dement. 2015;11(1):1-4. [DOI] [PMC free article] [PubMed] [Google Scholar]
- 33.Salvadó G, Molinuevo JL, Brugulat-Serrat A, et al. Centiloid cut-off values for optimal agreement between PET and CSF core AD biomarkers. Alzheimers Res Ther. 2019;11(1):27.. [DOI] [PMC free article] [PubMed] [Google Scholar]
- 34.Landau SM, Harvey D, Madison CM, et al. Associations between cognitive, functional, and FDG-PET measures of decline in AD and MCI. Neurobiol Aging. 2011;32(7):1207-1218. [DOI] [PMC free article] [PubMed] [Google Scholar]
- 35.Fischl B. FreeSurfer. Neuroimage. 2012;62(2):774-781. [DOI] [PMC free article] [PubMed] [Google Scholar]
- 36.Jack CR, Wiste HJ, Weigand SD, et al. . Age-specific and sex-specific prevalence of cerebral β-amyloidosis, tauopathy, and neurodegeneration in cognitively unimpaired individuals aged 50-95 years: a cross-sectional study. Lancet Neurol. 2017;16(6):435-444. [DOI] [PMC free article] [PubMed] [Google Scholar]
- 37.Jack CR, Wiste HJ, Weigand SD, et al. Defining imaging biomarker cut points for brain aging and Alzheimer's disease. Alzheimers Dement. 2017;13(3):205-216. [DOI] [PMC free article] [PubMed] [Google Scholar]
- 38.Brugulat-Serrat A, Rojas S, Bargalló N, et al. . Incidental findings on brain MRI of cognitively normal first-degree descendants of patients with Alzheimer's disease: a cross-sectional analysis from the ALFA (Alzheimer and Families) project. BMJ Open. 2017;7(3):e013215.. [DOI] [PMC free article] [PubMed] [Google Scholar]
- 39.Benjamini Yoav , Hochberg Y. Controlling the false discovery rate: a practical and powerful approach to multiple testing. J R Stat Soc Ser B. 1995;57(1):289-300. [Google Scholar]
- 40.Pereira JB, Janelidze S, Ossenkoppele R, et al. Untangling the association of amyloid-β and tau with synaptic and axonal loss in Alzheimer's disease. Brain. 2021;144(1):310-324. [DOI] [PMC free article] [PubMed] [Google Scholar]
- 41.Wang S, Zhang J, Pan T. APOE ε4 is associated with higher levels of CSF SNAP-25 in prodromal Alzheimer's disease. Neurosci Lett. 2018;685:109-113. [DOI] [PubMed] [Google Scholar]
- 42.Tarawneh R, D'Angelo G, Crimmins D, et al. Diagnostic and prognostic utility of the synaptic marker neurogranin in Alzheimer disease. JAMA Neurol. 2016;73(5):561-571. [DOI] [PMC free article] [PubMed] [Google Scholar]
- 43.Janelidze S, Hertze J, Zetterberg H, et al. Cerebrospinal fluid neurogranin and YKL-40 as biomarkers of Alzheimer's disease. Ann Clin Transl Neurol. 2016;3(1):12-20. [DOI] [PMC free article] [PubMed] [Google Scholar]
- 44.Moore EE, Gifford KA, Khan OA, et al. Cerebrospinal fluid biomarkers of neurodegeneration, synaptic dysfunction, and axonal injury relate to atrophy in structural brain regions specific to Alzheimer's disease. Alzheimers Dement. 2020;16(6):883-895. [DOI] [PMC free article] [PubMed] [Google Scholar]
- 45.Oh H, Habeck C, Madison C, Jagust W. Covarying alterations in Aβ deposition, glucose metabolism, and gray matter volume in cognitively normal elderly. Hum Brain Mapp. 2014;35(1):297-308. [DOI] [PMC free article] [PubMed] [Google Scholar]
- 46.Cohen AD, Price JC, Weissfeld LA, et al. . Basal cerebral metabolism may modulate the cognitive effects of Aβ in mild cognitive impairment: an example of brain reserve. J Neurosci. 2009;29(47):14770-14778. [DOI] [PMC free article] [PubMed] [Google Scholar]
- 47.Johnson SC, Christian BT, Okonkwo OC, et al. Amyloid burden and neural function in people at risk for Alzheimer's Disease. Neurobiol Aging. 2014;35(3):576-584. [DOI] [PMC free article] [PubMed] [Google Scholar]
- 48.Pereira JB, Westman E, Hansson O. Association between cerebrospinal fluid and plasma neurodegeneration biomarkers with brain atrophy in Alzheimer's disease. Neurobiol Aging. 2017;58:14-29. [DOI] [PubMed] [Google Scholar]
Associated Data
This section collects any data citations, data availability statements, or supplementary materials included in this article.
Data Availability Statement
Due to participant privacy, individual-level data cannot be made publicly available. Researchers who wish to use data from the ALFA study must obtain approval from the ALFA study management team.


