Abstract
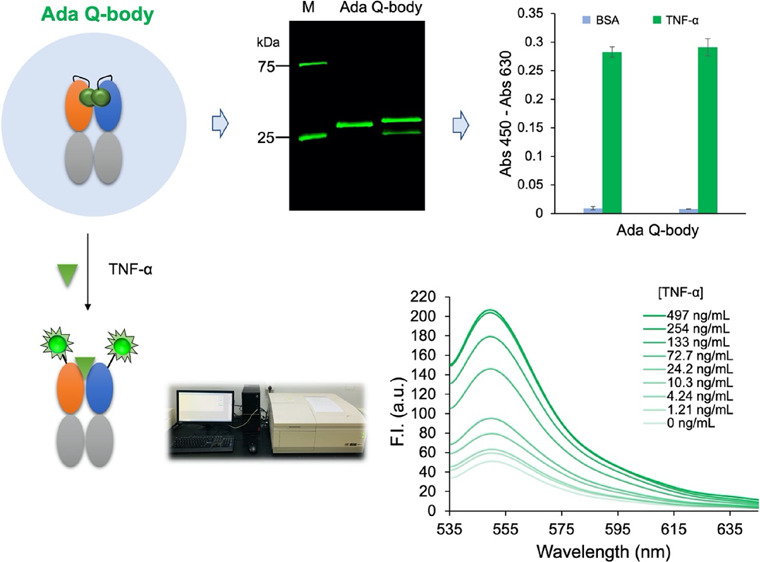
Tumor necrosis factor α (TNF-α) is used as a biomarker for the diagnosis of various inflammatory and autoimmune diseases. In recent years, numerous approaches have been used for the qualitative and quantitative analyses of TNF-α. However, these methods have several drawbacks, such as a tedious and time-consuming process, high pH and temperature sensitivity, and increased chances of denaturation in vitro. Quenchbody (Q-body) is a fluorescence immunoprobe that functions based on the principle of photoinduced electron transfer and has been successful in detecting various substances. In this study, we constructed two Q-bodies based on a therapeutic antibody, adalimumab, to rapidly detect human TNF-α. Both sensors could detect TNF-α within 5 min. The results showed that the limit of detection (LOD) of TNF-α was as low as 0.123 ng/mL with a half-maximal effective concentration (EC50) of 25.0 ng/mL using the TAMRA-labeled Q-body, whereas the ATTO520-labeled Q-body had a LOD of 0.419 ng/mL with an EC50 of 65.6 ng/mL, suggesting that the Q-bodies could rapidly detect TNF-α with reasonable sensitivity over a wide detection range. These biosensors will be useful tools for the detection and monitoring of inflammatory biomarkers.
1. Introduction
Tumor necrosis factor (TNF) is a cytokine, a type of small molecular protein, produced by macrophages in response to bacterial infection or other immune sources.1−3 TNF-α and TNF-β are two types of TNF that are characterized by their origin and structure. The former is primarily produced by mononuclear macrophages, and LPS is a strong stimulant that induces the production of TNF-α. T and NK cells can also secrete TNF-α under the action of stimulating factors (e.g., phorbol-12-myristate-13-acetate). TNF-α exerts cytotoxic and growth-inhibitory effects on various tumors, and it has no effect on normal tissue cells and is not species-specific. Accumulating evidence suggests that TNF-α is involved in several inflammatory and autoimmune diseases.4,5 Therefore, the detection of TNF-α is of importance for the diagnosis of disease.
Immunoassays play an important role in the detection of TNF-α. Enzyme-linked immunosorbent assay (ELISA) is the most widely used format; it requires the immobilization of an antibody and washing steps, which makes the assay difficult to perform. To overcome the limitations of ELISA, sensors based on electrochemistry,6,7 electrochemical impedance spectroscopy,6,7 and DNA or RNA aptamers3,8−11 have been developed. There are also approaches based on the combination of electrochemical immunosensing methods and nanospheres,12 nanorods,13 amperometric immunoassays,14 fiber-optic particle plasmon resonance,15 and hybridization chain reaction-based single-molecule counting16 for TNF-α detection. A silicon photonic biosensing chip capable of multiplexed protein measurements, including TNF-α, in a biomolecular complex cell culture matrix has also been developed.10 The methods mentioned above either consist of complicated design strategies or sophisticated measurement techniques. Therefore, a simple and accurate assay is urgently needed to detect TNF-α.
Quenchbody (Q-body), which functions based on the principle of fluorescence quenching, is a convenient and straightforward immunosensor.17 It is designed to label one or two specific fluorescent dyes to the variable fragment of the antibody. In the vicinity of the antigen-binding site of the antibody, when the fluorescent dye is in an appropriate position, its fluorescence is quenched under the influence of the tryptophan (Trp) residues of the variable antibody region or the other dye. However, when the Q-body is added to the target antigen, the quenching effect is weakened and the fluorescence intensity of the dye is recovered in a dose-dependent manner. Thus, the antigen can be quantified by measuring the fluorescence intensity of the fluorescence-quenching sensor. The assay is simple to operate, requires only the mixing of Q-body and a sample, and can be completed in a matter of seconds to minutes without washing steps. Q-body technology has been used to detect a wide range of substances, including small molecules such as imidacloprid (one of the most frequently used neonicotinoid pesticides)18 and rapamycin,19 peptides such as bone Gla (a biomarker for bone disease)20 and amyloid-β monomer as well as its derived diffusible ligand (biomarkers of Alzheimer’s disease),21 and proteins such as influenza virus hemagglutinin22 and human epidermal growth factor receptor 2 (a cancer biomarker).23 Compared with other approaches used for fluorescence-based reagentless immunoassays,24,25 this approach has fewer limitations regarding the range of antigen size, and numerous antigens, from haptens to proteins, have been successfully assayed. Adalimumab (Ada) is a fully human monoclonal antibody raised against TNF-α and is used worldwide to treat rheumatoid arthritis and other autoimmune diseases.26 Additionally, Ada has high specificity and affinity for human TNF-α (KD = 0.6 nM).27 In the present study, Q-bodies based on Ada were prepared, and their performance as a rapid diagnostic test was investigated.
2. Results and Discussion
2.1. Design and Construction of Ada Q-Bodies
Ada is a human antibody that specifically binds to TNF-α.2 Based on the variable region sequence of Ada, two antigen-binding fragments (Fab), UQ1H-Fab and UQ2GS-Fab, whose amino acid compositions and structures are shown in Figure 1a and Figure S1, were prepared. At the N terminus of Fd (VH-CH1) of both Fab, a peptide containing a cysteine, Cys-tag1 (MAQIEVNCSNET), which allows labeling using maleimide dye, was appended.28 The first constant region of human IgG1 was used as CH1 of Fab. At the N terminus of the variable region of the κ light chain of UQ2GS-Fab, another polypeptide with a different sequence containing a cysteine, Cys-tag2 (MSKQCSNET), was attached. The constant region of the human κ chain was employed for both Fab. A 6× histidine (His) tag at the C terminus of Fd and a FLAG tag (DYKDDDDK) at the C terminus of the light chain were incorporated to enable the easy purification and detection of these Fab fragments. The structure of vectors pUQ1H-Ada and pUQ2GS-Ada for the expression of Fab are shown in Figure 1b.
Figure 1.
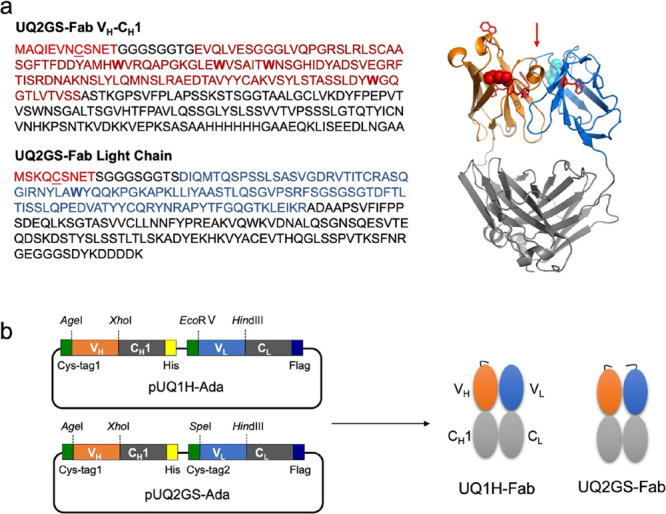
Design of antibody fragment. (a) Amino acid sequences and predicted structure of UQ2GS-Fab. (b) Constructs of vectors and Fabs. Cys-tag, VH, and VL sequences are shown in red, magenta, and blue, respectively. Tryptophan residues in VH and VL are shown in bold. Cysteines in cys-tags are underlined. Red arrow indicates the antigen-binding pocket of UQ2GS-Fab. The structure of UQ2GS-Fab was predicted with SWISS-MODEL (https://swissmodel.expasy.org/) in which tryptophan residues in VH and VL are shown in red sticks and the N termini of VH and VL are marked in red and cyan spheres.
2.2. Expression of Ada-Fab in Escherichia coli
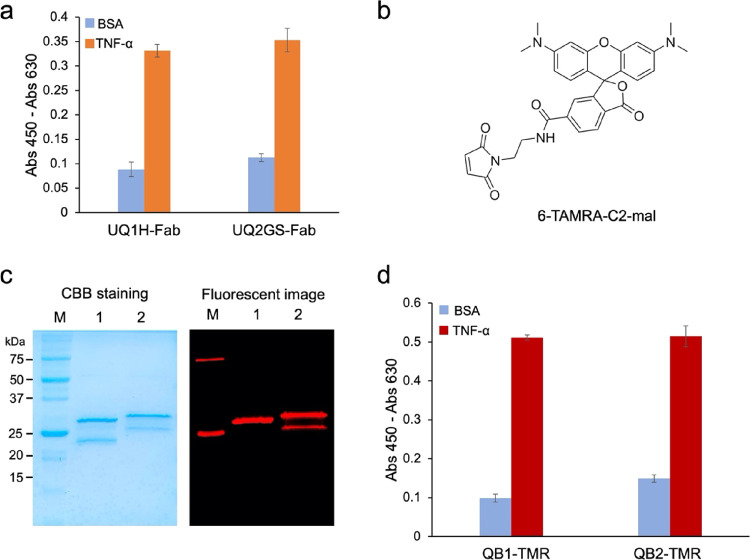
pUQ1H-Ada and pUQ2GS-Ada vectors were used to transform Escherichia coli SHuffle T7 Express lysY strain, an oxidized cytoplasm, compared to the wild-type E. coli. After culturing the cells to the mid-log phase, isopropylthio-β-galactopyranoside (IPTG) was added to induce protein expression. The expressed protein was purified with Ni-NTA Sefinose Resin and analyzed using sodium dodecyl sulfate–polyacrylamide gel electrophoresis (SDS-PAGE). Two bands for Fd and light chain were prominent, which is similar to the expected molecular weights of Ada Fd (30 kDa) and light chain (28 kDa). The antigen-binding activity of the products UQ1H-Fab and UQ2GS-Fab was confirmed by an ELISA using immobilized human TNF-α protein. As shown in Figure 2a, purified Fabs showed clear binding to TNF-α but not to bovine serum albumin (BSA), which was used as a negative control, demonstrating the specificity of Fabs against TNF-α.
Figure 2.
Preparation and analysis of Q-bodies with TAMRA. (a) TNF-α binding activity of Fabs. (b) Structures of 6-TAMRA-C2-maleimide. (c) CBB-stained and fluorescence images of the Q-bodies with 6-TAMRA-C2-maleimide after SDS-PAGE; (lane 1, QB1-TMR; lane 2, QB2-TMR). (d) ELISA results for analyzing the antigen-binding activity of QB1-TMR and QB2-TMR.
2.3. Preparation of the Q-Body
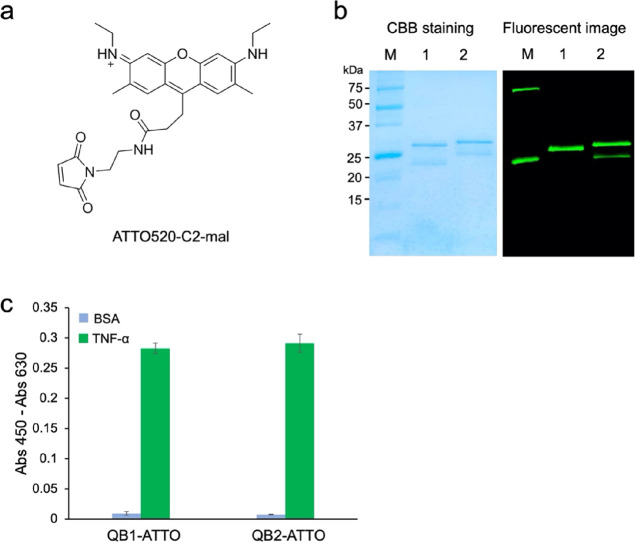
6-TAMRA-C2-maleimide (Figure 2b) and ATTO520-C2-maleimide (Figure 3a) were used to specifically label UQ1H-Fab and UQ2GS-Fab at the position that enables antigen-dependent fluorescence emission. Further purification was conducted using anti-DYKDDDDK antibody-coated beads after fluorescence labeling. SDS-PAGE was conducted to separate the Q-body protein, followed by fluorescence observation and Coomasie brilliant blue (CBB) staining. As shown in Figure 2c, two bands were observed at approximately 25 kDa, which represent the Fd and light chain of single TAMRA-labeled Q-body (QB1-TMR) or double TAMRA-labeled Q-body (QB2-TMR). Two clear fluorescent bands corresponding to the labeled Fd and light chain of QB2-TMR were observed on the fluorescence image, indicating that the Fd and light chains were both labeled with TAMRA. For QB1-TMR, only one band corresponding to Fd showed bright fluorescence, suggesting that the labeling was successful.
Figure 3.
Preparation and analysis of Q-bodies with ATTO520. (a) Structures of ATTO520-C2-maleimide. (b) CBB-stained and fluorescence images of the Q-bodies with ATTO520-C2-maleimide after SDS-PAGE (lane 1, QB1-ATTO; lane 2, QB2-ATTO). (c) ELISA of the antigen-binding activity of QB1-ATTO and QB2-ATTO.
Figure 3b shows the CBB-stained and fluorescence images of ATTO520-labeled Q-bodies. Two protein bands representing the Fd and light chains were observed. One fluorescent band was observed for the single ATTO520-labeled Q-body (QB1-ATTO) and two for the double ATTO520-labeled Q-body (QB2-ATTO), suggesting the successful conjugation of fluorescent dyes. Interestingly, the positions of the Fd and light chain of single-labeled and double-labeled Fabs differed in the electrophoretogram, which may be due to the influence of fluorescent dyes on the moving speed of the antibody chain.
The antigen-binding activity of Fabs and Q-bodies was investigated by ELISA using immobilized TNF-α as an antigen. As shown in Figure 2d, QB1-TMR and QB2-TMR bound to TNF-α but not to BSA, and the binding activity did not decrease after labeling with fluorescent dyes. Similar results were obtained with QB1-ATTO and QB2-ATTO, as shown in Figure 3c, indicating that labeling with fluorescent dyes did not significantly affect their antigen-binding activity.
2.4. Denaturant-Dependent Dequenching of Q-Bodies
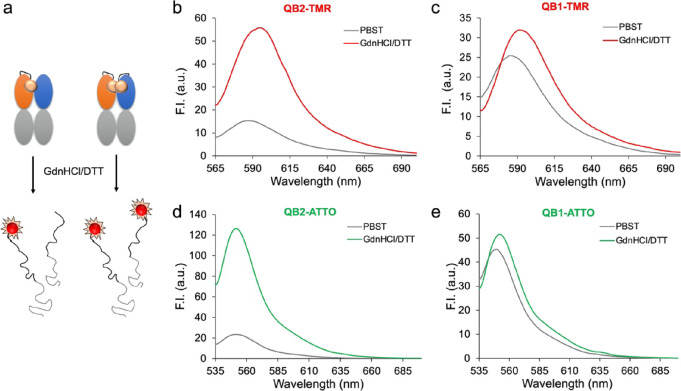
In the native structure of the antibody protein, tryptophan residues in the variable region contribute to quenching of the fluorescence dye in the Q-body. However, when the Q-body is added to the denaturant, the chances of collision of the dye and tryptophan residues significantly decrease, resulting in a reduced quenching effect. Based on this principle, the Q-body was treated with 7 M guanidine hydrochloride solution containing 100 mM dithiothreitol (GdnHCl/DTT) to evaluate the degree of initial quenching, as shown in Figure 4a, which represents the potential performance of the Q-body. Fluorescence spectroscopy showed that the fluorescence intensity of QB2-TMR in GdnHCl/DTT was 3.64-fold higher than that in phosphate buffer saline containing 0.1% Tween 20 (PBST) as shown in Figure 4b, whereas a modest 1.26-fold change was observed for QB1-TMR as shown in Figure 4c. For ATTO-labeled Q-bodies, the fluorescence intensity of QB2-ATTO increased 5.38-fold when denatured as shown in Figure 4d, whereas a 1.14-fold increase in fluorescence intensity was observed for QB1-ATTO as shown in Figure 4e. These results suggest that double-labeled Q-bodies show higher quenching than single-labeled Q-bodies and could be more suitable for detecting TNF-α.
Figure 4.
Analysis of Q-bodies. (a) Scheme of denaturation of Q-bodies. Fluorescence spectra of denatured (b) QB2-TMR, (c) QB1-TMR, (d) QB2-ATTO, and (e) QB1-ATTO (PBST, phosphate buffer saline containing 0.1% Tween 20; GdnHCl/DTT, 7 M guanidine hydrochloride solution containing 100 mM dithiothreitol).
2.5. Sensitive Detection of TNF-α Protein
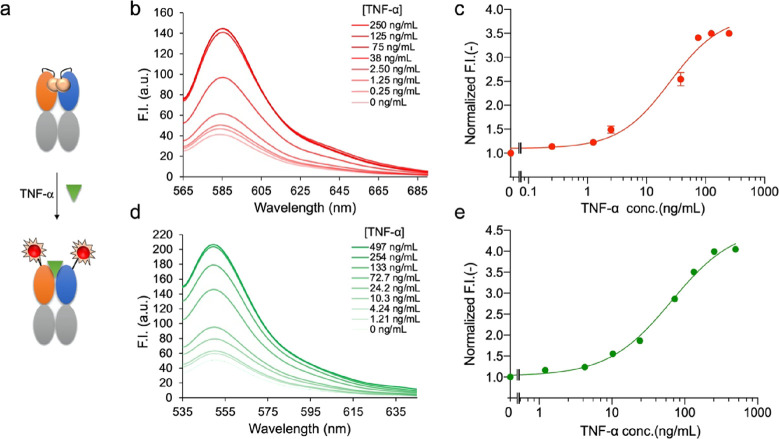
Based on the above results, QB2-TMR and QB2-ATTO were used to quantify TNF-α protein as shown in Figure 5a. As displayed in Figure 5b, with the increased concentration of TNF-α, the fluorescence intensity of QB2-TMR increased, and a dose–response curve was drawn based on the data (Figure 5c). The fitting of the dose–response curves, a limit of detection (LOD) of 0.123 ng/mL, and a half-maximal effective concentration (EC50) value of 25.0 ng/mL were obtained for QB2-TMR. The fluorescence intensity increased 3.50-fold when the TNF-α concentration was increased to 250 ng/mL.
Figure 5.
Detection of TNF-α with Q-bodies. (a) Scheme for antigen detection with a double-labeled Q-body. (b) Spectrum and (c) dose–response curve for the detection of TNF-α with QB2-TMR. (d) Spectrum and (e) dose–response curve for the detection of TNF-α with QB2-ATTO.
For the ATTO520-labeled Q-body QB2-ATTO, with an increase in TNF-α concentration, the fluorescence intensity increased to 4.05-fold when the concentration reached the maximum as shown in Figure 5d. The LOD of the assay for TNF-α was 0.419 ng/mL, and the IC50 was calculated to be 65.6 ng/mL for QB2-ATTO according to the dose–response curve, as shown in Figure 5e.
2.6. Detection of TNF-α with a Competitive ELISA
A competitive ELISA with UQ2GS-Fab was carried out to quantify the TNF-α in PBS buffer. As shown in Figure 6, the absorbance decreased gradually with the increase of concentration of TNF-α in the samples, and the LOD and EC50 of the assay were calculated to be 0.322 and 26.5 ng/mL, which were very similar to those of the Ada Q-bodies.
Figure 6.
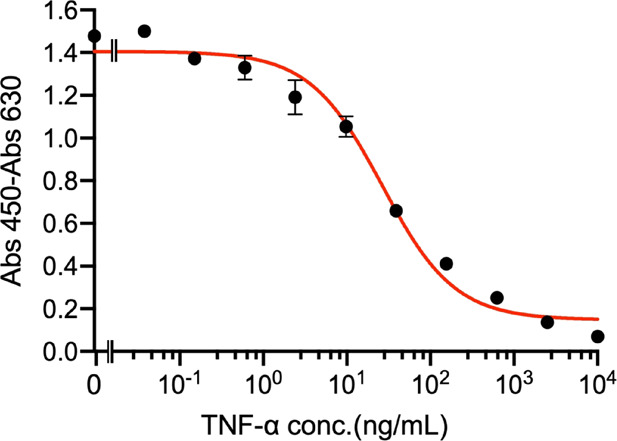
Detection of TNF-α with a competitive ELISA employing an antigen-binding fragment of Ada antibody.
When we labeled Ada Fab with fluorescent dyes near the antigen-binding site, the fluorescent dyes came close to the antigen-binding pocket, and their fluorescence was quenched because of the following reasons: (i) photoinduced electron transfer (PET) from the Trp residues of the antibody to the fluorescent dye and (ii) dye–dye stacking (H-dimer) when double-labeling was performed. There are a total of five Trp residues in the VH and VL of this antibody that may participate in the quenching of fluorescent dyes. When the Q-body binds to the antigen, PET is weakened due to conformational changes in the antibody or steric hindrance due to antigen binding, and the fluorescence of the sensor is partially or fully restored. We measured the absorption spectra of QB1-TMR, QB2-TMR, QB1-ATTO, and QB2-ATTO, as shown in Figure S2, and a peak at 520 nm for double-labeled Q-body with TAMRA and another near 490 nm for the double-labeled Q-body with ATTO520 was observed, but no peak was observed for the single-labeled Q-body. This suggests that in the double-labeled Q-body, the H-dimer is formed, resulting in a peak shift. Antigen detection by measuring the change in fluorescence intensity is rapid and straightforward, and the antigen-binding affinity of the antibody guarantees its sensitivity. Binding of the antigen led to the resumption of biosensor fluorescence, which was positively correlated with antigen concentration. The sensor takes advantage of this phenomenon, making it the basis for detecting TNF-α and achieving a detection limit as low as 0.123 ng/mL.
We also prepared a Q-body based on the single-chain Fv form of Ada. However, we found that although scFv could also be used for the detection of TNF-α, the detection range was narrow. Moreover, it showed low stability, and even after a short storage time, the detection signal became very weak (data not shown). The Q-body in the form of Fab showed higher sensitivity, better stability, and a wider detection range than the scFv-type Q-body. In this study, we constructed two types of Fab: UQ1H-Fab and UQ2GS-Fab. The difference between them is that both VH and VL fragments of UQ2GS-Fab contain cysteine residues at their N termini, which can be used for fluorescent dye labeling, whereas UQ1H-Fab contains only one additional cysteine at the N terminus of VH. Although the ELISA results showed no significant difference in the antigen-binding activity irrespective of fluorescence labeling, the activity of the Q-body was markedly different. While double-labeled Q-bodies detected TNF-α with sufficient fluorescence responses, UQ1H-Fab-derived Q-bodies did not. Similar results have been observed for the Q-bodies of the influenza virus hemagglutinin.22 In the case of double-labeled Q-bodies, dye–dye interactions contribute to quenching, in addition to Trp-induced quenching.18,29 The fluorescence intensity of QB2-TMR increased at the highest TNF-α concentration, which was lower than that of QB2-ATTO. The LODs of the two Q-bodies were also slightly different. This may be caused by the difference in the affinity of Q-bodies, dye structure, H-dimer efficiency, and functional groups. The specific reason for this will be studied in depth in future investigations.
3. Conclusions
We successfully developed two Q-bodies by labeling UQ2GS-Fab with different fluorescent dyes to detect TNF-α. Different fluorescent dyes showed different effects on detection sensitivity and detection range. QB2-TMR showed an LOD as low as 0.123 ng/mL, which was lower than that of QB2-ATTO. Compared with conventional ELISAs, Q-body assays are rapid and straightforward; moreover, they show a sensitivity similar to that of competitive ELISAs without requiring time-consuming incubation and washing steps. Additional advantages of this biosensor include greater shelf life and stability than other enzyme-based detection platforms. In addition, the sample volume requirement for this sensor is low. These properties make Ada Q-bodies potential candidates for application in medical and biological diagnostics.
4. Materials and Methods
4.1. Materials
Genes for the variable regions of Ada and primers used for the construction of the expression vector were synthesized by Shanghai Sangon Biotech Co., Ltd. (Shanghai, China). KOD-Plus-Neo DNA polymerase was obtained from Toyobo (Osaka, Japan). The restriction enzymes used in this study were purchased from New England Biolabs (NEB; MA, USA) or Takara-Bio (Otsu, Shiga, Japan). E. coli XL10-Gold and SHuffle T7 express lysY were purchased from NEB. Tris (2-carboxyethyl)phosphine (TCEP) was obtained from Thermo Pierce (Rockford, IL, USA). 6-TAMRA-C2-maleimide was obtained from Lumiprobe Corporation (Hunt Valley, Maryland, USA), and ATTO520-C2-maleimide was purchased from ATTO-TEC GmbH (Siegen, GA). Ni-NTA Sefinose Resin was obtained from Shanghai Sangon Biotech Co., Ltd. Anti-DYKDDDDK G1 affinity resin was purchased from GenScript Inc. (Nanjing, China). Human TNF-α was purchased from Shandong KHZ Biopharmaceuticals Inc. (Weifang, China).
4.2. Construction of Plasmids
The VH and VL genes of Ada used for the construction of Fab expression vectors were amplified using polymerase chain reaction (PCR). The reaction mixture (50 μL) was prepared by the addition of 5 μL of 10× PCR Buffer for KOD-Plus-Neo, 5 μL of 2 mM dNTPs, 3 μL of 25 mM MgSO4, 0.5 μL of DNA solution containing 50 ng of VH/VL DNA, 0.5 μL of primers at 100 μM, and 1 μL of KOD-Plus-Neo (1 unit) with water. The primers AgeIAdaVHback/pHENseq were used to amplify a DNA fragment containing the VH of Ada from a previously constructed plasmid, pIT2-Ada (unpublished). EcoRvAdaVLback/HindIIIAdaVLfor and SpeIAdaVLback/HindIIIAdaVLfor were used to amplify VL for the construction of single- and double-labeled Fab-expressing plasmids. The reaction conditions consisted of one cycle of 94 °C for 2 min, 30 cycles of 94 °C for 30 s, 55 °C for 30 s, and 72 °C for 60 s. PCR products were separated on a 1.5% agarose gel via electrophoresis, analyzed, and recovered using a gel recovery kit (Shanghai Sangon Biotech Co., Ltd.). The restriction enzyme pair AgeI/XhoI was used to digest the VH gene to construct a double Cys-tag Fab expression vector pUQ2GS-Ada and a single Cys-tag Fab expression vector pUQ1H-Ada, whereas the SpeI/HindIII and EcoRV/HindIII pairs were used to digest the VL gene to construct pUQ2GS-Ada and pUQ1H-Ada, respectively. The constructed plasmids were transformed into E. coli XL10-Gold cells, and a single colony was selected for DNA sequencing analysis. The nucleotide sequences of the primers used in this study are listed in Table 1.
Table 1. Primers Used in this Study.
| name | sequence (5′-3′) |
|---|---|
| AgeIAdaVHback | TGAGACCGGTGAGGTTCAGTTGGTGGAA |
| EcoRvAdaVLback | AGGAGATATCACATGGACATCCAGATGACACAGT |
| SpeIAdaVLback | TGAGACTAGTGACATCCAGATGACACAGT |
| HindIIIAdaVLfor | ATTTCAAGCTTAGTGCCTTGCCCAAAGGTATA |
| pHENseq | CTATGCGGCCCCATTCA |
| T7 Promoter | TAATACGACTCACTATAGGG |
| T7 Terminator | GCTAGTTATTGCTCAGCGG |
4.3. Protein Expression and Purification
Protein expression was analyzed as reported in our previous study.30 SHuffle T7 Express lysY cells were transformed with each expression vector and cultured at 37 °C for 16 h in LBA medium (LB medium containing 100 μg/mL ampicillin). A single colony was picked and grown at 37 °C in 4 mL of LBA medium overnight, from which 3 mL was used to inoculate 300 mL of LBA medium. The cells were cultured at 37 °C until the OD600 value reached 0.6, after which 0.4 mM IPTG was added to induce protein expression. The solution was incubated for an additional 16 h at 16 °C, followed by centrifugation at 8000g for 20 min at 4 °C. The pellet was resuspended in 10 mL of binding/washing buffer containing 50 mM phosphate, 0.3 M sodium chloride, and 5 mM imidazole (pH 7.4) followed by sonication. After centrifugation at 8000g for 20 min at 4 °C, the supernatant was incubated with 0.3 mL of Ni-NTA Sefinose Resin on a rotating wheel for 60 min at 4 °C, and the resin was washed three times with 25 mL of washing buffer. After adding 4 mL of elution buffer (50 mM phosphate, 0.3 M NaCl, and 0.5 M imidazole (pH 7.4)), the eluent was collected using a disposable gravity column. Protein expression and purification were confirmed by SDS-PAGE.31
4.4. Fluorescence Labeling and Purification
Q-body preparation was carried out as reported previously.30 TCEP was added to 1 μM Ada-Fab solution (100 μL) at a final concentration of 0.5 mM. The protein solution was rotated in the dark for 20 min before 4-azidobenzoic acid was added at a final concentration of 2 mM and incubated for 10 min on ice to degrade TCEP as previously reported by Henkel et al. with some modifications.32 6-TAMRA-C2-maleimide or ATTO520-C2-maleimide was added to Fab solutions at a final concentration of 10 μM and rotated in the dark for 2 h at 4 °C. Anti-DYKDDDDK antibody beads (10 μL) were added to the tube to purify the Q-bodies. After incubation at 4 °C for 1 h, the beads were washed 10 times by centrifugation at 8000g for 15 s at 4 °C with 1 mL of Flag wash buffer (20 mM phosphate, 0.5 M NaCl, and 0.1% polyoxyethylene(23)lauryl ether (pH 7.4)) each time and incubated with 100 μL of Flag wash buffer containing 15 μg of Flag peptide at 4 °C. After 1 h, the eluent was collected and stored at 4 °C. An aliquot (3 μL) of each was mixed with 3 μL of SDS loading buffer (0.125 M Tris–HCl, 4% SDS, 20% glycerol, 0.01% bromophenol blue, and 100 mM dithiothreitol (pH 6.8)), boiled at 95 °C for 10 min, and applied to a 12% gel for SDS-PAGE. Fluorescence images were obtained using a transilluminator with excitation at 500 nm (Gelmiére; Wako Pure Chemicals), and the protein concentration was measured using a NanoPhotometer (IMPLEN, Germany).
4.5. Enzyme-Linked Immunosorbent Assay
ELISA was conducted to detect the reactivity of Ada Fab and Q-bodies against TNF-α. Briefly, TNF-α (100 μL, 1.0 μg/mL) was used to coat each well of a 96-well microtiter plate. After blocking at 25 °C for 2 h with PBS containing 2% skimmed milk (MPBS), the wells were washed three times with PBST. UQ1H-Fab, QB1-ATTO, QB1-TMR, UQ2GS-Fab, QB2-ATTO, and QB2-TMR dissolved in MPBS (1.0 μg/mL) were added to the ELISA plate separately as primary antibodies. After incubation for 1 h followed by washing five times with PBST, HRP-conjugated anti-FLAG monoclonal antibody diluted 5000-fold in MPBS was added to each well and incubated at 25 °C for 1 h. After washing with PBST five times, the signal was developed by adding TMBZ solution (100 μg/mL 3,3,5,5-tetramethylbenzidine (Sigma) and 0.04 μL/mL H2O2 in 100 mM NaOAc (pH 6.0)), and the reaction was stopped by adding 50 μL of 10% sulfuric acid to each well. The absorbance was measured using an iMark Microplate Reader (Bio-Rad) at 450 nm with 630 nm as a control.
A competitive ELISA employing UQ2GS-Fab was carried out to quantify TNF-α. Briefly, TNF-α at 2.0 μg/mL was coated on wells of a 96-well microtiter plate. After blocking, mixtures of UQ2GS-Fab with TNF-α at concentrations of 0, 0.038, 0.15, 0.6, 2.4, 9.8, 39.0, 156.0, 625.0, 2500, and 10,000 ng/mL were added and incubated. After washing, HRP-conjugated anti-FLAG monoclonal antibody was added to each well, and then the assay was carried out as described previously. The LOD was the antigen concentration corresponding to the mean blank absorbance minus 3 times the standard deviation (n = 3).
4.6. Fluorescence Measurements
The purified Q-body was diluted with 800 μL of PBST to a final concentration of 10 nM, poured into a 10 × 3 mm quartz cell (Starna Scientific, Hainault, UK), and the fluorescence spectrum was determined using a fluorescence spectrophotometer (Model FP-4600; HITACHI, Tokyo, Japan) at 25 °C. To evaluate the initial quenching of the Q-body, 800 μL of GdnHCl/DTT was added to the Q-body stock instead of PBST to the cell, and the fluorescence was measured after incubation for 5 min. The excitation wavelength used was 546 nm for TAMRA-labeled Q-bodies and 520 nm for ATTO520 labeled Q-bodies, with slit widths set to 5.0 nm. For antigen detection, human TNF-α was added to samples at final concentrations of 0, 1.21, 4.24, 10.3, 24.2, 72.7, 133, 254, and 497 ng/mL for QB2-ATTO or 0, 0.25, 1.25, 2.50, 38, 75, 125, and 250 ng/mL for QB2-TMR. The fluorescence spectra were measured after incubation for 5 min. Dose–response curves were constructed by fitting the intensities at the maximum emission wavelength for each Q-body using GraphPad Prism 8 (GraphPad Software, San Diego, CA, USA). EC50 and LOD values were calculated from the curve fitting to a four-parameter logistic equation. The LOD value was obtained as the estimated antigen concentration showing the mean blank fluorescence intensity plus three times the standard deviation (n = 3).
Acknowledgments
The authors are partly supported by the National Natural Science Foundation of China (21775064), the Science and Technology Planning Project of Weifang City, Shandong Province of China (2020YQFK014), the Medical and Health Technology Development Program of Shandong Province (2019WS591), and the COVID-2019 Prevention and Treatment Project of Weifang Medical University (2020YJXM13). This work was partly supported by the Tokyo Tech World Research Hub Initiative (WRHI) Program of Institute of Innovative Research, Tokyo Institute of Technology.
Supporting Information Available
The Supporting Information is available free of charge at https://pubs.acs.org/doi/10.1021/acsomega.1c03941.
(Figure S1) Amino acid sequence of UQ1H-Fab; (Figure S2) absorption spectra of QB1-TMR, QB2-TMR, QB1-ATTO and QB2-ATTO (PDF)
The authors declare no competing financial interest.
Supplementary Material
References
- Olszewski M. B.; Groot A. J.; Dastych J.; Knol E. F. TNF Trafficking to Human Mast Cell Granules: Mature Chain-Dependent Endocytosis. J. Immunol. 2007, 178, 5701–5709. 10.4049/jimmunol.178.9.5701. [DOI] [PubMed] [Google Scholar]
- Horiuchi T.; Mitoma H.; Harashima S.; Tsukamoto H.; Shimoda T. Transmembrane TNF-alpha: structure, function and interaction with anti-TNF agents. Rheumatology (Oxford) 2010, 49, 1215–1228. 10.1093/rheumatology/keq031. [DOI] [PMC free article] [PubMed] [Google Scholar]
- Liu Y.; Kwa T.; Revzin A. Simultaneous detection of cell-secreted TNF-alpha and IFN-gamma using micropatterned aptamer-modified electrodes. Biomaterials 2012, 33, 7347–7355. 10.1016/j.biomaterials.2012.06.089. [DOI] [PMC free article] [PubMed] [Google Scholar]
- Feuerstein G. Z.; Liu T.; Barone F. C. Cytokines, inflammation, and brain injury: role of tumor necrosis factor-alpha. Cerebrovasc. Brain Metab. Rev. 1994, 6, 341–360. [PubMed] [Google Scholar]
- Perrya R. T.; Collinsb J. S.; Wienera H.; Actonc R.; Go R. C. P. The role of TNF and its receptors in Alzheimer’s disease. Neurobiol. Aging 2001, 22, 873–883. 10.1016/S0197-4580(01)00291-3. [DOI] [PubMed] [Google Scholar]
- Arya S. K.; Estrela P. Electrochemical immunosensor for tumor necrosis factor-alpha detection in undiluted serum. Methods 2017, 116, 125–131. 10.1016/j.ymeth.2016.12.001. [DOI] [PubMed] [Google Scholar]
- Wang J.; Liu G.; Engelhard M. H.; Lin Y. Sensitive immunoassay of a biomarker tumor necrosis factor-α based on poly (guanine)-functionalized silica nanoparticle label. Anal. Chem. 2006, 78, 6974–6979. 10.1021/ac060809f. [DOI] [PubMed] [Google Scholar]
- Kongsuphol P.; Ng H. H.; Pursey J. P.; Arya S. K.; Wong C. C.; Stulz E.; Park M. K. EIS-based biosensor for ultra-sensitive detection of TNF-alpha from non-diluted human serum. Biosens. Bioelectron. 2014, 61, 274–279. 10.1016/j.bios.2014.05.017. [DOI] [PubMed] [Google Scholar]
- Huang R.; Xi Z.; Deng Y.; He N. Fluorescence based Aptasensors for the determination of hepatitis B virus e antigen. Sci. Rep. 2016, 6, 31103. 10.1038/srep31103. [DOI] [PMC free article] [PubMed] [Google Scholar]
- Luchansky M. S.; Bailey R. C. Rapid, multiparameter profiling of cellular secretion using silicon photonic microring resonator arrays. J. Am. Chem. Soc. 2011, 133, 20500–20506. 10.1021/ja2087618. [DOI] [PMC free article] [PubMed] [Google Scholar]
- Mori T.; Oguro A.; Ohtsu T.; Nakamura Y. RNA aptamers selected against the receptor activator of NF-kappaB acquire general affinity to proteins of the tumor necrosis factor receptor family. Nucleic Acids Res. 2004, 32, 6120–6128. 10.1093/nar/gkh949. [DOI] [PMC free article] [PubMed] [Google Scholar]
- Yin Z.; Liu Y.; Jiang L. P.; Zhu J. J. Electrochemical immunosensor of tumor necrosis factor alpha based on alkaline phosphatase functionalized nanospheres. Biosens. Bioelectron. 2011, 26, 1890–1894. 10.1016/j.bios.2010.03.025. [DOI] [PubMed] [Google Scholar]
- Singh M.; Alabanza A.; Gonzalez L. E.; Wang W.; Reeves W. B.; Hahm J. I. Ultratrace level determination and quantitative analysis of kidney injury biomarkers in patient samples attained by zinc oxide nanorods. Nanoscale 2016, 8, 4613–4622. 10.1039/C5NR08706F. [DOI] [PMC free article] [PubMed] [Google Scholar]
- Eletxigerra U.; Martinez-Perdiguero J.; Merino S.; Villalonga R.; Pingarron J. M.; Campuzano S. Amperometric magnetoimmunoassay for the direct detection of tumor necrosis factor alpha biomarker in human serum. Anal. Chim. Acta 2014, 838, 37–44. 10.1016/j.aca.2014.05.047. [DOI] [PubMed] [Google Scholar]
- Huang Y. C.; Chiang C. Y.; Li C. H.; Chang T. C.; Chiang C. S.; Chau L. K.; Huang K. W.; Wu C. W.; Wang S. C.; Lyu S. R. Quantification of tumor necrosis factor-alpha and matrix metalloproteinases-3 in synovial fluid by a fiber-optic particle plasmon resonance sensor. Analyst 2013, 138, 4599–4606. 10.1039/c3an00276d. [DOI] [PubMed] [Google Scholar]
- Dai S.; Feng C.; Li W.; Jiang W.; Wang L. Quantitative detection of tumor necrosis factor-alpha by single molecule counting based on a hybridization chain reaction. Biosens. Bioelectron. 2014, 60, 180–184. 10.1016/j.bios.2014.04.016. [DOI] [PubMed] [Google Scholar]
- Abe R.; Ohashi H.; Iijima I.; Ihara M.; Takagi H.; Hohsaka T.; Ueda H. ″Quenchbodies″: quench-based antibody probes that show antigen-dependent fluorescence. J. Am. Chem. Soc. 2011, 133, 17386–17394. 10.1021/ja205925j. [DOI] [PubMed] [Google Scholar]
- Zhao S.; Dong J.; Jeong H. J.; Okumura K.; Ueda H. Rapid detection of the neonicotinoid insecticide imidacloprid using a quenchbody assay. Anal. Bioanal. Chem. 2018, 410, 4219–4226. 10.1007/s00216-018-1074-y. [DOI] [PubMed] [Google Scholar]
- Jeong H. J.; Itayama S.; Ueda H. A signal-on fluorosensor based on quench-release principle for sensitive detection of antibiotic rapamycin. Biosensors (Basel) 2015, 5, 131–140. 10.3390/bios5020131. [DOI] [PMC free article] [PubMed] [Google Scholar]
- Dong J.; Jeong H. J.; Ueda H. Preparation of Quenchbodies by protein transamination reaction. J. Biosci. Bioeng. 2016, 122, 125–130. 10.1016/j.jbiosc.2015.12.010. [DOI] [PubMed] [Google Scholar]
- Dong J.; Fujita R.; Zako T.; Ueda H. Construction of Quenchbodies to detect and image amyloid beta oligomers. Anal. Biochem. 2018, 550, 61–67. 10.1016/j.ab.2018.04.016. [DOI] [PubMed] [Google Scholar]
- Jeong H. J.; Dong J.; Ueda H. Single-Step Detection of the Influenza Virus Hemagglutinin Using Bacterially-Produced Quenchbodies. Sensors (Basel) 2019, 19, 52. 10.3390/s19010052. [DOI] [PMC free article] [PubMed] [Google Scholar]
- Dong J.; Oka Y.; Jeong H. J.; Ohmuro-Matsuyama Y.; Ueda H. Detection and destruction of HER2-positive cancer cells by Ultra Quenchbody-siRNA complex. Biotechnol. Bioeng. 2020, 117, 1259–1269. 10.1002/bit.27302. [DOI] [PubMed] [Google Scholar]
- Renard M.; Belkadi L.; Hugo N.; England P.; Altschuh D.; Bedouelle H. Knowledge-based Design of Reagentless Fluorescent Biosensors from Recombinant Antibodies. J. Mol. Biol. 2002, 318, 429–442. 10.1016/S0022-2836(02)00023-2. [DOI] [PubMed] [Google Scholar]
- Dandliker W. B.; Kelly R. J.; Dandliker J.; Farquhar J.; Levin J. Fluorescence polarization immunoassay Theory and experimental method. Immunochemistry 1973, 10, 219–227. 10.1016/0019-2791(73)90198-5. [DOI] [PubMed] [Google Scholar]
- Rau R. Adalimumab (a fully human anti-tumour necrosis factor alpha monoclonal antibody) in the treatment of active rheumatoid arthritis: the initial results of five trials. Ann. Rheum. Dis. 2002, 61, ii70-3. 10.1136/ard.61.suppl_2.ii70. [DOI] [PMC free article] [PubMed] [Google Scholar]
- Scheinfeld N. Adalimumab (HUMIRA): a review. J. Drugs Dermatol. 2003, 2, 375–377. [PubMed] [Google Scholar]
- Abe R.; Shiraga K.; Ebisu S.; Takagi H.; Hohsaka T. Incorporation of fluorescent non-natural amino acids into N-terminal tag of proteins in cell-free translation and its dependence on position and neighboring codons. J. Biosci. Bioeng. 2010, 110, 32–38. 10.1016/j.jbiosc.2010.01.003. [DOI] [PubMed] [Google Scholar]
- Ogawa M.; Kosaka N.; Choyke P. L.; Kobayashi H. H-type dimer formation of fluorophores: a mechanism for activatable, in vivo optical molecular imaging. ACS Chem. Biol. 2009, 4, 535–546. 10.1021/cb900089j. [DOI] [PMC free article] [PubMed] [Google Scholar]
- Jeong H. J.; Kawamura T.; Iida M.; Kawahigashi Y.; Takigawa M.; Ohmuro-Matsuyama Y.; Chung C. I.; Dong J.; Kondoh M.; Ueda H. Development of a Quenchbody for the Detection and Imaging of the Cancer-Related Tight-Junction-Associated Membrane Protein Claudin. Anal. Chem. 2017, 89, 10783–10789. 10.1021/acs.analchem.7b02047. [DOI] [PubMed] [Google Scholar]
- Laemmli U. K. Cleavage of structural proteins during the assembly of the head of bacteriophage T4. Nature 1970, 227, 680–685. 10.1038/227680a0. [DOI] [PubMed] [Google Scholar]
- Henkel M.; Rockendorf N.; Frey A. Selective and Efficient Cysteine Conjugation by Maleimides in the Presence of Phosphine Reductants. Bioconjugate Chem. 2016, 27, 2260–2265. 10.1021/acs.bioconjchem.6b00371. [DOI] [PubMed] [Google Scholar]
Associated Data
This section collects any data citations, data availability statements, or supplementary materials included in this article.


