

Abstract
The insulin-degrading enzyme (IDE) is a metalloendopeptidase with a high affinity for insulin. Human genetic polymorphisms in Ide have been linked to increased risk for T2DM. In mice, hepatic Ide ablation causes glucose intolerance and insulin resistance when mice are fed a regular diet.
Objective:
These studies were undertaken to further investigate its regulatory role in glucose homeostasis and insulin sensitivity in diet-induced obesity.
Methods:
To this end, we have compared the metabolic effects of loss versus gain of IDE function in mice fed a high-fat diet (HFD).
Results:
We demonstrate that loss of IDE function in liver (L-IDE-KO mouse) exacerbates hyperinsulinemia and insulin resistance without changes in insulin clearance but in parallel to an increase in pancreatic β-cell function. Insulin resistance was associated with increased FoxO1 activation and a ~2-fold increase of GLUT2 protein levels in the liver of HFD-fed mice in response to an intraperitoneal injection of insulin. Conversely, gain of IDE function (adenoviral delivery) improves glucose tolerance and insulin sensitivity, in parallel to a reciprocal ~2-fold reduction in hepatic GLUT2 protein levels. Furthermore, in response to insulin, IDE co-immunoprecipitates with the insulin receptor in liver lysates of mice with adenoviral-mediated liver overexpression of IDE.
Conclusions:
We conclude that IDE regulates hepatic insulin action and whole-body glucose metabolism in diet-induced obesity via insulin receptor levels.
Keywords: Insulin-degrading enzyme, High-fat diet, Diabetes, Hepatic insulin resistance, Insulin receptor, Glucose transporters
1. Introduction
Insulin-degrading enzyme (IDE), a zinc-metalloendopeptidase that degrades insulin and glucagon, among other intermediate-size peptides, is primarily expressed in the cytoplasm of both insulin-responsive and non-responsive cell types [1–4]. Because of its high affinity and ability to degrade insulin, IDE had long been presumed to play a major role in hepatic insulin clearance, a physiological process that removes up to 80% of secreted insulin during its first passage through the liver [1]. This notion was supported by the development of chronic hyperinsulinemia in mice with pancellular deletion of Ide (IDE-KO) [5]. Consistent with hyperinsulinemia causing insulin resistance [1,6], this mouse model also developed marked glucose intolerance and insulin resistance.
Genetic polymorphisms within or near the Ide locus have been linked to increased risk for type 2 diabetes mellitus (T2DM) [7–9]. In addition, there is an association between reduced IDE levels and lower insulin clearance in T2DM patients [10–12]. The precise cause of T2DM remains incompletely understood, but insulin resistance, β-cell function, and insulin clearance have been identified as major culprits.
To delve more deeply into the IDE’s role in the pathogenesis of hepatic insulin action and glucose homeostasis, we generated a novel mouse model with exclusive ablation of Ide in hepatocytes (L-IDE-KO). This mouse model uncovered an important role for IDE in regulating insulin sensitivity in hepatocytes [13]. L-IDE-KO mice exhibited glucose intolerance and insulin resistance, but surprisingly hepatic insulin clearance was unaffected. Furthermore, levels of insulin receptor (IR) and its activation in response to insulin were diminished in L-IDE-KO hepatocytes, in parallel to a marked reduction in the phosphorylation of carcinoembryonic antigen-related cell adhesion molecule 1 (CEACAM1), which promotes receptor-mediated insulin uptake [13]. These observations provided the impetus for a novel conceptual model postulating a non-proteolytic function for IDE in the regulation of hepatic insulin action by cooperating with CEACAM1 in targeting the insulin-IR complex between intracellular compartments [1,13].
In humans, IDE is expressed in pancreatic β- and α-cells, with higher expression in α-cells [14]. In T2DM, IDE protein levels in β-cells are reduced, but are upregulated by insulin treatment [14]. Interestingly, targeted ablation of Ide in pancreatic β-cells in vivo (B-IDE-KO mice) [15] led to constitutive increase in glucose-stimulated insulin secretion in parallel to upregulation of the high-affinity glucose transporter GLUT1 from isolated mouse islets and in plasma C-peptide levels of B-IDE-KO mice [15]. This proposed that IDE is required for functional β-cell maturity [15].
To further investigate the physiological role of IDE in hepatocytes, we fed mice a high-fat diet (HFD) and examined the impact of loss versus gain of IDE function on insulin action and glucose metabolism in liver.
2. Material and methods
2.1. Mouse studies
Four- to five-week-old male Ideflox/flox;+/+ mice (henceforth, wildtype-WT) and Ideflox/flox;Alb-Cre/+ (L-IDE-KO) mice were fed standard rodent chow diet (SD) or a high-fat diet (HFD; Research Diets D12451, 35% carbohydrates, 45% fat) for 16 weeks. Intraperitoneal glucose tolerance tests (IP-GTT) were conducted after 14 weeks of HFD feeding, and insulin tolerance tests (IP-ITT) after 15 weeks. Hepatic insulin clearance (under conditions of fasting-refeeding transition) was assessed after 13 weeks of HFD feeding, whereas hepatic insulin clearance (under conditions of steady-state), in the week 16. Afterwards, mice were euthanized, blood collected, and tissues were snap-frozen in liquid nitrogen.
For experiments with adenoviral vectors, four-week-old male C57BL/6J mice were fed a HFD for 4 weeks before adenovirus delivery. Afterwards, mice were maintained on HFD for 2 additional weeks. IP-GTT was assessed after 5 weeks of HFD feeding, whereas IP-ITT and hepatic insulin clearance (under conditions of steady-state) were assessed in the week 6. Afterwards, mice were euthanized, blood collected, and tissues were snap-frozen in liquid nitrogen.
Mice were housed in ventilated cages under a 12:12-h light-dark cycle, and water ad libitum, at the animal facility of the University of Valladolid (UVa). L-IDE-KO mice were generated and genotyped as we previously described [13]. The Animal Care and Use Committee of the UVa approved all experiments (protocol #5003931).
2.2. Plasma biochemistry, hepatic content of triglycerides, and hepatic glycogen content
Fasting (18 h) and non-fasting (fed ad libitum) blood glucose, and plasma triglycerides, cholesterol, insulin, C-peptide, and glucagon levels were assessed as we previously described [13]. Hepatic triglyceride content was assessed as we previously described [16], and hepatic glycogen content was assessed using the Glycogen Assay Kit (Sigma-Aldrich, USA) [13].
2.3. Glucose homeostasis, insulin sensitivity, and insulin clearance studies
To evaluate alterations in glucose homeostasis and insulin sensitivity in vivo, we performed IP-GTT and IP-ITT, respectively, as described [13,17]. Hepatic plasma insulin clearance was assessed in two different ways: 1) as the steady-state C-peptide/insulin molar ratio, previously described by our group [13]. To achieve the steady-state, mice were fasted from 18:00 PM until 11:00 AM the next morning. 2) During the fasting-refeeding transition, as described by Kurauti et al. [18,19] with some modifications, briefly, littermate mice were fasted overnight, refed and blood samples drawn from tail vein at times 0, 60 and 180 min. Plasma insulin and C-peptide levels were assessed as described in Section 2.2. Then, the C-peptide/insulin molar ratio was calculated for each time point, and the area under the curve (AUC) at times 0–60 min (AUC0–60), and 60–180 min (AUC60–180) was calculated as a measure of insulin clearance.
To analyze the impact of IDE loss and gain of function on hepatic insulin signaling, mice were fasted overnight, then administered an i.p injection of a bolus of insulin (1.5 U/kg) or saline solution, and ten minutes later, mice were euthanized, and tissues were dissected as we previously described [13,20].
2.4. Quantitative real-time PCR
Total RNA isolation and cDNA synthesis were performed as described [13]. mRNA levels were determined by real time qPCR with TaqMan® or SYBR® Green probe-based assays on a LightCycler® 480 instrument (Roche) using the 2−ΔΔCt relative quantification method [21]. TaqMan® Gene Expression assay references (from Applied Biosystems, USA) were as follows: Mm00473077_m1 for Ide, Mm01247058_m1 for phosphoenolpyruvate carboxykinase (Pck1), and Mm00839363_m1 for glucose-6 phosphatase (G6pc). Primers sequences used for SYBR Green quantitative RT-PCR are in Supplementary Table 1. Expression data were normalized to the level of the housekeeping gene of the ribosomal protein L18 (RPL18; Forward: 5′-AAGACTGCCGTGGTTGTGG-3′; Reverse: 5′-AGCCTTGAGGATGCGACTC-3′; Probe: 5′-FAM-TTCCCAAGCTGAAGGT GTGTGCA-BHQ1–3′).
2.5. Western blot analysis and co-immunoprecipitation
Western blot analyses on isolated mouse tissues, and subcellular localization of FoxO1 were performed as described [13]. Rabbit anti-FoxO1 antibody was used as described by Qu et al. [22]. For co-immunoprecipitation experiments, polyclonal antibodies against IDE (#AB9210, Millipore, USA) and insulin receptor (#3025, Cell Signaling, USA) were used to immunoprecipitate proteins from tissue lysates as previously described [13].
2.6. Mouse islets isolation, analysis of β-cell function, and pancreatic histomorphometry
Mouse islets were isolated by pancreatic duct perfusion with collagenase IV (Sigma-Aldrich, USA) and purified as previously reported [15]. Afterwards, glucose-stimulated insulin secretion (GSIS) was assessed as described [15]. To assess β-cell function in vivo, mice were fasted overnight followed by an i.p. injection of a bolus of glucose and blood samples were drawn for 30 min. Afterwards, plasma insulin levels were measured as described above. Then, mice were euthanized and pancreata dissected, fixed in 10% neutral buffer formalin, paraffin embedded, and sectioned [15]. For islets histomorphometry, sections were stained with anti-insulin antibody (Abcam, UK). β-cell mass, the number of islets, and the mean islets size were quantitated using the ImageJ software (NIH, USA) as described [13,15].
2.7. Adenoviral vector construction and delivery
Human Ide cDNA was purchased from ImaGenes GmbH (Berlin, Germany). Ide was amplified using primers flanking the Ide cDNA for forward reaction (5′-AGCGTTTGCGGTGATCCCGG-3′) and reverse reaction (5′-CATGCATGGGAAAGTGCAAGTGG-3′), and then cloned into the adenoviral shuttle plasmid pTG6600. IDE adenoviral vector (Ad.IDE) and the control adenovirus null (Ad.null) were generated by the United Vector Production Unit (Autonomous University of Barcelona). Adenoviruses (5 × 10¹² viral particles/kg of body weight), diluted in PBS (100 μL), were administered via retro-orbital injection as described [16].
2.8. Statistical analyses
Statistical analysis was performed using Prism v. 6.0 (GraphPad Software, Inc., USA). Normality of data was checked with the Kolmogorov-Smirnov test. Data are presented as means ± SEM. Comparisons between two groups were done using the unpaired Student’s t-test. Comparisons between more than two groups were done using the one-way ANOVA. Differences were considered significant at p < 0.05.
3. Results
3.1. Loss of hepatic IDE function exacerbates glucose intolerance and insulin resistance in HFD-induced obese mice
To decipher the contribution of IDE to whole-body glucose homeostasis and insulin sensitivity in the setting of obesity, WT and L-IDE-KO mice were fed a HFD for 16 weeks. L-IDE-KO mice exhibited a significant exacerbation of glucose intolerance and a trend toward worsening of insulin resistance as compared to WT mice (Fig. 1A–E). These changes in glucose homeostasis and insulin sensitivity were not correlated with an increase in body weight, body weight gain, adipose tissue weight or food intake (Fig. 1F–I). In addition, fasting and non-fasting blood glucose levels were similar between WT and L-IDE-KO mice (Fig. 1J–K).
Fig. 1.
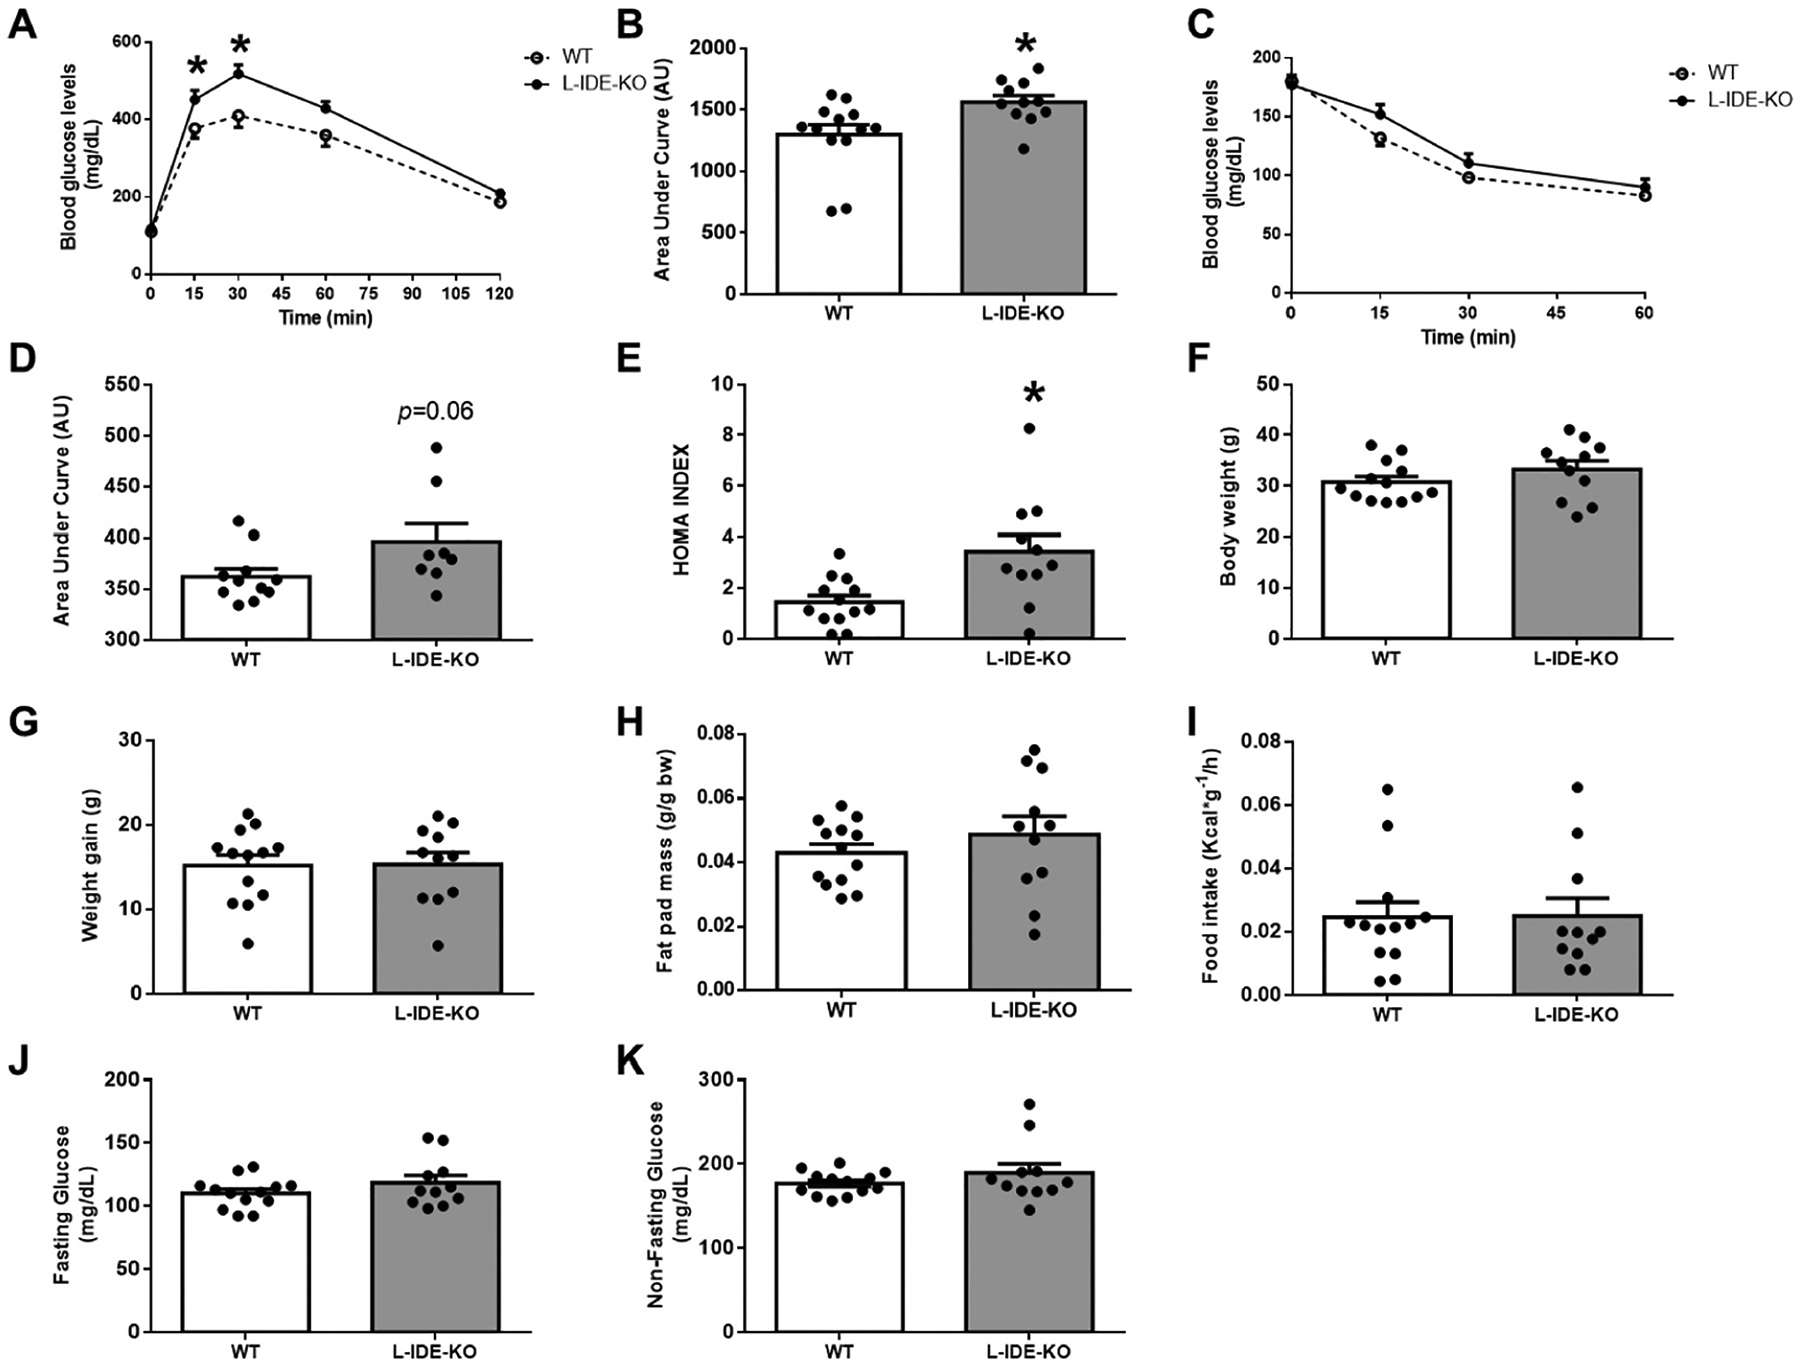
Metabolic features of L-IDE-KO in high-fat obese mice. WT and L-IDE-KO mice were fed high-fat diet (HFD) for 16 weeks, and glucose homeostasis and insulin sensitivity were assessed. (A) IP-GTT and area under the curve (AUC) (B). IP-ITT (C) and AUC (D). HOMA index (E). Body weight (F). Weight gain (G). Fat pad mass (H). Food intake (I). Fasting (J) and non-fasting (K) plasma glucose levels. Data are mean ± SEM. n = 8–13 per genotype. *p value <0.05 vs. WT by Student’s t-test or ANOVA.
L-IDE-KO mice exhibited significantly increased fasting and non-fasting plasma insulin levels (Fig. 2A–B) as compared to WT mice, with a trend toward, but non-statistically significant, increase in fasting and non-fasting plasma C-peptide levels (Fig. 2C–D). In contrast, fasting and non-fasting plasma glucagon levels remained unchanged between L-IDE-KO and WT mice fed HFD (Fig. 2E–F).
Fig. 2.
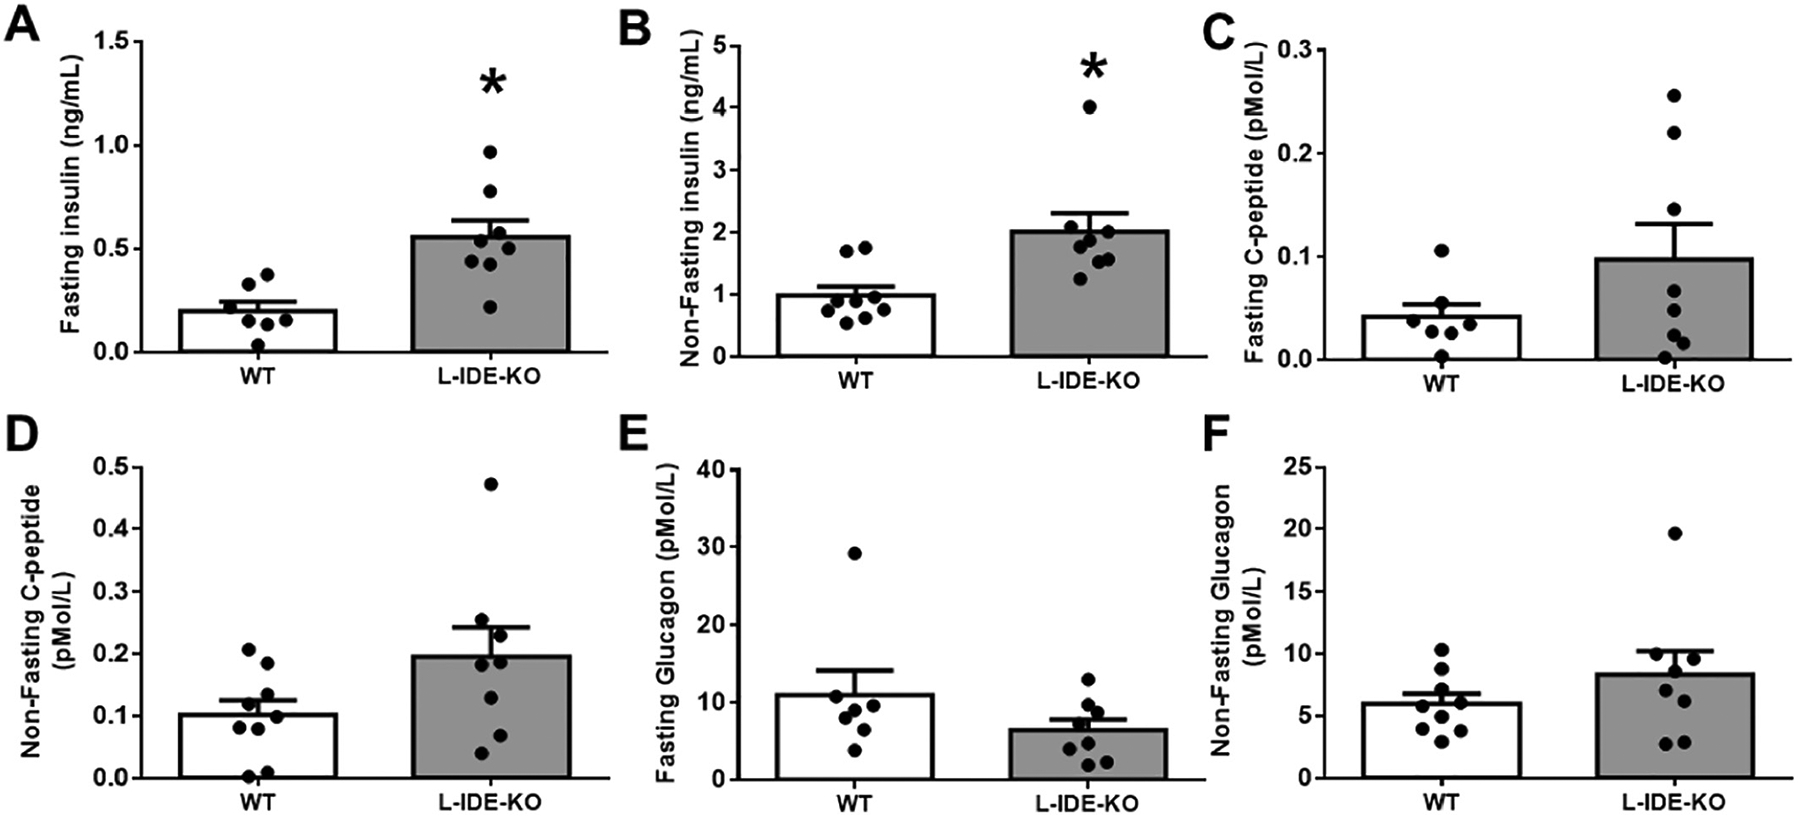
Hepatic ablation of Ide augments plasma insulin and C-peptide levels, without altering plasma glucagon levels. Fasting (A) and non-fasting (B) plasma insulin levels in WT and L-IDE-KO mice. Fasting (C) and non-fasting C-peptide levels (D). Fasting (E) and non-fasting glucagon levels (F). Data are mean ± SEM. n = 7–13 per genotype. *p value <0.05 vs. WT by Student’s t-test.
L-IDE-KO mice showed similar rates of insulin clearance as WT mice as measured by steady-state C-peptide/insulin molar ratio (Fig. 3A). During the fasting-refeeding transition, L-IDE-KO mice exhibited statistically significant increases in plasma insulin and C-peptide levels (Fig. 3B–C). However, L-IDE-KO and WT mice showed similar rates of insulin clearance as measured by C-peptide/insulin molar ratio during fasting-refeeding transition (Fig. 3D–G). These observations suggest that elevated plasma insulin levels in L-IDE-KO mice are likely related to improved β-cell function rather than changes in hepatic insulin clearance. Histomorphometry analyses of pancreas from WT and L-IDE-KO mice showed that β-cell mass, islets number, and islets size were similar in both genotypes (Supplementary Fig. 1A–D). Next, we assessed ex vivo β-cell function in WT and L-IDE-KO isolated islets. L-IDE-KO mice exhibited higher insulin content and insulin secretion per islet than WT mice (Supplementary Fig. 1E–F). Taken together these results indicate that β-cell function, but not mass, is improved in L-IDE-KO compared to WT mice, most likely as a compensatory response to insulin resistance triggered by loss of hepatic IDE function.
Fig. 3.
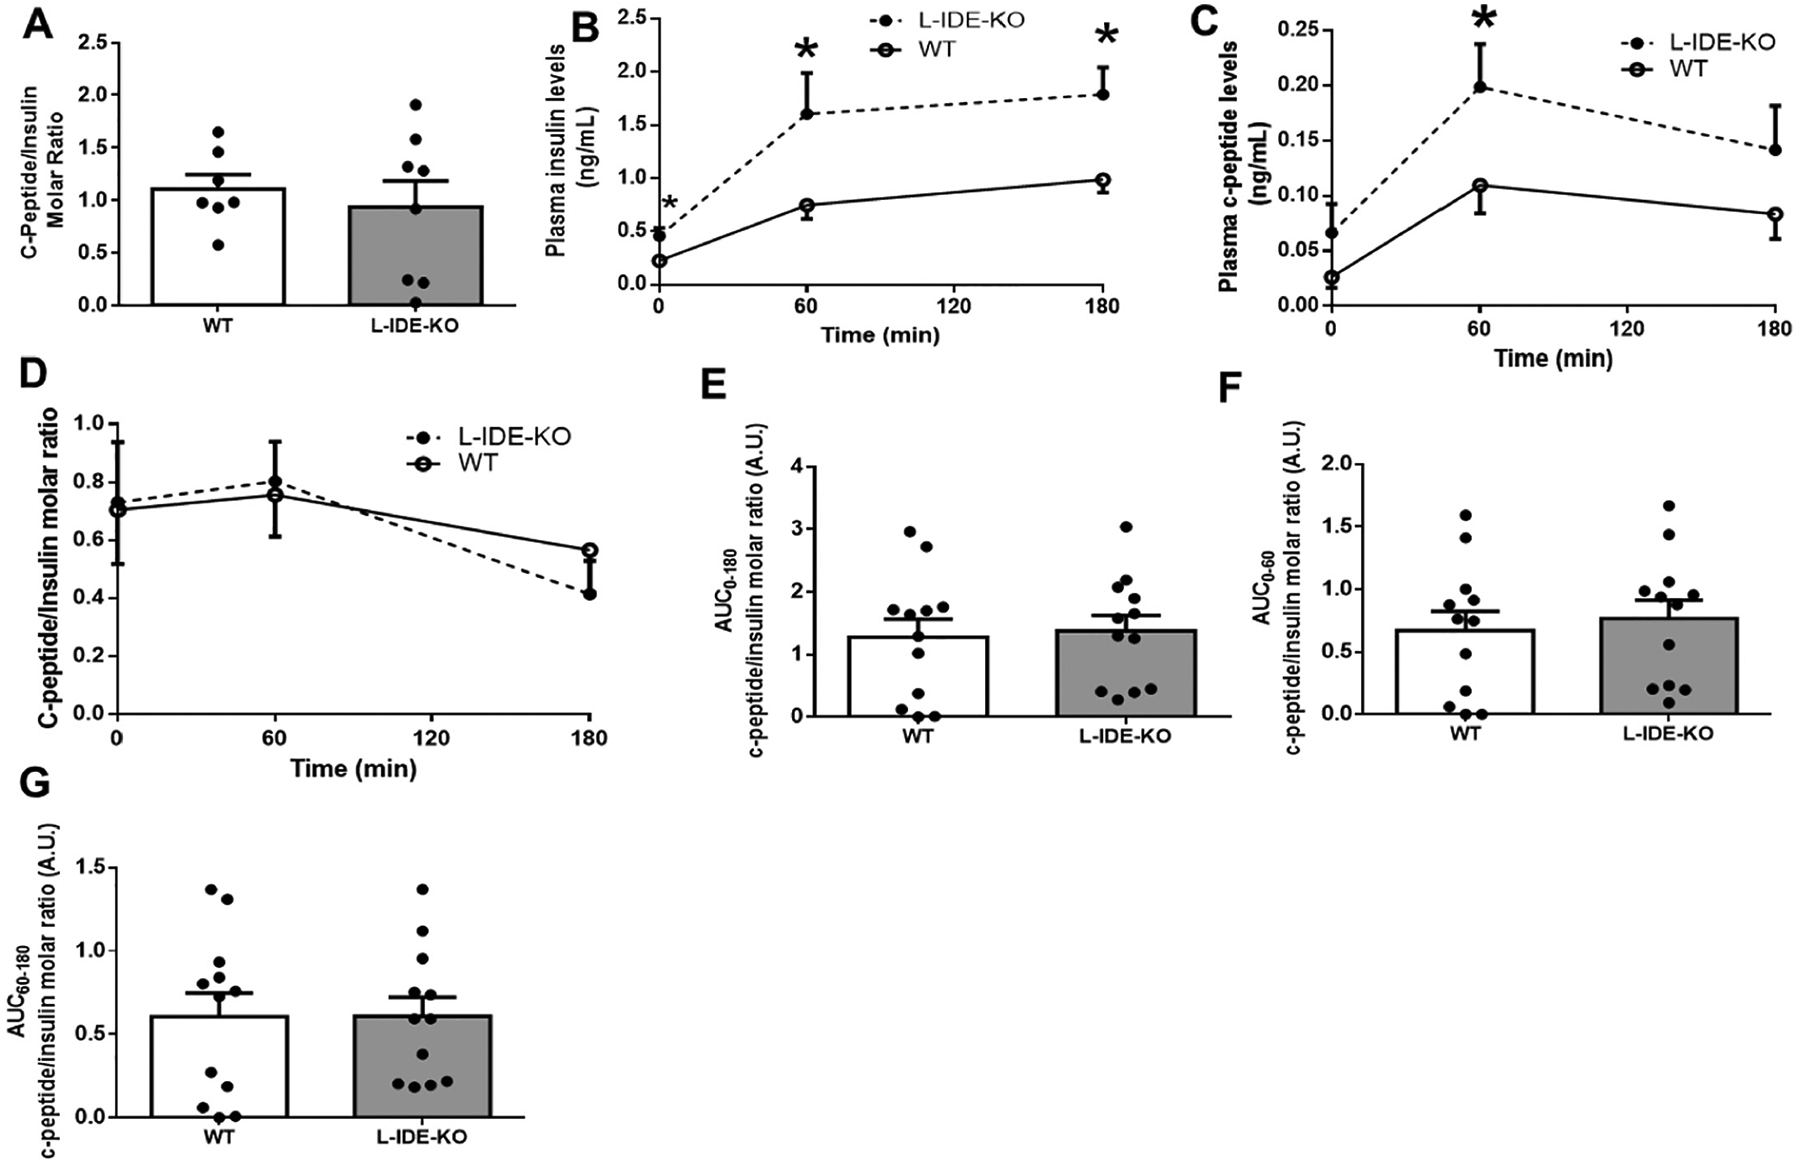
Hepatic insulin clearance in high-fat obese L-IDE-KO mice. (A) Hepatic insulin clearance measured as the steady-state C-peptide/insulin molar ratio in WT and L-IDE-KO. Data are mean ± SEM. n = 7 per genotype. (B-G) Hepatic insulin clearance measured during the fasting-refeeding transition. (B) Plasma insulin levels. (C) Plasma C-peptide levels. (D) C-peptide/insulin molar ratio in WT and L-IDE-KO mice. (E) AUC between 0 and 180 min of the C-peptide/insulin molar ratio in WT and L-IDE-KO mice. (F) AUC between 0 and 60 min of the C-peptide/insulin molar ratio in WT and L-IDE-KO mice. (G) AUC between 60 and 180 min of the C-peptide/insulin molar ratio in WT and L-IDE-KO mice. Data are mean ± SEM. n = 12 per genotype. *p value <0.05 vs. WT by Student’s t-test.
3.2. Impact of loss of hepatic IDE function on liver insulin signaling and glucose transporters in HFD-induced obese mice
To examine whether insulin resistance observed in L-IDE-KO mice is associated with altered lipid metabolism, we analyzed circulating and hepatic lipid content. As shown in Supplementary Fig. 2A–C, fasting plasma triglycerides, FFAs, and cholesterol levels were comparable in L-IDE-KO and WT mice. However, L-IDE-KO mice exhibited lower hepatic triglyceride content compared to WT mice (Supplementary Fig. 2D). Unaltered expression of lipogenic genes Fasn and Srebp-1c with elevated expression of genes involved in transporting lipid into hepatocytes (Fatp1 and Fatp4) and mitochondria for fatty acid β-oxidation (Cpt1a) in L-IDE-KO mice (Supplementary Fig. 2E–I) suggest that lower hepatic triglyceride accumulation is likely caused by increased β-oxidation. These observations rule out any role for lipid homeostasis in the observed insulin resistance in L-IDE-KO mice.
We had previously reported that liver-specific Ide ablation significantly lowered insulin receptor (IR) protein and phosphorylation levels in liver, leading to compromised intracellular insulin signaling [13]. L-IDE-KO mice exhibited lower hepatic IR protein levels compared to control mice (Fig. 4A–B). Similarly, phosphorylation of IR was reduced, although the decrease did not reach statistical significance (Fig. 4A,C). Interestingly, in L-IDE-KO, insulin stimulation reduced total hepatic AKT1 protein levels by ~75% (Fig. 4A,E). In contrast, insulin stimulation did not affect overall AKT2 levels or its phosphorylation in the liver of mutant mice (Fig. 4A,J–L). Taken together, these results demonstrate that ablation of Ide in liver of mice fed a HFD results in decreased intracellular insulin signaling.
Fig. 4.
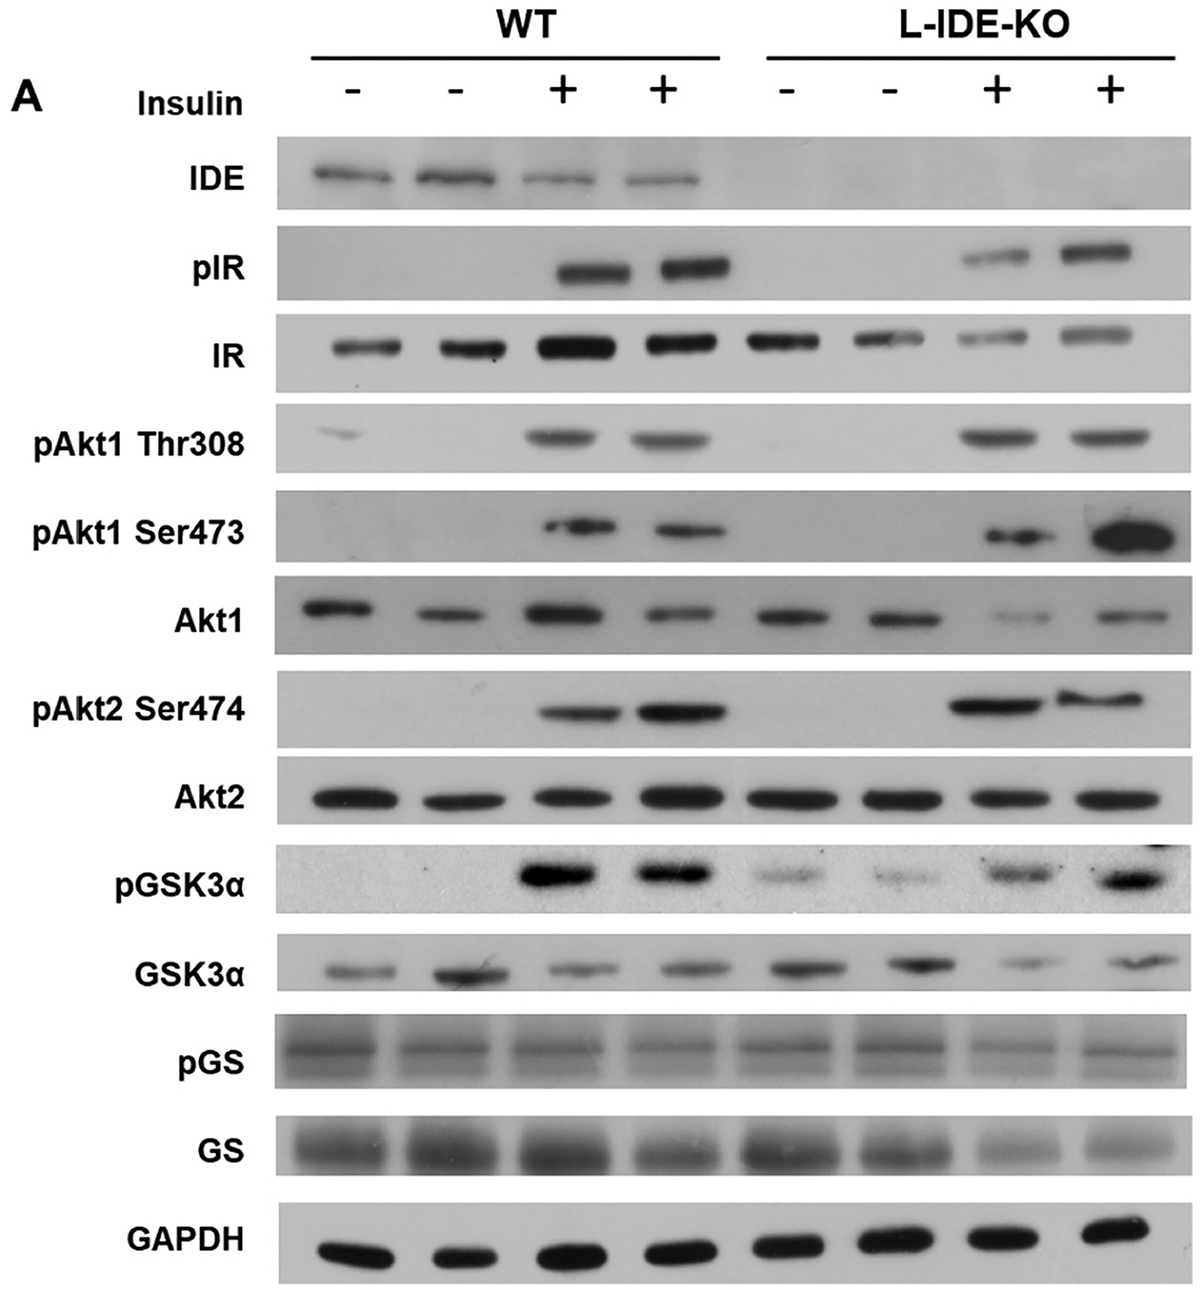
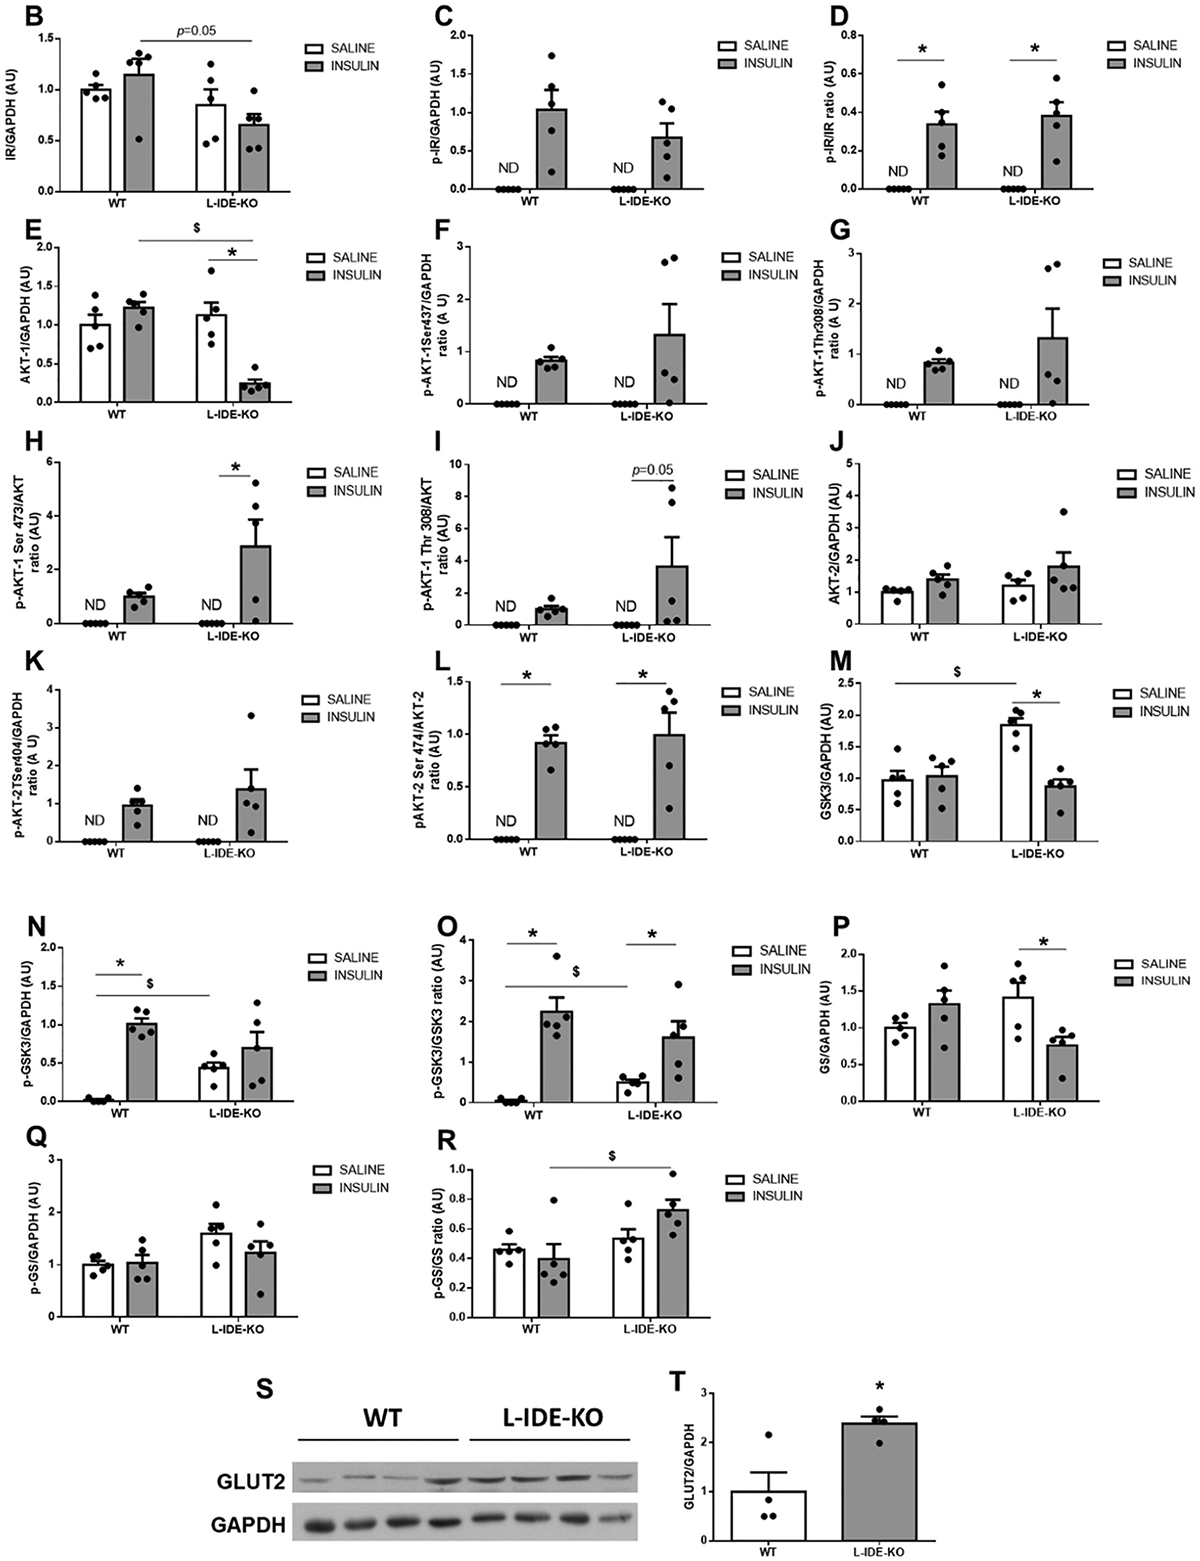
Hepatic ablation of Ide alters multiple intracellular insulin-signaling pathways. (A) Representative western blots depicting the effects of insulin on total or phosphorylated IDE, IR, AKT1, AKT2, GSK3α, and GS. Expression of GAPDH was determined to ensure similar protein levels for total liver lysates. Two representative samples have been used for the final arrangement of the figure. Densitometric analyses of the data in panel A. The y-axis represents the ratio of total protein or phosphorylated versus GAPDH, and phosphorylated versus total protein in arbitrary units (AU) for IR (B), p-IR (C), p-IR/IR (D), AKT1 (E), p-AKT1Ser473 (F), p-AKT1Thr308 (G), p-AKT1Ser4731/AKT1 (H), p-AKT1Thr308/AKT1 (I), AKT2 (J), p-AKT2Ser474 (K), p-AKT2Ser474/AKT2 (L), GSK3α (M), p-GSK3α (N), p-GSK3α/GSK3α (O), GS (P), p-GS (Q), p-GS/GS (R) in WT and L-IDE-KO mice. Data are mean ± SEM. n = 5 per genotype and condition. *p value <0.05 vs. saline; $p value <0.05 vs. WT by ANOVA. (S) Representative immunoblot using anti-GLUT2 antibodies. Densitometric quantification of GLUT2 (T). Data are mean ± SEM. n = 4 per group. *p value <0.05 vs. WT.
AKT phosphorylates and deactivates glycogen synthase kinase 3 (GSK-3), leading to activation of glycogen synthase (GS) and thus, inducing glycogen synthesis. We reported that relative to SD-fed WT mice, basal GSK-3 phosphorylation was higher in L-IDE-KO mice [13]. Similarly, HFD-fed L-IDE-KO mice showed higher basal protein and phosphorylation levels than WT mice (Fig. 4A, M–N). Interestingly, GS levels were significantly reduced in L-IDE-KO livers in response to insulin (Fig. 4A,P). We also explored the functional impact of these alterations in GSK-3 and GS on liver glycogen levels. As in SD-fed L-IDE-KO mice [13], hepatic ablation of Ide had no effect on liver glycogen levels in mice fed HFD (data not shown).
The forkhead box O1 (FoxO1) is a nuclear transcription factor downstream of AKT that integrates insulin signaling with gluconeogenesis, which is aberrantly distributed in cellular nuclei, leading to up-regulation of the gluconeogenic genes Pck1 and G6pc in SD-fed L-IDE-KO [13]. In both WT and L-IDE-KO mice fed a HFD, insulin caused a shift of FoxO1 from the cytoplasmic to the nuclear fraction (Supplementary Fig. 3A–B). This was correlated with an augmented up-regulation of G6pc mRNA levels in L-IDE-KO mice compared to controls (Supplementary Fig. 3C–D).
To further investigate the impact of hepatic IDE loss-of-function on glucose homeostasis in HFD-induced obese mice, we analyzed hepatic GLUT2 levels in WT and L-IDE-KO mice. As shown in Fig. 4S–T, hepatic Ide ablation induced GLUT2 protein levels by ~2-fold.
3.3. Gain of hepatic IDE function improves glucose tolerance and insulin sensitivity in HFD-induced obese mice
To study the impact of a gain of hepatic IDE function on glucose homeostasis and insulin sensitivity, C57BL/6J mice were fed a HFD for 4 weeks before human Ide cDNA was delivered by adenovirus (Ad)-mediated gene transfer to the liver using a null adenovirus vector as control [16]. A predetermined dose of IDE vector (1.5 × 10¹¹ pfu/kg) was used to transduce about 70% of hepatocytes in liver [16]. This dose induced hepatic IDE protein levels by ~4-fold after a 2-week period (Fig. 5A). Notably, viral delivery of IDE to liver resulted in improved glucose tolerance and insulin sensitivity (Fig. 5B–F) without significant changes in fasting or non-fasting plasma glucose levels, body weight, or food intake (Fig. 5G–J). Elevated hepatic IDE production also resulted in a statistically non-significant trend toward a reduction in fat pad mass compared to control mice (Fig. 5K).
Fig. 5.
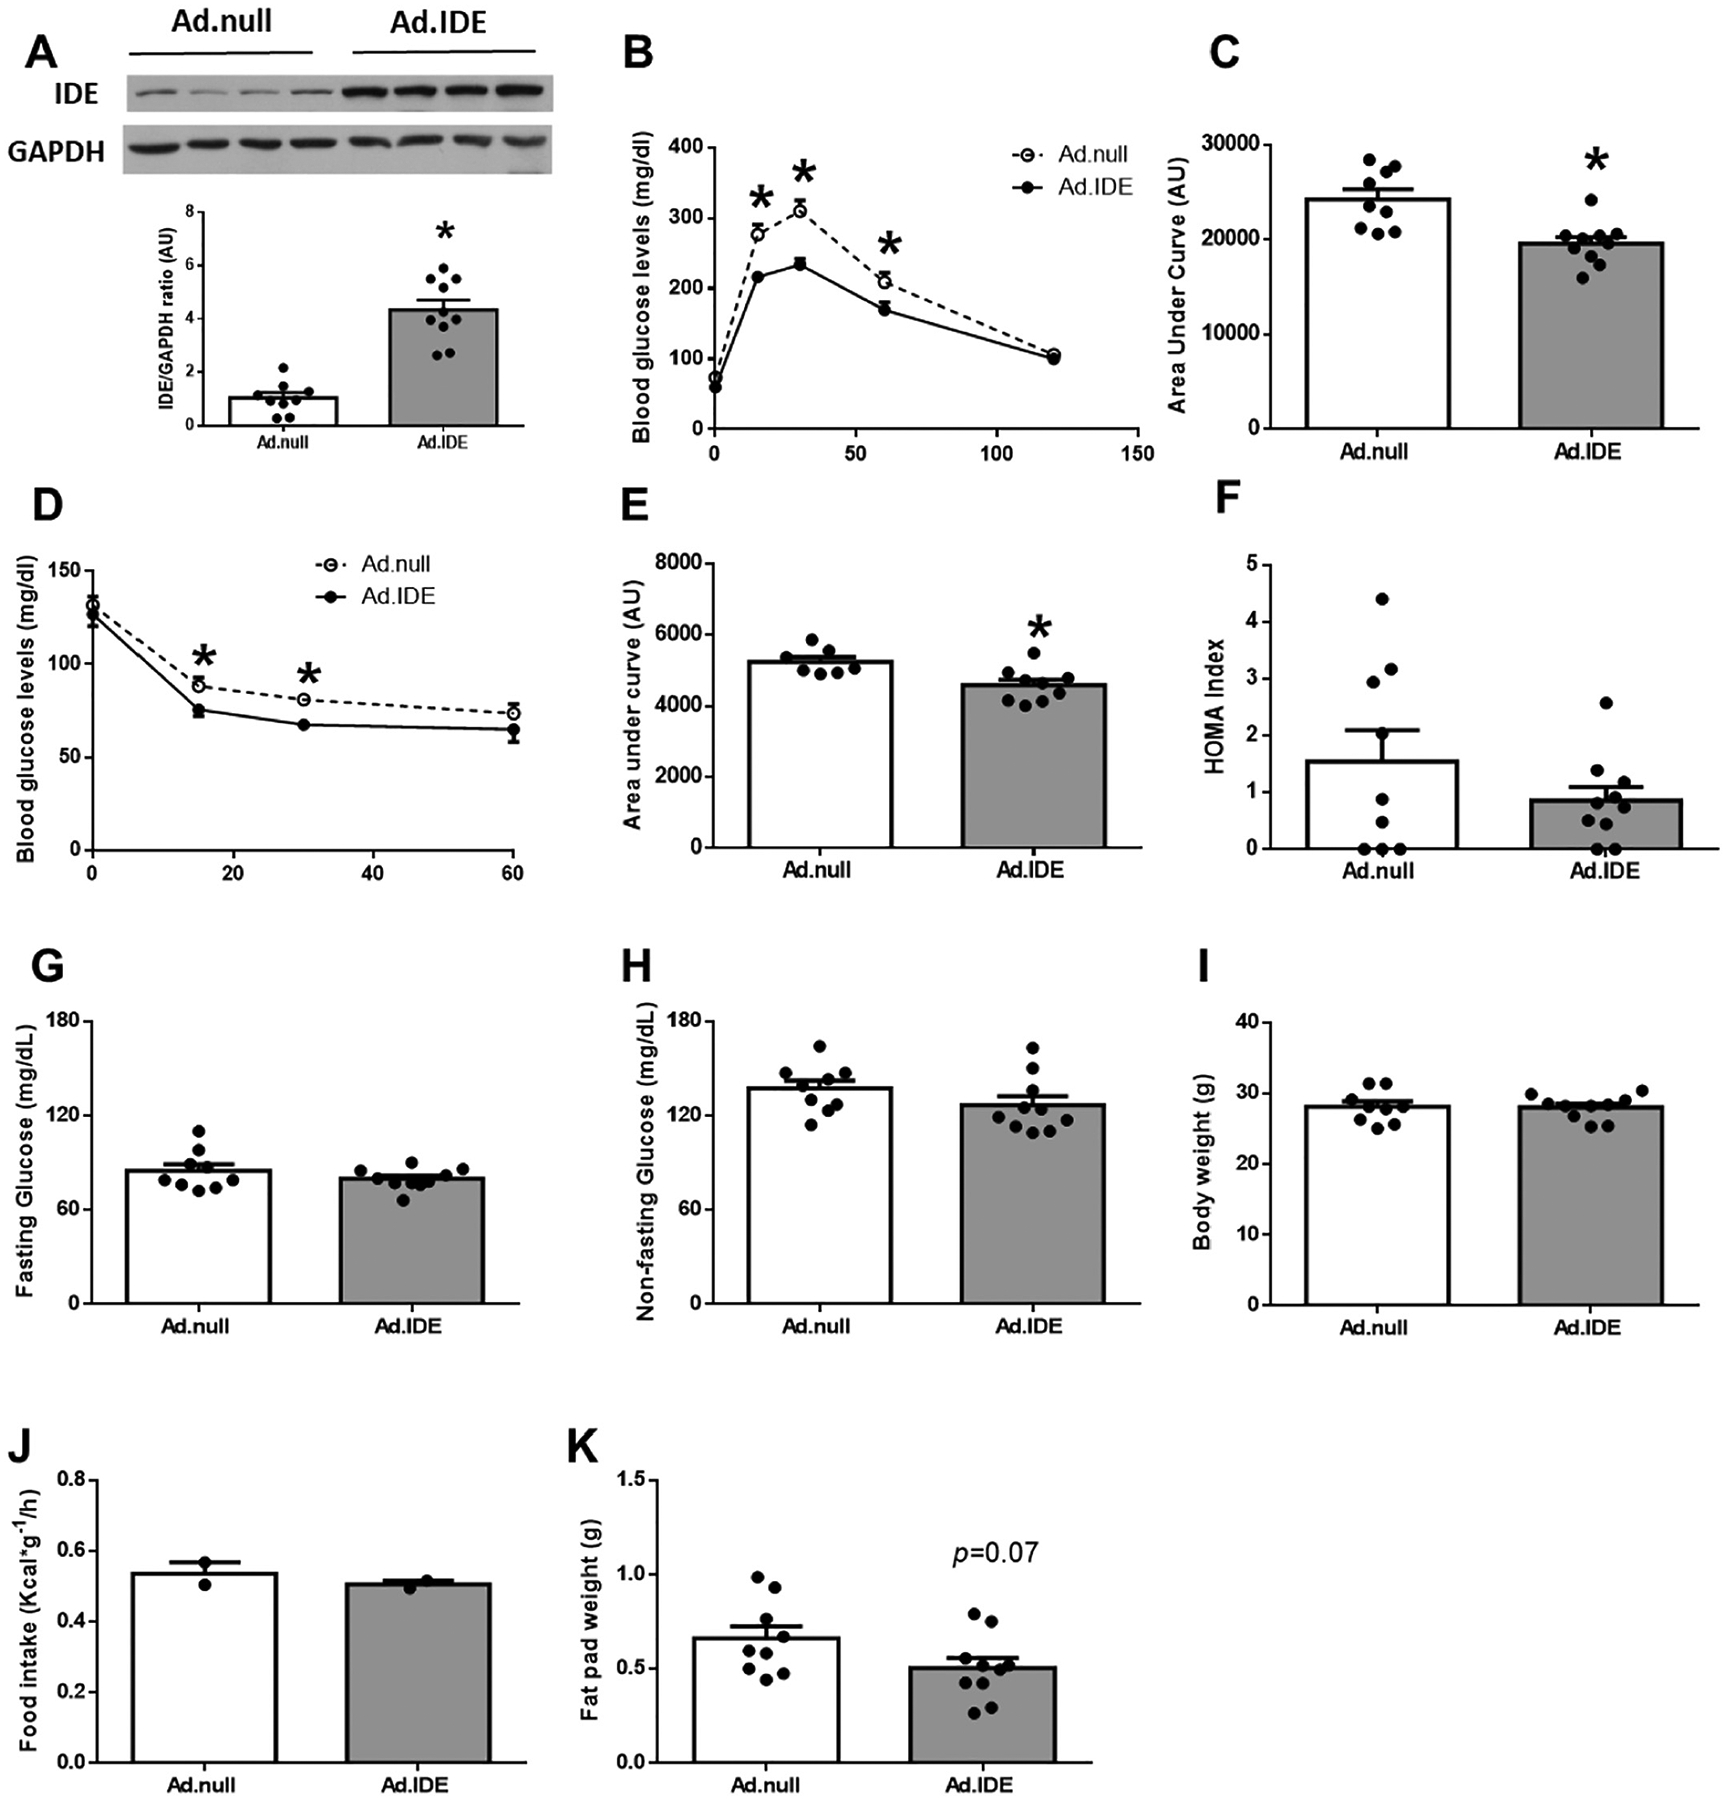
Hepatic IDE gain-of-function improves glucose metabolism and insulin sensitivity in high-fat induced obesity. Four-week-old male C57BL/6J mice were fed a high-fat diet (HFD) for 4 weeks. Mice were then stratified by body weight and assigned randomly to two groups (n = 7–10 per group), and human Ide cDNA or control vector were delivered by adenovirus-mediated gene transfer to the liver of mice. Mice were maintained on the HFD for another 2 weeks (a total of 6 weeks on HFD), and glucose homeostasis was assessed at the time points indicated below. (A) Hepatic IDE levels (2-weeks after adenoviruses delivery). Upper panel: Representative samples have been used for the final arrangement of the figure. Lower panel: Quantification of the ratio of IDE vs. GAPDH in control (Ad.null) and IDE (Ad.IDE) vector treated mice. Data are mean ± SEM. n = 7–10 per group. *p value <0.05 vs. control-vector treated mice by Student’s t-test. In addition, glucose tolerance (1-week after adenovirus delivery) and insulin sensitivity (2-weeks after adenovirus delivery) were assessed in these mice. (B) IP-GTT and area under the curve (C). (D) IP-ITT, and area under the curve (E). HOMA index (F). Fasting (G) and non-fasting blood glucose (H). Body weight (I), food intake (J), and epididymal fat pad mass (K). Data are mean ± SEM. n = 7–10 per group. *p value <0.05 by Student’s t-test.
In agreement with the observed improvement in glucose tolerance and insulin sensitivity, hepatic IDE overexpression significantly reduced non-fasting plasma insulin and C-peptide levels (Fig. 6A–B), with a statistically non-significant trend toward a reduction in their fasting levels (Fig. 6C–D). Hepatic IDE overexpression did not affect the steady-state C-peptide/insulin molar ratio (Fig. 6E), suggesting it does not impact insulin clearance, nor did it affect fasting and non-fasting plasma glucagon levels (Fig. 6F–G).
Fig. 6.
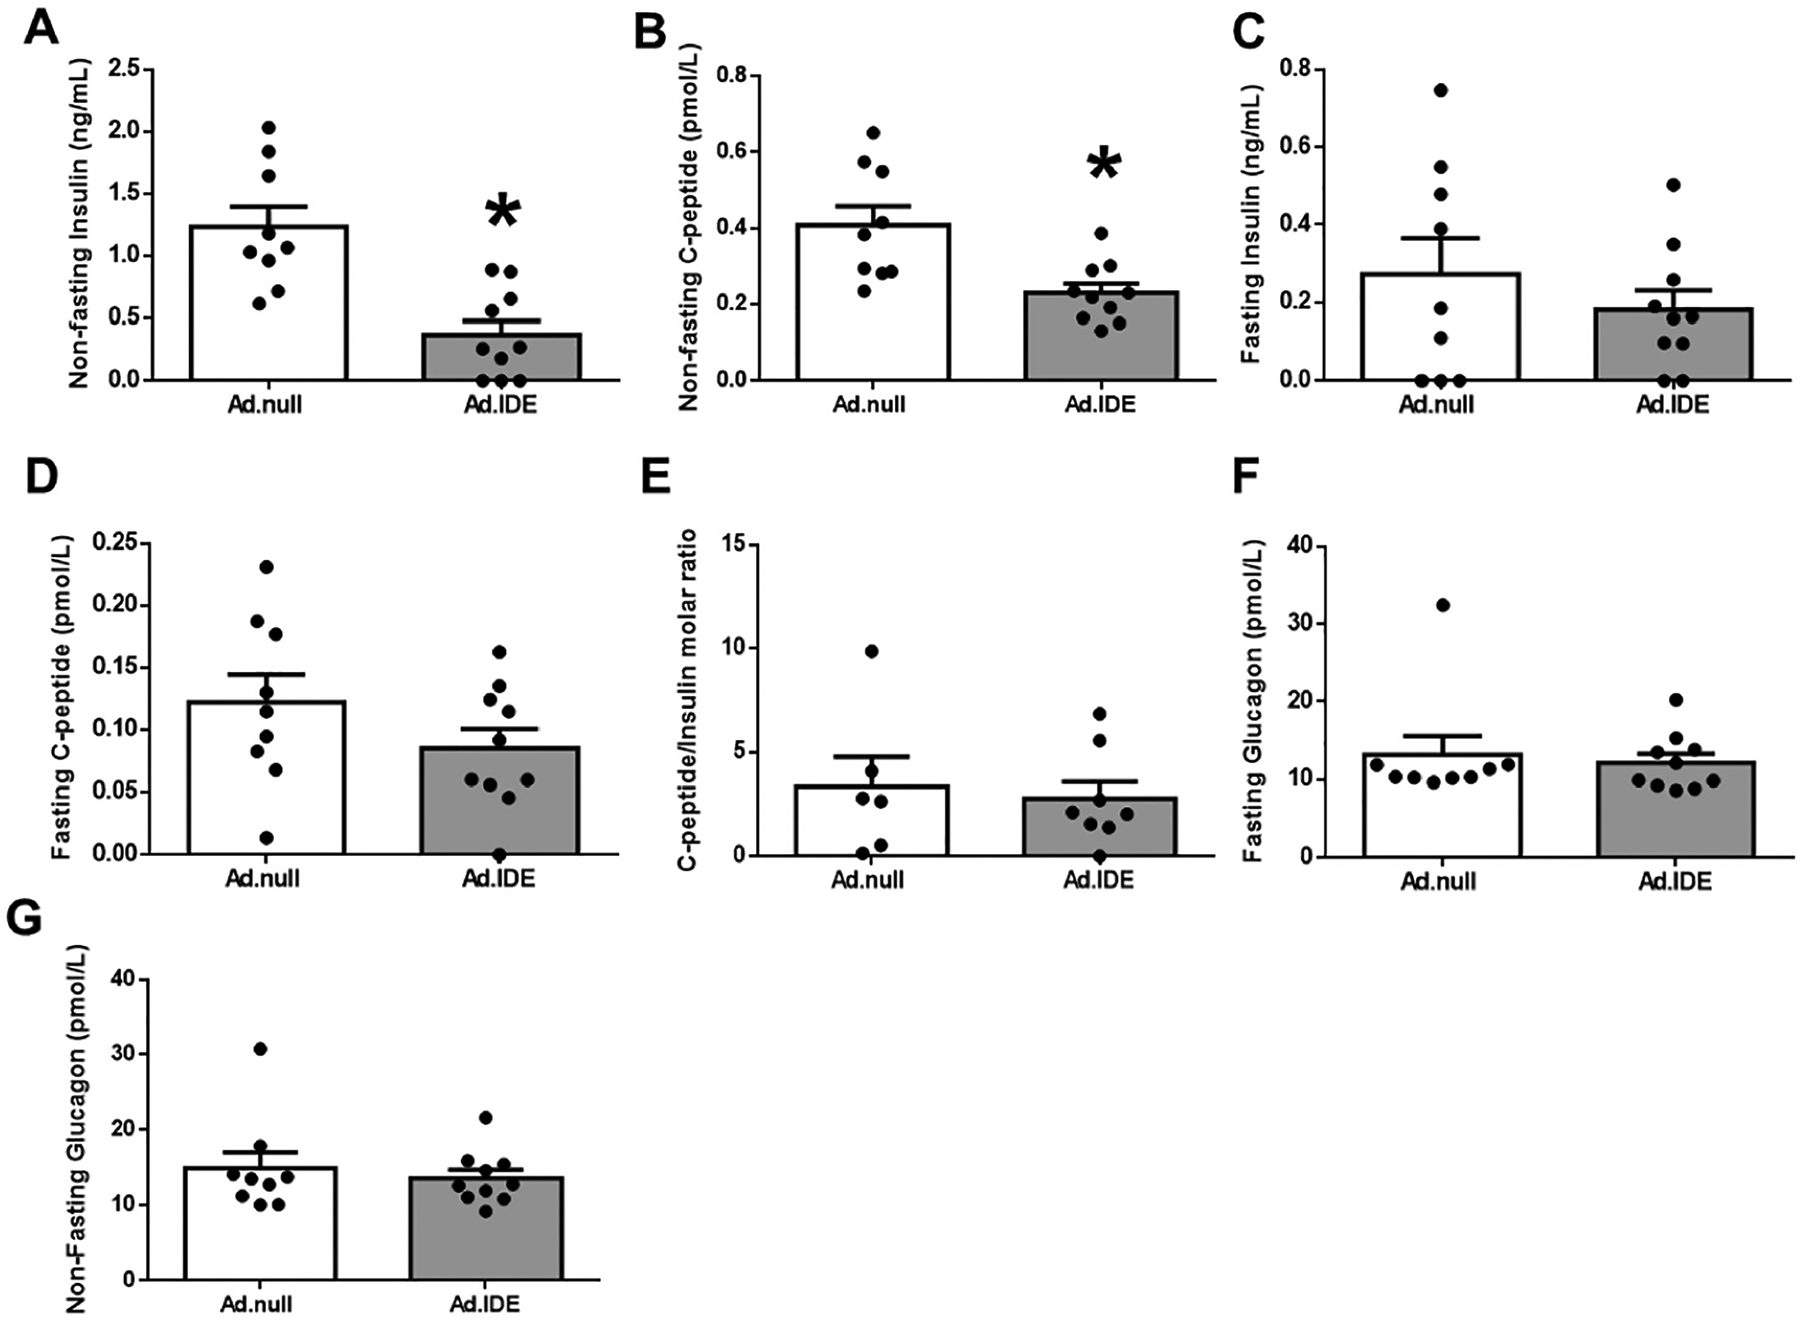
Hepatic IDE gain of function decreases plasma insulin levels without altering insulin clearance. Non-fasting insulin (A) and C-peptide (B) plasma levels in control and IDE-vector treated mice. Fasting insulin (C) and C-peptide plasma levels (D). Hepatic insulin clearance (E). Fasting (F) and non-fasting (G) glucagon plasma levels. Data are mean ± SEM. n = 7–10 per genotype. *p value <0.05 by Student’s t-test.
3.4. Impact of hepatic IDE production on liver insulin signaling pathways and glucose transporters in HFD-induced obese mice
To elucidate the molecular mechanisms underlying the improved glucose homeostasis and insulin sensitivity by increased hepatic IDE overexpression, we analyzed circulating and hepatic lipid content. As shown in Supplementary Fig. 4A–D, plasma triglycerides, FFAs cholesterol, and hepatic triglyceride levels remained unchanged between Ad.IDE-treated and Ad.null-treated mice. Together, this demonstrated that improved hepatic insulin sensitivity was not related to changes in lipid metabolism.
To analyze the impact of Ad-mediated IDE overexpression on hepatic insulin signaling, HFD-induced obese mice were fasted overnight before being i.p injected with insulin (1,5 U/Kg) or saline, and hepatic protein expression was evaluated. As Fig. 7A–B shows, IDE overexpression resulted in a reduction in IR protein levels. Surprisingly, insulin-mediated phosphorylation of AKT1 and AKT2 (Fig. 7A, E–L), and subsequent inactivation of GSK3 (Fig. 7A,M–O) were comparable between Ad.IDE- and Ad.null-treated mice. However, GS protein and phosphorylation levels were reduced by ~50% in Ad.IDE-treated compared to control mice (Fig. 7A,P–R).
Fig. 7.
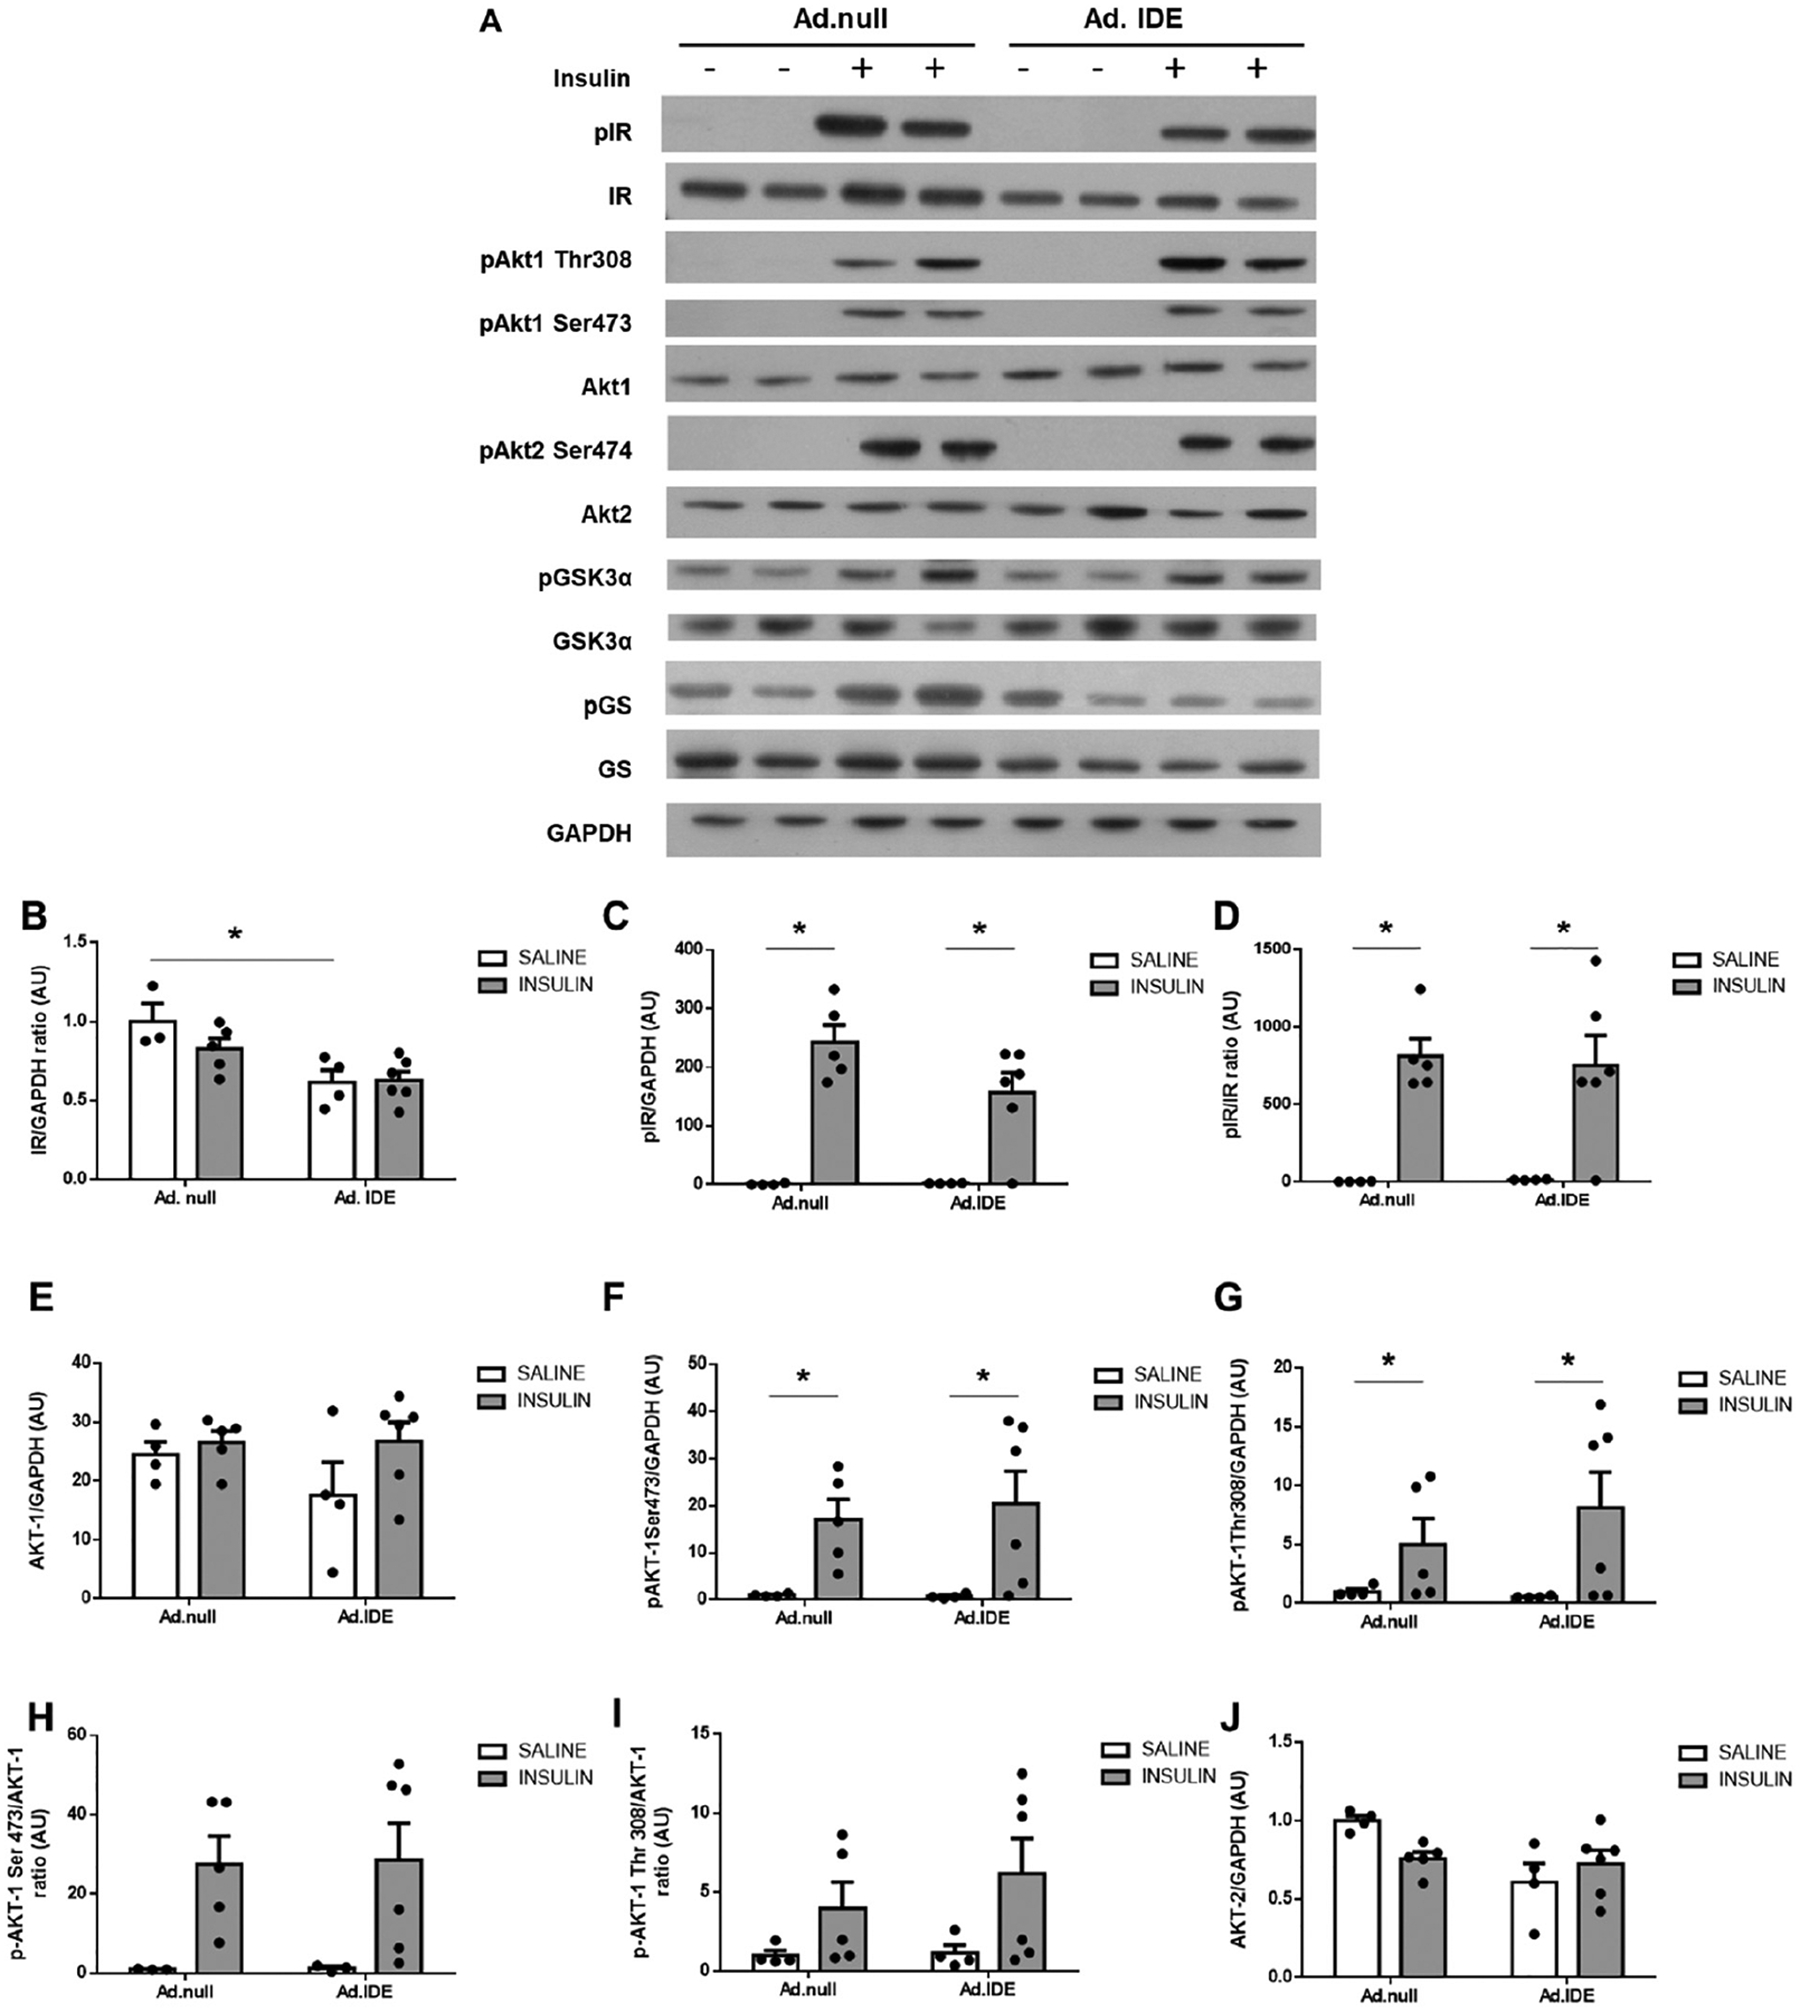
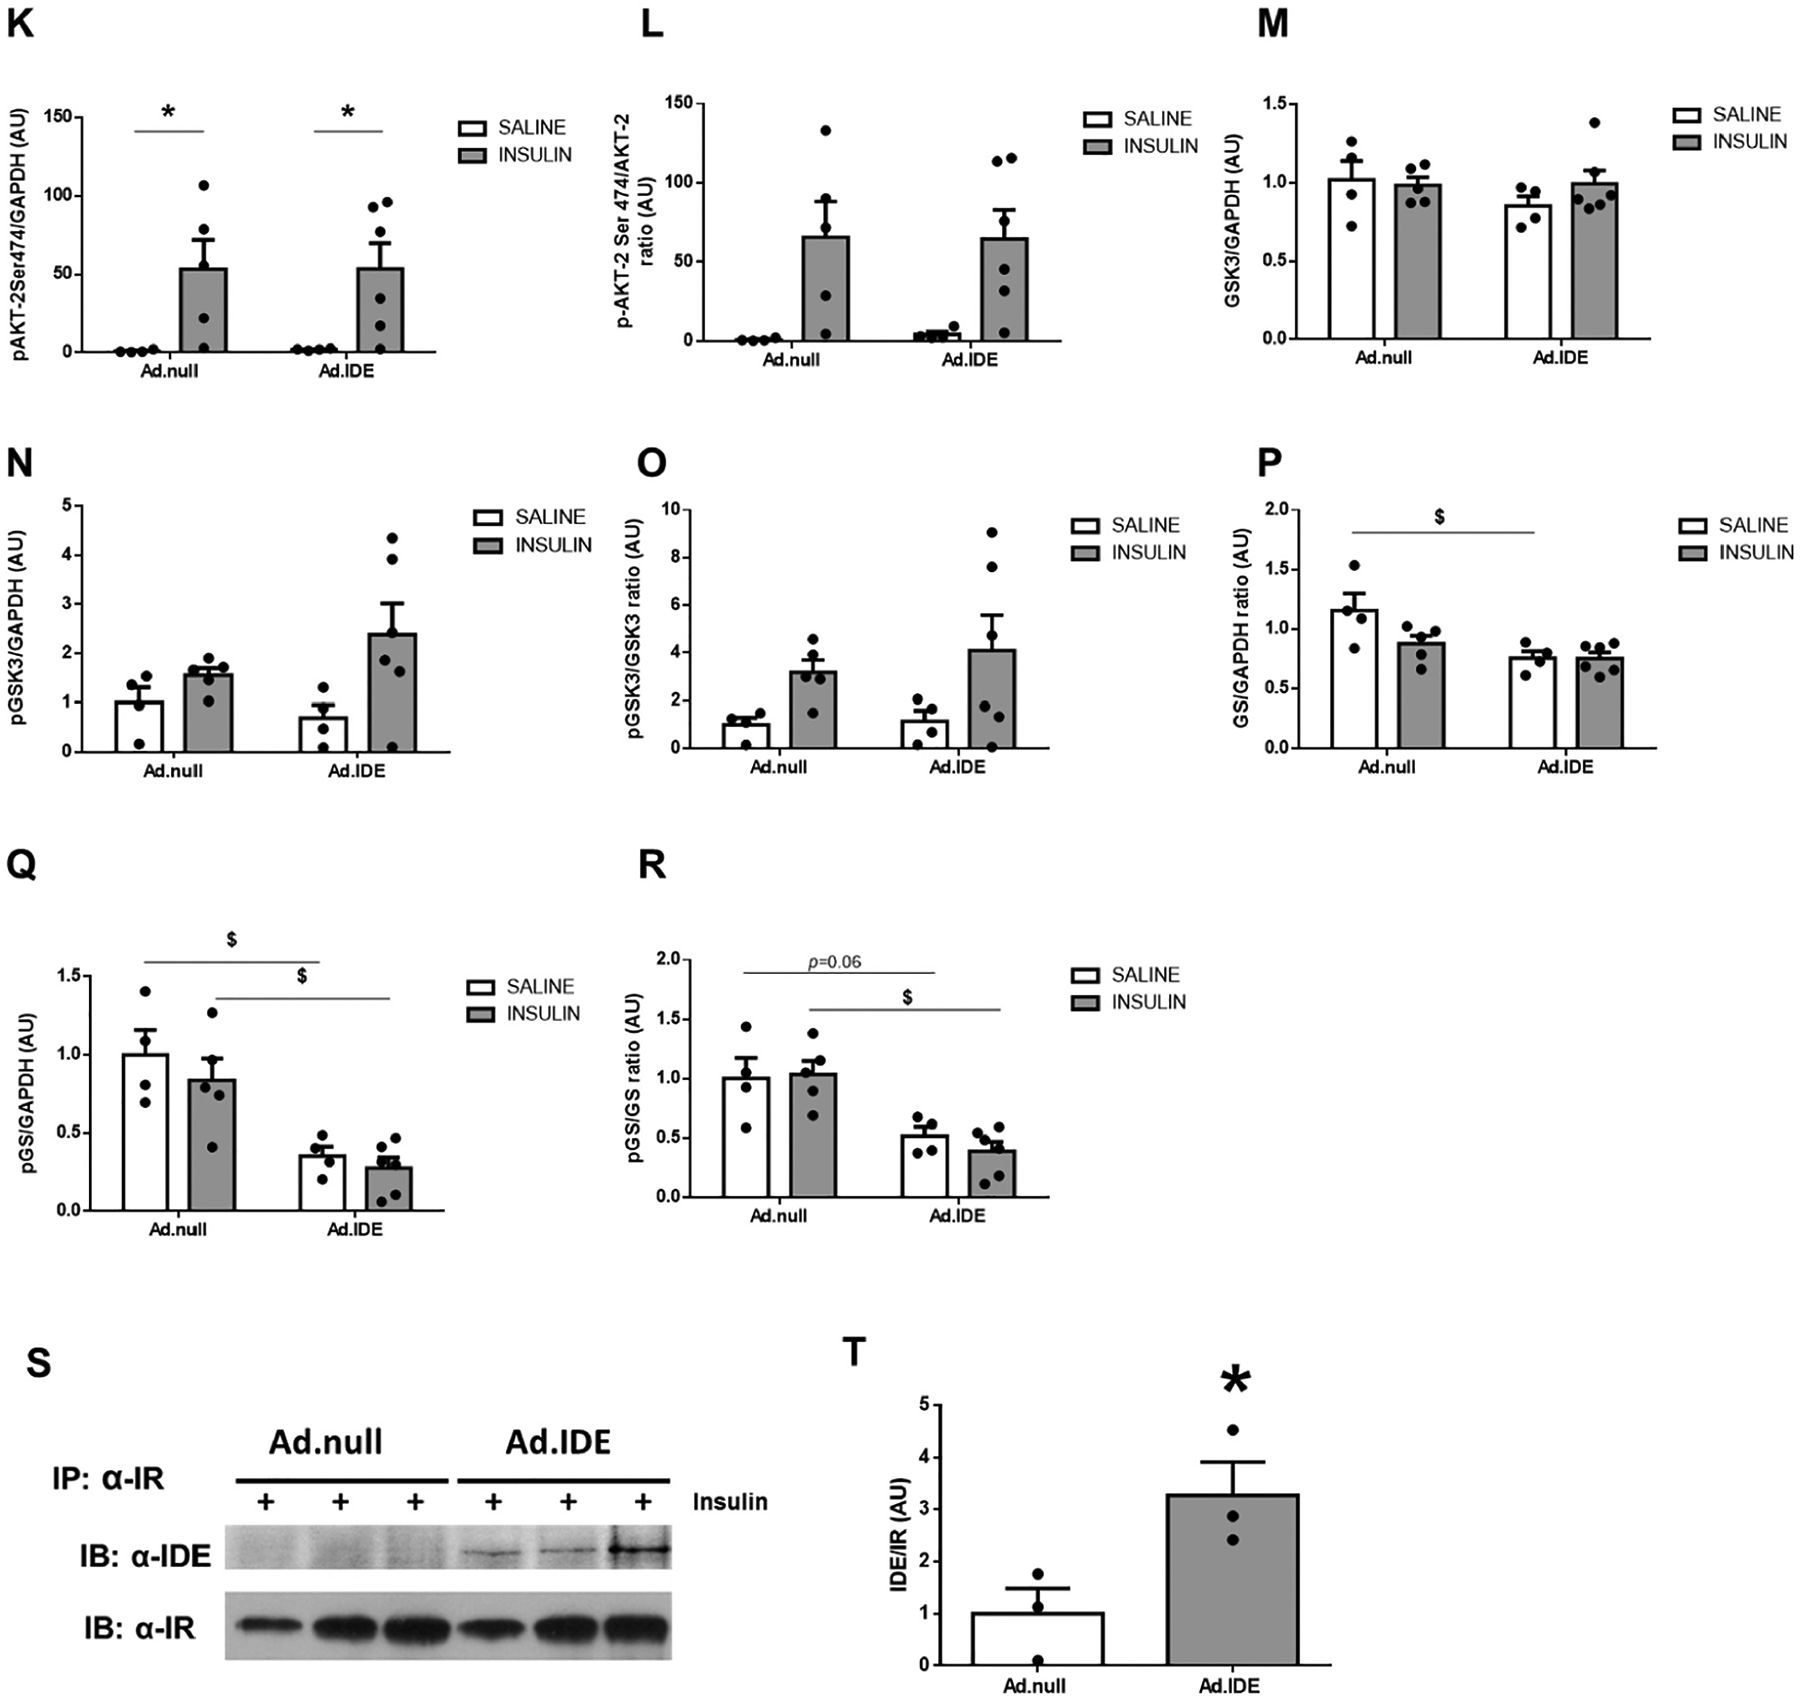
Effect of hepatic IDE production on insulin signaling pathways and the insulin-IR-complex. (A) Representative western blots depicting the effects of insulin on total or phosphorylated IR, AKT1, AKT2, GSK3α, and GS. Expression of GAPDH was determined to ensure similar protein levels for total liver lysates. Two representative samples have been used for the final arrangement of the figure. Densitometric analyses of the data in panel A. The y-axis represents the ratio of total protein or phosphorylated versus GAPDH, and phosphorylated versus total protein in arbitrary units (AU) for IR (B), p-IR (C), p-IR/IR (D), AKT1 (E), p-AKT1Ser473 (F), p-AKT1Thr308 (G), p-AKT1Ser4731/AKT1 (H), p-AKT1Thr308/AKT1 (I), AKT2 (J), p-AKT2Ser474 (K), p-AKT2Ser474/AKT2 (L), GSK3α (M), p-GSK3α (N), p-GSK3α/GSK3α (O), GS (P), p-GS (Q), p-GS/GS (R) in WT and L-IDE-KO mice. Data are mean ± SEM. n = 3–6 per genotype and condition. *p value <0.05, $p value <0.05 by ANOVA. Co-immunoprecipitation of IDE and IR. Aliquots of liver lysates from mice transduced with Ad.null or Ad.IDE vectors were subjected to immunoprecipitation with α-IR followed by immunoblotting with α-IDE antibody. (S) Western blot images. (T) Densitometric quantification of co-immunoprecipitation of IDE and IR. Data are mean ± SEM n = 3 independent experiments. *p value <0.05 by Student’s t-test.
We have proposed that IDE may regulate the intracellular trafficking of IR independently of its protease activity [1]. To test this hypothesis, we carried out coimmunoprecipitation experiments to investigate whether insulin induces the association of IDE with IR. As Fig. 7S–T) shows, immunoblotting the IR immunopellet with IDE antibody indicated a marked increase in IR/IDE binding in response to insulin in Ad.IDE-treated, but not Ad.null-treated mice.
Having shown that loss of hepatic IDE function in HFD-induced obese mice resulted in 2-fold increase in GLUT2 protein levels (Fig. 4S–T), we then analyzed the impact of hepatic IDE overexpression on GLUT2 in HFD-induced obese mice. As shown in Fig. 8A–B, hepatic IDE overexpression resulted in ~2-fold reduction of GLUT2 protein levels with a reciprocal 2-fold increase in GLUT1 protein levels (Fig. 8A–C), altering hepatic GLUT1/GLUT2 ratio (Fig. 8D).
Fig. 8.
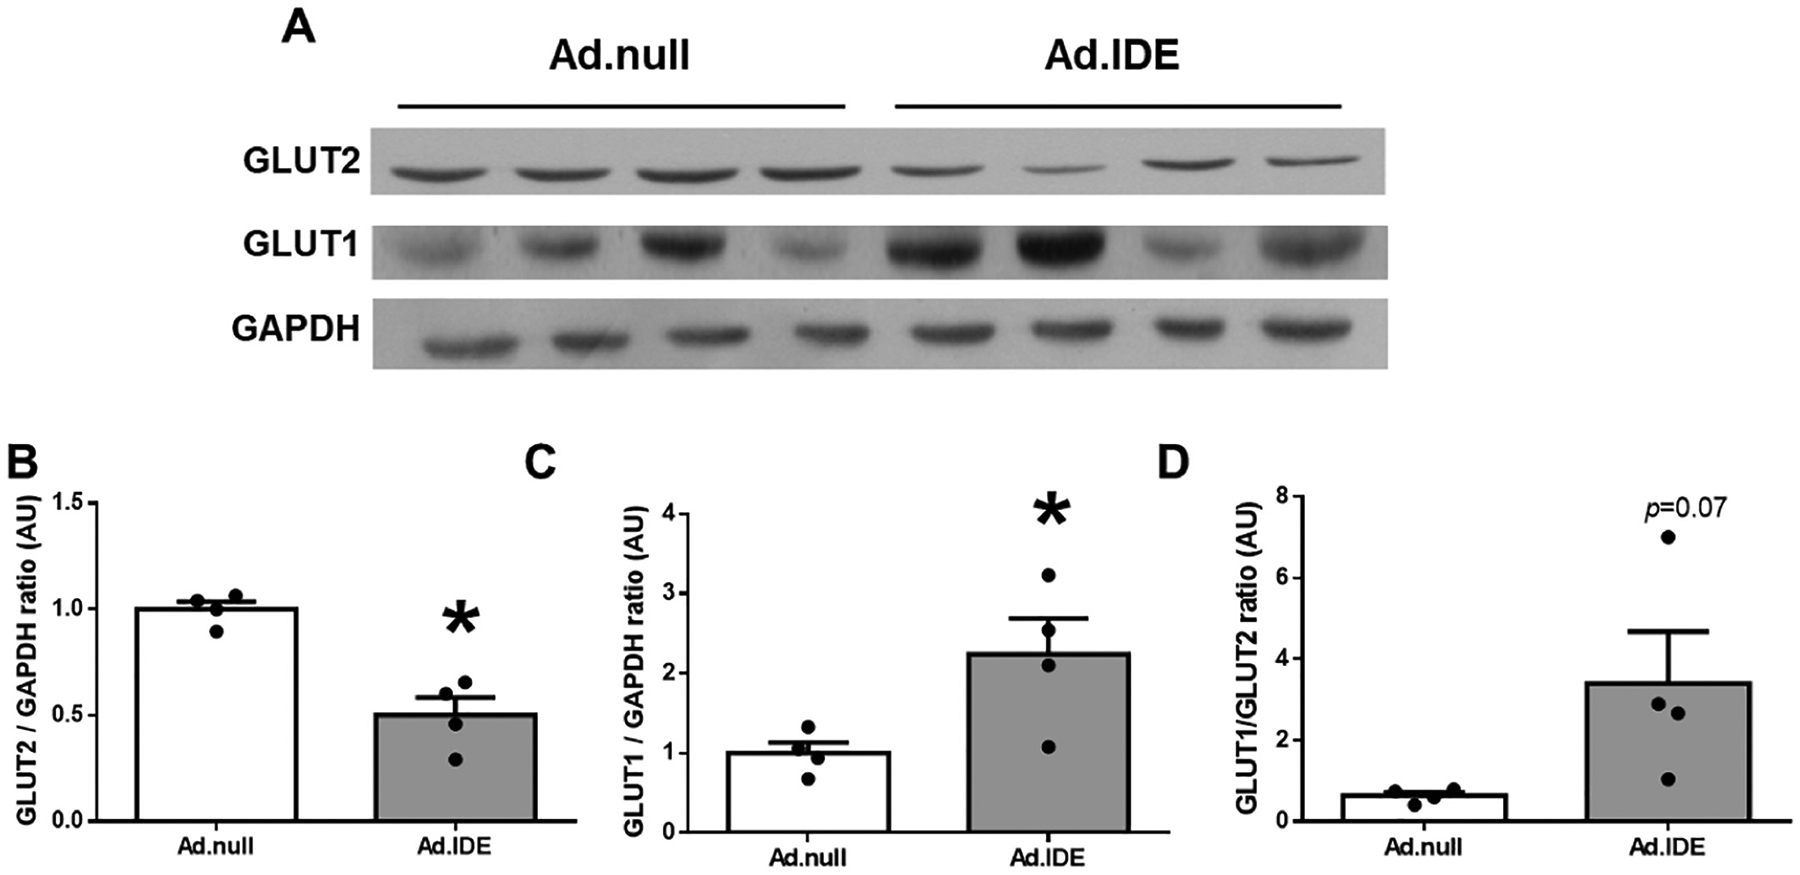
Hepatic gain of IDE function changes the ratio GLUT1/GLUT2 in HFD-induced obesity. (A) Representative immunoblot using anti-GLUT2 and anti-GLUT1 antibodies. Expression of GAPDH was determined to ensure similar protein levels for total liver lysates. Densitometric quantification of GLUT2 (B) and GLUT1 (C). Ratio GLUT1/GLUT2 (D). Data are mean ± SEM. n = 4 per group. *p value <0.05 by Student’s t-test.
4. Discussion
In an earlier study, we demonstrated that L-IDE-KO mice fed a regular diet exhibited insulin resistance and glucose intolerance with no change in circulating insulin levels [13]. The current study provides in vivo evidence that liver-specific deletion of IDE worsens insulin resistance and glucose intolerance in the setting of HFD-induced obesity with a parallel increase in plasma insulin levels. Thus, liver-specific deletion of Ide causes chronic hyperinsulinemia in the presence of HFD-induced obesity.
In our L-IDE-KO mouse model in HFD-induced obesity, hyperinsulinemia may be interpreted as a compensatory mechanism to counter peripheral insulin resistance, in part associated with reduced insulin clearance as expected from a protease that, for the last decades, has been postulated to play a major role in hepatic insulin degradation [23,24]. Several studies have shown that chronic hyperinsulinemia emerges, at least in part, from lower rates of insulin clearance to compensate for peripheral insulin resistance in individuals with obesity or T2DM [11,25–29]. Furthermore, some authors have shown a relationship between reduced insulin clearance and diminished hepatic IDE activity in individuals with obesity or T2DM [10,30]. Likewise, rodent models fed different high-fat diets have been used to investigate the relationship between insulin clearance and IDE activity. However, the use of diverse experimental models fed diets with differing fat composition and for varying lengths of time has yielded no consensus or conclusive evidence concerning the cause-effect relationship between IDE activity and insulin clearance in the setting of obesity and diabetes [31–33].
To clarify the cause-effect relationship between IDE and insulin clearance in the setting of obesity, we have compared the effect of reduced versus increased IDE expression in hepatocytes on insulin clearance and action. Neither the loss (L-IDE-KO mouse) nor the gain (adenoviral delivery) of IDE function altered the hepatic insulin clearance rate (measured as the steady-state C-peptide/insulin molar ratio in fasting or during the fasting-refeeding transition) in HFD-induced obesity. In fact, our results indicate that the hyperinsulinemia observed in L-IDE-KO mice is more significantly related to enhanced β-cell function and insulin secretion rather than reduced insulin clearance. Our data are in agreement with our previous studies using L-IDE-KO fed a standard chow diet demonstrating that IDE is not a major player in hepatic insulin extraction [13]. Nonetheless, we acknowledge that a limitation of this study is that we do not assess hepatic insulin clearance by hyperinsulinemic-euglycemic clamp analysis [34]. Further research using this technique in L-IDE-KO mice is warranted to clarify the role of IDE on hepatic insulin clearance.
In collaboration with the Najjar group [1], we have recently proposed a new model for hepatic insulin clearance, in which CEACAM1 and IDE coordinately regulates IR trafficking as it transports insulin through intracellular endosomal compartments to ultimately target it to the degradation pathways before it recycles to the membrane. According to this model, CEACAM1 promotes receptor-mediated insulin endocytosis and targeting it to the degradation process, while IDE participates in its intracellular trafficking at different steps. These include IR stabilization upon insulin binding, microtubule reorganization and polymerization to remove CEACAM1 from the insulin-IR complex to destabilize it and cause insulin detachment from IR and/or to regulate vesicular trafficking of IR back to the plasma membrane [1]. The current studies provide a first test of this model demonstrating an increase in the association between IDE and IR in response to insulin. This finding lends support to the notion that IDE forms complexes with the IR to regulate its intracellular endosomal trafficking. Intriguingly, both loss-of-function and gain-of-function manipulations to hepatic IDE resulted in lower total protein levels of the IR. We hypothesize that these antipodal outcomes emerge as follows: Depleting IDE reduces IR recycling, whereas IDE overexpression speeds up IR turnover, both leading to lower IR protein levels. Nonetheless, the opposing effects of the loss and gain of IDE function on insulin and glucose tolerance is consistent with a role for IDE in promoting insulin sensitivity in liver. Of interest, IR is expressed as two isoforms (IR-A and IR-B) with the former being less abundant but with higher affinity for insulin. Whether IDE has a differential effect on insulin uptake and intracellular trafficking via these two forms is not yet known, but this possibility may mediate the differential effect of loss-versus gain-of-function changes to IDE on hepatic insulin sensitivity and glucose tolerance. Further research is warranted to identify the mechanism(s) underlying the regulation of insulin sensitivity by IDE.
The notion that IDE participates as a scaffold protein regulating membrane-bound and nuclear receptors arises from ample experimental evidence showing that IDE associates with the cytoplasmic domain of the macrophage Type A scavenger receptor [35], and with androgen and glucocorticoid receptors [36]. We recently demonstrated that genetic depletion of Ide in pancreatic β-cells in vivo resulted in ~60% increase protein levels of GLUT1, in parallel with constitutive insulin secretion [15]. Surprisingly, we found that hepatic overexpression of IDE increases total GLUT1 protein levels by ~2-fold. We hypothesized that the increase in GLUT1 levels is a compensatory change that accelerates hepatic glucose uptake and metabolism, in response to decrease in hepatic GLUT2 protein levels in in Ad.IDE-treated mice.
Similarly, we show that genetic manipulation of Ide in liver resulted in changes in the level of GLUT2, a major low-affinity glucose transporter in the plasma membrane of hepatocytes [37], but dispensable for glucose output [38]. Despite its well-accepted role in glucose uptake during the absorptive phase, it has been assigned other functions. Hepatic ablation of Slc2a in mice revealed that GLUT2 is necessary for physiological control of glucose-sensitive genes, and its inactivation leads to impaired glucose-stimulated insulin secretion, linking hepatic glucose sensing to the long-preservation of pancreatic β-cell function by a mechanism likely involving bile acids [39,40]. Thus, the liver-β-cell axis controls β-cell secretion capacity, and an altered glucose metabolism in hepatocytes induces progressive β-cell dysfunction, independently of β-cell mass and insulin content [39,40]. On the other hand, GLUT2 is present in glucose-sensing cells of the hepatoportal vein region, which is richly innervated by vagal afferents. Following intestinal glucose absorption, GLUT2 acts as a glucose-sensor inducing a nervous signal that stimulates first-phase insulin secretion [41,42]. Interestingly, in the liver IDE is present in parenchymal cells, particularly near the portal tract, and in the epithelium of the bile duct [43]. In our loss-of-function model, higher GLUT2 protein levels paralleled increased insulin secretion, independently of β-cell mass. Conversely, in the gain-of-function model, lower GLUT2 protein levels paralleled reduced insulin secretion. The role of hepatic IDE in the regulation of β-cell function through the liver-β-cell axis awaits experimental examination.
5. Conclusions
In the setting of obesity, the current studies show that loss of IDE function aggravates insulin resistance and glucose intolerance, suggesting that pharmacological inhibition of IDE is contraindicated in the treatment of T2DM, as has been debated [1,44]. Together with the demonstration that gain of IDE function exerts beneficial effects on glucose tolerance and insulin sensitivity in the setting of obesity, this provides a strong rationale for developing pharmacological compounds targeting IDE activation in the treatment of T2DM.
Supplementary Material
Acknowledgments
We thank Prof. Henry Dong for fruitful discussions and for having provided us with the anti-FoxO1 antibody.
Funding
This work was supported by grants from the Ministerio de Economía, Industria y Competitividad: SAF2016-77871-C2-1-R to IC; SAF2016-77871-C2-2-R to GP; This work was supported by grants from the Ministerio de Ciencia e Innovación PID2019-110496RB-C21 to IC; PID2019-110496RB-C22 to GP. European Foundation for the Study of Diabetes (European Diabetes Research Programme on New Targets for Type 2 Diabetes supported by MSD-2017) to IC and GP. The project leading to these results has received funding from “la Caixa” Foundation, under agreement LCF/PR/PR18/51130007 to GP. This work was suppoted by grant from NIH GM115617 to ML.
Declaration of competing interest
We wish to confirm that there are no known conflicts of interest associated with this publication and there has been no significant financial support for this work that could have influenced its outcome. We confirm that the manuscript has been read and approved by all named authors and that there are no other persons who satisfied the criteria for authorship but are not listed. We further confirm that the order of authors listed in the manuscript has been approved by all of us.
Footnotes
Supplementary data to this article can be found online at https://doi.org/10.1016/j.metabol.2020.154352.
CRediT authorship contribution statement
BM researched data, made important contributions to analysis, and interpretation of data, drafted the manuscript, revised the manuscript critically for important intellectual content. CMF researched data, made important contributions to analysis, and interpretation of data, drafted the manuscript, revised the manuscript critically for important intellectual content. CP researched data, made important contributions to analysis, and interpretation of data. CMG researched data, made important contributions to analysis, and interpretation of data, drafted the manuscript, revised the manuscript critically for important intellectual content. TP researched data, made important contributions to analysis, and interpretation of data. CDL revised the manuscript critically for important intellectual content. MAL provided the floxed IDE mouse line and, participated in revising the manuscript critically for important intellectual content. IC contributed to conception and design of the work, analyzed and interpreted data, drafted the manuscript, revised the manuscript critically for important intellectual content. GP contributed to conception and design of the work, analyzed and interpreted data, wrote the manuscript, revised the manuscript critically for important intellectual content.
References
- [1].Najjar SM, Perdomo G. Hepatic insulin clearance: mechanism and physiology. Physiology. 2019;34:198–215. [DOI] [PMC free article] [PubMed] [Google Scholar]
- [2].Shen Y, Joachimiak A, Rosner MR, Tang WJ. Structures of human insulin-degrading enzyme reveal a new substrate recognition mechanism. Nature. 2006;443:870–4. [DOI] [PMC free article] [PubMed] [Google Scholar]
- [3].Duckworth WC, Bennett RG, Hamel FG. Insulin degradation: progress and potential. Endocr Rev. 1998;19:608–24. [DOI] [PubMed] [Google Scholar]
- [4].Tundo GR, Sbardella D, Ciaccio C, Grasso G, Gioia M, Coletta A, et al. Multiple functions of insulin-degrading enzyme: a metabolic crosslight? Crit Rev Biochem Mol Biol. 2017;52:554–82. [DOI] [PubMed] [Google Scholar]
- [5].Abdul-Hay SO, Kang D, McBride M, Li L, Zhao J, Leissring MA. Deletion of insulin-degrading enzyme elicits antipodal, age-dependent effects on glucose and insulin tolerance. PloS One. 2011;6:e20818. [DOI] [PMC free article] [PubMed] [Google Scholar]
- [6].Shanik MH, Xu Y, Skrha J, Dankner R, Zick Y, Roth J. Insulin resistance and hyperinsulinemia: is hyperinsulinemia the cart or the horse? Diabetes Care. 2008; 31(Suppl. 2):S262–8. [DOI] [PubMed] [Google Scholar]
- [7].Cotsapas C, Prokunina-Olsson L, Welch C, Saxena R, Weaver C, Usher N, et al. Expression analysis of loci associated with type 2 diabetes in human tissues. Diabetologia. 2010;53:2334–9. [DOI] [PMC free article] [PubMed] [Google Scholar]
- [8].Fakhrai-Rad H, Nikoshkov A, Kamel A, Fernstrom M, Zierath JR, Norgren S, et al. Insulin-degrading enzyme identified as a candidate diabetes susceptibility gene in GK rats. Hum Mol Genet. 2000;9:2149–58. [DOI] [PubMed] [Google Scholar]
- [9].Elbein SC, Hoffman MD, Teng K, Leppert MF, Hasstedt SJ. A genome-wide search for type 2 diabetes susceptibility genes in Utah Caucasians. Diabetes. 1999;48:1175–82. [DOI] [PubMed] [Google Scholar]
- [10].Pivovarova O, von Loeffelholz C, Ilkavets I, Sticht C, Zhuk S, Murahovschi V, et al. Modulation of insulin degrading enzyme activity and liver cell proliferation. Cell Cycle. 2015;14:2293–300. [DOI] [PMC free article] [PubMed] [Google Scholar]
- [11].Valera Mora ME, Scarfone A, Calvani M, Greco AV, Mingrone G. Insulin clearance in obesity. J Am Coll Nutr. 2003;22:487–93. [DOI] [PubMed] [Google Scholar]
- [12].Pihlajamaki J, Boes T, Kim EY, Dearie F, Kim BW, Schroeder J, et al. Thyroid hormone-related regulation of gene expression in human fatty liver. J Clin Endocrinol Metab. 2009;94:3521–9. [DOI] [PMC free article] [PubMed] [Google Scholar]
- [13].Villa-Perez P, Merino B, Fernandez-Diaz CM, Cidad P, Lobaton CD, Moreno A, et al. Liver-specific ablation of insulin-degrading enzyme causes hepatic insulin resistance and glucose intolerance, without affecting insulin clearance in mice. Metab Clin Exp. 2018;88:1–11. [DOI] [PMC free article] [PubMed] [Google Scholar]
- [14].Fernandez-Diaz CM, Escobar-Curbelo L, Lopez-Acosta JF, Lobaton CD, Moreno A, Sanz-Ortega J, et al. Insulin degrading enzyme is up-regulated in pancreatic beta cells by insulin treatment. Histol Histopathol. 2018;33:1167–80. [DOI] [PubMed] [Google Scholar]
- [15].Fernandez-Diaz CM, Merino B, Lopez-Acosta JF, Cidad P, de la Fuente MA, Lobaton CD, et al. Pancreatic beta-cell-specific deletion of insulin-degrading enzyme leads to dysregulated insulin secretion and beta-cell functional immaturity. Am J Physiol Endocrinol Metab. 2019;317:E805–19. [DOI] [PMC free article] [PubMed] [Google Scholar]
- [16].Perdomo G, Kim DH, Zhang T, Qu S, Thomas EA, Toledo FG, et al. A role of apolipoprotein D in triglyceride metabolism. J Lipid Res. 2010;51:1298–311. [DOI] [PMC free article] [PubMed] [Google Scholar]
- [17].Cozar-Castellano I, Perdomo G. Assessment of insulin tolerance in vivo in mice. Methods Mol Biol. 2020;2128:217–24. [DOI] [PubMed] [Google Scholar]
- [18].Kurauti MA, Ferreira SM, Soares GM, Vettorazzi JF, Carneiro EM, Boschero AC, et al. Hyperinsulinemia is associated with increasing insulin secretion but not with decreasing insulin clearance in an age-related metabolic dysfunction mice model. J Cell Physiol. 2019;234(6):9802–9. [DOI] [PubMed] [Google Scholar]
- [19].Kurauti MA, Costa-Junior JM, Ferreira SM, Dos Santos GJ, Protzek AO, Nardelli TR, et al. Acute exercise restores insulin clearance in diet-induced obese mice. J Endocrinol. 2016;229:221–32. [DOI] [PubMed] [Google Scholar]
- [20].Cozar-Castellano I, Perdomo G. Assessment of insulin tolerance ex vivo. Methods Mol Biol. 2020;2128:291–300. [DOI] [PubMed] [Google Scholar]
- [21].Livak KJ, Schmittgen TD. Analysis of relative gene expression data using real-time quantitative PCR and the 2(−Delta Delta C(T)) Method. Methods. 2001;25:402–8. [DOI] [PubMed] [Google Scholar]
- [22].Qu S, Altomonte J, Perdomo G, He J, Fan Y, Kamagate A, et al. Aberrant Forkhead box O1 function is associated with impaired hepatic metabolism. Endocrinology. 2006; 147:5641–52. [DOI] [PMC free article] [PubMed] [Google Scholar]
- [23].Authier F, Posner BI, Bergeron JJ. Insulin-degrading enzyme. Clin Invest Med. 1996; 19:149–60. [PubMed] [Google Scholar]
- [24].Duckworth WC. Insulin degradation: mechanisms, products, and significance. Endocr Rev. 1988;9:319–45. [DOI] [PubMed] [Google Scholar]
- [25].Kotronen A, Juurinen L, Tiikkainen M, Vehkavaara S, Yki-Jarvinen H. Increased liver fat, impaired insulin clearance, and hepatic and adipose tissue insulin resistance in type 2 diabetes. Gastroenterology. 2008;135:122–30. [DOI] [PubMed] [Google Scholar]
- [26].Ferrannini E, Natali A, Bell P, Cavallo-Perin P, Lalic N, Mingrone G. Insulin resistance and hypersecretion in obesity. European Group for the Study of Insulin Resistance (EGIR). J Clin Invest. 1997;100:1166–73. [DOI] [PMC free article] [PubMed] [Google Scholar]
- [27].Jones CN, Abbasi F, Carantoni M, Polonsky KS, Reaven GM. Roles of insulin resistance and obesity in regulation of plasma insulin concentrations. Am J Physiol Endocrinol Metab. 2000;278:E501–8. [DOI] [PubMed] [Google Scholar]
- [28].Marini MA, Frontoni S, Succurro E, Arturi F, Fiorentino TV, Sciacqua A, et al. Differences in insulin clearance between metabolically healthy and unhealthy obese subjects. Acta Diabetol. 2014;51:257–61. [DOI] [PubMed] [Google Scholar]
- [29].Bergman RN, Piccinini F, Kabir M, Kolka CM, Ader M. Hypothesis: role of reduced hepatic insulin clearance in the pathogenesis of type 2 diabetes. Diabetes. 2019;68:1709–16. [DOI] [PMC free article] [PubMed] [Google Scholar]
- [30].Fosam A, Sikder S, Abel BS, Tella SH, Walter MF, Mari A, et al. Reduced insulin clearance and insulin-degrading enzyme activity contribute to hyperinsulinemia in African Americans. J Clin Endocrinol Metab. 2020;105. [DOI] [PMC free article] [PubMed] [Google Scholar]
- [31].Brandimarti P, Costa-Junior JM, Ferreira SM, Protzek AO, Santos GJ, Carneiro EM, et al. Cafeteria diet inhibits insulin clearance by reduced insulin-degrading enzyme expression and mRNA splicing. J Endocrinol. 2013;219:173–82. [DOI] [PubMed] [Google Scholar]
- [32].Castell-Auvi A, Cedo L, Pallares V, Blay M, Ardevol A, Pinent M. The effects of a cafeteria diet on insulin production and clearance in rats. Br J Nutr. 2012;108:1155–62. [DOI] [PubMed] [Google Scholar]
- [33].Wei X, Ke B, Zhao Z, Ye X, Gao Z, Ye J. Regulation of insulin degrading enzyme activity by obesity-associated factors and pioglitazone in liver of diet-induced obese mice. PloS One. 2014;9:e95399. [DOI] [PMC free article] [PubMed] [Google Scholar]
- [34].Ehrhardt N, Cui J, Dagdeviren S, Saengnipanthkul S, Goodridge HS, Kim JK, et al. Adiposity-independent effects of aging on insulin sensitivity and clearance in mice and humans. Obesity. 2019;27:434–43. [DOI] [PMC free article] [PubMed] [Google Scholar]
- [35].Caravaggio JW, Hasu M, MacLaren R, Thabet M, Raizman JE, Veinot JP, et al. Insulin-degrading enzyme deficiency in bone marrow cells increases atherosclerosis in LDL receptor-deficient mice. Cardiovasc Pathol Off J Soc Cardiovasc Pathol. 2013;22:458–64. [DOI] [PubMed] [Google Scholar]
- [36].Kupfer SR, Wilson EM, French FS. Androgen and glucocorticoid receptors interact with insulin degrading enzyme. J Biol Chem. 1994;269:20622–8. [PubMed] [Google Scholar]
- [37].Thorens B, Sarkar HK, Kaback HR, Lodish HF. Cloning and functional expression in bacteria of a novel glucose transporter present in liver, intestine, kidney, and beta-pancreatic islet cells. Cell. 1988;55:281–90. [DOI] [PubMed] [Google Scholar]
- [38].Guillam MT, Burcelin R, Thorens B. Normal hepatic glucose production in the absence of GLUT2 reveals an alternative pathway for glucose release from hepatocytes. Proc Natl Acad Sci U S A. 1998;95:12317–21. [DOI] [PMC free article] [PubMed] [Google Scholar]
- [39].Dufer M, Horth K, Wagner R, Schittenhelm B, Prowald S, Wagner TF, et al. Bile acids acutely stimulate insulin secretion of mouse beta-cells via farnesoid X receptor activation and K(ATP) channel inhibition. Diabetes. 2012;61:1479–89. [DOI] [PMC free article] [PubMed] [Google Scholar]
- [40].Seyer P, Vallois D, Poitry-Yamate C, Schutz F, Metref S, Tarussio D, et al. Hepatic glucose sensing is required to preserve beta cell glucose competence. J Clin Invest. 2013;123:1662–76. [DOI] [PMC free article] [PubMed] [Google Scholar]
- [41].Burcelin R, Dolci W, Thorens B. Portal glucose infusion in the mouse induces hypoglycemia: evidence that the hepatoportal glucose sensor stimulates glucose utilization. Diabetes. 2000;49:1635–42. [DOI] [PubMed] [Google Scholar]
- [42].Burcelin R, Dolci W, Thorens B. Glucose sensing by the hepatoportal sensor is GLUT2-dependent: in vivo analysis in GLUT2-null mice. Diabetes. 2000;49:1643–8. [DOI] [PubMed] [Google Scholar]
- [43].Akiyama H, Shii K, Yokono K, Yonezawa K, Sato S, Watanabe K, et al. Cellular localization of insulin-degrading enzyme in rat liver using monoclonal antibodies specific for this enzyme. Biochem Biophys Res Commun. 1988;155:914–22. [DOI] [PubMed] [Google Scholar]
- [44].Pivovarova O, Hohn A, Grune T, Pfeiffer AF, Rudovich N. Insulin-degrading enzyme: new therapeutic target for diabetes and Alzheimer’s disease? Ann Med. 2016;48:614–24. [DOI] [PubMed] [Google Scholar]
Associated Data
This section collects any data citations, data availability statements, or supplementary materials included in this article.