Abstract
Destruction of myelin, or demyelination, is a characteristic of traumatic spinal cord injury and pathognomonic for primary demyelinating pathologies such as multiple sclerosis (MS). The regenerative process known as remyelination, which can occur following demyelination, fails as MS progresses. Models of focal demyelination by local injection of gliotoxins have provided important biological insights into the demyelination/remyelination process. Here, injection of lysolecithin to induce spinal cord demyelination is investigated using matrix-assisted laser desorption/ionization mass spectrometry imaging. A segmentation analysis revealed changes to the lipid composition during lysolecithin-induced demyelination at the lesion site and subsequent remyelination over time. The results of this study can be utilized to identify potential myelin-repair mechanisms and in the design of therapeutic strategies to enhance myelin repair.
Keywords: mass spectrometry imaging, myelin, spinal cord, lipids, demyelination
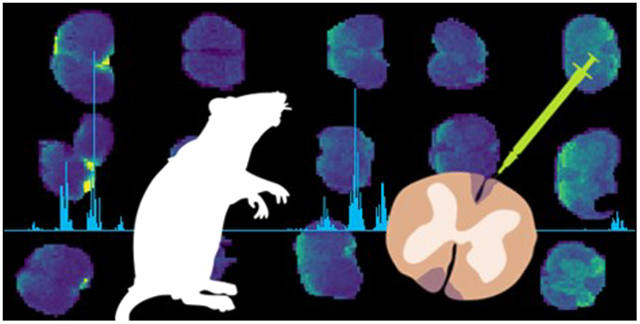
Graphical Abstract
INTRODUCTION
Myelin is a substance rich in lipids, proteins, and water that is organized into sheets wrapped around axons to provide rapid saltatory conduction in the central nervous system (CNS), which in vertebrates is comprised of the brain and the spinal cord.1,2 Myelin sheaths are formed by oligodendrocytes.1,3–5 The destruction of myelin (or demyelination) can be precipitated by traumatic spinal cord injury (SCI)6 or by a number of demyelinating pathologies such as multiple sclerosis (MS),7–9 a neurodegenerative condition characterized by lesions in the white matter of the CNS due to attacks mediated by the immunological system. During the early stages of MS, remyelination in the CNS occurs after demyelination, and involves the combined recruitment, proliferation, and differentiation of oligodendrocyte precursor cells (OPCs) into oligodendrocytes that produce myelin.1,3–5 Remyelination fails as MS progresses, leaving many lesions demyelinated, with accompanying loss of axonal function.4,9,10
Toxin-based approaches are used in rodents to investigate the effects of demyelination and the subsequent remyelination process without the confounding effects from modulation of demyelination due to immune response. Of these, injection of lysolecithin (lysophosphatidylcholine, LPC) into the white matter of the CNS is commonly employed.11–13 As noted recently, LPC-induced demyelination offer several advantages for the study of remyelination, including the highly stereotypic pattern of cellular and molecular events that occur in a time-dependent manner.14 Previous transcriptomic approaches have used microdissection of lesion-containing tissue to identify genome-wide changes in gene expression following demyelination.15 Single cell RNA-seq allows more precise analysis, but this is still limited by inaccuracies inherent with microdissection. Recently, neutral red identification of demyelinated lesions allows a substantial refinement14 but still lacks sufficient spatial resolution to identify differential changes in the demyelinated lesion core or periphery.
Mass spectrometry imaging (MSI) is a method that combines microscopic imaging analysis to mass spectrometry to interrogate surfaces, thereby obtaining spatial distributions by mass-to-charge (m/z) ratios.16–19 MSI can be traced back to the 1960s, when secondary ion mass spectrometry (SIMS) was first used to examine the elemental composition of surfaces,20 eventually translating to molecular profiling of tissues.21 The major limitation noted for MSI using SIMS is the lack of sensitivity above m/z 1000 due to in-source fragmentation and relatively low ionization yield; in addition, discrimination against hydrophilic substances and the lack of tandem mass spectrometry (MS/MS) capabilities on most SIMS instruments are further limitations for MSI applications, despite the high spatial resolution that can be obtained.16 Molecular MSI has had tremendous growth and increasing importance in biomedicine since it was combined with matrix-assisted laser desorption/ionization (MALDI)22 and desorption electrospray ionization (DESI).23
MSI has been applied to healthy and injured spinal cord tissue. Lipid profiling of healthy rat spinal cords by intermediate pressure MALDI was demonstrated using a hybrid linear ion trap-Orbitrap mass spectrometer,24 including MS/MS with high resolution for the identification of the specific lipid species. Using DESI and MS/MS, lipids in healthy rat spinal cords were profiled and identified, and furthermore, they were distinguished based on localization in white or gray matter.25 MALDI MSI was utilized to profile phosphatidylcholines (PCs) following contusion injury in rat spinal cord tissue; the elevation of PCs containing arachidonic acid and LPCs at the impact site was observed 1 week following spinal cord injury; however, this was resolved by 8-weeks postinjury.26 Three-dimensional (3D) MALDI MSI has been utilized to follow the temporal changes that occur in rat spinal cord tissue following acute injury.27,28 One study focused on proteomic changes following injury,27 while a second revealed the presence on long-chain acylcarnitines in the lesion margins.28 DESI MSI was employed in a comparison of healthy and injured rat spinal cord tissue and revealed evidence of lipid hydrolysis during demyelination, as relative abundances of fatty acids, diacylglycerols, and lysolipids increased while other lipids decreased at and near the lesion site.29
Isolation of the lesion site in injured spinal cord tissue is nontrivial and furthermore can confound analysis of molecular and cellular events taking place at the site of injury. Using MALDI MSI, lipid profiling on murine spinal cords is performed at different key time points during the demyelination/remyelination cycle associated with LPC injury. MSI readily identifies lesion sites with molecular profiling. Such information can be valuable in understanding the process of remyelination and in the design of potential therapeutic strategies to enhance myelin repair.
METHODS
Chemicals.
1,5-Diaminonaphthalene (97%), lysolecithin (99%), and gelatin from porcine skin were acquired from Sigma-Aldrich (St. Louis, MO, USA).
Mice Spinal Cord Demyelination Model.
All experiments were performed according to protocols approved by the University at Buffalo’s Institutional Animal Care and Use Committee. For these experiments 8-week old female BalbC mice were purchased from Envigo. Focal demyelination of the young adult (8 week) mouse spinal cord was induced as previously described.30 Hypomyelinating shiverer/rag mice, commonly used as a model for the evaluation of regenerative and therapeutic repair because they lack myelin basic protein (MBP), were used for comparison.30 Briefly, animals were anesthetized under isoflurane, and 0.5 μL of 1% lysolecithin (LPC, α-lysophosphatidylcholine) was directly injected into the dorsal and ventral funiculus of the spinal cord between two thoracolumbar vertebrae. Postoperative analgesia was provided by subcutaneous injection of buprenorphine (0.05 mg/mL).
Tissue Processing.
Three animals for each condition were euthanized at 3-, 7-, 14-, and 28-days postlesion (dpl) under deep anesthesia. The spinal column was extracted and snap frozen in 3% gelatin and sectioned coronally at a 16 μm thickness using a Leica cryostat. Lesions were identified as regions of lighter eriochrome (solochrome) cyanine staining in the ventrolateral and/or dorsal white matter. Sections with lesions are mounted to indium tin oxide (ITO) slides from Bruker Daltonics (Billerica, MA, USA) for MSI analysis and superfrost plus slides for immunohistochemistry.
MALDI MSI.
For MSI, ITO-coated slides with fresh frozen tissue samples were coated with a thin layer of 1,5-diaminonapthalene matrix via an in-house sublimation chamber. Prior to sublimation, slides were placed in a desiccator to come to room temperature while the sublimation chamber was heated to 140 °C. Two slides were prepared simultaneously within the sublimation chamber. Sublimation was allowed to persist for 20 min, with pressure stabilizing at 110 mTorr. The sample was desiccated before weighing, and measurement of the area sublimed was calculated for the determination of coverage, with an average coverage of 234 μg/cm2.
A digital scan of the prepared slides was acquired using a Brother MFC-L2710DW scanner; this file was loaded into FlexImaging 5.0 to control a Bruker Daltonics 12T SolariX Fourier transform ion cyclotron resonance (FT-ICR) mass spectrometer equipped with a dual electrospray and MALDI source with a 1 kHz SmartBeam II frequency-tripled (355 nm) Nd:YAG laser (Bremen, Germany). For MALDI-MSI, laser conditions were set to 1000 laser shots per pixel obtained at a 1 kHz repetition rate and a 75 μm spatial resolution with a minimum focus. Broadband excitation was used to detect from m/z 98.3 to 2000, with 2MB time domain data sets collected. At this setting, the resolving power for the m/z 496.343 peak, protonated LPC 16:0, is ~100 K.
Processing of Molecular Images and Data Analysis.
Data were exported from FlexImaging 5.0 as an .imzML file and was either imported into the R-package Cardinal MSI (2.5.7)31 for preprocessing and statistical analysis, Metaboanalyst,32 or Metaspace202033 (https://metaspace2020.eu) for putative identification. Once loaded into Cardinal, the resolution is estimated and then changed to a lower value (50 ppm); regions of interest (ROIs) are selected to diminish the number of pixels off of the tissue and consequently diminishing matrix signal. Data were processed and analyzed separately and by combining ROIs from replicates to allow for the normalization and enhancement of images for comparison. Root-mean-square normalization was utilized to account for differences between samples. Spectral smoothing using a Gaussian filter is used to reduce noise, and baseline reduction is completed using median interpolation prior to peak processing to filter out peaks with intensities of zero in pixels.
Using the preprocessed file, peak picking is utilized to create a set of reference peaks based on the constant noise of the average spectrum from the standard deviations of low-kurtosis bins for the next steps. Peak alignment is based upon the reference peaks provided to the software, which in our case are the data from the last processing step. The peaks in the data set are matched based on their proximity to the reference m/z values; for the purpose of this experiment, a value of 100 ppm was utilized. To reduce the size of the data set and further investigate species with only significant changes in this set of experiments, peak filtering was utilized. Any peak that was detected in less than 5% of pixels is eliminated from the analysis. Finally, peak binning is utilized to obtain a more accurate representation of peak intensities after the processing steps completed thus far. The aforementioned chosen tolerance is used to match reference peaks within the spectra and bin them to reduce the effects from potential unwanted signals. The values that are binned together are replaced by a value calculated by Cardinal in which the peak is summarized by the maximum intensity.
Principle component analysis was completed for the first three components and for the observation of variance between samples. Spatially aware shrunken centroids (SSC) analysis34 was completed for simultaneous detection of segmentation and feature selection. SSC was chosen because it requires no prior knowledge of analyte identity and is focused on quantitative differences between images, central to this study because of the potential time-dependent molecular changes following LPC injury. The top features found by SSC were utilized to narrow the list of species of interest for investigation.
Metaspace2020 was used for the determination of putative matches to further investigate the imaging results. Here, the databases utilized were HMDB (v4), LipidMaps (2017–12–12), and SwissLipids (2018–02–02) due to the interest in the discovery of lipid changes. A false discovery rate (FDR) of 20% was chosen to widen the scope of species observed after an initial analysis of species less than 10% FDR was completed and showed only a few matches. The analysis of adducts and metabolite signal matching scores (MSM) were utilized to further determine the likelihood of potential matches.
RESULTS AND DISCUSSION
The loss of neurological function and chronic demyelination-associated disease progression in multiple sclerosis could potentially be restored using regenerative therapies that promote remyelination. Here, using MALDI MSI, the impact of lysolecithin-induced demyelination and subsequent remyelation was examined. Time points were chosen due to their known significance during the remyelination process to compare with the uninjured control. These include oligodendrocyte progenitor cell (OPC) recruitment (3 dpl), differentiation (7 dpl), and remyelination (14 and 28 dpl). Lysolecithin injection damages the myelin sheath. By 3 dpl, OPCs have been recruited to the injury site, and by 7 dpl, the myelin sheath has been stripped. By 14 dpl, mature oligodendrocytes are present at the lesion site, and MBP rings are present, strongly suggesting that remyelination has begun. By 28 dpl, remyelination is essentially complete. A comprehensive discussion of this process is described elsewhere.11 The uninjured model displayed a very clear segmentation pattern in the whole data analysis by SSC as has been previously described34 (Figure 1). Within this segmentation model, separation into white and gray matter is observed as well as a separate secondary division in the gray matter indicative of the dorsal horns, consistent with the results of DESI MSI, revealing the noted “butterfly” distribution pattern of lipids observed in spinal cord tissue.29 Principal component analysis (PCA) plots also showed a distinct separation within the first component between the white and gray matter. The uninjured spinal cord was then utilized for comparison to injured spinal cords to determine potential differences in lipid levels, and in particular, their lesion sites. To complete this, initial observations of m/z distributions were performed using FlexImaging, and statistical comparisons were completed in both Cardinal MSI and MetaboAnalyst. The distinct segmentation observed in the uninjured model is lost upon injection of lysolecithin; however, at 14 and 28 dpl there is some restoration of segmentation between white and gray matter. The shiverer model lacks the distinct segmentation of the uninjured model (Supplementary Figure S1).
Figure 1.
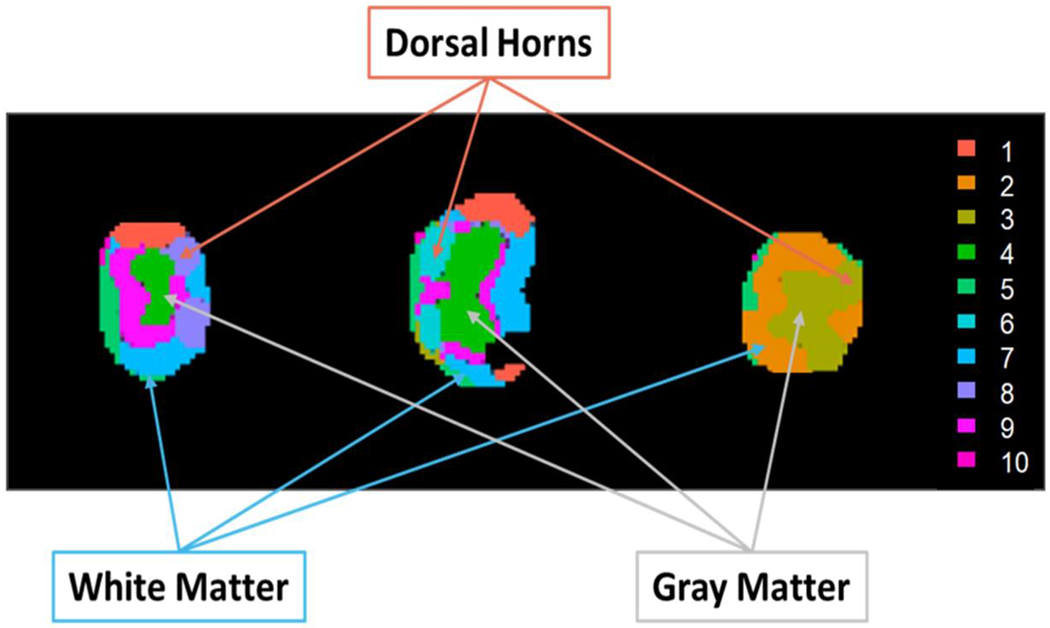
SSC segmentation of an uninjured spinal cord. In this instance, a spatial neighborhood radius of 2 pixels, a sparsity parameter of 3, and a limitation of 10 clusters were utilized for analysis.
Initial observations noted a lesion-like localization at m/z 496.343, 518.307, 524.354, and 546.354 within the 3-dpl spinal cord. A search of the masses within Metaspace shows that all four masses are LPCs found in lysolecithin, which are used to induce injury, and they correspond to protonated (+6 ppm mass error) and sodiated (−29 ppm) LPC 16:0 and protonated (−32 ppm) and sodiated (+2 ppm) LPC 18:0. These LPCs are also found endogenously; however, as shown in their mass spectra, their abundance is low in the uninjured spinal cord tissue (Figure 2A) relative to a lesion (Figure 2B, 3 dpl). Mass spectra of the entire sections of the different times after lysolecithin injection are provided in Supplementary Figure S2. A comparison of the distribution of the aforementioned masses is shown in Figure 3A–E; for comparison, histologically stained tissues on serial sections are depicted in Figure 3F–J (lesion areas are within dashed yellow segments). A comparison between the 3 dpl lysolecithin injury-induced spinal cord sections (Figure 3B) and the wildtype (WT) uninjured spinal cord sections (Figure 3A) indicates a high correlation with the localization of these LPCs in the 3 dpl sections to the lesion site, whereas they are distributed rather evenly throughout the 14 dpl (Figure 3D) and 28 dpl (Figure 3E) spinal sections, during the remyelination process, as well as the control (Figure 3A). At 7 dpl (Figure 3C) corresponding to differentiation, there has been a marked change in the distribution of the LPCs from lysolecithin compared to the OPC recruitment phase at 3 dpl (Figure 3B). The reproducibility in MSI of the uninjured and each of the time points after injury are provided in Supplementary Figure S3.
Figure 2.
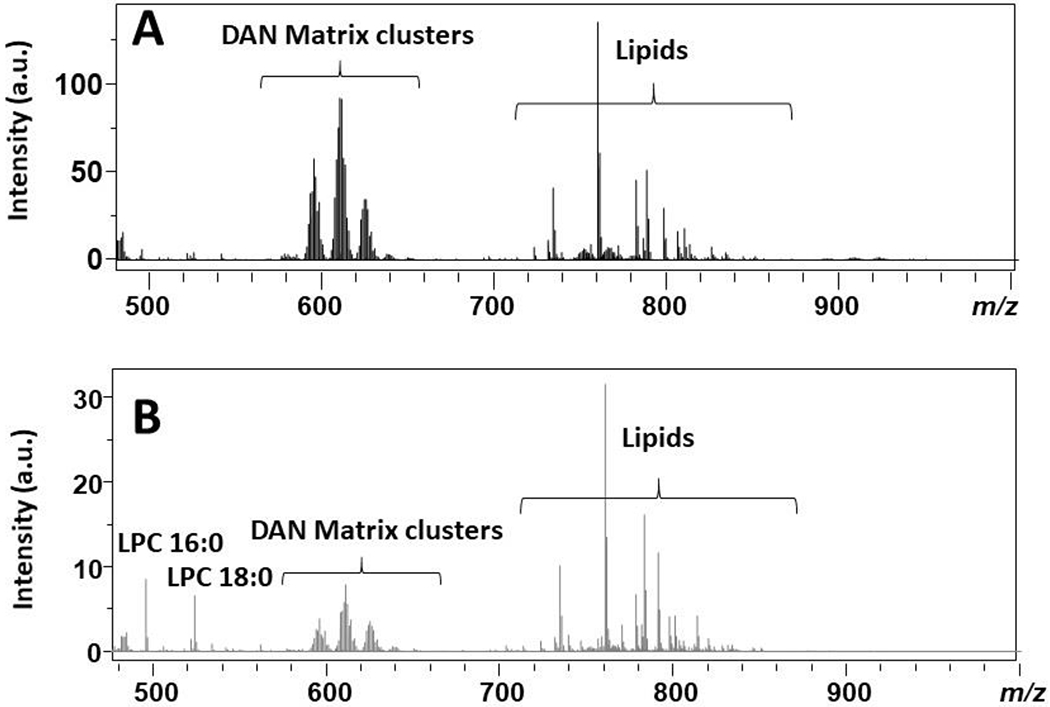
MALDI mass spectra over the range m/z 480–1000 for (A) the average of three uninjured spinal cords and (B) a pixel within the lesion (3 dpl).
Figure 3.
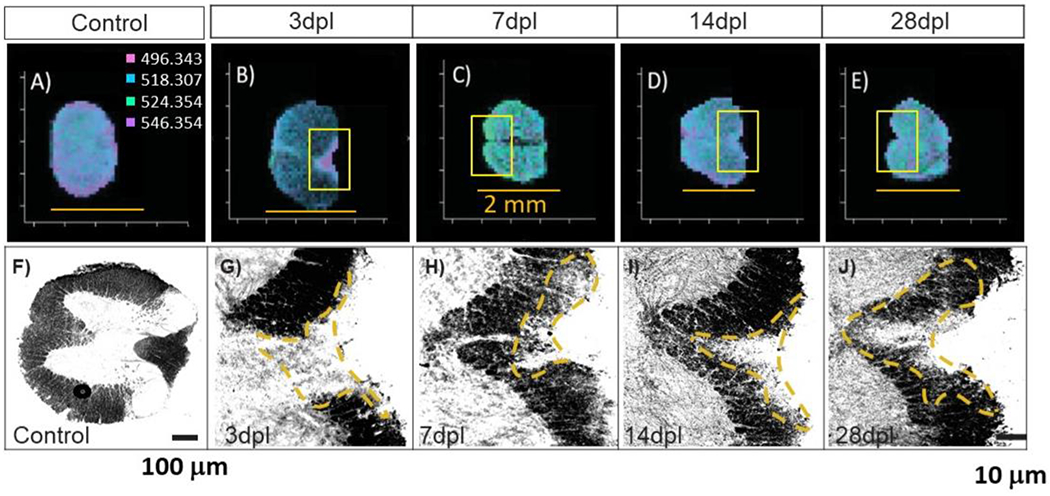
MALDI MSI of (A) uinjured, (B) 3 dpl, (C) 7 dpl, (D) 14 dpl, and (E) 28 dpl (scale bars = 2 mm) spinal cord sections, and corresponding stained tissue of (F) uninjured, (G) 3 dpl, (H) 7 dpl, (I) 14 dpl, and (J) 28 dpl spinal cord sections. The boxed insets of panels B–E correspond to the stained images G–J.
From this imaging data, Cardinal MSI was employed to deduce colocalization after preprocessing for m/z 496.343 (protonated LPC 16:0). A list of the top 25 m/z correlating to the lesion area within the 3 dpl model (n = 3) was created for use in analysis and is provided in Table 1. A compilation of the control spinal cord (Supplementary Table S1), the 7 dpl, 14 dpl, and 28 dpl (Supplementary Tables S2–S4), and the shiverer/rag model (Supplementary Table S5) were created in Cardinal to analyze the changes within the lipid levels (all points normalized to one another). A number of species always exhibit a high correlation with LPC 16:0, while a few are observed at only one or two time points. These were then searched within the Metaspace2020 analysis of the data, and putative matches were identified for further analyses.
Table 1.
Top 25 m/z in the 3 DPL Sections Based on a Pearson Correlation (n = 3)a
| ranking | m/z | correlation | M1 | M2 |
|---|---|---|---|---|
| 1 | 496.343 | 1 | 1 | 1 |
| 2 | 497.337 | 0.95900 | 0.81051 | 0.81051 |
| 3 | 524.354 | 0.94556 | 0.79737 | 0.79737 |
| 4 | 248.183 | 0.91390 | 0.66375 | 0.66375 |
| 5 | 525.404 | 0.90948 | 0.71522 | 0.71522 |
| 6 | 518.307 | 0.88210 | 0.74699 | 0.74699 |
| 7 | 546.354 | 0.84859 | 0.65279 | 0.65279 |
| 8 | 522.366 | 0.69048 | 0.70756 | 0.70756 |
| 9 | 562.318 | 0.67275 | 0.65060 | 0.65060 |
| 10 | 519.345 | 0.67189 | 0.57393 | 0.57393 |
| 11 | 478.314 | 0.63945 | 0.75356 | 0.75356 |
| 12 | 547.393 | 0.62699 | 0.50712 | 0.50712 |
| 13 | 506.370 | 0.60996 | 0.72289 | 0.72289 |
| 14 | 510.386 | 0.58206 | 0.53669 | 0.53669 |
| 15 | 550.412 | 0.57451 | 0.60022 | 0.60022 |
| 16 | 520.384 | 0.57120 | 0.63636 | 0.63636 |
| 17 | 523.359 | 0.54311 | 0.67032 | 0.67032 |
| 18 | 262.190 | 0.53957 | 0.52903 | 0.52903 |
| 19 | 534.305 | 0.53914 | 0.68018 | 0.68018 |
| 20 | 165.400 | 0.50123 | 0.50712 | 0.50712 |
| 21 | 165.450 | 0.50123 | 0.50712 | 0.50712 |
| 22 | 718.573 | 0.42203 | 0.64294 | 0.64294 |
| 23 | 507.384 | 0.41696 | 0.64622 | 0.64622 |
| 24 | 759.581 | 0.37499 | 0.71522 | 0.71522 |
| 25 | 703.570 | 0.37437 | 0.72070 | 0.72070 |
M1 and M2 correlate to the Manders’ colocalization coefficients.
In the analysis of the combinatory data of time points to the uninjured control, PCA of the entire data set provided little evidence of distinguishing features between principle components (Supplementary Figure S4). Upon filtering the data to allow for only a m/z range of 700–1000 Da, a distinction between white and gray matter became apparent within the sample sets as well as enhancements and depletions within the dorsal horns (Supplementary Figure S5), again consistent with observations by DESI MSI, which revealed the “butterfly” pattern within the spinal tissue.29
Comparison with Lysolecithin-Induced Damage to the Shiverer model.
Hypomyelinated shiverer mice were utilized to investigate changes within the lipid metabolism and composition as opposed to the injury time points. Shiverer mice lack MBP and therefore are unable to properly compact the myelin sheaths, potentially altering the lipid landscape.35 A PCA loadings plot analysis shows distinct differences in the groupings of these models (Figure 4). Inspection of the loadings plot compared to the m/z values in this instance shows that, when creating images of the noted m/z values that were due to the injection of lysolecithin (Figure 4), the Shiverer models did not show an enhancement of the m/z at any locations; rather, they exhibited great similarity to the uninjured sections, with equally distributed ion images.
Figure 4.
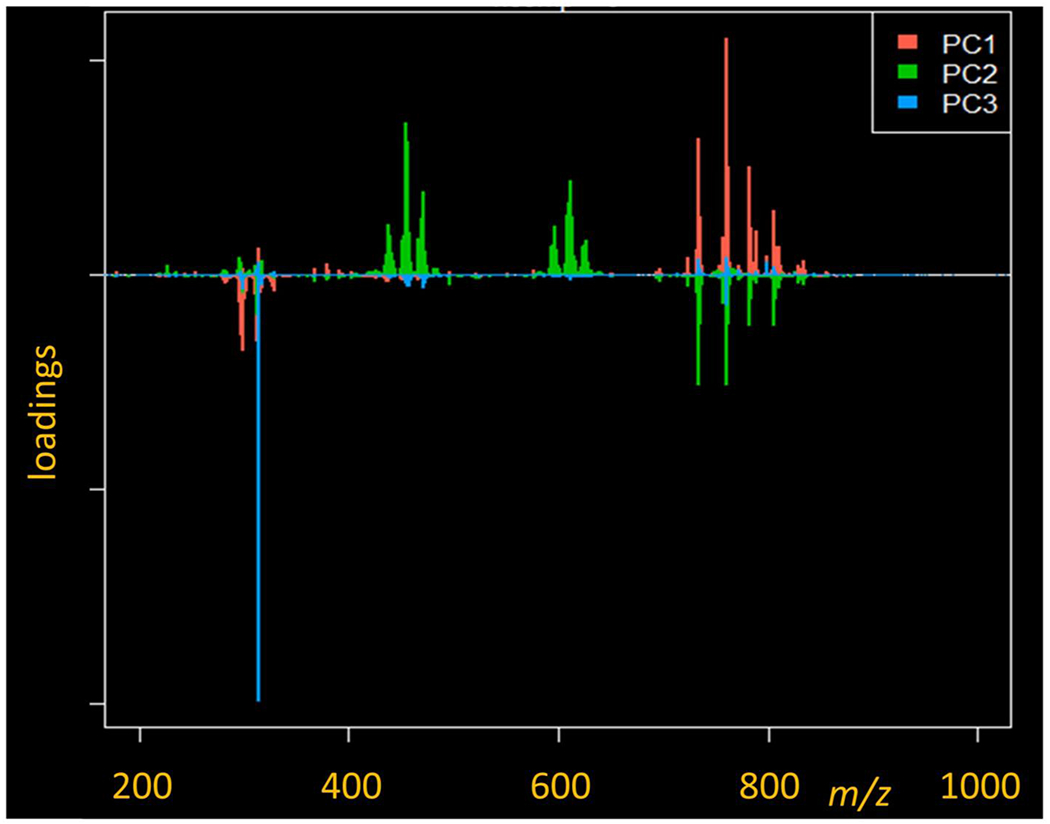
PCA loadings plot for the top three principle components between the 3 dpl and shiverer models.
When utilizing a mass filter from 700–1000 Da on the data displayed as a PCA plot (Supplementary Figure S6), the principle components of the data sets depict an enhancement in the white matter in the first component in the lysolecithin-induced 3 dpl sections; the secondary component also displays an enhancement within the white matter. The shiverer model exemplifies the same pattern for the secondary component. Both models having strong enhancements in principle component one throughout the gray matter; however, the 3 dpl model only sees an enhancement within the dorsal horns of the image. Within the secondary component, the 3 dpl and shiverer models are subdued.
An inspection of the loadings plot compared to the m/z values in this instance shows that the largest contributor to the enhancement within the primary component is 760.570 Da. Utilizing this data in conjunction with Metaspace shows a high probability (FDR 5%, +Na and + K adducts observed) that the component is a glucosyl ceramide (GlcCer, 39:6). In the secondary component, the enhancement within the white matter of the models is observed primarily from m/z 788.607 (putative PC 36:1) with depletion primarily from m/z 734.557 (putative PC 32:0).
When creating images of the noted m/z that were due to the injection of lysolecithin (Figure 5), the shiverer models did not show an enhancement of the m/z at any locations; rather, they exhibited great similarity to the uninjured sections, with equally distributed ion images.
Figure 5.
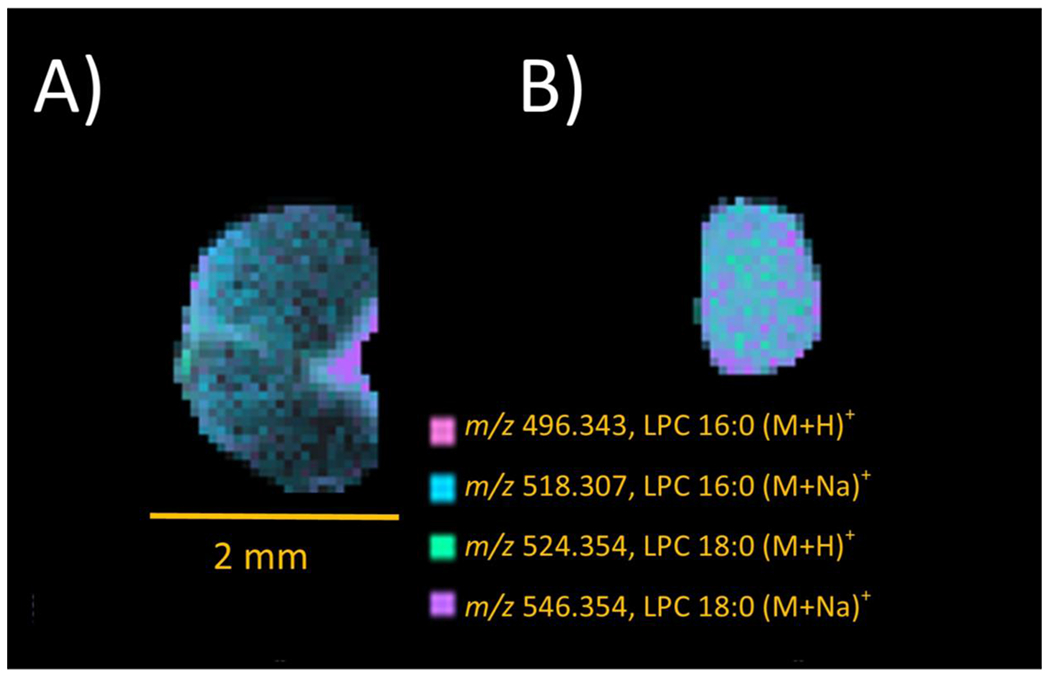
MSI images for the protonated and sodiated 16:0 and 18:0 LPCs from lysolecithin in (A) 3 dpl WT and (B) shiverer spinal cord sections. Scale bars = 2 mm.
Implications of the Process of Myelin Damage and Repair.
Through the utilization of colocalizations with putative matching from Metaspace, a strong presence of PCs is noted. In analyzing the images created from this data, it was noted that, although strong images of injection locations were noticed in the 3 dpl, in certain colocalizations, the injection site was not observed in the 7 dpl sections but made a reoccurrence with the 14 dpl and 28 dpl sections. It is possible that these noted masses may play a role in the remyelination process to the site of injury. Another example is shown in Figure 6, in which m/z 720.588 is observed. This species is prominent in the dorsal horns of the uninjured specimens (Figure 6A) and is still present opposite the injection site at 3 dpl (Figure 6B). Within the 7 dpl, this species is distributed at the periphery of the tissue in a much lower abundance than previously observed (Figure 6C), yet the 14 (Figure 6D) and 28 dpl (Figure 6E) models exhibit a much stronger signal intensity opposite to their respective injection sites. Within Metaspace, a putative match was given to a potassiated ceramide (Cer 45:6, −3 ppm), a lipid within the class of sphingolipids that have been noted to regulate both repair and inflammation in spinal injuries as well as being accumulated within lesions of active demyelination.36,37
Figure 6.
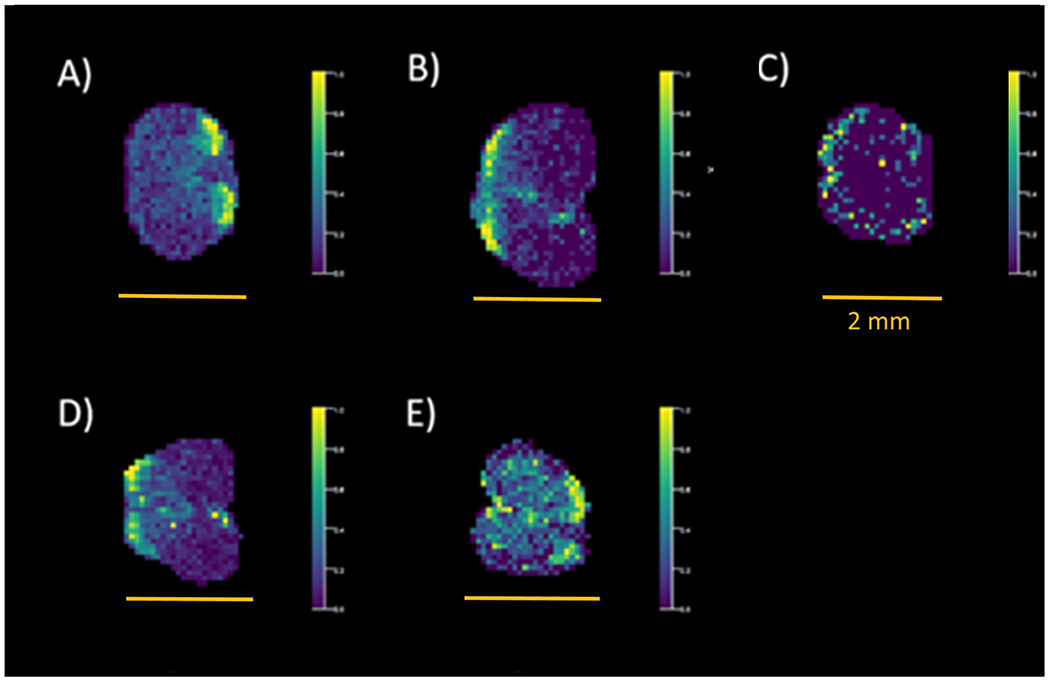
MSI images for a putative potassiated ceramide in (A) uninjured, (B) 3 dpl, (C) 7 dpl, (D) 14 dpl, and (E) 28 dpl spinal cord sections. Scale bars = 2 mm.
CONCLUSIONS
The goal of this study was to ascertain lipid changes occurring primarily within the lesions in primary demyelination. Although many studies have been done previously, these have mainly utilized spinal cord homogenates to examine lipid levels throughout the entirety of the spinal cord. Through the utilization of MSI, a clear depiction of species that are colocalized to the injection sites can be obtained, furthering our knowledge of the remyelination process. In the case of these experiments, localizations of ceramide and sphingomyelin species within the later time points during which remyelination is occurring provide strong candidates for further analyses. These candidates will prove to be imperative in discovering possible treatments to be utilized within primary demyelination diseases. Through the utilization of software such as Cardinal MSI and Metaspace 2020, candidates of interest can be identified and putatively matched for further investigation by tandem MS. In an untargeted metabolomics experiment, this is imperative to reduce the time needed as well as the number of components to investigate further. As both software platforms continue to be developed, they prove to be strong, user-friendly platforms for the analysis of imaging experiments.
These results show that MSI is a very promising approach to examine temporal molecular changes due to injury-induced demyelination and subsequent remyelination in murine spinal cords. The power of this approach is based on the ability to localize the injury site and to differentiate it from other tissue as a function of time. Many promising lipid species have been observed by the MALDI MSI of lysolecithin-induced primary demyelination followed by remyelination herein. Both the inclusion of negative ion mode imaging as well as relative quantitation will be imperative to determine which chemical species are up- and down-regulated during demyelination and subsequent remyelination. This MSI approach to detect molecular changes at the lesion site has the potential to discover unknown mechanisms of myelin repair as well as to develop therapeutic targets for remyelination.
Supplementary Material
ACKNOWLEDGMENTS
We gratefully acknowledge the financial support of the National Institutes of Health (NIH) through the National Center for Research Resources (Grant No. S10-RR029517-01) for providing funding used to obtain the FT-ICR instrument and through National Institute of Neurological Disorders and Stroke (Grant No. R01-NS1040-21) for work done in the Sim Lab. The authors would also like to thank the developers of Metaspace and Cardinal MSI for all of their assistance in working with their programs.
Footnotes
Supporting Information
The Supporting Information is available free of charge at https://pubs.acs.org/doi/10.1021/jasms.0c00187.
Supplementary Tables S1–S5 and Figures S1–S6 (PDF)
Complete contact information is available at: https://pubs.acs.org/10.1021/jasms.0c00187
The authors declare no competing financial interest.
Contributor Information
Emily R. Sekera, Department of Chemistry, Natural Sciences Complex, University at Buffalo State University of New York, Buffalo, New York 14260-3000, United States
Darpan Saraswat, Department of Pharmacology & Toxicology, Jacobs School of Medicine and Biomedical Sciences, 955 Main Street, University at Buffalo State University of New York, Buffalo, New York 14203, United States.
Kevin J. Zemaitis, Department of Chemistry, Natural Sciences Complex, University at Buffalo State University of New York, Buffalo, New York 14260-3000, United States
Fraser J. Sim, Department of Pharmacology & Toxicology, Jacobs School of Medicine and Biomedical Sciences, 955 Main Street, University at Buffalo State University of New York, Buffalo, New York 14203, United States
Troy D. Wood, Department of Chemistry, Natural Sciences Complex, University at Buffalo State University of New York, Buffalo, New York 14260-3000, United States.
REFERENCES
- (1).Snaidero N; Simons M The logistics of myelin biogenesis in the central nervous system. Glia 2017, 65 (7), 1021–1031. [DOI] [PubMed] [Google Scholar]
- (2).Stadelmann C; Timmler S; Barrantes-Freer A; Simons M Myelin in the Central Nervous System: Structure, Function, and Pathology. Physiol. Rev 2019, 99 (3), 1381–1431. [DOI] [PubMed] [Google Scholar]
- (3).Tomassy GS; Dershowitz LB; Arlotta P Diversity Matters: A Revised Guide to Myelination. Trends Cell Biol. 2016, 26 (2), 135–147. [DOI] [PMC free article] [PubMed] [Google Scholar]
- (4).Franklin RJ Why does remyelination fail in multiple sclerosis? Nat. Rev. Neurosci 2002, 3 (9), 705–14. [DOI] [PubMed] [Google Scholar]
- (5).Dietz KC; Polanco JJ; Pol SU; Sim FJ Targeting human oligodendrocyte progenitors for myelin repair. Exp. Neurol 2016, 283 (Part B), 489–500. [DOI] [PMC free article] [PubMed] [Google Scholar]
- (6).Alizadeh A; Dyck SM; Karimi-Abdolrezaee S Traumatic Spinal Cord Injury: An Overview of Pathophysiology, Models and Acute Injury Mechanisms. Front Neurol 2019, 10, 282. [DOI] [PMC free article] [PubMed] [Google Scholar]
- (7).Bramow S; Frischer JM; Lassmann H; Koch-Henriksen N; Lucchinetti CF; Sorensen PS; Laursen H Demyelination versus remyelination in progressive multiple sclerosis. Brain 2010, 133 (10), 2983–98. [DOI] [PubMed] [Google Scholar]
- (8).Haider L; Zrzavy T; Hametner S; Hoftberger R; Bagnato F; Grabner G; Trattnig S; Pfeifenbring S; Bruck W; Lassmann H The topograpy of demyelination and neurodegeneration in the multiple sclerosis brain. Brain 2016, 139 (3), 807–15. [DOI] [PMC free article] [PubMed] [Google Scholar]
- (9).Podbielska M; Banik NL; Kurowska E; Hogan EL Myelin recovery in multiple sclerosis: the challenge of remyelination. Brain Sci. 2013, 3 (3), 1282–324. [DOI] [PMC free article] [PubMed] [Google Scholar]
- (10).Franklin RJ; Ffrench-Constant C Remyelination in the CNS: from biology to therapy. Nat. Rev. Neurosci 2008, 9 (11), 839–55. [DOI] [PubMed] [Google Scholar]
- (11).Keough MB; Jensen SK; Yong VW Experimental demyelination and remyelination of murine spinal cord by focal injection of lysolecithin. J. Visualized Exp 2015, No. 97, e52679. [DOI] [PMC free article] [PubMed] [Google Scholar]
- (12).Blakemore WF; Franklin RJ Remyelination in experimental models of toxin-induced demyelination. Curr. Top. Microbiol. Immunol 2008, 318, 193–212. [DOI] [PubMed] [Google Scholar]
- (13).Plemel JR; Michaels NJ; Weishaupt N; Caprariello AV; Keough MB; Rogers JA; Yukseloglu A; Lim J; Patel VV; Rawji KS; Jensen SK; Teo W; Heyne B; Whitehead SN; Stys PK; Yong VW Mechanisms of lysophosphatidylcholine-induced demyelination: A primary lipid disrupting myelinopathy. Glia 2018, 66 (2), 327–347. [DOI] [PubMed] [Google Scholar]
- (14).Baydyuk M; Cha DS; Hu J; Yamazaki R; Miller EM; Smith VN; Kelly KA; Huang JK Tracking the evolution of CNS remyelinating lesion in mice with neutral red dye. Proc. Natl. Acad. Sci. U. S. A 2019, 116 (28), 14290–14299. [DOI] [PMC free article] [PubMed] [Google Scholar]
- (15).Huang JK; Jarjour AA; Nait Oumesmar B; Kerninon C; Williams A; Krezel W; Kagechika H; Bauer J; Zhao C; Evercooren AB-V; Chambon P; ffrench-Constant C; Franklin RJM Retinoid X receptor gamma signaling accelerates CNS remyelination. Nat. Neurosci 2011, 14 (1), 45–53. [DOI] [PMC free article] [PubMed] [Google Scholar]
- (16).McDonnell LA; Heeren RM Imaging mass spectrometry. Mass Spectrom. Rev 2007, 26 (4), 606–43. [DOI] [PubMed] [Google Scholar]
- (17).Todd PJ; Schaaff TG; Chaurand P; Caprioli RM Organic ion imaging of biological tissue with secondary ion mass spectrometry and matrix-assisted laser desorption/ionization. J. Mass Spectrom 2001, 36 (4), 355–69. [DOI] [PubMed] [Google Scholar]
- (18).Vickerman JC Molecular imaging and depth profiling by mass spectrometry–SIMS, MALDI or DESI? Analyst 2011, 136 (11), 2199–217. [DOI] [PubMed] [Google Scholar]
- (19).Weaver EM; Hummon AB Imaging mass spectrometry: from tissue sections to cell cultures. Adv. Drug Delivery Rev 2013, 65 (8), 1039–55. [DOI] [PubMed] [Google Scholar]
- (20).Castaing R; Slodzian K Microanalyse par emission ionique secondaire. J. de Microscopie 1962, 1 , 395–410. [Google Scholar]
- (21).Colliver TL; Brummel CL; Pacholski ML; Swanek FD; Ewing AG; Winograd N Atomic and molecular imaging at the single-cell level with TOF-SIMS. Anal. Chem 1997, 69 (13), 2225–31. [DOI] [PubMed] [Google Scholar]
- (22).Caprioli RM; Farmer TB; Gile J Molecular imaging of biological samples: localization of peptides and proteins using MALDI-TOF MS. Anal. Chem 1997, 69 (23), 4751–60. [DOI] [PubMed] [Google Scholar]
- (23).Wiseman JM; Ifa DR; Song Q; Cooks RG Tissue imaging at atmospheric pressure using desorption electrospray ionization (DESI) mass spectrometry. Angew. Chem., Int. Ed 2006, 45 (43), 7188–92. [DOI] [PubMed] [Google Scholar]
- (24).Landgraf RR; Prieto Conaway MC; Garrett TJ; Stacpoole PW; Yost RA Imaging of lipids in spinal cord using intermediate pressure matrix-assisted laser desorption-linear ion trap/Orbitrap MS. Anal. Chem 2009, 81 (20), 8488–95. [DOI] [PMC free article] [PubMed] [Google Scholar]
- (25).Girod M; Shi Y; Cheng JX; Cooks RG Desorption electrospray ionization imaging mass spectrometry of lipids in rat spinal cord. J. Am. Soc. Mass Spectrom 2010, 21 (7), 1177–89. [DOI] [PubMed] [Google Scholar]
- (26).Hanada M; Sugiura Y; Shinjo R; Masaki N; Imagama S; Ishiguro N; Matsuyama Y; Setou M Spatiotemporal alteration of phospholipids and prostaglandins in a rat model of spinal cord injury. Anal. Bioanal. Chem 2012, 403 (7), 1873–84. [DOI] [PubMed] [Google Scholar]
- (27).Devaux S; Cizkova D; Quanico J; Franck J; Nataf S; Pays L; Hauberg-Lotte L; Maass P; Kobarg JH; Kobeissy F; Meriaux C; Wisztorski M; Slovinska L; Blasko J; Cigankova V; Fournier I; Salzet M Proteomic Analysis of the Spatio-temporal Based Molecular Kinetics of Acute Spinal Cord Injury Identifies a Time- and Segment-specific Window for Effective Tissue Repair. Mol. Cell. Proteomics 2016, 15 (8), 2641–70. [DOI] [PMC free article] [PubMed] [Google Scholar]
- (28).Quanico J; Hauberg-Lotte L; Devaux S; Laouby Z; Meriaux C; Raffo-Romero A; Rose M; Westerheide L; Vehmeyer J; Rodet F; Maass P; Cizkova D; Zilka N; Cubinkova V; Fournier I; Salzet M 3D MALDI mass spectrometry imaging reveals specific localization of long-chain acylcarnitines within a 10-day time window of spinal cord injury. Sci. Rep 2018, 8 (1), 16083. [DOI] [PMC free article] [PubMed] [Google Scholar]
- (29).Girod M; Shi Y; Cheng JX; Cooks RG Mapping lipid alterations in traumatically injured rat spinal cord by desorption electrospray ionization imaging mass spectrometry. Anal. Chem 2011, 83 (1), 207–15. [DOI] [PMC free article] [PubMed] [Google Scholar]
- (30).Welliver RR; Polanco JJ; Seidman RA; Sinha AK; O’Bara MA; Khaku ZM; Santiago Gonzalez DA; Nishiyama A; Wess J; Feltri ML; Paez PM; Sim FJ Muscarinic Receptor M3R Signaling Prevents Efficient Remyelination by Human and Mouse Oligodendrocyte Progenitor Cells. J. Neurosci 2018, 38 (31), 6921–6932. [DOI] [PMC free article] [PubMed] [Google Scholar]
- (31).Bemis KD; Harry A; Eberlin LS; Ferreira C; van de Ven SM; Mallick P; Stolowitz M; Vitek O Cardinal: an R package for statistical analysis of mass spectrometry-based imaging experiments. Bioinformatics 2015, 31 (14), 2418–20. [DOI] [PMC free article] [PubMed] [Google Scholar]
- (32).Chong J; Wishart DS; Xia J Using MetaboAnalyst 4.0 for Comprehensive and Integrative Metabolomics Data Analysis. Curr. Protoc Bioinformatics 2019, 68 (1), No. e86. [DOI] [PubMed] [Google Scholar]
- (33).Palmer A; Phapale P; Chernyavsky I; Lavigne R; Fay D; Tarasov A; Kovalev V; Fuchser J; Nikolenko S; Pineau C; Becker M; Alexandrov T FDR-controlled metabolite annotation for high-resolution imaging mass spectrometry. Nat. Methods 2017, 14 (1), 57–60. [DOI] [PubMed] [Google Scholar]
- (34).Bemis KD; Harry A; Eberlin LS; Ferreira CR; van de Ven SM; Mallick P; Stolowitz M; Vitek O Probabilistic Segmentation of Mass Spectrometry (MS) Images Helps Select Important Ions and Characterize Confidence in the Resulting Segments. Mol. Cell. Proteomics 2016, 15 (5), 1761–72. [DOI] [PMC free article] [PubMed] [Google Scholar]
- (35).Chernoff GF Shiverer: an autosomal recessive mutant mouse with myelin deficiency. J. Hered 1981, 72 (2), 128–128. [DOI] [PubMed] [Google Scholar]
- (36).Jones ZB; Ren Y Sphingolipids in spinal cord injury. Int. J. Physiol Pathophysiol Pharmacol 2016, 8 (2), 52–69. [PMC free article] [PubMed] [Google Scholar]
- (37).Kim S; Steelman AJ; Zhang Y; Kinney HC; Li J Aberrant upregulation of astroglial ceramide potentiates oligodendrocyte injury. Brain Pathol. 2012, 22 (1), 41–57. [DOI] [PMC free article] [PubMed] [Google Scholar]
Associated Data
This section collects any data citations, data availability statements, or supplementary materials included in this article.


