

Abstract
Parkinson’s disease (PD) is the second most common neurodegenerative disorder that results in motor dysfunction and, eventually, cognitive impairment. α-Synuclein protein is known as a central protein to the pathophysiology of PD, but the underlying pathological mechanism still remains to be elucidated. In an effort to understand how α-synuclein underlies the pathology of PD, various PD mouse models with α-synuclein overexpression have been developed. However, systemic analysis of the brain proteome of those mouse models is lacking. In this study, we established two mouse models of PD by injecting α-synuclein preformed fibrils (PFF) or by inducing overexpression of human A53T α-synuclein to investigate common pathways in the two different types of the PD mouse models. For more accurate quantification of mouse brain proteome, the proteins were quantified using the method of stable isotope labeling with amino acids in mammals. We identified a total of 8355 proteins from the two mouse models; ~6800 and ~7200 proteins from α-synuclein PFF-injected mice and human A53T α-synuclein transgenic mice, respectively. Through pathway analysis of the differentially expressed proteins common to both PD mouse models, it was discovered that the complement and coagulation cascade pathways were enriched in the PD mice compared to control animals. Notably, a validation study demonstrated that complement component 3 (C3)-positive astrocytes were increased in the ventral midbrain of the intrastriatal α-synuclein PFF-injected mice and C3 secreted from astrocytes could induce the degeneration of dopaminergic neurons. This is the first study that highlights the significance of the complement and coagulation pathways in the pathogenesis of PD through proteome analyses with two sophisticated mouse models of PD.
Keywords: Parkinson’s disease, stable isotope labeling with amino acids in mammals (SILAM), α-synuclein, mass spectrometry, complement and coagulation cascades, complement component 3 (C3), α-synuclein preformed fibrils, TetP-A53T α-synuclein transgenic mouse, dopaminergic neurons, astrocytes
Graphical Abstract

INTRODUCTION
Parkinson’s disease (PD) is a progressive neurological disorder that primarily affects the ability to control movement as the second most prevalent neurodegenerative disease.1 Although the pathological mechanism has not been well defined, numerous genes linked to the PD pathogenesis such as SNCA, LRRK2, Parkin, PINK1, DJ-1, and ATP13A2 have been reported.2 SNCA and LRRK2 are tightly linked to autosomal-dominant PD forms, whereas Parkin, PINK1, DJ-1, and ATP13A2 are implicated in autosomal-recessive PD forms.3 SNCA was the first gene identified that serves as a cause of PD development when it is mutated.4 Because the human α-synuclein is encoded by SNCA, researchers have focused on the functional role of α-synuclein in PD. In the past few years, many studies have demonstrated that the formation of abnormal aggregates of α-synuclein, which are contained in Lewy bodies (LB) and Lewy neurites, is one of the pathological hallmarks of PD.5
For a more in-depth comprehension of the underlying mechanisms of PD, several animal models, such as toxin-based models, α-synuclein genetic models, and α-synuclein-aggregate injection models, have been used.6–8 The neurotoxins, such as 1-methyl-4-phenyl-1,2,3,6-tetrahydropyridine (MPTP), 6-hydroxydopamine (6-OHDA), and rotenone, are widely used to produce toxin-based PD models. Although these neurotoxins induce rapid degeneration of the dopaminergic nigrostriatal pathway, all of the neurotoxin-based models lack LB, the representative PD hallmark.9 Currently, various α-synuclein transgenic animal models have been developed using different promoters for driving the expression of wild type or A53T, A30P, or E46K mutant α-synuclein.6 In some of these models, decreased striatal levels of tyrosine hydroxylase (TH) or dopamine (DA) along with the resulting motor behavioral deficits were observed, indicating that the accumulation of pathologic α-synuclein can significantly alter the function of DA neurons. Nigrostriatal degeneration, however, has been rarely detected in most of these transgenic animal models. Indeed, the prion protein promoter-driven A53T α-synuclein transgenic mouse model failed to exhibit DA neuronal loss in the substantia nigra par compacta (SNpc) or brainstem.10 DA neurons can degenerate when A53T α-synuclein expression is under the temporal and cell type-specific control of the tetracycline-regulated inducible system and the paired-like homeodomain 3 promoter in DA neurons. These transgenic mice exhibit dopaminergic neuronal degeneration, motor deficits, a decrease of DA release, and impairments of the autophagy-degradation pathway.11 To date, several studies have demonstrated prion-like cell-to-cell transmission of pathological α-synuclein aggregates. Embodying this remarkable pathological feature in an animal model, Luk et al. created a PD-like mouse model by a single intrastriatal injection of synthetic α-synuclein preformed fibrils (PFF), which promotes cell-to-cell transmission of pathological α-synuclein aggregates, the formation of LB pathology, progressive DA neuronal degeneration in the SNpc, and motor behavioral deficits.8
The proteomic findings from various animal models of PD, such as the MPTP-treated mouse model, 6-OHDA-injected rat model, and A30P and A53T α-synuclein transgenic mouse models, have provided many valuable insights into several pathways that may be related to disease pathogenesis.12–15 However, those proteomic analyses are limited because their proteome depths were shallow and the PD mouse models used did not sufficiently reflect the degeneration of DA neurons. Therefore, in-depth proteome analysis in mouse models that show visible PD-like phenotypes is required. We reasoned that common pathways observed in two different PD models representing both sporadic PD and familial PD that exhibit loss of DA neurons could provide novel insights into the PD pathogenesis and the degeneration of DA neurons. Accordingly, we conducted proteomic analyses using the ventral midbrains collected from the intrastriatal α-synuclein PFF-injected mouse model representing sporadic PD8,16,17 and the adeno-associated virus (AAV)-tetracycline-regulated transactivator (tTA)-injected tetracycline promoter (TetP)/A53T α-syn transgenic (Tg) mouse model representing familial PD.18 Because PD is characterized by selective and progressive loss of dopaminergic neurons in the substantia nigra compacta (SNpc), we conducted the proteomics analysis in the ventral midbrain region containing the SNpc. To create a model of PD, where degeneration of DA neurons occurs by cell-to-cell transmission of α-synuclein, we conducted unilateral intrastriatal injection of α-synuclein PFF to induce Lewy body-like pathology in non-Tg mice.8,19 For the intrastriatal injection, we performed stereotaxic surgeries to inject α-synuclein PFF into the striatum of C57BL/6 mice.16 In this model, PFF α-synuclein seeds are taken up by terminals within the striatum and transported through the nigrostriatal pathway back to the substantia nigra region, where they act as a template and promote/seed endogenous murine α-synuclein to accumulate into pathological α-synuclein aggregates, which lead to robust loss of DA neurons and motor deficits due to DA neurodegeneration. To create a model of PD, where degeneration of DA neurons occurs over the lifespan of a mouse, we employed tetracycline-regulated conditional Tg mice system.20–22 The advantage of this system is that it permits temporal and regional control of transgene together with relatively robust capacity for transgene induction by the tetracycline transactivator (tTA). Using this system, we generated TetP-hA53T mouse line18 and we could investigate the consequences of human A53T α-synuclein expression in the midbrain because PD is characterized by selective and progressive loss of dopaminergic neurons in the SNpc.
Mass spectrometry-based proteomics approaches have been widely used for global protein quantification from a variety of biological samples. Although a number of protein quantification methods using mass spectrometry have been developed, metabolic labeling-based approaches are generally considered as one of the most accurate quantification methods.23,24 Thus, we employed stable isotope labeling with amino acids in mammals (SILAM) for quantifying proteomic changes in two α-synuclein-driven mouse models of PD. Pathway analysis was conducted to discover affected pathways in both PD models and we found the coagulation and complement cascades are potentially involved in the neurodegenerative progress in PD. Many studies on signaling pathways related to PD pathogenesis have reported dysfunction of the immune system, mostly neuroinflammatory response, as a possible etiologic feature.25,26 The inflammation-induced neuronal loss is well known, with DA neurons in the midbrain exhibiting a significant vulnerability to cytokines and inflammatory factors in PD.27–30 Because microglia and astrocytes, immune cells in CNS, substantially reside in the SN, they could contribute to signaling pathways associated with inflammation-induced neuronal loss.16,31
To our knowledge, these data represent the first proteomics study in which two different PD mouse models, each recapitulating the loss of DA neurons observed in PD patients, were analyzed to discover affected pathways involved in the loss of DA neurons due to pathologic α-synuclein in PD. The pathways, including complement and coagulation cascades, discovered in this study will provide a useful clue for the further investigation of the PD pathogenesis mechanism.
EXPERIMENTAL PROCEDURES
Animal Models
All experimental procedures were conducted in accordance with the guidelines of the Laboratory Animal Manual of the National Institute of Health Guide to the Care and Use of Animals and were approved by the Johns Hopkins Medical Institute Animal Care and Use Committee. Strains of C57BL6 mice used for stereotaxic α-synuclein PFF injection were obtained from the Jackson Laboratories (ME, USA). To generate pPrP-TetP-hA53T α-synuclein mice, the cDNA encoding human WT α-synuclein was subcloned into the unique XhoI site of the 9.0 kb pPrP-TetP vector. Site-directed mutagenesis was conducted with the pPrP-TetP-WT α-synuclein construct as a template to generate pPrP-TetP-A53T α-synuclein construct. The hA53T mutation was confirmed by DNA sequencing. The pPrP-TetP-A53T α-synuclein construct was linearized with digestion with Not1 and the purified linearized DNA fragment (7 kb) was used for pronuclear microinjection of single-cell embryos from B6C3F2 strain and the one- or two-cell embryos were transferred into B6D2F1 pseudo-pregnant female mice to generate founder mice. This was conducted by the National Cancer Institute Transgenic Core Facility. Founder animals were screened for transgene incorporation by PCR of tail genomic DNA using TetP-α-synuclein primers (forward: CGG GTC GAG TAG GCG TGT AC; reverse: TCT AGA TGA TCC CCG GGT ACC GAG: PCR product: 173 bp). Positive founder mice with a high copy number of the transgene were crossed to B6 mice. The TetP-hA53T α-synuclein mouse line was generated in our previous study.18
Neuronal Culture
Primary cortical neuronal cultures were prepared and maintained as previously described.32 Briefly, a timed pregnant female CD1 mouse was purchased from Charles River, and primary cells were isolated from embryonic day 14–15 (E14–15) pups. Mixed cell cultures containing both neurons and glia were then grown on 24-well plates for use in cytotoxicity assays. The cultures were treated with 5 μM cytosine β-d-arabinofuranoside (AraC, Sigma) at day in vitro (DIV) 3 to reduce the number of glial cells.
Astrocyte Culture
Mouse pups at postnatal day 3 (P3) were obtained. After removal of the meninges, the brains were washed in PBS three times. The brains were transferred to 0.25% trypsin–EDTA, followed by 30 min with gentle agitation. DMEM/F12 (Gibco) supplemented with 10% heat-inactivated FBS, 50 U mL−1 penicillin, 50 μg mL−1 streptomycin, 2 mM l-glutamine, 100 μM nonessential amino acids, and 2 mM sodium pyruvate was used to stop the trypsinization reaction. A single-cell suspension was obtained by trituration. Cell debris and aggregates were removed by passing the single-cell suspension using a 100 μm nylon mesh. Microglial cells were removed using the EasySep Mouse CD11b positive Selection Kit according to the manufacturer’s protocol (StemCell). Astrocyte-rich fraction was cultured in serum-free base medium containing 50% DMEM, 50% neurobasal, 1× SATO (recommended by cold spring harbor protocol), 100 μg mL−1 streptomycin, 100 U mL−1 penicillin, 292 μg mL−1 l-glutamine, 1 mM sodium pyruvate, and 5 μg mL−1 of N-acetyl cysteine. This medium was added with the astrocyte-required survival factor HBEGF (Peprotech, 100–47) at 5 ng mL−1 as previously described with a complete medium change on day 1.31
Alamar Blue and LDH Assays
Cell death was assessed using the Alamar Blue assay (Invitrogen, DAL1025) and MTT (Sigma-Aldrich, M5655) according to the manufacturer’s protocol.
Generation of SILAM Mice and Validation of the Labeling Efficiency
C57BL/6J wide-type F2 SILAM wide-type female mice were custom-made by Cambridge Isotope laboratories by feeding with L-lysine (13C6) chow (Cambridge Isotope Laboratories, Inc). These C57BL/6J wide-type F2 SILAM female mice were crossed with wild-type C57BL/6J males. After 7 days, the males were separated. F3 SILAM pups were weaned at 28 days old.33,34 At two months of age, F3 SILAM mice were anesthetized by isoflurane, euthanized by decapitation, and tissue samples were harvested. During the entire period, the mice were fed with SILAC l-lysine (13C6) feed purchased from Cambridge Isotope Laboratories. The incorporation of l-lysine (13C6) was evaluated by mass spectrometry.
α-Synuclein PFF Preparation
Recombinant mouse α-synuclein proteins were purified as previously described with an IPTG independent inducible pRK172 vector system.7,16,19,35,36 Briefly, BL21(DE3)RIL-competent Escherichia coli were harvested by centrifugation at 6000 × g for 10 min after 16 h incubation at 37 °C. The bacterial pellet was resuspended in high salt buffer containing 10 mM Tris (pH 7.6), 750 mM NaCl, and 1 mM EDTA with a complete protease inhibitor mixture (Sigma-Aldrich) and 1 mM PMSF, and lysed by sonicating for 5 min (30 s pulse on/off) at 60% amplitude (Branson Digital sonifier, Danbury, CT, USA) with boiling for 15 min. After centrifugation at 6000 × g for 20 min, the supernatant was subjected to serial purification steps using Superdex 200 Increase 10/300 G size-exclusion and Hitrap Q Sepharose Fast Flow anion-exchange columns (GE Healthcare, Pittsburgh, PA, USA). Purified α-synuclein was applied to high-capacity endotoxin removal spin columns (Pierce, Rockford, IL, USA) and Ni Sepharose 6 Fast Flow (GE Healthcare) to remove endotoxin, followed by confirmation of removal of endotoxin using LAL Chromogenic Endotoxin Quantitation Kit (Pierce). The α-synuclein monomer was stored at −80 °C until use. α-Synuclein PFF was prepared in PBS from 5 mg/mL of the α-synuclein monomer by stirring with a magnetic stirrer (1000 rpm at 37 °C) for 1 week. α-Synuclein aggregates were sonicated for 30 s (0.5 s pulse on/off) at 10% amplitude (Branson Digital sonifier).
Stereotaxic α-Synuclein PFF and AAV1-tTA-Virus Injection
For stereotaxic injection of α-synuclein PFF and adeno-associated virus 1 (AAV1)-tetracycline-regulated transactivator (tTA), 3 month old male and female mice were anesthetized with xylazine and ketamine. (1) An injection cannula (26.5 gauge) was applied stereotaxically into the striatum for α-synuclein PFF injections (mediolateral, 2.0 mm from bregma; anteroposterior, 0.2 mm; and dorsoventral, 2.6 mm) unilaterally (applied into the right hemisphere). The infusion was performed at a rate of 0.2 μL per min, and 2 μL of α-synuclein PFF (2.5 μg/μL in PBS) or the same volume PBS was injected into the mouse. (2) An injection cannula (26.5 gauge) was applied stereotaxically into the SNpc for the AAV1 tTA injections (anteroposterior, 3.2 mm from bregma; mediolateral, 1.3 mm; and dorsoventral, 4.3 mm) unilaterally (applied into the right hemisphere). The infusion was performed at a rate of 0.2 μL per min, and 1 or 2 μL of a high-titer AAV1-tTA-GFP (3.5 × 10¹³ AAV vector genomes per mL in PBS) and AAV1-GFP were injected into PrP-TetP-hA53T α-synuclein mice. After the final injection, the injection cannula was maintained in the striatum and substantia nigra for an additional 5 min for complete absorption of the α-synuclein PFF and virus and then slowly removed from the mouse brain. The head skin was closed by suturing, and wound healing and recovery were monitored following surgery.
Immunohistochemistry and Quantitative Analysis
Immunohistochemistry (IHC) was performed on 30 μm thick serial brain sections. Primary antibodies and working dilutions are detailed in Supporting Information Table S1. For histological studies, perfusion was performed with ice-cold phosphate-buffered saline (PBS) and the brains were fixed with 4% paraformaldehyde/PBS (pH 7.4). The brains were collected and postfixed for 4 h in 4% paraformaldehyde, followed by cryoprotection in 30% sucrose/PBS (pH 7.4) solution. Brains were frozen in OCT buffer and serial coronal sections (30 μm sections) were cut with a microtome. Free-floating 30 μm sections were blocked with 4% goat or horse serum/PBS plus 0.2% Triton X-100 and incubated with an antibody against TH (Novus Biologicals, Littleton, CO, USA), followed by incubation with biotin-conjugated antirabbit antibody or biotin-conjugated antimouse antibody (Vectastain Elite ABC Kit, Vector Laboratories, Burlingame, CA, USA). After triple washing steps, ABC reagents (Vectastain Elite ABC Kit, Vector Laboratories) were added and sections were developed using SigmaFast DAB Peroxidase Substrate (Sigma-Aldrich). Sections were counterstained with Nissl (0.09% thionin). TH-positive and Nissl-positive DA neurons from the SNpc region were counted through optical fractionators, the unbiased method for cell counting. This method was carried out by using a computer-assisted image analysis system consisting of an Axiophot photomicroscope (Carl Zeiss Vision) equipped with a computer-controlled motorized stage (Ludl Electronics), a Hitachi HV C20 camera, and Stereo Investigator software (MicroBright-Field). The total number of TH-stained neurons and Nissl counts were analyzed as previously described.21 Fiber density in the striatum was analyzed by optical density (OD) measurement. ImageJ software (NIH, http://rsb.info.nih.gov/ij/) was used to analyze the OD as previously described.21,37
Immunocytochemistry
Immunostaing in cultured primary astrocytes was performed as described previously.32 Cells transduced using lentivirus expressing hC3 protein for 5 days were immunostained with GFAP and C3 antibodies. For staining, cells were fixed with 4% paraformaldehyde/4% sucrose in PBS for 15 min and permeabilized in 0.2% Triton X-100 for 10 min at room temperature. After blocking with 3% BSA, the cells were incubated first with primary antibodies, followed by secondary antibodies. Immunostained cells were imaged using a confocal microscopy system comprising a Zeiss microscope with a 63× oil-immersion objective.
Lentivirus and AAV Production
The lentivirus plasmid was constructed by inserting the GFAP short promoter38 and the human complement component 3 (C3) full sequence. Lentiviral vectors were packaged by Vectorbuilder Inc.
Immunofluorescence Analysis
Immunofluorescence was performed on 30 μm thick serial brain sections. Primary antibodies and working dilutions are detailed in Supporting Information Table S1. For histological studies, immunofluorescence in tissue sections was performed as described previously with some modifications.19 Paraformaldehyde (4% in PBS, pH 7.4)-fixed coronal brain sections were blocked with 10% donkey serum (Jackson Immunoresearch)/PBS plus 0.3% Triton X-100 in PBS and incubated with antibodies to p-S129-α-synuclein (1:1000; Biolegend), and TH (1:1000; Novus Biologicals) overnight at 4 °C. After brief washes with PBS, floating brain sections were incubated with 0.1% Triton X-100 and 5% donkey serum in PBS, followed by 1 h of incubation with a mixture of FITC-conjugated (Jackson Immunoresearch) and CY3-conjugated (Jackson Immunoresearch) secondary antibodies at room temperature. The fluorescent images were acquired via a Zeiss confocal microscope (Zeiss Confocal LSM 710) after the coverslips were mounted with DAPI mounting solution (VECTASHIELD HardSet Antifade Mounting Medium with DAPI, Vector laboratories). All images were processed by the Zeiss Zen software. The selected area in the signal intensity range of the threshold was measured using ImageJ analysis.
Immunoblot Analysis
Mouse brain tissues were homogenized and prepared in lysis buffer [10 mM Tris-HCL, pH 7.4, 150 mM NaCl, 5 mM EDTA, 0.5% Nonidet P-40, 10 mM Na-β-glycerophosphate, phosphate inhibitor mixture I and II (Sigma-Aldrich, St. Louis, MO, USA), and complete protease inhibitor mixture (Roche, Indianapolis, IN, USA)], using a Diax 900 homogenizer (Sigma-Aldrich). After homogenization, samples were rotated at 4 °C for 30 min for complete lysis, the homogenate was centrifuged at 22,000 × g for 20 min and the supernatants were collected. Protein levels were quantified using the BCA Kit (Pierce, Rockford, IL, USA) with BSA standards and analyzed by immunoblot. Electrophoresis on 8–16 and 4–20% gradient SDS-PAGE gels was performed in order to resolve the proteins (obtained 10–20 μg) from the mouse brain tissue or cell lysates. The proteins were then transferred to nitrocellulose membranes. The membranes were blocked with blocking solution (Tris-buffered saline with 5% nonfat dry milk and 0.1% Tween-20) for 1 h and incubated at 4 °C overnight with anti-TH (Novus Biologicals), anti-Factor H (Abcam), anti-C3 (Abcam), anti-Fibrinogen (Abcam), and anti-α-synuclein (BD bioscience) antibodies, followed by HRP-conjugated goat of mouse secondary antibodies (Jackson ImmunoResearch), HRP-conjugated rabbit of sheep secondary antibodies (1:3000 ThermoFisher), and HRP-conjugated goat of rabbit secondary antibodies (1:3000, Jackson ImmunoR-esearch) for 1 h at room temperature. Primary antibodies and working dilutions are detailed in Supporting Information Table S1. The bands were visualized by enhanced chemiluminescence (Thermo Scientific, IL, USA). Finally, the membranes were reprobed with a HRP-conjugated β-actin antibody (Sigma-Aldrich) after it was stripped.
Behavioral Tests
The experimenter was blinded to the treatment group for all behavioral studies. All tests were recorded and performed between 10:00 and 16:00 in the lights-on cycle. (1) Pole test. Mice were acclimatized in the behavioral procedure room for 30 min. The pole was made of a 75 cm metal rod with a diameter of 9 mm. It was wrapped with bandage gauze. Mice were placed on the top of the pole (7.5 cm from the top of the pole) facing head-up. The total time taken to reach the base of the pole was recorded. Before the actual test, mice were trained for two consecutive days. Each training session consisted of three test trials. On the test day, mice were evaluated in three sessions and the total time was recorded. The maximum cutoff time to stop the test and recording was 60 s. Results for turn down, climb down, and total time (in sec) were recorded. (2) Rotarod test. For the rotarod test, mice were placed on an accelerating rotarod cylinder, and the time the animals remained on the rotarod was measured. The speed was slowly increased from 4 to 40 rpm within 5 min. A trial ended if the animal fell off the rungs or gripped the device and spun around for two consecutive revolutions without attempting to walk on the rungs. The animals were trained 3 days before the test. Motor test data are presented as the percentage of the mean duration (three trials) on the rotarod compared with the control.
Sample Preparation for Proteome Analysis of PD Model Mouse Samples
The mouse brain samples were processed by the filter-aided sample prep (FASP) approach.39 Briefly, the mouse ventral midbrain samples from PD model mice or SILAM mice were sonicated in 50 mM triethylammonium bicarbonate (TEAB)/4% SDS/10 mM dithiothreitol with Halt protease inhibitor cocktail (Thermo Scientific) for 5 min, followed by heating at 95 °C for 5 min. The lysates of PD model mice were mixed with the pool of lysate of the SILAM mice in an equivalent tissue mass. The proteins were alkylated with 30 mM iodoacetamide at room temperature for 30 min, followed by centrifugation at 16,000× g for 10 min. SDS in the sample was removed by diluting the samples with 8 M urea/50 mM TEAB and concentrated with a centricon with 30 kDa MWCO for 40 min at RT. This buffer exchange step was repeated five times. For the processing of α-synuclein PFF or PBS-injected mouse samples, proteins were digested with LysC (1:50, FUJIFILM Wako Pure Chemical) in 4 M urea/50 mM TEAB/0.2% sodium deoxycholate (SDC) in the centricon at 37 °C overnight shaking at 700 rpm. The supernatant was transferred to a new tube, and SDC was precipitated by adding 0.5% formic acid to a final concentration and centrifuging at 16,000× g for 10 min at RT. The supernatant was desalted with Sep-Pak C18 light cartridges. For the processing of AAV1-tTA-GFP- or AAV-GFP-injected TetP-hA53T α-synuclein transgenic mouse samples, proteins were digested with LysC (1:50, FUJIFILM Wako Pure Chemical) in 4 M urea/50 mM TEAB/0.05% SDS in the centricon at 37 °C overnight shaking at 700 rpm. The centricon was centrifuged at 14,000 × g at RT for 30 min. The flow-through solution was kept in a new tube. One hundred microliters of 50 mM TEAB was added to the centricon shaking at 700 rpm for 5 min, followed by centrifuging at 14,000 × g. The flow-through was combined with the flow-through collected at the previous step. Sequencing-grade trypsin (1:100, Promega) in 100 μL of 50 mM TEAB/0.03% SDS was added to the centricon and incubated at 37 °C for 4 h shaking at 700 rpm. The centricon was centrifuged at 14,000 × g, and the flow-through was transferred to a new tube. One hundred microliters of 50 mM TEAB was added to the centricon shaking at 700 rpm for 5 min, followed by centrifuging at 14,000 × g. The flow-through was combined with the flow-through collected at the previous trypsin-digestion step. The addition of 100 μL of 50 mM TEAB and centrifugation step was repeated once again. The flow-through was combined with the flow-through collected in the previous trypsin-digestion step. SDS in the LysC- and the trypsin-digested samples were precipitated by adding half the volume of 4 M KCl and incubating at RT for 10 min. The samples were centrifuged at 16,000 × g for 5 min. The peptides in the supernatant were desalted with Sep-Pak C18 light cartridges. The peptides were separately fractionated into 24 fractions by basic pH reversed-phase liquid chromatography. Briefly, lyophilized samples were reconstituted in solvent A (10 mM TEAB, pH 8.5) and loaded onto XBridge C18, 5 μm 250 × 4.6 mm column (Waters, Milford, MA). Peptides were resolved using a gradient of 3–50% solvent B (10 mM TEAB in acetonitrile, pH 8.5) over 50 min, collecting 96 fractions. The fractions were subsequently concatenated into 24 fractions, followed by vacuum drying using SpeedVac. The dried peptides were reconstituted in 15 μL 10% FA and the entire amount was injected.
Mass Spectrometric Analysis of PD Mouse Model Samples
The fractionated peptides were analyzed on an LTQ-Orbitrap Elite mass spectrometer (Thermo Scientific, Bremen, Germany) coupled to an EASY-nanoLC II system. The peptides from each fraction were reconstituted in 10% formic acid and loaded onto a trap column (100 μm × 2 cm) at a flow rate of 5 μL per min. The loaded peptides were resolved at a 250 nL/min flow rate using a linear gradient of 10–35% solvent B (0.1% formic acid in 95% acetonitrile) over 95 min on an analytical column (50 cm × 75 μm ID) packed in house and was fitted on EASY-Spray ion source that was operated at 2.0 kV voltage. Mass spectrometry analysis was carried out in a data-dependent manner with a full scan in the range of m/z 350–1550 in top speed mode setting 3 s per cycle. Both MS and MS/MS were acquired and measured using the Orbitrap mass analyzer. Full MS scans were measured at a resolution of 120,000 at m/z 400. Precursor ions were fragmented using the higher-energy collisional dissociation (HCD) method and detected at a mass resolution of 30,000 at m/z 400. The HCD energy was set to 32 for mouse samples and 35 for human samples. The automatic gain control for full MS was set to 1 million ions and for MS/MS was set to 0.05 million ions with a maximum ion injection time of 50 and 100 ms, respectively. Dynamic exclusion was set to 30 s and singly charged ions were rejected. Internal calibration was carried out using a lock mass option (m/z 445.1200025) from ambient air.
Data Analysis
The Proteome Discoverer (v 2.1; Thermo Scientific) suite was used for identification and quantitation. The tandem mass spectrometry data were searched using SEQUEST search algorithms against a mouse RefSeq database (version 73) supplemented with frequently observed contaminants. The search parameters used were as follows: (a) LysC as a proteolytic enzyme (with up to two missed cleavages); (b) a peptide mass error tolerance of 10 ppm; (c) a fragment mass error tolerance of 0.02 Da; (d) carbamidomethylation of cysteine (+57.02146 Da) as fixed modification; and (e) oxidation of methionine (+15.99492 Da) and Lys6 (+6.02013) as variable modifications. The minimum peptide length was set to six amino acids. Peptides and proteins were filtered at a 1% false-discovery rate (FDR) at the PSM level using the percolator node and at the protein level using the protein FDR validator node, respectively. The protein quantification was performed with the following parameters and methods. The mass precision of the Event Detector note for the precursor ion detection was set to 2 ppm. Unique peptides were used for peptide quantification. Protein groups were considered for peptide uniqueness. Missing intensity values were replaced with the minimum value. Data normalization was disabled. Protein grouping was performed by applying the strict parsimony principle as follows; (1) all proteins that share the same set or subset of identified peptides were grouped, (2) protein groups that have no unique peptides among the considered peptides were filtered out, and (3) Proteome Discoverer iterated through all spectra and selected which PSM to use in ambiguous cases to make a protein group with the highest number of unambiguous and unique peptides. The Proteome Discoverer summed all the precursor ion intensities of PSMs for the corresponding proteins. Finally, the protein table exported from Proteome Discoverer was imported into Perseus 1.5.2.6 software for the normalization.40 The precursor ion intensities of the samples were divided by the precursor ion intensity value of the SILAM sample. To remove systemic deviation, each column was divided by the median value of the corresponding column. Pathway analysis was performed at DAVID.41
Data Availability
All mass spectrometry data and search results have been deposited to the ProteomeXchange Consortium (http://proteomecentral.proteomexchange.org/cgi/GetDataset?ID=PXD015293) via the PRIDE partner repository with the dataset identifier PXD015293 and project name “Quantitative proteome analyses of two types of Parkinson’s disease mouse model revealed potential pathways of the pathogenesis”.
Experimental Design and Statistical Rationale
The number of α-synuclein PFF-injected mouse, PBS-injected mouse, AAV1-tTA-GFP-injected TetP-hA53T α-synuclein transgenic mouse, and AAV1-GFP-injected TetP-hA53T α-synuclein transgenic mouse used in this study was one for each. All the mass spectrometry analyses were conducted in technical duplicate. All the statistical analyses of mass spectrometry data were conducted using Perseus 1.5.2.6 software as follows. The P values of the mass spectrometry data were calculated by the Student’s two-sample t-test. The fold changes were calculated by dividing the average abundance of one group by the one of another group. The q-values were calculated by Significance Analysis of Microarrays and a permutation-based false discovery rate estimation to avoid the identification of false-positive differential proteins that happens when multiple comparisons are tested.42 The proteins with q-values < 0.05 were considered statistically significant. The Q–Q plots were generated by comparing the observed P values with the expected P values using the R package Haplin.43 The expected P values used for the Q–Q plot were generated by permutation of values from two groups followed by P value calculations.44 The P values were calculated by two-sided Student’s t-test. For the validation of mouse phenotype, data are presented as mean ± s.e.m from at least three independent experiments. In order to assess the statistical significance, Student’s t-test or ANOVA tests followed by the Bonferroni post hoc test were performed using Prism 6 software (GraphPad). Assessments with a p < 0.05 were considered significant.
RESULTS
To identify common yet critical pathways involved in PD pathogenesis, we utilized two different types of PD mouse models that exhibit degeneration of DA neurons in the SNpc of intrastriatal α-syn PFF-injected WT mice and intranigral AAV1-tTA-injected TetP-A53T α-syn Tg mice well established in previous studies.20,22,37 Mouse brains were harvested at 6 months after α-synuclein PFF or AAV1-tTA injection. To provide a more accurate protein quantification of mouse samples, SILAM mice were generated by labeling with heavy lysine and ventral midbrain samples from the SILAM mice were spiked into the ventral midbrain samples from the two PD mouse models or control mice. The proteins were extracted from the ventral midbrain of those samples, followed by enzyme digestion. The relative protein abundances were measured by LC–MS/MS after fractionating the peptides by high pH RPLC (Figure 1A).
Figure 1.
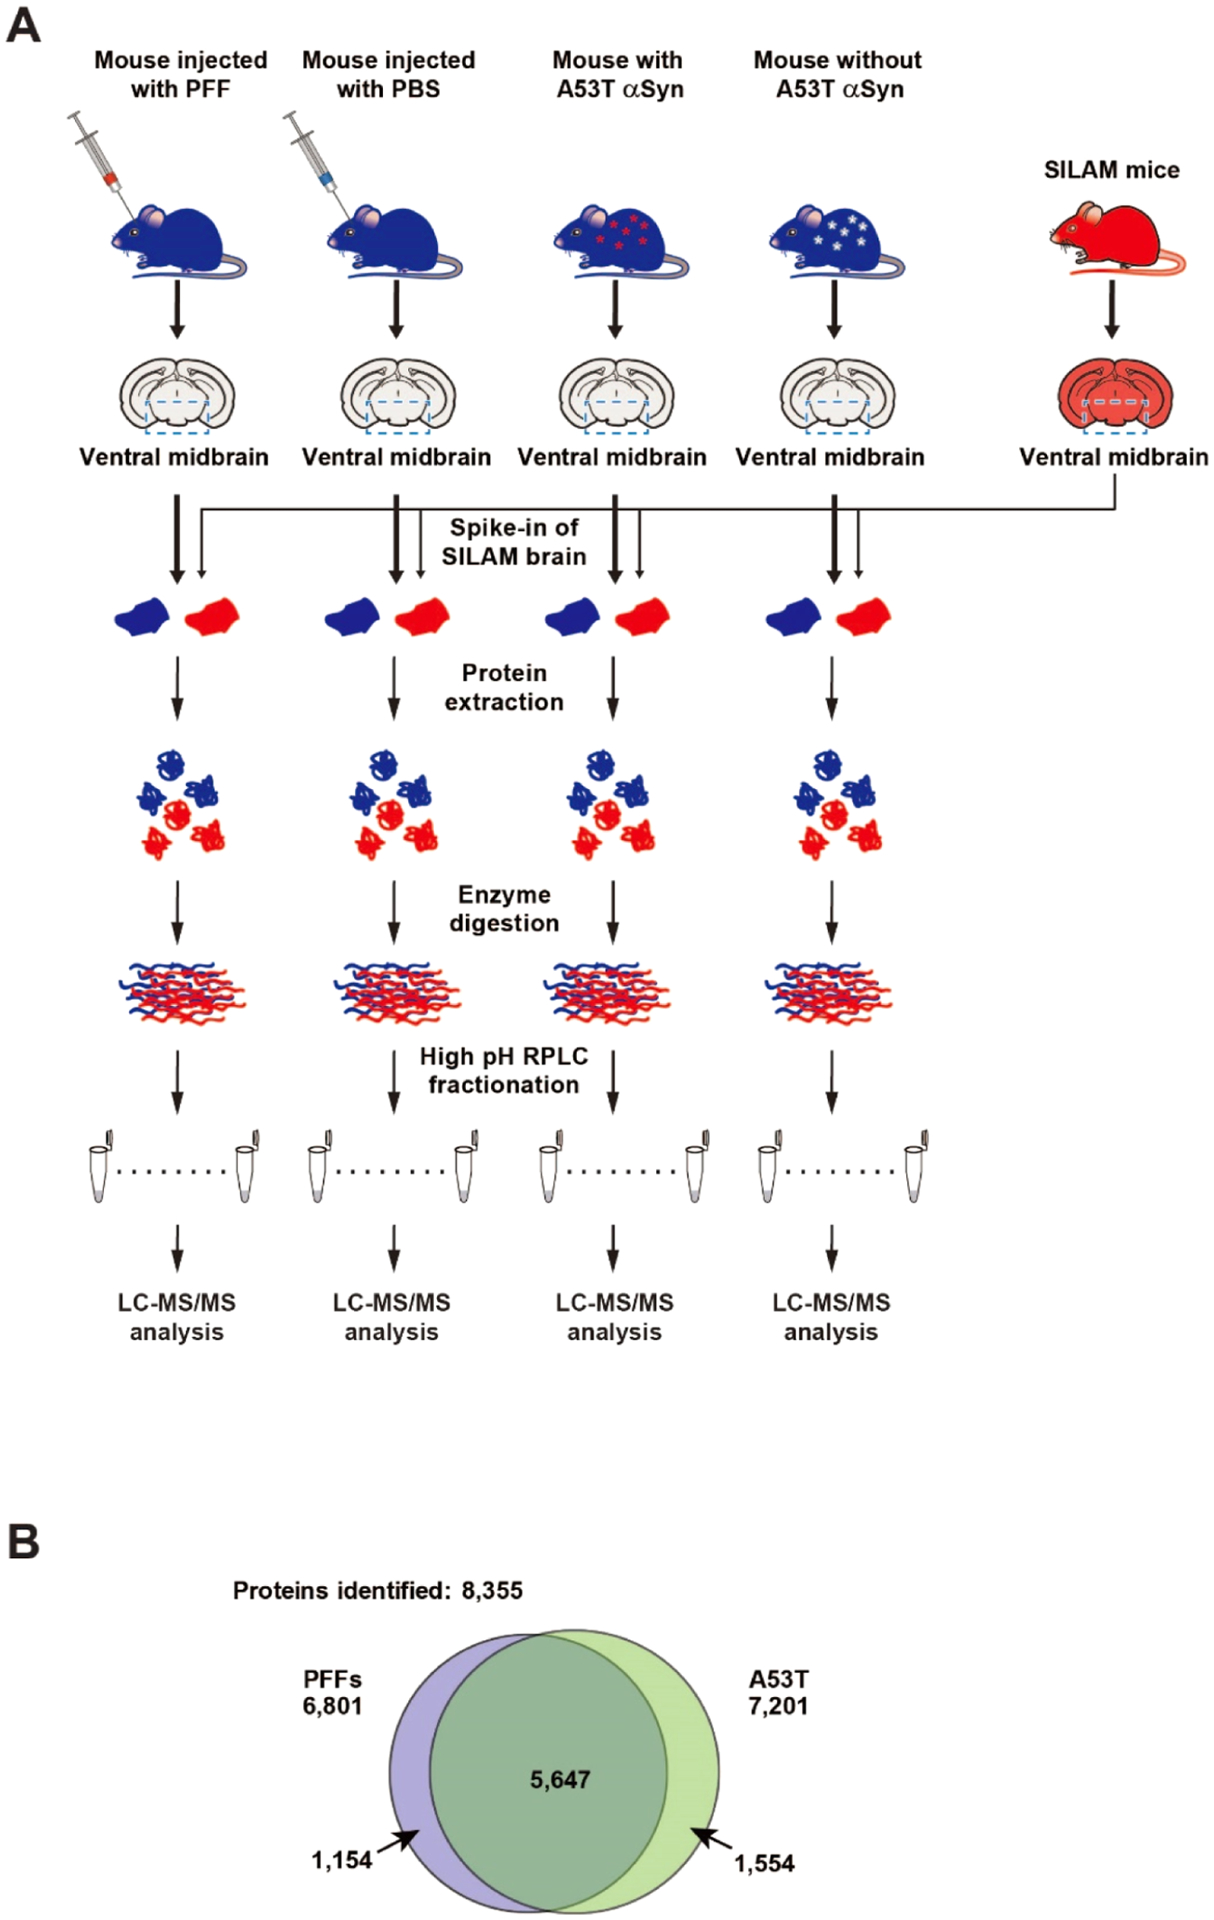
Schematic diagram of the proteomic analyses of the ventral midbrain of intrastriatal α-synuclein PFF-injected mice and AAV1-tTA/TetP-hA53T-α-synuclein Tg mice. (A) Brains from the two PD mouse models were subjected to quantitative proteomic analysis. For the accurate protein abundance quantification, SILAM mice that were labeled with heavy Lys for three generations were employed. The ventral midbrain regions from each mouse were harvested and the SILAM brain samples were added to those of the PD models and control mice as indicated. After protein extraction, the samples were digested with Lys-C followed by trypsin. The peptides were fractionated by high pH RPLC followed by LC–MS/MS analysis. (B) Number of proteins identified from the PD mouse model with intrastriatal α-synuclein PFF-injected mice (left) and the PD mouse models with human A53T-α-synuclein expression (right).
Generation and Validation of Neurological Pathologies of α-Synuclein PFF-Injected Mice as a Sporadic PD Model
Before starting the proteomic analysis, we validated the neuropathological symptoms in the intrastriatal α-synuclein PFF-injected WT mice. Six months after stereotaxically injecting α-synuclein PFF into the striatum of WT mice, mice were evaluated for loss of DA neurons, neuropathology, and behavior defects (Supporting Information Figure S1A).8,16,17,19,36 Loss of DA neurons in these mice was assessed by TH-immunoreactivity and Nissl staining using unbiased stereological counting. As a result, about 62% of the TH-positive neurons and 59% of Nissl-positive neurons were lost in the substantia nigra (SN) region due to α-synuclein PFF inoculation (Supporting Information Figure S1B,C). The amount of TH-positive fibers in the striatum was also reduced by α-syn PFF injection (Supporting Information Figure S1D). To monitor the motor behavioral deficits in α-synuclein PFF-injected mice, we examined rotarod and pole tests. α-Synuclein PFF injection led to significant behavioral deficits in the rotarod and pole tests well established as PD-like behavioral phenotypes (Supporting Information Figure S1E).16,19 In addition, phosphorylated α-synuclein at serine 129 (p-α-synuclein) immunoreactivity, a marker of endogeneous pathologic α-synuclein into LB-like inclusions, was significantly detected in the various brain regions including the SNpc of α-synuclein PFF-injected mice (Supporting Information Figure S1F,G) as previously described.8,16,17,19,36 These results consistently indicate that α-synuclein PFF effectively induced endogeneous pathologic α-synuclein into LB-like inclusions and the behavioral phenotype shown in PD.
Generation and Validation of Neurological Pathologies of AAV1-tTA-Injected TetP-hA53T α-Synuclein Transgenic Mice as a Familial PD Model
For modeling the AAV1-tTA-injected TetP-hA53T α-syn Tg mice, animals were stereotactically injected unilaterally either with AAV1-tTA virus or AAV1-GFP virus into the SNpc of TetP-hA53T α-synuclein mice as previously described (Supporting Information Figure S2A).18 Before starting the proteomic analysis of the ventral midbrain regions of these mice, the validation of the neuropathological symptoms was conducted. Six months after the injection of AAV1-tTA, a 2.3-fold increase of α-synuclein was observed in the SNpc of these mice, leading to a reduction of TH protein levels (Supporting Information Figure S2A–C). Overexpression of hA53T α-synuclein induced a significant loss of TH- and Nissl-positive neurons in the SNpc (Supporting Information Figure S2D,E). Moreover, striatal TH immunoreactivity was reduced by hA53T α-synuclein overexpression (Supporting Information Figure S2F). Overexpression of hA53T α-synuclein also significantly elicited motor behavioral deficits as measured by the rotarod test and the pole test (Supporting Information Figure S2G). Taken together, these results indicate that two mice models used in this study reproduce the degeneration of DA neurons seen in PD and it can be applied for proteome analysis.
Proteomic Analysis of the Ventral Midbrain from Intrastriatal α-Synuclein PFF-Injected Mice and AAV1-tTA/TetP-hA53T-α-Synuclein Tg Mice
To investigate potential common pathways affected in the ventral midbrain of two different PD mouse models, we performed the proteomic analysis of the ventral midbrain samples prepared from the intrastriatal α-synuclein PFF-injected WT mice and AAV1-tTA-injected TetP-hA53T-α-synuclein Tg mice (Figure 1A). Ventral midbrain samples were subjected to proteomic analysis by extracting proteins, enzyme digestion, and prefractionation, and mass spectrometry analysis. For more accurate protein quantification, SILAM mice were generated and spiked into both the PD and control mouse samples for quantification before protein extraction (Figure 1A). The prepared peptide samples were injected twice into the mass spectrometer. Approximately 6800 and 7200 proteins were identified from the intrastriatal α-synuclein PFF-injected WT mice and AAV1-tTA-injected TetP-hA53T-α-syn Tg mice, respectively. When the proteins from two mice models were combined, a total of 8355 proteins were identified. Among them, 5647 proteins were shared between the two mouse models (Figure 1B). The number of quantified proteins from the intrastriatal α-synuclein PFF-injected mice was approximately 5000–6000 proteins and ~3400 proteins were identified without any missing values. The number of quantified proteins from AAV1-tTA/TetP-hA53T-α-synuclein Tg mice was approximately 5700–6100 proteins and ~4300 proteins were identified without any missing values (Supporting Information Table S2). Statistical analyses of the identified proteins showed that 724 and 1581 proteins were differentially regulated by α-synuclein PFF injection and the SNpc hA53T-α-synuclein overexpression, respectively (Figure 2A,B). Among them, 149 proteins were differentially regulated in common in two mouse models (Table 1). Importantly, the TH protein, one of the proteins specific to dopaminergic neurons, showed 3.3- and 3.4-fold decrease following α-syn PFF injection and SNpc hA53T-α-syn overexpression, respectively. These results are consistent with the assessments of the dopaminergic neuronal death shown in Supporting Information Figures S1 and S2. In the intrastriatal α-synuclein PFF-injected mice, the collagen type VI alpha 3 chain (COL6A3) showed the highest upregulation with an ~60-fold increase, followed by the collagen type XII alpha chain (COL12A) and Transgelin (TAGLN) among the 724 differentially regulated proteins (Figure 2A). In the AAV1-tTA-injected TetP-hA53T-α-syn Tg mice, serpin peptidase inhibitor clade A (SERPINA1A) showed the highest upregulation with an ~20-fold increase, followed by immunity-related GTPase family M member 1(IRGM1) and ATPase sarcoplasmic/endoplasmic reticulum Ca2+ transporting 2 (ATP2A2) among the 1581 differentially regulated proteins (Figure 2B). In both mouse models, the downregulation level for the most proteins was <4-fold except for myelin protein zero (MPZ), which was downregulated ~60-fold in the AAV1-tTA-injected TetP-hA53T-α-syn Tg mice (Figure 2A,B). These results suggest that the dopaminergic neurons in the brains of α-synuclein PFF-injected mice and hA53T-α-synuclein overexpression PD mice were damaged, and these changes were correctly detected by the quantitative proteomic measurements.
Figure 2.
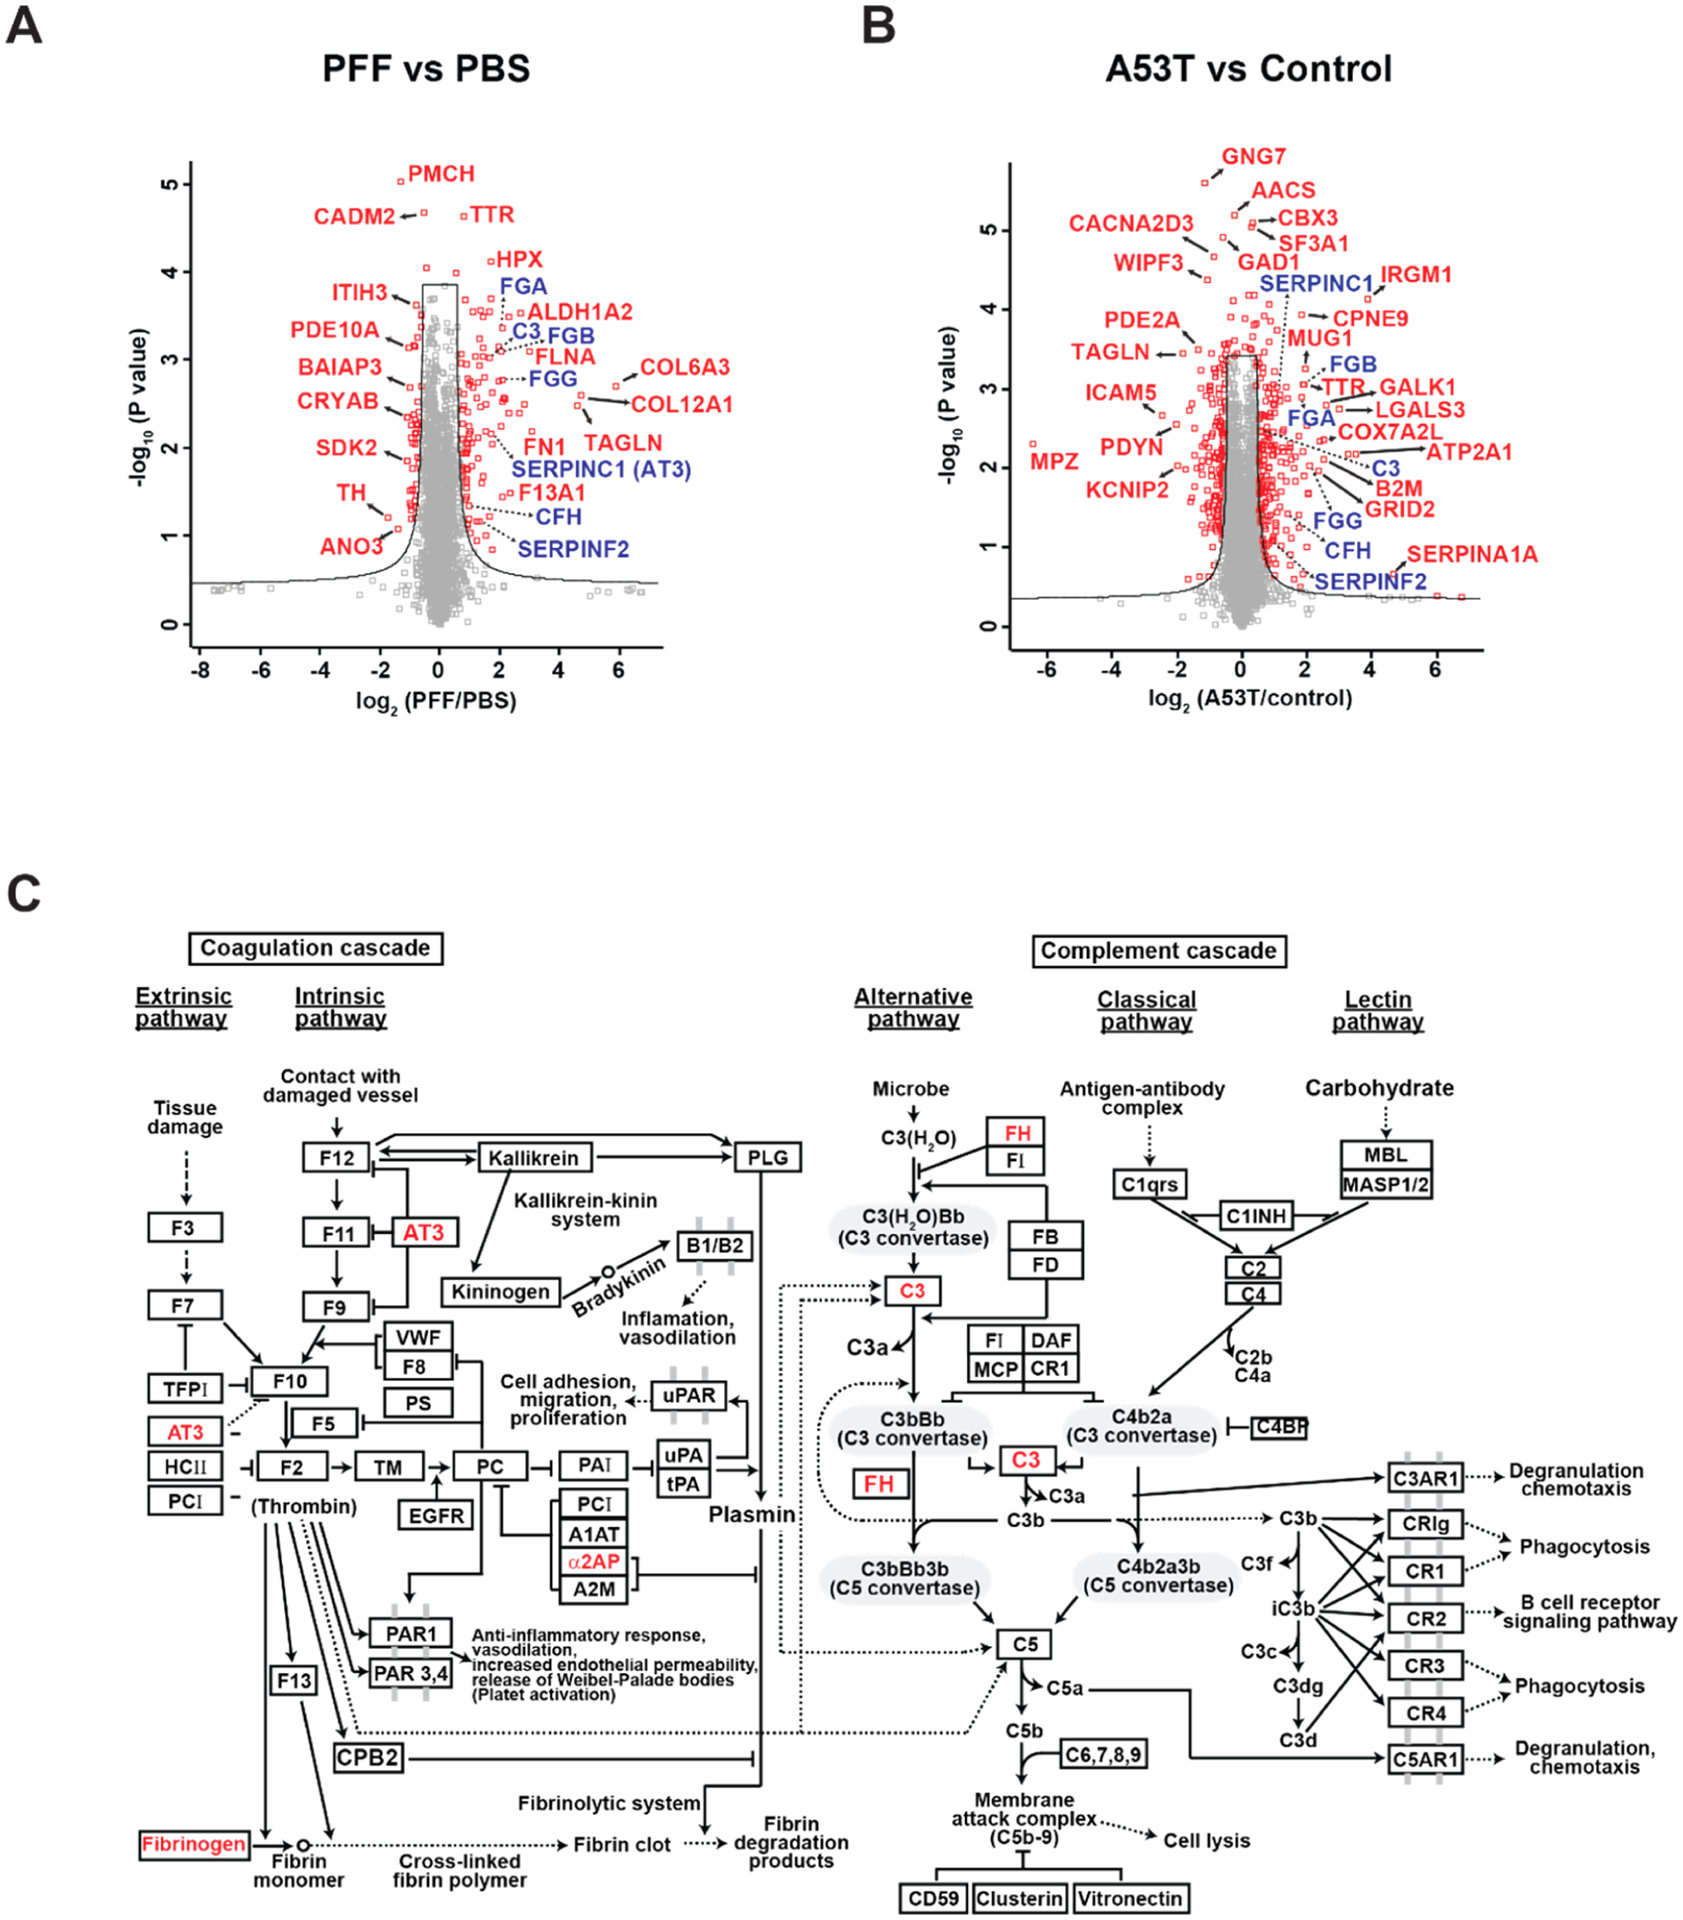
Volcano plot and pathway analyses of protein alterations in two PD mouse models. (A) The proteins quantified from PFF-injected and PBS-injected mice were analyzed for differentially expressed proteins in PFF-injected mice. The cutoff used to select differential proteins was q-value < 0.05. The differential proteins that belong to the complement and coagulation cascade were colored in blue. (B) Proteins quantified in hA53T α-synuclein Tg and control mice were analyzed for differentially expressed proteins in hA53T α-synuclein Tg mouse. The cutoff used to select differential proteins was q-value <0.05. The differential proteins that belong to the complement and coagulation cascade were colored in blue. (C) Proteins differentially expressed in both PFF-injected mice and A53T α-synuclein Tg mice were used to find enriched pathways. The pathway analysis was performed in KEGG incorporated in DAVID.
Table 1.
List of Differential Proteins Common to Both the α-Synuclein PFF-Injected Mice and hA53T α-Synuclein Tg Mice
| upregulated | downregulated | ||
|---|---|---|---|
| gene symbol | protein description | gene symbol | protein description |
| Fga | fibrinogen alpha chain isoform 1 precursor | Ddc | aromatic-l-amino acid decarboxylase isoform X2 |
| Fgb | fibrinogen beta chain precursor | Pde1b | calcium/calmodulin-dependent 3′,5′-cyclic nucleotide phosphodiesterase 1B isoform 1 |
| Hpx | hemopexin precursor | Ppp1r1b | protein phosphatase 1 regulatory subunit 1B isoform 1 |
| Vim | vimentin | Adcy5 | adenylate cyclase type 5 |
| Slc4a1 | band 3 anion transport protein | Pde2a | cGMP-dependent 3′,5′-cyclic phosphodiesterase isoform X2 |
| B2m | beta-2-microglobulin precursor | Pmch | pro-MCH preproprotein |
| Serpinc1 | antithrombin-III isoform X1 | Cd82 | CD82 antigen |
| Clic1 | chloride intracellular channel protein 1 | Tppp | tubulin polymerization-promoting protein isoform X1 |
| Ttr | transthyretin precursor | Th | tyrosine 3-monooxygenase |
| Mug1 | murinoglobulin-1 isoform X1 | Gad1 | glutamate decarboxylase 1 isoform GAD67 |
| Fn1 | fibronectin isoform a precursor | Sh3gl3 | endophilin-A3 isoform 1 |
| Gc | vitamin D-binding protein precursor | Apod | apolipoprotein D precursor |
| Serpina3k | serine protease inhibitor A3K precursor | Tiam2 | T-lymphoma invasion and metastasis-inducing protein 2 isoform 1 |
| Trf | serotransferrin precursor | Mpp3 | MAGUK p55 subfamily member 3 isoform X1 |
| Spta1 | spectrin alpha chain, erythrocytic 1 | Ano3 | anoctamin-3 |
| Apoa1 | apolipoprotein A-I preproprotein | 1700037H04Rik | UPF0687 protein C20orf27 homolog isoform 1 |
| Apoa4 | apolipoprotein A-IV precursor | Scn2a1 | sodium channel protein type 2 subunit alpha isoform X2 |
| Alb | serum albumin preproprotein | Hsph1 | heat shock protein 105 kDa isoform X3 |
| Epb4.2 | erythrocyte membrane protein band 4.2 isoform X1 | Ahi1 | jouberin isoform 1 |
| Tln1 | talin-1 isoform X2 | Gpr158 | probable G-protein-coupled receptor 158 precursor |
| Car4 | carbonic anhydrase 4 precursor | Map1b | microtubule-associated protein 1B |
| Tnc | tenascin isoform X1 | Ass1 | argininosuccinate synthase |
| Olfm1 | noelin isoform a precursor | Plp1 | myelin proteolipid protein isoform 1 |
| Stat1 | signal transducer and activator of transcription 1 isoform 1 | Ankrd34b | ankyrin repeat domain-containing protein 34B isoform X1 |
Pathway Analysis of the Differentially Expressed Proteins Common in the Intrastriatal PFF and AAV1-tTA/TetP-A53T Tg Mouse Models of PD
Next, using data that emerged from the proteomic analysis of the two different PD mouse models, we performed the pathway analysis of DAVID in order to investigate the signaling pathways commonly affected in the models.41 Because the two different model systems were designed to elicit degeneration of dopaminergic neurons by fostering α-synuclein aggregation, we reasoned that those differentially regulated proteins that are common in the two model systems would have a much higher possibility to play a role in PD pathogenesis. Pathway analysis with these proteins differentially expressed in the two PD mouse models gave 14 enriched pathways (Table 2). Complement and coagulation cascades were identified as the most enriched pathways (Figure 2C), followed by spliceosome, dopaminergic synapse, cocaine addiction, and platelet activation (Table 2). Intriguingly, the dopaminergic synapse was the third most enriched pathway suggesting that the dopaminergic pathway was also altered by the α-syn PFF injection and hA53T-α-syn overexpression. To rule out the possibility that the differentially expressed proteins that belong to the complement and coagulation cascades were selected by a type I error, Q–Q plots were generated. The Q–Q plot data showed that the differentially expressed proteins that belong to the complement and coagulation cascade pathway were positioned outside the 95% pointwise confidence band, suggesting that the differential proteins were not selected by a type I error (Supporting Information Figure S3A,B).
Table 2.
Enriched Pathways of the Differential Proteins Common to Both the α-Synuclein PFF-Injected and hA53T α-Synuclein Tg Mice
| term | count | P value | genes |
|---|---|---|---|
| complement and coagulation cascades | 7 | 1.17 × 10⁻⁴ | FGG, FGA, SERPINF2, C3, FGB, SERPINC1, CFH |
| spliceosome | 8 | 3.97 × 10⁻⁴ | U2SURP, DHX15, SNW1, HNRNPC, SNRPC, HNRNPU, RBM25, SF3B3 |
| dopaminergic synapse | 8 | 4.16 × 10⁻⁴ | DDC, PPP1R1B, GNAI1, ADCY5, TH, PLCB1, PPP2R2C, PPP2R2A |
| cocaine addiction | 5 | 0.001517695 | DDC, PPP1R1B, GNAI1, ADCY5, TH |
| platelet activation | 7 | 0.00214858 | FGG, TLN1, FGA, FGB, GNAI1, ADCY5, PLCB1 |
| amphetamine addiction | 5 | 0.004779233 | DDC, PPP1R1B, ADCY5, TH, PPP3R1 |
| renin secretion | 5 | 0.005875053 | PDE1B, GNAI1, ADCY5, PPP3R1, PLCB1 |
| tight junction | 6 | 0.01368547 | MPDZ, GNAI1, MYH9, CTNNA1, PPP2R2C, PPP2R2A |
| estrogen signaling pathway | 5 | 0.017765421 | HSP90B1, HSP90AA1, GNAI1, ADCY5, PLCB1 |
| focal adhesion | 7 | 0.018970256 | TLN1, ITGA6, DIAPH1, TNC, FLNC, LAMB1, FN1 |
| pathways in cancer | 10 | 0.019510174 | HSP90B1, HSP90AA1, ITGA6, GNAI1, ADCY5, STAT1, PLCB1, LAMB1, CTNNA1, FN1 |
| chagas disease | 5 | 0.020931721 | C3, GNAI1, PLCB1, PPP2R2C, PPP2R2A |
| gastric acid secretion | 4 | 0.03715889 | EZR, GNAI1, ADCY5, PLCB1 |
| serotonergic synapse | 5 | 0.045921293 | DDC, GNAI1, ADCY5, PLCB1, TPH2 |
Validation of Specific Proteins Identified in the Proteomic Analysis
As an additional confirmation, the levels of several target proteins were assessed by Western blot analysis from ventral midbrain samples prepared from the intrastriatal α-synuclein PFF-injected mice (Figure 3A,B) and AAV1-tTA-injected TetP-hA53T-α-syn Tg mice (Figure 3C,D). As expected, in both mouse models, the protein levels of complement C3, alpha chain, alpha chain fragment of iC3b, and C3c alpha chain fragment 2 as well as Factor H (FH) were significantly increased (Figure 3A–D), all of which are involved in the complement cascade in the ventral midbrain with a reduction in TH protein levels (Figure 3A–D). In addition, the protein level of fibrinogen in the coagulation cascade was markedly increased in both mouse models (Figure 3A–D).
Figure 3.
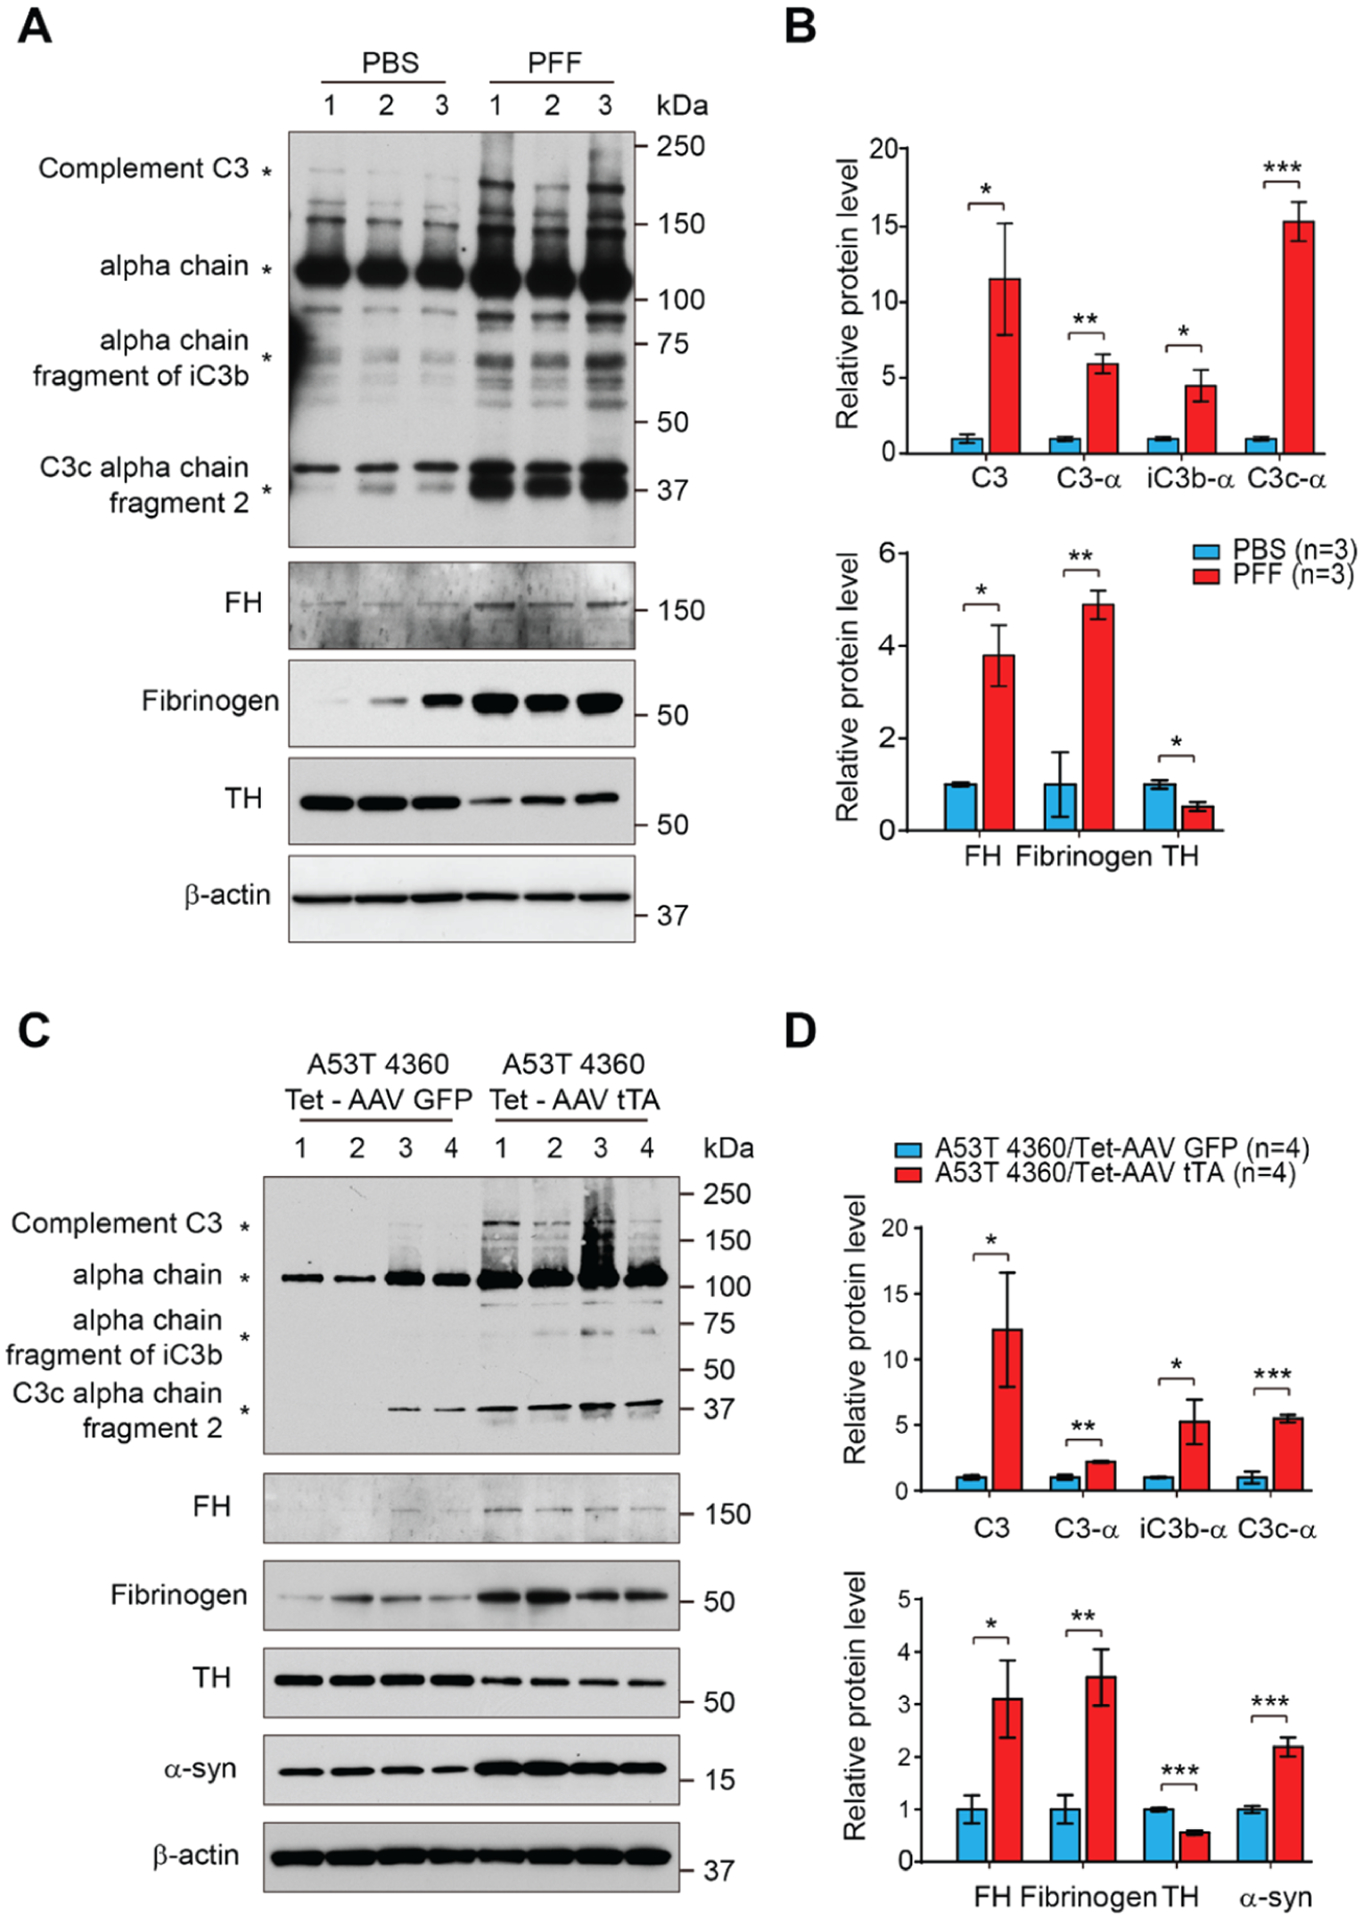
Western blot validation of specific proteins identified in the proteomic analysis and involved in coagulation cascade and component cascade. (A) Representative immunoblots of complement C3, alpha chain of C3, alpha chain fragment of iC3b, and C3c alpha chain fragment 2, Factor H (FH), Fibrinogen, and TH and β-actin in the ventral midbrain of α-synuclein PFF-injected mice. (B) Quantification of complement C3, alpha chain of C3, alpha chain fragment of iC3b, and C3c alpha chain fragment 2 protein levels in the ventral midbrain normalized to β-actin (right, upper panel). Quantification of FH, Fibrinogen, and TH protein levels in the ventral midbrain normalized to β-actin (right, bottom panel). Error bars represent the mean ± S.E.M (n = 3 mice per groups). Student’s t-test for statistical significance. *P < 0.05, **P < 0.01, and ***P < 0.001. (C) Representative immunoblots of complement C3, alpha chain of C3, alpha chain fragment of iC3b, and C3c alpha chain fragment 2, factor H (FH), Fibrinogen, TH, and β-actin in the ventral midbrain of hA53T α-synuclein Tg mice. (D) Quantification of complement C3, alpha chain of C3, alpha chain fragment of iC3b, and C3c alpha chain fragment 2 protein levels in the ventral midbrain normalized to β-actin (right, upper panel). Quantification of FH, fibrinogen, TH, and α-synuclein protein levels in the ventral midbrain normalized to β-actin (right, bottom panel). Error bars represent the mean ± S.E.M (n = 3 mice per groups). Student’s t-test for statistical significance. *P < 0.05, **P < 0.01, and ***P < 0.001.
Astrocyte conditioned medium (ACM) with C3 Secreted from Active Astrocytes Induces Neuronal Cell Death
Considering our pathway analysis results, we thought that activated complement cascade may accelerate the degeneration of DA neuronsin two PD mouse models. Given that complement component 3 (C3) is primarily activated in glial cells16,31 and C3-positive astrocytes are involved in PD pathogenesis,31 we investigated whether C3-positive astrocytes are generated in the ventral midbrain of the intrastriatal α-synuclein PFF-injected mice used in this study. Using immunohistochemistry, the colocalization of C3 with GFAP as an astrocyte marker was assessed in the ventral midbrain of α-synuclein PFF-injected mice. C3-positive astrocytes were significantly increased in the intrastriatal α-syn PFF-injected mice compared with PBS-injected control mice as determined by relative fluorescence intensity and colocalization coefficient between C3 and GFAP (Figure 4A–C). Next, we investigated whether C3 secreted from these astrocytes could cause the degeneration of neurons. We constructed a plasmid expressing C3 protein with the GFAP-specific promotor for specific expression of C3 in astrocytes that was packaged in lentivirus to increase expression efficiency. Five days after transduction into astrocytes grown in serum-free media, the conditioned media from astrocytes overexpressing C3 (C3 ACM) were applied to primary neurons (Figure 4D). We first confirmed the expression of C3 protein in both astrocyte and cell culture media (Figure 4E,F). We also observed that C3 ACM-treated primary neurons showed significant toxicity, as determined by Alamarblue (Figure 4G). In addition, there was a reduction in MTT indicative of dysfunctional mitochondria (Figure 4H). Taken together, these results suggest that complement cascade activation in astrocytes can contribute to neurodegeneration in PD.
Figure 4.
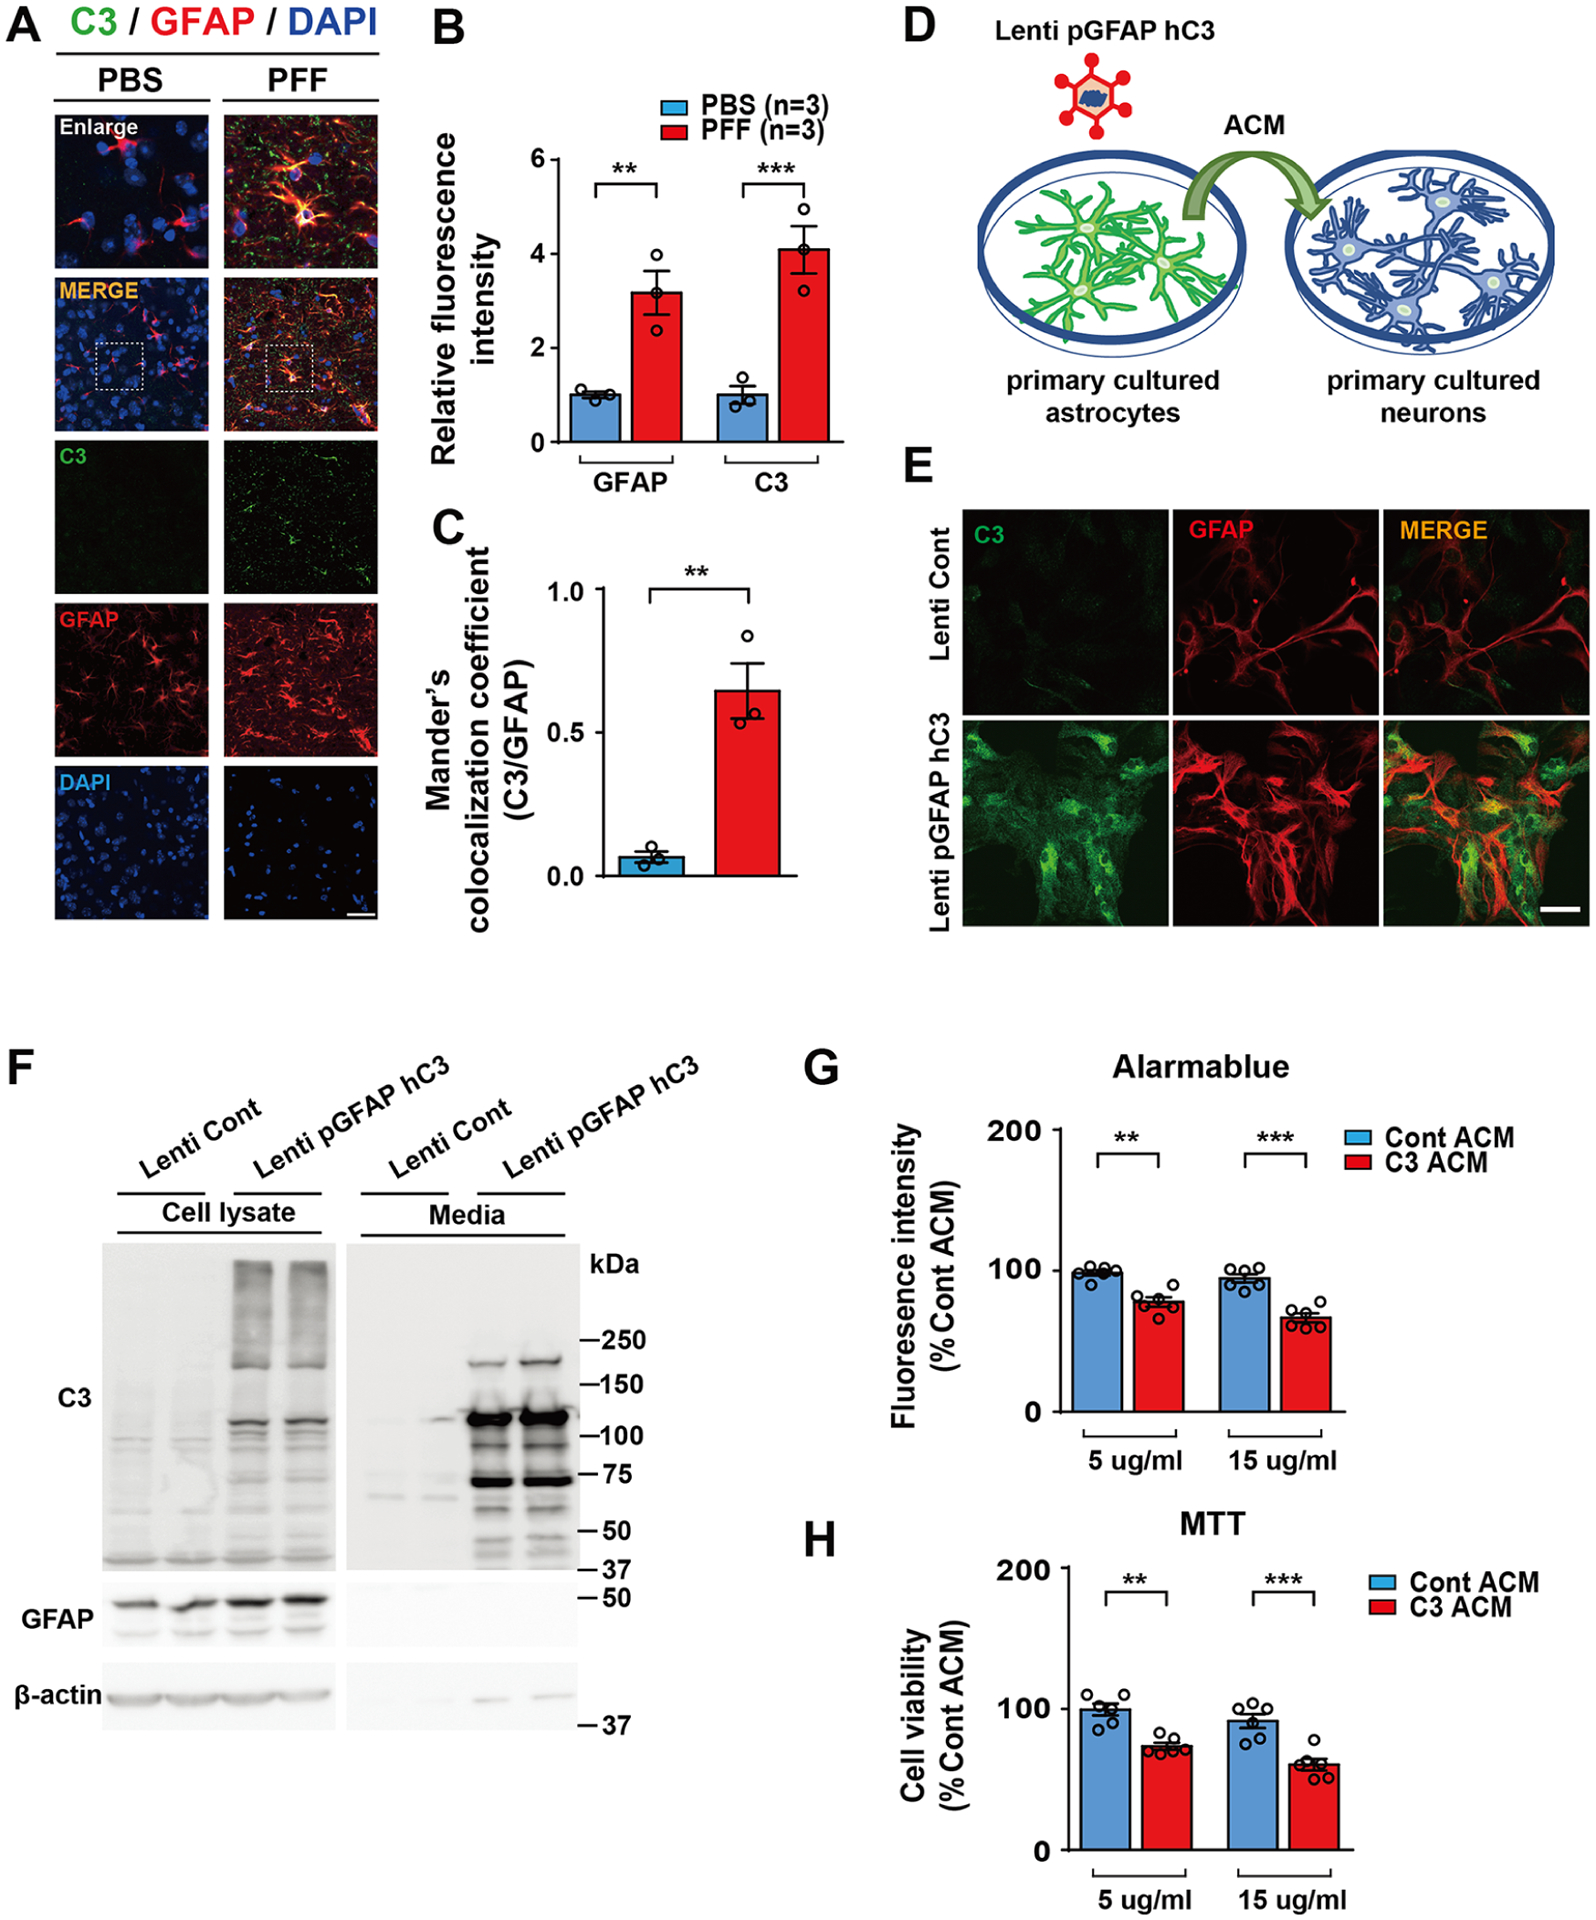
Astrocyte conditioned medium (ACM) with C3 secreted from active astrocytes induces neuronal cell death. (A) Representative C3 (green) and GFAP (red) immunostaining for C3 (green) and GFAP (red) in the ventral midbrain of PFF-injected mice at 6 months after PFF postinjection. Scale bar, 10 μm. (B) Quantification of C3 and GFAP immunoreactivity. (C) Calculation of the Manders’ coefficient of colocalization for C3 and GFAP. (D) Schematic diagram showing treatment of neurons with hC3 overexpressed ACM. (E) Representative confocal images showing astrocyte-specific C3 expression in cultured primary astrocyte cultures. (F) Representative immunoblot results showing the overexpression level of C3 proteins in primary astrocyte cultures (left panel) and the amount of C3 protein levels secreted from astrocytes to media (right panel). (G,H) Bar graph showing cytotoxicity of C3 overexpressed ACM (C3 ACM)-treated cultured primary cortical neuron. Cytotoxicity was measured using AlamarBlue (G) and MTT (H) assays. Error bars represent the mean ± S.E.M. Student’s t-test for statistical significance. *P < 0.05, **P < 0.01, and ***P < 0.001.
DISCUSSION
In this study, we conducted proteomic analyses of the ventral midbrain from two mouse models of PD that exhibit dopaminergic degeneration; the intrastriatal α-synuclein PFF-injected mouse model represents sporadic PD8 and the AAV1-tTA-injected TetP-hA53T α-syn Tg mouse model represents familial PD.18 These models allowed us to investigate pathways inextricably involved in pathologic α-synuclein-induced dopaminergic neurodegeneration. The most notable finding in this study is the observation that the coagulation and complement cascades are potentially involved in the neurodegenerative progress in PD.
Mass spectrometry-based proteomics technologies have been widely used for the identification of proteins that are differentially expressed in disease animal models on a global scale.12–15 To identify differentially expressed proteins, accurate quantification of protein levels is essential. Currently, multiple protein quantification approaches, such as label-free quantification, metabolic labeling, and isobaric mass tags are available.45 Among them, the metabolic labeling-based protein quantification, such as SILAM, provides the most accurate protein quantification because the experimental variation is minimized by adding brain samples labeled with heavy lysine before starting protein extraction. In this study, we could accurately quantify protein abundances using the SILAM-based method.
When only differentially expressed proteins in both PD mouse models were compared, the complement and coagulation cascade pathway was the most enriched (Table 2). On the other hand, when they were separately analyzed, the complement and coagulation cascade pathway was ranked 76th and 87th for α-synuclein PFF-injected mice and AAV1-tTA/TetP-hA53T-α-synuclein Tg mice, respectively (Supporting Information Table S3). These results suggest that the analysis of a single biological model can often lead to the identification of less important pathways as a major affected pathway. Therefore, validation with multiple biological models is necessary.
In this study, we showed that the complement components, such as C3, C3 fragments, and FH, were significantly induced in the ventral midbrain (VMB) of the two PD mouse models. These findings suggest that the complement pathway potentially mediates neurodegeneration induced by pathologic α-synuclein, such as DA neuronal loss. The complement system is well known as an essential branch of the innate immune system. Under normal conditions, the complement system plays a number of vital roles in the physiological process during brain development and homeostasis.46 Under disease conditions, complement synthesis in brain cells is significantly increased in parallel with tissue damage.47 Complement activation is elevated in human PD brains, especially in the presence of Lewy bodies (LB). Yamada and colleagues reported intra- and extra-neuronal LBs in the substantia nigra of patients with PD that were stained with both antibodies for early-stage (C3d and C4d) and late-stage (C7 and C9) complement proteins.48 C3d and C4d staining for LBs was also reported in the brainstem of dementia patients with Lewy bodies (DLB).49 Loeffler and colleagues50 reported a significantly higher proportion of iC3b+ neurons in normal aged specimens than in normal young specimens as well as a more considerable increase in PD brain specimens. Interestingly, they also reported that the percentage of iC3b+ neurons in the PD specimens was significantly higher than in Alzheimer’s disease (AD) specimens. In the same context, complement C3 plays a role in the complement cascade as a central molecule that is closely related to synapse elimination in the central nervous system (CNS) and brain aging.51,52 The region-specific synapse and neuron loss, as well as cognitive decline caused by normal aging, have been reported to be spared in C3 knockout mice.52 Moreover, intrastriatally injected α-synuclein PFF induced C3d immunoreactivity in the ventral midbrain with robust loss of DA neurons,16 suggesting that the complement pathway may contribute to driving neurodegeneration in the two mouse models of PD. It is important to note that activated A1 astrocytes identified in postmortem tissue from individuals with AD, PD, multiple sclerosis, amyotrophic lateral sclerosis, and Huntington’s disease were C3-positive.31 The main cell types of brain parenchyma, such as astrocytes and microglia, can take up extracellular α-synuclein aggregates and degrade them.53 It has been reported that microglial phagocytosis is one of the major causes of complement-mediated synapse loss.54 This suggests that the complement system modulates immune cell function and thereby contributes to neurodegeneration. In concordance with such previous findings, α-synuclein PFF increased C3 expression in astrocytes and the C3 expressed from astrocytes induced neuronal cell death in this study (Figure 4). These results suggest that activation of the complement cascade in the brain, especially via C3 expression in the astrocytes, can contribute to pathological α-synuclein LB pathology and neurodegeneration. Further investigation is necessary to understand the role of the complement system in the pathogenesis of PD.
Factor H (FH), the main regulator of this pathway, prevents the formation and promotes the dissociation of the C3 convertase enzyme.55,56 Several studies have suggested C3 and FH levels in cerebrospinal fluid (CSF) could serve as biomarkers for AD and PD.57–60 The expression level of FH was significantly increased in postmortem brain of AD cases than in the normal elderly (ND) cases.61 Importantly, the immunohistochemical study of FH showed intense immune responses throughout the AD brain, including amyloid β plaques, neurons, and glia, while ND did not.61 Strohmeyer and colleagues61 demonstrated possible interaction of FH with aggregated fibrillar amyloid β but not nonfibrillar amyloid β.
The blood coagulation factor fibrinogen is released into CNS parenchyma after blood–brain barrier (BBB) breakdown and converted to insoluble fibrin, a major proinflammatory matrix that activates the innate immune response.62,63 An emerging study using genetic or pharmacological depletion of fibrinogen indicates that fibrinogen is not only an indicator of BBB destruction, but it also plays a role in various animal models of neurological disease, particularly in multiple sclerosis,43 AD,64 brain trauma,65 and nerve injury.66 According to a large population-based cohort study, high fibrinogen levels were associated with higher prevalence and incidence of PD in participants aged 76 years and older.67 In addition, fibrinogen showed a similar 9.4-fold extravascular increase in the postcommissural putamen of PD patients.68 In fact, fibrinogen deposition increases simultaneously with the increase in amyloid-β in the brain as AD pathology progresses.64,69 In addition, increased fibrinogen levels are notedly associated with an increased risk of dementia and AD.70,71
In summary, our results suggest that complement and coagulation cascades potentially contribute to α-synuclein-induced neurodegeneration in PD. These pathways may provide a meaningful window into new drug targets or neuroprotective therapeutic strategies to treat PD.
Supplementary Material
ACKNOWLEDGMENTS
The authors acknowledge the joint participation of the Adrienne Helis Malvin Medical Research Foundation and the Diana Helis Henry Medical Research Foundation through its direct engagement in the continuous active conduct of medical research in conjunction with The Johns Hopkins Hospital and the Johns Hopkins University School of Medicine and the Foundation’s Parkinson’s Disease Program M-2014, H-1, H-2013. T.M.D. is the Leonard and Madlyn Abramson Professor in Neurodegenerative Diseases. This work was supported by grants from the NIH/NINDS NS107404. Editing assistance was provided by ReVision: A Scientific Editing Network at Johns Hopkins University.
ABBREVIATIONS
- PFF
preformed fibrils
- PD
Parkinson’s disease
- AD
Alzheimer’s disease
- LB
Lewy bodies
- SILAM
stable isotope labeling with amino acid in mammal
- TH
tyrosine hydroxylase
- DA
dopamine
- SNpc
substantia nigra par compacta
- MPTP
1-methyl-4-phenyl-1,2,3,6-tetrahydropyridine
- 6-OHDA
6-hydroxydopamine
- tTA
tetracycline-regulated transactivator
- TetP
tetracycline promoter
- AAV
adeno-associated virus
- LC-MS/MS
liquid chromatography with tandem mass spectrometry
- Tg
transgenic
- CNS
central nervous system
Footnotes
Supporting Information
The Supporting Information is available free of charge at https://pubs.acs.org/doi/10.1021/acs.jproteome.0c01002.
Antibodies used in this study; generation and characterization of intrastriatal α-synuclein PFF-injected mouse model of sporadic PD; generation and characterization of the AAV1-tTA/TetP-hA53T-α-synuclein Tg mouse model of familial PD; and Q–Q plots of P values from two different mouse models (PDF)
List of all the identified proteins with raw quantity values (XLSX)
List of all the identified and quantified proteins (XLSX)
List of enriched pathways in the α-synuclein PFF-injected mice and hA53T α-synuclein Tg mice (XLSX)
Entire Western blot images for the figures that include Western blot data (PDF)
Complete contact information is available at: https://pubs.acs.org/10.1021/acs.jproteome.0c01002
The authors declare no competing financial interest.
Contributor Information
Shi-Xun Ma, Neuroregeneration and Stem Cell Programs, Institute for Cell Engineering, Johns Hopkins University School of Medicine, Baltimore 21205-2105, Maryland, United States; Department of Neurology, Johns Hopkins University School of Medicine, Baltimore 21205-2105, Maryland, United States.
Bo Am Seo, Neuroregeneration and Stem Cell Programs, Institute for Cell Engineering, Johns Hopkins University School of Medicine, Baltimore 21205-2105, Maryland, United States; Department of Neurology, Johns Hopkins University School of Medicine, Baltimore 21205-2105, Maryland, United States.
Donghoon Kim, Neuroregeneration and Stem Cell Programs, Institute for Cell Engineering, Johns Hopkins University School of Medicine, Baltimore 21205-2105, Maryland, United States; Department of Neurology, Johns Hopkins University School of Medicine, Baltimore 21205-2105, Maryland, United States; Department of Pharmacology, Peripheral Neuropathy Research Center, Dong-A University College of Medicine, Busan 49201, South Korea.
Yulan Xiong, Neuroregeneration and Stem Cell Programs, Institute for Cell Engineering, Johns Hopkins University School of Medicine, Baltimore 21205-2105, Maryland, United States; Department of Neurology, Johns Hopkins University School of Medicine, Baltimore 21205-2105, Maryland, United States.
Seung-Hwan Kwon, Neuroregeneration and Stem Cell Programs, Institute for Cell Engineering, Johns Hopkins University School of Medicine, Baltimore 21205-2105, Maryland, United States; Department of Neurology, Johns Hopkins University School of Medicine, Baltimore 21205-2105, Maryland, United States.
Saurav Brahmachari, Neuroregeneration and Stem Cell Programs, Institute for Cell Engineering, Johns Hopkins University School of Medicine, Baltimore 21205-2105, Maryland, United States; Department of Neurology, Johns Hopkins University School of Medicine, Baltimore 21205-2105, Maryland, United States.
Sangjune Kim, Neuroregeneration and Stem Cell Programs, Institute for Cell Engineering, Johns Hopkins University School of Medicine, Baltimore 21205-2105, Maryland, United States; Department of Neurology, Johns Hopkins University School of Medicine, Baltimore 21205-2105, Maryland, United States.
Tae-In Kam, Neuroregeneration and Stem Cell Programs, Institute for Cell Engineering, Johns Hopkins University School of Medicine, Baltimore 21205-2105, Maryland, United States; Department of Neurology, Johns Hopkins University School of Medicine, Baltimore 21205-2105, Maryland, United States.
Raja Sekhar Nirujogi, McKusick-Nathans Institute of Genetic Medicine and Department of Biological Chemistry, Johns Hopkins University School of Medicine, Baltimore 21205-2105, Maryland, United States.
Sang Ho Kwon, Neuroregeneration and Stem Cell Programs, Institute for Cell Engineering, Johns Hopkins University School of Medicine, Baltimore 21205-2105, Maryland, United States; Department of Neurology, Johns Hopkins University School of Medicine, Baltimore 21205-2105, Maryland, United States.
Valina L. Dawson, Neuroregeneration and Stem Cell Programs, Institute for Cell Engineering, Johns Hopkins University School of Medicine, Baltimore 21205-2105, Maryland, United States; Department of Neurology, Solomon H. Snyder Department of Neuroscience, and Department of Physiology, Johns Hopkins University School of Medicine, Baltimore 21205-2105, Maryland, United States; Adrienne Helis Malvin Medical Research Foundation, New Orleans 70130, Louisiana, United States
Ted M. Dawson, Neuroregeneration and Stem Cell Programs, Institute for Cell Engineering, Johns Hopkins University School of Medicine, Baltimore 21205-2105, Maryland, United States; Department of Neurology, Solomon H. Snyder Department of Neuroscience, and Department of Pharmacology and Molecular Sciences, Johns Hopkins University School of Medicine, Baltimore 21205-2105, Maryland, United States; Adrienne Helis Malvin Medical Research Foundation, New Orleans 70130, Louisiana, United States; Diana Helis Henry Medical Research Foundation, New Orleans 70130, Louisiana, United States;
Akhilesh Pandey, McKusick-Nathans Institute of Genetic Medicine, Department of Biological Chemistry, Department of Pathology, and Department of Oncology, Johns Hopkins University School of Medicine, Baltimore 21205-2105, Maryland, United States; Department of Laboratory Medicine and Pathology, Center for Individualized Medicine, Mayo Clinic, Rochester, Minnesota 55905, United States; Manipal Academy of Higher Education, Manipal 576104, Karnataka, India;.
Chan Hyun Na, Neuroregeneration and Stem Cell Programs, Institute for Cell Engineering, Johns Hopkins University School of Medicine, Baltimore 21205-2105, Maryland, United States; Department of Neurology, Johns Hopkins University School of Medicine, Baltimore 21205-2105, Maryland, United States;.
Han Seok Ko, Neuroregeneration and Stem Cell Programs, Institute for Cell Engineering, Johns Hopkins University School of Medicine, Baltimore 21205-2105, Maryland, United States; Department of Neurology, Johns Hopkins University School of Medicine, Baltimore 21205-2105, Maryland, United States; Adrienne Helis Malvin Medical Research Foundation, New Orleans 70130, Louisiana, United States; Diana Helis Henry Medical Research Foundation, New Orleans 70130, Louisiana, United States;.
REFERENCES
- (1).Przedborski S The two-century journey of Parkinson disease research. Nat. Rev. Neurosci 2017, 18, 251–259. [DOI] [PubMed] [Google Scholar]
- (2).Espay AJ; Brundin P; Lang AE Precision medicine for disease modification in Parkinson disease. Nat. Rev. Neurol 2017, 13, 119–126. [DOI] [PubMed] [Google Scholar]
- (3).Shin J-H; Dawson VL; Dawson TM SnapShot: pathogenesis of Parkinson’s disease. Cell 2009, 139, 440.e1–440.e2. [DOI] [PubMed] [Google Scholar]
- (4).Conway KA; Harper JD; Lansbury PT Accelerated in vitro fibril formation by a mutant α-synuclein linked to early-onset Parkinson disease. Nat. Med 1998, 4, 1318–1320. [DOI] [PubMed] [Google Scholar]
- (5).Spillantini MG; Schmidt ML; Lee VM-Y; Trojanowski JQ; Jakes R; Goedert M α-Synuclein in Lewy bodies. Nature 1997, 388, 839–840. [DOI] [PubMed] [Google Scholar]
- (6).Dawson TM; Ko HS; Dawson VL Genetic animal models of Parkinson’s disease. Neuron 2010, 66, 646–661. [DOI] [PMC free article] [PubMed] [Google Scholar]
- (7).Kim S; Kwon S-H; Kam T-I; Panicker N; Karuppagounder SS; Lee S; Lee JH; Kim WR; Kook M; Foss CA; Shen C; Lee H; Kulkarni S; Pasricha PJ; Lee G; Pomper MG; Dawson VL; Dawson TM; Ko HS Transneuronal Propagation of Pathologic α-Synuclein from the Gut to the Brain Models Parkinson’s Disease. Neuron 2019, 103, 627–641. [DOI] [PMC free article] [PubMed] [Google Scholar]
- (8).Luk KC; Kehm V; Carroll J; Zhang B; O’Brien P; Trojanowski JQ; Lee VMY Pathological -Synuclein Transmission Initiates Parkinson-like Neurodegeneration in Nontransgenic Mice. Science 2012, 338, 949–953. [DOI] [PMC free article] [PubMed] [Google Scholar]
- (9).Blesa J; Przedborski S Parkinson†s disease: animal models and dopaminergic cell vulnerability. Front. Neuroanat 2014, 8, 155. [DOI] [PMC free article] [PubMed] [Google Scholar]
- (10).Giasson BI; Duda JE; Quinn SM; Zhang B; Trojanowski JQ; Lee VM-Y Neuronal α-Synucleinopathy with Severe Movement Disorder in Mice Expressing A53T Human α-Synuclein. Neuron 2002, 34, 521–533. [DOI] [PubMed] [Google Scholar]
- (11).Lin X; Parisiadou L; Sgobio C; Liu G; Yu J; Sun L; Shim H; Gu X-L; Luo J; Long C-X; Ding J; Mateo Y; Sullivan PH; Wu L-G; Goldstein DS; Lovinger D; Cai H Conditional Expression of Parkinson’s Disease-Related Mutant -Synuclein in the Midbrain Dopaminergic Neurons Causes Progressive Neurodegeneration and Degradation of Transcription Factor Nuclear Receptor Related 1. J. Neurosci 2012, 32, 9248–9264. [DOI] [PMC free article] [PubMed] [Google Scholar]
- (12).Diedrich M; Mao L; Bernreuther C; Zabel C; Nebrich G; Kleene R; Klose J Proteome analysis of ventral midbrain in MPTP-treated normal and L1cam transgenic mice. Proteomics 2008, 8, 1266–1275. [DOI] [PubMed] [Google Scholar]
- (13).Lin X; Shi M; Masilamoni JG; Dator R; Movius J; Aro P; Smith Y; Zhang J Proteomic profiling in MPTP monkey model for early Parkinson disease biomarker discovery. Biochim. Biophys. Acta 2015, 1854, 779–787. [DOI] [PMC free article] [PubMed] [Google Scholar]
- (14).Yan J; Zhang P; Jiao F; Wang Q; He F; Zhang Q; Zhang Z; Lv Z; Peng X; Cai H; Tian B Quantitative proteomics in A30P*A53T α-synuclein transgenic mice reveals upregulation of Sel1l. PLoS One 2017, 12, No. e0182092. [DOI] [PMC free article] [PubMed] [Google Scholar]
- (15).De Iuliis A; Grigoletto J; Recchia A; Giusti P; Arslan P A proteomic approach in the study of an animal model of Parkinson’s disease. Clin. Chim. Acta 2005, 357, 202–209. [DOI] [PubMed] [Google Scholar]
- (16).Yun SP; Kam T-I; Panicker N; Kim S; Oh Y; Park J-S; Kwon S-H; Park YJ; Karuppagounder SS; Park H; Kim S; Oh N; Kim NA; Lee S; Brahmachari S; Mao X; Lee JH; Kumar M; An D; Kang S-U; Lee Y; Lee KC; Na DH; Kim D; Lee SH; Roschke VV; Liddelow SA; Mari Z; Barres BA; Dawson VL; Lee S; Dawson TM; Ko HS Block of A1 astrocyte conversion by microglia is neuroprotective in models of Parkinson’s disease. Nat. Med 2018, 24, 931–938. [DOI] [PMC free article] [PubMed] [Google Scholar]
- (17).Lee S; Kim S; Park YJ; Yun SP; Kwon S-H; Kim D; Kim DY; Shin JS; Cho DJ; Lee GY; Ju HS; Yun HJ; Park JH; Kim WR; Jung EA; Lee S; Ko HS The c-Abl inhibitor, Radotinib HCl, is neuroprotective in a preclinical Parkinson’s disease mouse model. Hum. Mol. Genet 2018, 27, 2344–2356. [DOI] [PMC free article] [PubMed] [Google Scholar]
- (18).Brahmachari S; Lee S; Kim S; Yuan C; Karuppagounder SS; Ge P; Shi R; Kim EJ; Liu A; Kim D; Quintin S; Jiang H; Kumar M; Yun SP; Kam T-I; Mao X; Lee Y; Swing DA; Tessarollo L; Ko HS; Dawson VL; Dawson TM Parkin interacting substrate zinc finger protein 746 is a pathological mediator in Parkinson’s disease. Brain 2019, 142, 2380–2401. [DOI] [PMC free article] [PubMed] [Google Scholar]
- (19).Mao X; Ou MT; Karuppagounder SS; Kam T-I; Yin X; Xiong Y; Ge P; Umanah GE; Brahmachari S; Shin J-H; Kang HC; Zhang J; Xu J; Chen R; Park H; Andrabi SA; Kang SU; Gonçalves RA; Liang Y; Zhang S; Qi C; Lam S; Keiler JA; Tyson J; Kim D; Panicker N; Yun SP; Workman CJ; Vignali DAA; Dawson VL; Ko HS; Dawson TM Pathological α-synuclein transmission initiated by binding lymphocyte-activation gene 3. Science 2016, 353, aah3374. [DOI] [PMC free article] [PubMed] [Google Scholar]
- (20).Lee Y; Dawson VL; Dawson TM Animal models of Parkinson’s disease: vertebrate genetics. Cold Spring Harbor Perspect. Med 2012, 2, a009324. [DOI] [PMC free article] [PubMed] [Google Scholar]
- (21).Lee Y; Karuppagounder SS; Shin J-H; Lee Y-I; Ko HS; Swing D; Jiang H; Kang S-U; Lee BD; Kang HC; Kim D; Tessarollo L; Dawson VL; Dawson TM Parthanatos mediates AIMP2-activated age-dependent dopaminergic neuronal loss. Nat. Neurosci 2013, 16, 1392–1400. [DOI] [PMC free article] [PubMed] [Google Scholar]
- (22).Xiong Y; Neifert S; Karuppagounder SS; Liu Q; Stankowski JN; Lee BD; Ko HS; Lee Y; Grima JC; Mao X; Jiang H; Kang S-U; Swing DA; Iacovitti L; Tessarollo L; Dawson TM; Dawson VL Robust kinase- and age-dependent dopaminergic and norepinephrine neurodegeneration in LRRK2 G2019S transgenic mice. Proc. Natl. Acad. Sci. U.S.A 2018, 115, 1635–1640. [DOI] [PMC free article] [PubMed] [Google Scholar]
- (23).Ong S-E; Blagoev B; Kratchmarova I; Kristensen DB; Steen H; Pandey A; Mann M Stable isotope labeling by amino acids in cell culture, SILAC, as a simple and accurate approach to expression proteomics. Mol. Cell. Proteomics 2002, 1, 376–386. [DOI] [PubMed] [Google Scholar]
- (24).Smith BJ; Martins-de-Souza D; Fioramonte M A Guide to Mass Spectrometry-Based Quantitative Proteomics. Methods Mol. Biol 2019, 1916, 3–39. [DOI] [PubMed] [Google Scholar]
- (25).Whitton PS Inflammation as a causative factor in the aetiology of Parkinson’s disease. Br. J. Pharmacol 2007, 150, 963–976. [DOI] [PMC free article] [PubMed] [Google Scholar]
- (26).Czlonkowska A; Kurkowska-Jastrzębska I; Czlonkowski A; Peter D; Stefano GB Immune processes in the pathogenesis of Parkinson’s disease - a potential role for microglia and nitric oxide. Med. Sci. Mon 2002, 8, RA165–177. [PubMed] [Google Scholar]
- (27).McGuire SO; Ling ZD; Lipton JW; Sortwell CE; Collier TJ; Carvey PM Tumor Necrosis Factor α Is Toxic to Embryonic Mesencephalic Dopamine Neurons. Exp. Neurol 2001, 169, 219–230. [DOI] [PubMed] [Google Scholar]
- (28).Block ML; Zecca L; Hong J-S Microglia-mediated neurotoxicity: uncovering the molecular mechanisms. Nat. Rev. Neurosci 2007, 8, 57–69. [DOI] [PubMed] [Google Scholar]
- (29).Mount MP; Lira A; Grimes D; Smith PD; Faucher S; Slack R; Anisman H; Hayley S; Park DS Involvement of Interferon- in Microglial-Mediated Loss of Dopaminergic Neurons. J. Neurosci 2007, 27, 3328–3337. [DOI] [PMC free article] [PubMed] [Google Scholar]
- (30).Tansey MG; Goldberg MS Neuroinflammation in Parkinson’s disease: its role in neuronal death and implications for therapeutic intervention. Neurobiol. Dis 2010, 37, 510–518. [DOI] [PMC free article] [PubMed] [Google Scholar]
- (31).Liddelow SA; Guttenplan KA; Clarke LE; Bennett FC; Bohlen CJ; Schirmer L; Bennett ML; Munch AE; Chung W-S; Peterson TC; Wilton DK; Frouin A; Napier BA; Panicker N; Kumar M; Buckwalter MS; Rowitch DH; Dawson VL; Dawson TM; Stevens B; Barres BA Neurotoxic reactive astrocytes are induced by activated microglia. Nature 2017, 541, 481–487. [DOI] [PMC free article] [PubMed] [Google Scholar]
- (32).Seo BA; Cho T; Lee DZ; Lee J.-j.; Lee B; Kim S-W; Shin H-S; Kang M-G LARGE, an intellectual disability-associated protein, regulates AMPA-type glutamate receptor trafficking and memory. Proc. Natl. Acad. Sci. U.S.A 2018, 115, 7111–7116. [DOI] [PMC free article] [PubMed] [Google Scholar]
- (33).Wu CC; MacCoss MJ; Howell KE; Matthews DE; Yates JR 3rd. Metabolic labeling of mammalian organisms with stable isotopes for quantitative proteomic analysis. Anal. Chem 2004, 76, 4951–4959. [DOI] [PubMed] [Google Scholar]
- (34).Heo S; Diering GH; Na CH; Nirujogi RS; Bachman JL; Pandey A; Huganir RL Identification of long-lived synaptic proteins by proteomic analysis of synaptosome protein turnover. Proc. Natl. Acad. Sci. U.S.A 2018, 115, E3827–E3836. [DOI] [PMC free article] [PubMed] [Google Scholar]
- (35).Volpicelli-Daley LA; Luk KC; Lee VM-Y Addition of exogenous α-synuclein preformed fibrils to primary neuronal cultures to seed recruitment of endogenous α-synuclein to Lewy body and Lewy neurite-like aggregates. Nat. Protoc 2014, 9, 2135–2146. [DOI] [PMC free article] [PubMed] [Google Scholar]
- (36).Kim D; Yoo JM; Hwang H; Lee J; Lee SH; Yun SP; Park MJ; Lee M; Choi S; Kwon SH; Lee S; Kwon S-H; Kim S; Park YJ; Kinoshita M; Lee Y-H; Shin S; Paik SR; Lee SJ; Lee S; Hong BH; Ko HS Graphene quantum dots prevent α-synucleinopathy in Parkinson’s disease. Nat. Nanotechnol 2018, 13, 812–818. [DOI] [PMC free article] [PubMed] [Google Scholar]
- (37).Lee Y; Karuppagounder SS; Shin J-H; Lee Y-I; Ko HS; Swing D; Jiang H; Kang S-U; Lee BD; Kang HC; Kim D; Tessarollo L; Dawson VL; Dawson TM Erratum: Corrigendum: Parthanatos mediates AIMP2-activated age-dependent dopaminergic neuronal loss. Nat. Neurosci 2015, 18, 1861. [DOI] [PubMed] [Google Scholar]
- (38).Lee Y; Messing A; Su M; Brenner M GFAPpromoter elements required for region-specific and astrocyte-specific expression. Glia 2008, 56, 481–493. [DOI] [PubMed] [Google Scholar]
- (39).Wiśniewski JR; Zougman A; Nagaraj N; Mann M Universal sample preparation method for proteome analysis. Nat. Methods 2009, 6, 359–362. [DOI] [PubMed] [Google Scholar]
- (40).Tyanova S; Temu T; Sinitcyn P; Carlson A; Hein MY; Geiger T; Mann M; Cox J The Perseus computational platform for comprehensive analysis of (prote)omics data. Nat. Methods 2016, 13, 731–740. [DOI] [PubMed] [Google Scholar]
- (41).Huang DW; Sherman BT; Lempicki RA Systematic and integrative analysis of large gene lists using DAVID bioinformatics resources. Nat. Protoc 2009, 4, 44–57. [DOI] [PubMed] [Google Scholar]
- (42).Tusher VG; Tibshirani R; Chu G Significance analysis of microarrays applied to the ionizing radiation response. Proc. Natl. Acad. Sci. U.S.A 2001, 98, 5116–5121. [DOI] [PMC free article] [PubMed] [Google Scholar]
- (43).Adams RA; Bauer J; Flick MJ; Sikorski SL; Nuriel T; Lassmann H; Degen JL; Akassoglou K The fibrin-derived γ377–395 peptide inhibits microglia activation and suppresses relapsing paralysis in central nervous system autoimmune disease. J. Exp. Med 2007, 204, 571–582. [DOI] [PMC free article] [PubMed] [Google Scholar]
- (44).Wang Q; Petrovski S Permutation Based QQ Plot and Inflation Factor Estimation, 2016.
- (45).Lindemann C; Thomanek N; Hundt F; Lerari T; Meyer HE; Wolters D; Marcus K Strategies in relative and absolute quantitative mass spectrometry based proteomics. Biol. Chem 2017, 398, 687–699. [DOI] [PubMed] [Google Scholar]
- (46).Orsini F; De Blasio D; Zangari R; Zanier ER; De Simoni M-G Versatility of the complement system in neuroinflammation, neurodegeneration and brain homeostasis. Front. Cell. Neurosci 2014, 8, 380. [DOI] [PMC free article] [PubMed] [Google Scholar]
- (47).Woodruff TM; Ager RR; Tenner AJ; Noakes PG; Taylor SM The role of the complement system and the activation fragment C5a in the central nervous system. NeuroMolecular Med 2010, 12, 179–192. [DOI] [PubMed] [Google Scholar]
- (48).Yamada T; McGeer PL; McGeer EG Lewy bodies in Parkinson’s disease are recognized by antibodies to complement proteins. Acta Neuropathol 1992, 84, 100–104. [DOI] [PubMed] [Google Scholar]
- (49).Iseki E; Marui W; Akiyama H; Uéda K; Kosaka K Degeneration process of Lewy bodies in the brains of patients with dementia with Lewy bodies using α-synuclein-immunohistochemistry. Neurosci. Lett 2000, 286, 69–73. [DOI] [PubMed] [Google Scholar]
- (50).Loeffler DA; Camp DM; Conant SB Complement activation in the Parkinson’s disease substantia nigra: an immunocytochemical study. J. Neuroinflammation 2006, 3, 29. [DOI] [PMC free article] [PubMed] [Google Scholar]
- (51).Stevens B; Allen NJ; Vazquez LE; Howell GR; Christopherson KS; Nouri N; Micheva KD; Mehalow AK; Huberman AD; Stafford B; Sher A; Litke AM; Lambris JD; Smith SJ; John SWM; Barres BA The classical complement cascade mediates CNS synapse elimination. Cell 2007, 131, 1164–1178. [DOI] [PubMed] [Google Scholar]
- (52).Shi Q; Colodner KJ; Matousek SB; Merry K; Hong S; Kenison JE; Frost JL; Le KX; Li S; Dodart J-C; Caldarone BJ; Stevens B; Lemere CA Complement C3-Deficient Mice Fail to Display Age-Related Hippocampal Decline. J. Neurosci 2015, 35, 13029–13042. [DOI] [PMC free article] [PubMed] [Google Scholar]
- (53).Lee H-J; Suk J-E; Bae E-J; Lee S-J Clearance and deposition of extracellular α-synuclein aggregates in microglia. Biochem. Biophys. Res. Commun 2008, 372, 423–428. [DOI] [PubMed] [Google Scholar]
- (54).Hong S; Beja-Glasser VF; Nfonoyim BM; Frouin A; Li S;Ramakrishnan S; Merry KM; Shi Q; Rosenthal A; Barres BA; Lemere CA; Selkoe DJ; Stevens B Complement and microglia mediate early synapse loss in Alzheimer mouse models. Science 2016, 352, 712–716. [DOI] [PMC free article] [PubMed] [Google Scholar]
- (55).Pangburn MK; Muller-Eberhard HJ Complement C3 convertase: Cell surface restriction of 1H control and generation of restriction on neuraminidase-treated cells. Proc. Natl. Acad. Sci. U.S.A 1978, 75, 2416–2420. [DOI] [PMC free article] [PubMed] [Google Scholar]
- (56).Weiler JM; Daha MR; Austen KF; Fearon DT Control of the amplification convertase of complement by the plasma protein beta1H. Proc. Natl. Acad. Sci. U.S.A 1976, 73, 3268–3272. [DOI] [PMC free article] [PubMed] [Google Scholar]
- (57).Hu WT; Watts KD; Tailor P; Nguyen TP; Howell JC; Lee RC; Seyfried NT; Gearing M; Hales CM; Levey AI; Lah JJ; Lee EK Alzheimer’s Disease Neuro-Imaging, I. CSF complement 3 and factor H are staging biomarkers in Alzheimer’s disease. Acta Neuropathol. Commun 2016, 4, 14. [DOI] [PMC free article] [PubMed] [Google Scholar]
- (58).Wang Y; Hancock AM; Bradner J; Chung KA; Quinn JF; Peskind ER; Galasko D; Jankovic J; Zabetian CP; Kim HM; Leverenz JB; Montine TJ; Ginghina C; Edwards KL; Snapinn KW; Goldstein DS; Shi M; Zhang J Complement 3 and factor h in human cerebrospinal fluid in Parkinson’s disease, Alzheimer’s disease, and multiple-system atrophy. Am. J. Pathol 2011, 178, 1509–1516. [DOI] [PMC free article] [PubMed] [Google Scholar]
- (59).Toledo JB; Korff A; Shaw LM; Trojanowski JQ; Zhang J Low levels of cerebrospinal fluid complement 3 and factor H predict faster cognitive decline in mild cognitive impairment. Alzheimer’s Res. Ther 2014, 6, 36. [DOI] [PMC free article] [PubMed] [Google Scholar]
- (60).Ingram G; Hakobyan S; Hirst CL; Harris CL; Pickersgill TP; Cossburn MD; Loveless S; Robertson NP; Morgan BP Complement regulator factor H as a serum biomarker of multiple sclerosis disease state. Brain 2010, 133, 1602–1611. [DOI] [PubMed] [Google Scholar]
- (61).Strohmeyer R; Ramirez M; Cole GJ; Mueller K; Rogers J Association of factor H of the alternative pathway of complement with agrin and complement receptor 3 in the Alzheimer’s disease brain. J. Neuroimmunol 2002, 131, 135–146. [DOI] [PubMed] [Google Scholar]
- (62).Petersen MA; Ryu JK; Akassoglou K Fibrinogen in neurological diseases: mechanisms, imaging and therapeutics. Nat. Rev. Neurosci 2018, 19, 283–301. [DOI] [PMC free article] [PubMed] [Google Scholar]
- (63).Davalos D; Akassoglou K Fibrinogen as a key regulator of inflammation in disease. Semin. Immunopathol 2012, 34, 43–62. [DOI] [PubMed] [Google Scholar]
- (64).Paul J; Strickland S; Melchor JP Fibrin deposition accelerates neurovascular damage and neuroinflammation in mouse models of Alzheimer’s disease. J. Exp. Med 2007, 204, 1999–2008. [DOI] [PMC free article] [PubMed] [Google Scholar]
- (65).Schachtrup C; Ryu JK; Helmrick MJ; Vagena E; Galanakis DK; Degen JL; Margolis RU; Akassoglou K Fibrinogen triggers astrocyte scar formation by promoting the availability of active TGF-beta after vascular damage. J. Neurosci 2010, 30, 5843–5854. [DOI] [PMC free article] [PubMed] [Google Scholar]
- (66).Akassoglou K; Yu W-M; Akpinar P; Strickland S Fibrin inhibits peripheral nerve remyelination by regulating Schwann cell differentiation. Neuron 2002, 33, 861–875. [DOI] [PubMed] [Google Scholar]
- (67).Wong KT; Grove JS; Grandinetti A; Curb JD; Yee M; Blanchette P; Ross GW; Rodriguez BI Association of fibrinogen with Parkinson disease in elderly Japanese-American men: a prospective study. Neuroepidemiology 2010, 34, 50–54. [DOI] [PMC free article] [PubMed] [Google Scholar]
- (68).Gray MT; Woulfe JM Striatal blood-brain barrier permeability in Parkinson’s disease. J. Cereb. Blood Flow Metab. Suppl 2015, 35, 747–750. [DOI] [PMC free article] [PubMed] [Google Scholar]
- (69).Ryu JK; McLarnon JG A leaky blood-brain barrier, fibrinogen infiltration and microglial reactivity in inflamed Alzheimer’s disease brain. J. Cell Mol. Med 2009, 13, 2911–2925. [DOI] [PMC free article] [PubMed] [Google Scholar]
- (70).van Oijen M; Witteman JC; Hofman A; Koudstaal PJ; Breteler MM Fibrinogen is associated with an increased risk of Alzheimer disease and vascular dementia. Stroke 2005, 36, 2637–2641. [DOI] [PubMed] [Google Scholar]
- (71).Xu G; Zhang H; Zhang S; Fan X; Liu X Plasma fibrinogen is associated with cognitive decline and risk for dementia in patients with mild cognitive impairment. Int. J. Clin. Pract 2008, 62, 1070–1075. [DOI] [PubMed] [Google Scholar]
Associated Data
This section collects any data citations, data availability statements, or supplementary materials included in this article.
Supplementary Materials
Data Availability Statement
All mass spectrometry data and search results have been deposited to the ProteomeXchange Consortium (http://proteomecentral.proteomexchange.org/cgi/GetDataset?ID=PXD015293) via the PRIDE partner repository with the dataset identifier PXD015293 and project name “Quantitative proteome analyses of two types of Parkinson’s disease mouse model revealed potential pathways of the pathogenesis”.