

Abstract
TASK2 (KCNK5) channels generate pH-gated leak-type K+ currents to control cellular electrical excitability1-3. TASK2 is involved in breathing regulation by brainstem retrotrapezoid nucleus chemosensory neurons6,13,14 and pH homeostasis by kidney proximal tubule cells5,12. These roles depend on channel activation by intracellular and extracellular alkalization3,12,16, but the mechanistic basis for TASK2 gating by pH is unknown. Here, we present cryo-EM structures of Mus musculus TASK2 in lipid nanodiscs in open and closed conformations. We identify two gates, distinct from those previously characterized, controlled by stimuli on either side of the membrane. Intracellular gating involves lysine protonation on inner helices and formation of a protein seal between the cytoplasm and channel. Extracellular gating involves arginine protonation on the channel surface and correlated conformational changes that displace the K+-selectivity filter to render it nonconductive. These results explain how internal and external protons control intracellular and selectivity filter gates to modulate TASK2 activity.
TASK2 (TWIK-related acid sensitive K+-channel 2) is a pH-gated member of the two-pore domain K+ (K2P) channel family1,2. TASK2 is expressed widely, including in neurons, immune cells, chondrocytes, and epithelial cells of organs including the kidney and has been implicated in chemosensation, volume regulation, and ionic homeostasis3-9. TASK2 upregulation is associated with breast cancer proliferation, while its loss of function underlies Balkan endemic nephropathy10,11. Physiological roles of TASK2 have been related to its modulation by changes in intracellular and extracellular pH (pHint and pHext)3,12,13. In neurons of the retrotrapezoid nucleus, TASK2 inhibition by extracellular and/or intracellular protons (as a proxy for blood [CO2]16) depolarizes the cell, increases spike frequency, and leads to increased respiration6,13,14. In the kidney proximal tubule, TASK2 activation by extracellular alkalization that results from electrogenic bicarbonate secretion hyperpolarizes the cell to support further bicarbonate efflux5,12.
TASK2 is predominantly closed at pH 6.5 and is activated by intracellular and extracellular alkalization with a midpoint pH of 8.0-8.51,3,15. Mutational analyses have identified proton sensors on either side of the membrane: the extracellular residue R224 and intracellular residue K24516,17. Gating by pHext, but not pHint, is voltage- and [K+]ext-dependent, consistent with selectivity filter (or C-type) gating by external, but not internal, stimuli1,16. Still, the structural and mechanistic basis for gating of TASK2 is unknown and expected to be distinct from other K2P channels for which structures have been determined in detergent micelles18-21,41-42.
Removing the predicted unstructured C-terminal region of Mus musculus TASK2 (resulting in TASK21-335) increased expression and biochemical stability of the purified channel for structural studies (Extended Data Fig.1, Supplementary Figs. 1,2). This construct retained the hallmark features of TASK2 when expressed in cells; activation by extracellular alkalization, intracellular alkalization, and intracellular PIP2 (which requires an intact membrane proximal C-terminal region) was indistinguishable from full length TASK2 and comparable to previous reports (Figs. 1a-c, Extended Data Fig. 2a-e)1,15-17,22. TASK21-335 was therefore used for structural studies.
Figure 1 – Structure and function of TASK2.

Current-voltage relationships from a TASK2-expressing whole cell in response to varied (a) pHext and (b) pHint. Currents in (a,b) are mean ± s.e.m. from three sweeps at each voltage. (c) Normalized fold-activation of full length TASK2 (3.10±0.31) and TASK2ΔC (3.43±0.28) by pHext=9/pHext=7, of full length TASK2 (1.85±0.32) and TASK2ΔC (1.95±0.11) by pHint=9/pHint=7, and of full length TASK2 (2.21±0.24) and TASK2ΔC (2.43±0.24) by 50 μM di-C8 PIP2. Mean ± s.e.m. are reported and plotted for n=8, 6, 4, 7, 3, and 3 cells from 2, 3, 2, 4, 2, and 3 independent transfections, respectively. Differences were assessed with unpaired two-tailed Student’s t-test. P=0.45, 0.72, and 0.54 (P>0.05 not significant (n.s.)) for pHext, pHint, and PIP2, respectively. (d) Cryo-EM map at pH 8.5 viewed from the membrane plane with density for nanodisc transparent and for TASK protomers teal and white. (e) TASK2 structure at pH 8.5 colored as in (d) with K+ ions teal and disulfide yellow. (f) Cartoon representation of a TASK2 protomer with transmembrane helices (TM1-4), cap helices (CH1,2), pore helices (PH1,2), selectivity filters (SF1,2), and key residues discussed in the text indicated.
To determine the basis for channel gating in a lipid membrane-like environment, we reconstituted TASK2 into nanodiscs made from the scaffold protein MSP1D123 and DOPE, POPC, and POPS lipids (Extended Data Fig. 1) and determined its structure at pH 8.5 and 6.5. Unmasked reconstructions show well-defined density for TASK2 and the surrounding nanodisc (Fig. 1d). Cryo-EM maps were improved by partial signal subtraction of nanodisc density followed by further classification and refinement (Extended Data Fig. 3-5). The channel is two-fold symmetric at high pH and asymmetric at low pH. While asymmetric and C2 symmetric reconstructions of TASK2 at pH 8.5 were essentially indistinguishable, enforcing C2 symmetry in reconstructions of TASK2 at pH 6.5 resulted in loss of density features, especially around the intracellular halves of transmembrane helices.
Amino acids 6-260 from each chain (58 kDa total) corresponding to the transmembrane and extracellular regions of the channel were de novo modeled into the final reconstructions at pH 8.5 and pH 6.5 (both at approximately 3.5 Å resolution) (Fig. 1d,e, Extended Data Fig. 5, Extended Data Table 1). Like other K2Ps, TASK2 is a domain swapped homodimer with each protomer chain containing four transmembrane spanning helices (TM1-TM4), two reentrant pore helices (PH1, PH2), two selectivity filters (SF1,SF2), and two extracellular cap forming helices (CH1, CH2) (Fig. 1f). The extracellular helical cap extends 35 Å above the mouth of the pore and is stabilized by an interchain disulfide bond at its apex. The distal intracellular C-terminal region was not resolved, suggesting it is conformationally heterogenous or unstructured as observed in previous K2P crystal structures18-21.
Comparison of the structures determined at different pH values reveals the channel adopts a predominantly nonconductive (closed) conformation at pH 6.5 and a predominantly conductive (open) conformation at pH 8.5 (Fig. 2a-c), consistent with functional data (Fig.1a,b). Conformational changes in two regions gate TASK2 closed: an intracellular gate at the membrane-cytoplasm interface and an extracellular gate at the top of the selectivity filter. The bifurcated extracellular pathway connecting the top of the selectivity filter underneath the helical cap to the extracellular solution is similarly accessible to K+ in both structures (Extended Data Fig. 6a-c).
Figure 2 – Comparison of open and closed TASK2 structures captured in high and low pH.

Structures of TASK2 determined at (a) pH 8.5 and (b) pH 6.5. The surface of the conduction pathway through the channel is shown in gray. (c) Radius of the channel interior as a function of distance along the conduction pathway. Plot is drawn at the same scale as surfaces in (a,b). The positions of K+ coordination sites S0-S4, the extracellular selectivity filter gate, and the intracellular gate at the membrane-cytoplasm interface are indicated.
At pH 8.5, a wide channel cavity lined by TM2, TM3, and TM4 from each protomer creates an unobstructed path for ion conduction from the intracellular solution to the base of the K+ selectivity filter (Figs. 2a,c). Its narrowest constriction has a radius of 3.5 Å, which is wide enough to accommodate hydrated K+ ions (Figs. 2c). At pH 6.5, rearrangements of TM4 from each subunit creates a tight constriction near the cytoplasm-membrane interface (Fig. 2b,c). The constriction narrows to a radius of 1.2 Å, too small to allow passage of even partially dehydrated K+ ions, gating the channel closed (Fig. 2c). We note that the local resolution of the cryo-EM map in this region is lower than the map average (Extended Data Fig. 5b,f). While the model fits well to the density, particularly in the peptide backbone, the positions of side chains are less well determined than in the rest of the channel (Extended Data Fig. 5d,h). This may be due to modest conformational heterogeneity between particles in this region of TM4, though we were not able to classify discrete conformations.
The conformational changes in TM4 are centered around an internal proton sensor at K245 and primarily involve residues 243-246 (Fig. 3). At pH 8.5, TM4 is helical with K245 positioned on its top face. The rotameric position of K245 is sterically restricted by F241, W244, and F249 and projects upward towards the hydrophobic bottom face of TM2 from the neighboring protomer around P124 (Fig. 3b,d, Extended Data Fig. 6e). In this position, K245 forms part of the wall of the channel cavity with its methylenes facing the lipid bilayer. The K245 ε-amino group is likely deprotonated in this conformation, indicating a reduced pKa relative to a fully solvent exposed lysine as a consequence of its hydrophobic environment. Similar pKa shifts have been measured in model systems containing buried lysine residues24. At pH 6.5, the TM4 helix is broken and kinked at W244 such that the side chain of K245 rotates ~90° towards the conduction axis (Fig. 3c-f, Extended Data Fig. 6d). In this conformation, K245 projects towards N243 of the diagonally opposed subunit to form a cytoplasmic seal (Fig. 3c). In both conformations, K245 is partially exposed to the internal solution and poised to respond to pH changes in the cytoplasm to gate the channel (Fig. 3b,c, Extended Data Fig. 6d,e).
Figure 3 – A TASK2 intracellular gate controlled by pHint.

(a) Overlay of closed and open conformations of TASK2 viewed from the membrane plane highlighting conformational changes in the cytoplasmic end of TM4. (b,c) Surface representation of the region boxed in (a) viewed from the cytoplasmic side for (b) open and (c) closed channels. Residues involved in gating and the positive charge on K245 at low pH are indicated. (d-f) View from the membrane plane of one TM4 and intracellular gating residues from (d) open, (e) closed, and (f) and both structures overlaid. In (d) and (e), a dashed line is drawn at the center of the K+ conduction axis for reference. (g) Normalized fold-activation of current by alkaline pHint (pHint=9/pHint=7 at 0 mV) for wildtype TASK2 (1.95±0.11) and mutants K245A (1.03±0.04), N243A (1.32±0.08), N243R (1.67±0.16), W244A (1.53±0.13), and N243K/K245N (1.11±0.07). Mean ± s.e.m. are reported and plotted for n=7, 3, 9, 4, 5, 6 cells from 4, 2, 5, 3, 2, and 2 independent transfections, respectively. Differences were assessed with a one-way ANOVA with Dunnett correction for multiple comparisons. P<0.0001(****) for K245A and N243K/K245N. P=0.0002(***), 0.04(*), and 0.34 (n.s., not significant) for N243A, W244A, and N243R, respectively.
We evaluated the pH sensitivity of TASK2 mutants to test the structural model for gating by pHint (Fig. 3g). Wild-type TASK2 is activated ~2-fold by a shift in pHint from 7 to 9. Consistent with previous reports and its role as a proton sensor16, K245A eliminates pHint sensitivity (Fig. 3g). We reasoned that the size of the N243 side chain was most important for sealing the cavity with K245. Indeed, a smaller side chain in N243A impairs pHint activation (by ~70%), while a larger side chain in N243R has no significant effect despite its positive charge (Fig. 3g). W244A results in a more subtle loss of pHint activation (by ~47%), which is likely due to increased flexibility of TM4 upon loss of anchoring interactions between W244 and TM3 (Fig. 3b,c Extended Data Fig. 6d,e). While K245 is able to rotate from a hydrophobic pocket at high pH towards the conduction axis at low pH, N243 remains relatively stationary in closed and open structures (Fig. 3f). We reasoned that pHint activation should therefore be sensitive to the unique position of the K245 sensor. Consistently, a simple swap of these two residues in the double mutant N243K/K245N does not rescue pHint activation (Fig. 3g). We conclude movement of opposed K245 residues and proximal helical regions upon protonation forms a protein seal between TM4s to gate the channel closed in response to intracellular acidification.
A second gate was identified on the extracellular face of the TASK2 selectivity filter. At pH 8.5, the filter adopts a canonical approximate four-fold symmetric conformation with strong density corresponding to four K+ ions in the filter (sites S1-S4) and one above the pore (S0) (Fig. 4a-e). At pH 6.5, the selectivity filter is dramatically rearranged, resulting in a loss of the symmetric K+-coordination environment, expansion of the S1 site by 0.6 Å, and a constriction of the S0 site by 1.9 Å (Figs. 4b-d, 2c). Such a rearrangement in the chemical and geometrical aspects of the K+ coordination environment would be expected to alter ion dehydration and binding at these sites. Indeed, comparison of the maps shows a clear loss of density for bound K+ around S0 and S1 at low pH (Fig. 4e,f).
Figure 4 – A TASK2 selectivity filter gate controlled by pHext.

(a) Overlay of closed and open conformations of TASK2 viewed from the membrane plane highlighting conformational changes in the extracellular side of the selectivity filter. (b) View of the region boxed in (a). Residues involved in gating and the positive charge on R224 at low pH are indicated. (c,d) Inter-carbonyl distances at K+-binding sites (c) S0 and (d) S1 in open and closed structures viewed from the extracellular side. (e,f) Comparison of ion occupancy in the selectivity filter of cryo-EM maps from (e) open TASK2 and (f) closed TASK2. (g) Normalized fold-activation of current by alkaline pHext (pHext=9/pHext=7 at 0 mV) for wild-type TASK2 (3.43±0.28 (n=6)) and mutants R224A (1.02±0.07 (n=3)), V104A (2.78±0.51 (n=5)), N87A (1.60±0.27 (n=5)), N87S (1.24±0.12 (n=4)), N82A (1.11±0.08 (n=3)), E228A (1.48±0.07 (n=6)), and K245 (2.56±0.28 (n=5)). Mean ± s.e.m. are reported and plotted for n=6, 3, 5, 5, 4, 3, 6, and 5 cells from 3, 1, 2, 2, 2, 1, 2, and 2 independent transfections, respectively. Differences were assessed with a one-way ANOVA with Dunnett correction for multiple comparisons. P<0.0001(****) for N82A, N87S, R224A, and E228A. P=0.0002(***), 0.14, and 0.39 (n.s., not significant) for N87A, K245A, and V104A, respectively.
The conformational changes are asymmetric; pseudo four-fold symmetry in the open channel becomes approximate two-fold symmetry in the closed state. At S1, Y101 of SF1 and F206 of SF2 move away from the conduction axis by an average of 1.0 Å and 0.9 Å, respectively (Fig. 4d, Extended Data Fig. 7a-f). This increases distances between diagonally opposed carbonyls in the filter: from 4.4 Å and 4.5 Å in the open channel to 4.5 Å and 5.6 Å in the closed channel between SF1s and SF2s (Fig. 4d). At S0, G102 of SF1 moves towards the conduction axis by an average of 1.7 Å and G207 of SF2 moves away by an average of 0.9 Å (Fig. 4b, Extended Data Fig. 7a-f). This markedly decreases the distance between diagonally opposed carbonyls in SF1s, from 8.9 Å in the open channel to 5.8 Å in the closed channel, and increases the distance between diagonally opposed carbonyls at SF2, from 9.7 Å in the open channel to 11.2 Å in the closed channel (Fig. 4c).
How do extracellular protons result in conformational changes at the selectivity filter that render the channel nonconductive? At pH 8.5, the proton sensor R224 rests above TM4 with its side chain directed towards the extracellular solution (Fig. 4b). Protonation of R224 results in its movement down towards the membrane approximately 2 Å closer to the largely buried E228 on TM4. Long-range electrostatic interactions between R224 and E228 in the relatively low dielectric environment may stabilize this movement of R224 (Fig. 4b). The cap-PH1 linker undergoes a series of coordinated rearrangements; the side chain of N87 moves towards the membrane with R224 and rotation of the peptide backbone between F80 and W83 repositions N82 between R224 and V104 at the top of SF1 (Fig. 4b). Wedging N82 into this position displaces SF1 and the subsequent linker to TM2 (from G102 to A105) towards SF2 (Fig. 4b). This results in movement of carbonyls at Y101 and G102 in SF1 and, to accommodate this shift, F206 in SF2. The consequence is disruption of the K+ coordination environment at S0 and S1 to disfavor ion binding and conduction (Fig. 4b-f).
We evaluated the pH sensitivity of TASK2 mutants to test the structural model for gating by pHext (Fig. 4g). Wild-type TASK2 is activated ~3.4-fold by a shift in pHext from 7.0 to 9.0 (Fig. 4g). Consistent with previous reports and its role as a proton sensor16,17, R224A mutation eliminates pHext activation (Fig. 4g). As predicted from the structure, mutation of V104A does not significantly reduce activation (Fig. 4g): in spite of a smaller side chain at V104A, N82 movement would still require displacement of SF1. In contrast, mutation of both key asparagines significantly compromises pHext activation: N87A, N87S, and N82A reduce activation by an average of 75%, 91%, and 95%, respectively (Fig. 4g). Consistent with a role for E228 in stabilizing a protonated R224, elimination of the negative charge in an E228A mutation reduces activation by 80%. We conclude that movement of R224 upon protonation is relayed through N87 and N82 to displace SF1 and disrupt K+ coordination at S1 and S0 to gate the channel closed in response to extracellular acidification.
Our data support a model for TASK2 regulation through two gates controlled by intracellular and extracellular pH (Fig. 5). Mutation of the intracellular proton sensor K245A does not significantly change pHext activation (Fig. 4g), consistent with previous reports and supporting the notion of independent function of the two gates16, though further work is needed to show this definitively.
Figure 5 – Structural model for pH gating of the TASK2 channel.

At high pH, TASK2 is conductive. An unobstructed path for K+ exists from the cytoplasmic to extracellular solution through the channel cavity and selectivity filter with four internal and one extracellular K+ coordination sites. At low pH, TASK2 is nonconductive. Protonation of K245 and conformational changes in TM4 create a protein seal at the inner gate. Protonation of R224 and conformational changes relayed to the K+ sites S0 and S1 sites disfavor K+ coordination at the selectivity filter gate.
Both gates are unique among known channel structures. The intracellular gate is formed at a position similar to the canonical inner-helix bundle crossing in four-fold symmetric K+ channels like KcsA or Kvs25,26, but is formed by different molecular rearrangements. Instead of association of four inner helices, intracellular gating of TASK2 involves juxtaposition of two diagonally opposed TM4s (Figs. 3b,c, Extended Data Fig. 8a-f). Interestingly, the K2P TASK1 (which belongs to a different K2P clade from TASK2 (Supplementary Fig. 1)) has an inner gate at the membrane-cytoplasm interface, but it is formed differently through crossover of TM4s and hydrophobic packing (Extended Data Fig. 8e,g)42. This difference in inner gating, and the fact that TASK1 lacks a proton sensor analogous to the conserved K245 in TASK2 (Supplementary Figs. 1,2) provides a mechanistic explanation for the independence of TASK1 on pHint.
While functional evidence of selectivity filter gating in many K+ channels, including K2Ps, has been long documented1,16,43-47, its structural basis is controversial. Structural evidence exists for two modes of filter inactivation: loss of S1 due to constriction of coordinating carbonyls (from an inactivation-enhancing point mutant in Kv1.2-2.1) and loss of S2 and S3 due to filter backbone rotation (from an inactivation-enhancing point mutant in KcsA) (Extended Data Fig. 7g-n)27,28. A recently posted report describing structures of the K2P TREK1 in low [K+] suggests a third mode involving loss of S1 and S241. We demonstrate TASK2 utilizes a new mode of filter gating in response to physiological stimuli: asymmetric disruption of S0 by constriction and S1 by dilation of coordinating carbonyls and displacement of the selectivity filter. It is likely still other filter rearrangements have arisen in other K+ channels. TASK1 activation by extracellular alkalization is thought to occur through the selectivity filter2, but its proton sensor is in a different position (a histidine in SF1 at the position of N103 in TASK2) and it lacks residues for the conformational relay (R224, E228, and N87) that are strictly conserved in TASK2 across species (Supplementary Figs. 1,2).
K2P channels are regulated by a diverse array of chemical and physical cues through correspondingly diverse mechanisms2. Gating open the mechanosensitive K2Ps TRAAK, TREK1, and TREK2 involves movement of TM4 “up” towards the extracellular side, sealing membrane-facing openings and preventing lipid access to the cavity that can block conduction (Extended Data Fig. 6g-i)18,29. Mechanosensation results because movement of TM4 up expands the cross-sectional area of the channel and increasing membrane tension energetically favors expansion. Notably, TASK2 at low pH has wide membrane-facing lateral openings between TM2 and TM4 (Extended Data Fig. 6d,e,i). Lipid-like density is observed in these openings projecting towards the channel cavity, but it is insufficiently resolved to model. TASK2 opening at high pH seals the lateral membrane openings primarily through repositioning of K245. Unlike movement of TM4 up in TRAAK and TREKs, this does not expand the cross-sectional area of TASK2 (Extended Data Fig. 6f). This offers a physical explanation for insensitivity of TASK2 to mechanical force: without an area increase upon opening, there is no energetic drive for tension to promote opening. Restriction of TM4 movement might similarly preclude mechanical activation in other K2Ps18.
Methods
Cloning, expression, and purification
Cloning, expression, and purification were performed similarly to that described for the K2P channel TRAAK30. A gene encoding Mus musculus TASK2 (Uniprot Q9JK62) was codon-optimized for expression in Pichia pastoris, synthesized (Genewiz, Inc), and cloned into a modified pPICZ-B vector (Life Technologies Inc). The resulting construct encoded a human rhinovirus 3C protease-cleavable C-terminal EGFP-10x histidine fusion protein. A truncation of the C-terminal 167 amino acids, which are predicted to be largely unstructured, was found to improve protein expression and biochemical stability. The resulting construct, TASK2(aa1-335)-SNS-LEVLFQ/GP-(EGFP)-HHHHHHHHHH was used for structural studies and is referred to as TASK2 in the text for simplicity.
Pme1 linearized pPICZ-B plasmid was transformed into Pichia pastoris strain SMD1163 by electroporation and transformants were selected on YPDS plates with 0.5 mg/mL zeocin. Expression levels of individual transformants were analyzed by FSEC. Large-scale expression from a suitable transformant was performed in MiniFors 2 3-liter fermenter. Overnight cultures of cells in YPD + 0.5 mg/mL Zeocin were added to minimal media to a starting OD600 ~1 and grown at 30°C with glycerol feeding for 48 hours at 40% O2 saturation and pH 5.0 maintained with variable stir speed, air/O2 gas mixture, gas flow rate, and NH4OH addition. Cells were then starved to deplete glycerol, temperature was reduced to 27°C, and protein expression was induced by a gradually increasing methanol feed rate. Expression continued for ~48-60 hours.
Cells were pelleted, flash-frozen in liquid nitrogen, and stored at −80°C. 30g of cells were broken by milling (Retsch model MM301) for 5 cycles of 3 minutes at 25 Hz. All subsequent purification steps were carried out at 4°C. Cell powder was added to 100 mL lysis buffer containing 50 mM Tris pH 8.5 (unless otherwise noted, pH values for Tris buffers correspond to values at 4°C) , 150 mM KCl, 1 mM phenylmethysulfonyl fluoride, 1 mM EDTA, 10ul Benzonase Nuclease (EMD Milipore), 1 mM E64, 1 mg/ml Pepstatin A, 10 mg/ml Soy Trypsin Inhibitor, 1 mM Benzimidine, 1 mg/ml Aprotinin, 1 mg/ml Leupeptin. The solution was sonicated and centrifuged at 150,000 x g for 45 minutes. The supernatant was discarded and the membrane pellet was transferred into a dounce homogenizer containing extraction Buffer (50 mM Tris pH 8.5, 150 mM KCl, 1mM phenylmethysulfonyl fluoride, 1 mM EDTA, 10 μl Benzonase Nuclease (EMD milipore), 1 μM AEBSF, 1 mM E64, 1mg/ml Pepstatin A, 10 mg/ml Soy Trypsin Inhibitor, 1 mM Benzimidine, 1 mg/ml Aprotinin, 1 mg/ml Leupeptin, 1% n-Dodecyl-b-D-Maltopyranoside (DDM, Anatrace, Maumee, OH), 0.2% Cholesterol Hemisuccinate Tris Salt (CHS, Anatrace)). Membrane pellets were homogenized in 100 mL buffer and then gently stirred at 4°C for 2 hours. The extraction was centrifuged at 33,000 x g for 45 minutes. 5 ml Sepharose resin coupled to anti-GFP nanobody was added to the supernatant and stirred gently for 2 hours at 4°C. The resin was collected in a column and washed with 50 mL Buffer 1 (20 mM Tris, 150 mM KCl, 1 mM EDTA, 1% DDM, 0.2% CHS, pH 8.5), 150 mL Buffer 2 (20 mM Tris, 300 mM KCl, 1 mM EDTA, 1% DDM, 0.2% CHS, pH 8.5), and 20 mL of Buffer 1. PPX (~0.5 mg) was added into the washed resin in 5 mL Buffer 1 and rocked gently overnight. Cleaved TASK2 was eluted and concentrated to ~0.4 mL with an Amicon Ultra spin concentrator (50 kDa cutoff, MilliporeSigma, USA). The concentrated protein was subjected to size exclusion chromatography using a Superdex 200 Increase 10/300 column (GE Healthcare, Chicago, IL) run in Buffer 3 (20 mM Tris pH 8.5, 150 mM KCl, 1 mM EDTA, 1% DDM, 0.01% CHS) on a NGC system (Bio-Rad, Hercules, CA) with ChromLab 6. The peak fractions were collected and spin concentrated for reconstitution.
Nanodisc assembly
Freshly purified TASK2 was reconstituted into MSP1D1 nanodiscs with a 2:1:1 DOPE:POPS:POPC lipid mixture (mol:mol, Avanti, Alabaster, Alabama) at a final molar ratio of TASK2:MSP1D1:lipid of 1:5:250. Lipids in chloroform were mixed, dried under argon, washed with pentane, dried under argon, and dried under vacuum overnight in the dark. Dried lipids were rehydrated in buffer containing 20 mM Tris, 150 mM KCl, 1 mM EDTA, pH 8.5 and clarified by bath sonication. DDM was added to a final concentration of 8 mM. TASK2 was mixed with lipids and incubated at 4°C for 30 minutes before addition MSP1D1 protein. After incubation for 10 minutes at 4°C, 100 mg of Biobeads SM2 (Bio-Rad, USA) (prepared by sequential washing in methanol, water, and Buffer 4 and weighed damp following bulk liquid removal) was added and the mixture was rotated at 4°C overnight. The sample was spun down to facilitate removal of solution from the Biobeads and the reconstituted channel was further purified on a Superdex 200 increase column run in 20 mM Tris pH 8.5, 150 mM KCl, and 1 mM EDTA (high pH) or 20 mM potassium phosphate pH 6.5, 150 mM KCl, and 1 mM EDTA (low pH). The peak fractions were collected and spin concentrated (50 kDa MWCO) to 1.0-1.2 mg/ml for grid preparation.
Grid preparation
The TASK2-nanodisc sample was centrifuged at 21,000 x g for 10 min at 4°C. A 3 μL sample was applied to holey carbon, 300 mesh R1.2/1.3 gold grids (Quantifoil, Großlöbichau, Germany) that were freshly glow discharged for 30 seconds. Sample was incubated for 5 seconds at 4°C and 100% humidity prior to blotting with Whatman #1 filter paper for 3-3.5 seconds at blot force 1 and plunge-freezing in liquid ethane cooled by liquid nitrogen using a FEI Mark IV Vitrobot (FEI / Thermo Scientific, USA).
Cryo-EM data acquisition
Grids were clipped and transferred to a FEI Talos Arctica electron microscope operated at 200 kV. Fifty frame movies were recorded on a Gatan K3 Summit direct electron detector in super-resolution counting mode with pixel size of 0.5685 Å. The electron dose was 9.170 e− Å2 s−1 and 8.974 e− Å2 s− and total dose was 50.4625 e− Å2 and 50.325 e− Å2 in pH 8.5 and pH 6.5 datasets, respectively. Nine movies were collected around a central hole position with image shift and defocus was varied from −0.8 to −2.0 μm through SerialEM 3.631. See Table 1 for data collection statistics.
Cryo-EM data processing
For TASK2 in nanodiscs at pH 8.5, 3470 micrographs were corrected for beam-induced drift using MotionCor232,33 in Relion 3.0 and Reline 3.1-beta34 and the data was binned to 1.137 A/pixel. The contrast transfer function (CTF) parameters for each micrograph were determined using CTFFIND-4.135. For particle picking, 1000 particles were picked manually and subjected to reference-free 2D classification in RELION 3.0 to generate reference for autopicking. After initial cleanup through rounds of 2D classification in Relion 3.0 or Relion 3.1-beta, the remaining particles were extracted and imported into Cryosparc36. After additional 2D classification in Cryosparc, the particles that had clearly defined and recognizable features were combined for further analysis. CryoSPARC was used to generate an ab initio model with 2 classes and 0 similarity with or without symmetry. Particles belonging to a class with well-defined features were further refined using Heterogeneous refinement and Non-uniform (NU) refinement.
Particle positions and angles from the final cryoSPARC2 refinement job were input into Relion 3.0 or Relion 3.1 beta (using csparc2relion.py from the UCSF PyEM) and 3D refined to generate a 3.92 Å map with C2 symmetry (6 Å low-pass filter, 0.9 degrees initial sampling, 0.9 degrees local searches). Further 3D refinement following Bayesian particle polishing improved the map to 3.73 Å. The following CTF refinement with beam tilt group estimation and per-particle defocus was performed, although subsequent 3D refinement did not markedly improve the map. To further improve the resolution, we performed the particle subtraction to remove the contribution of the nanodisc density and subsequent 3D refinement yielded a map at 3.5 Å and used for model building.
For TASK2 in nanodiscs at pH 6.5, 3024 micrographs were collected and the data processing procedure used was similar as above except that Relion 3.1 beta was used instead of Relion3.0 and refinement was performed without symmetry imposed. Bayesian particle polishing, CTF refinement, and particle subtraction yielded a final map at 3.5 Å.
Modeling and refinement
Cryo-EM maps were sharpened using Phenix.autosharpen37 and LocalDeblur38 and were of sufficient quality for de novo model building in Coot. Final refinement The real space refinement of the models was carried out using Phenix.real_space_refine with Ramachandran and NCS restraints37 using LocalDeblur maps. Molprobity39 was used to evaluate the stereochemistry and geometry of the structure for manual adjustment in Coot40 and refinement in Phenix. Cavity measurements were made with HOLE implemented in Coot. Figures were prepared using PyMOL, Chimera, and ChimeraX.
Electrophysiology
For electrophysiology, the same construct used for structural work was cloned into a modified pCEH vector for transient transfection. HEK293T cells grown in DMEM-F12 (Gibco) with 10% FBS, 2 mM L-glutamine, 100 units/mL penicillin and 100 μg/mL streptomycin were transfected with FugeneHD according to manufacturer’s instructions. Cells were not authenticated or tested for mycoplasma contamination. Whole-cell recordings were performed at room temperature ~24-48 hours after transfection. Borosilicate glass pipettes were pulled to a resistance of 2-5 MΩ. An Axopatch 200B amplifier connected to a Digidata 1440B digitizer (Molecular Devices) was used for data acquisition with pClamp10. Analog signals were filtered at 1 kHz and sampled at 10 kHz. The following voltage protocol was applied once every 2.7 seconds: Vhold= −80 mV; Vtest= −100 to +100 mV, Δ20 mV, 300 ms. Currents from each patch correspond to mean values during the voltage step to the indicated voltage averaged over three sequential families. We note cells displayed variable rundown in current magnitude over time. For pH titrations, comparisons between conditions were made when current rundown was complete. Fold changes were also assessed between recordings made sequentially in time to mitigate these effects.
For experiments testing the effect of intracellular pH changes on TASK2 current, pipette solution was 82 mM potassium gluconate, 50 mM potassium acetate, 8 mM KCl, 1 mM MgCl2, 10 mM HEPES, 10 mM BAPTA, pH 7.4 adjusted with Tris (at room temperature) and bath solution was sodium gluconate X, sodium acetate Y (where X +Y =135), 4 mM KCl, 2 mM CaCl2, 1 mM MgCl2, 20 mM HEPES, and titrated to pH 7.4 with 1 M Tris base. pHint was changed by varying acetate concentrations according to16:
The extracellular concentration of acetate was varied from 125.59, 39.71, 12.56, 3.97 and 1.26 mM to achieve intracellular pH values 7.0, 7.5, 8.0, 8.5 and 9.0.
For experiments testing the effect of extracellular pH changes on TASK2 current, pipette solution was 8 mM KCl, 132 mM potassium gluconate, 1 mM MgCl2, 10 mM EGTA, 10 mM HEPES, 1 mM Na3ATP, 0.1 mM GTP, pH 7.4 adjusted with 1M KOH and bath solution was 67.5 mM Na2SO4, 4 mM KCl, 1 mM potassium gluconate, 2 mM CaCl2, 1 mM MgCl2, 105 mM sucrose, 10 mM HEPES/Tris, pH 7.5. In order to measure the extracellular pH dependence of the currents, HEPES, was used for pH 7.0, 7.5, and 8.0 and Tris base was used for pH 8.5 and 9.0 (values at room temperature); all experiments keep both intracellular and extracellular chloride at 10 mM.
For experiments testing the effect of PIP2, pipette solution contained 150 mM KCl, 10 mM HEPES, 3 mM MgCl2, 5 mM EGTA, adjusted to pH 7.2 with 1M KOH, and the bath solution contained 15 mM KCl, 135 mM NaCl, 10 mM HEPES, 3 mM MgCl2, 1 mM CaCl2, adjusted to pH 7.3 with 1M NaOH. To test for PIP2 activation, inside out excised patches were perfused with bath solution containing 50 μM diC8 PIP2 (Avanti Polar Lipids, 850185). diC8 PIP2-containing solution was made fresh before each experiment from 1 mM frozen aliquots dissolved in H2O.
Extended Data
Extended Data Figure 1 – Purification and reconstitution of TASK2.

(a-d) Data for assembly of TASK2-nanodisc samples at pH 8.5. (a) Chromatogram from a Superdex 200 gel filtration of TASK2 purified in DDM/CHS. (b) Coomassie-stained SDS-PAGE of pooled TASK2-containing fractions indicated by gray bar in (a). (c) Chromatogram from Superdex 200 gel filtration of TASK2 reconstituted in MSP1D1 lipid nanodiscs. (d) Coomassie-stained SDS-PAGE of final pooled TASK2-MSP1D1 nanodisc sample indicated by gray bar in (c). (e-h) Same as (a-d), but for samples at pH 6.5. Purifications were performed once. Gels were run once. For gel source data, see Supplementary Fig. 3.
Extended Data Figure 2 – pH and PIP2 dependence of TASK2 and pH dependence of TASK2 mutant constructs.
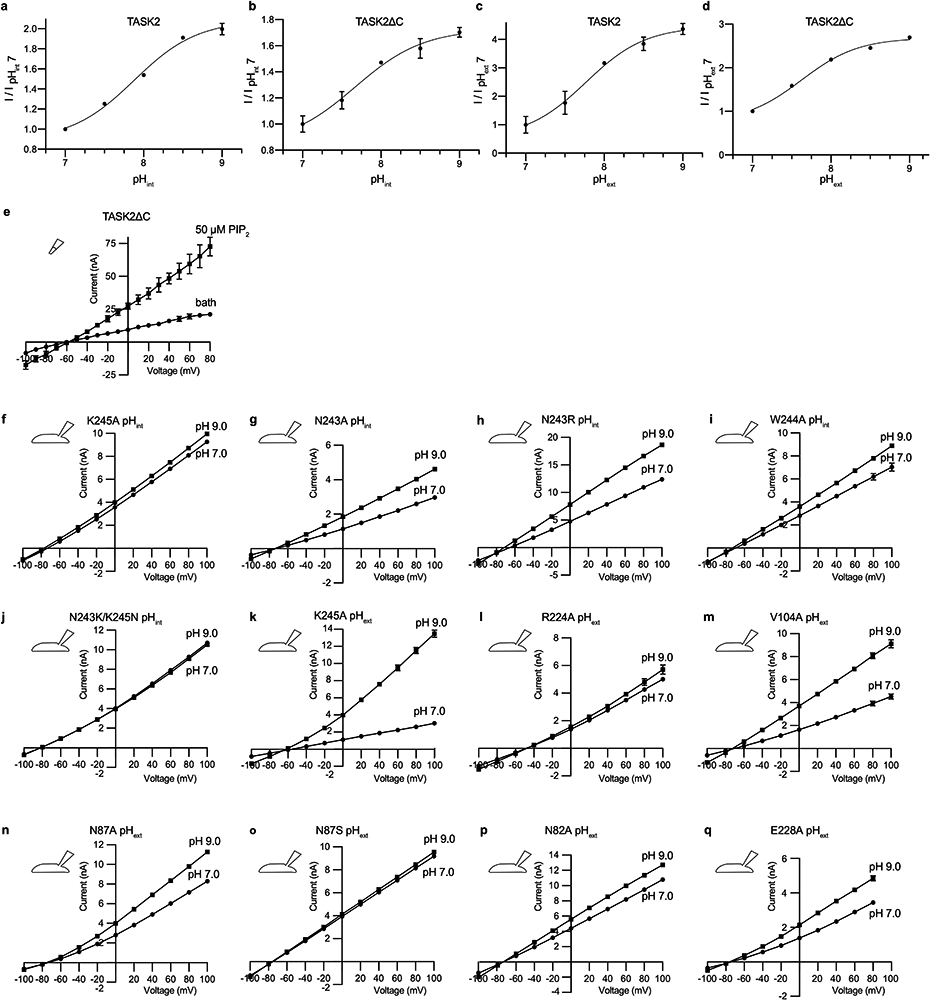
(a,b) pHint and (c,d) pHext dependence from a representative cell expressing (a,c) full length TASK2 and (b,d) the C-terminally truncated TASK2 construct used for structure determination. Normalized fold-activation of current by (a,b) alkaline pHint (pHint =9/pHint =7 at 0 mV) or (c,d) alkaline pHext versus pH is plotted. Mean ± s.e.m. from three sweeps are plotted. Fits to Hill equations are drawn with pK1/2=7.7, 7.9, 7.8, and 7.6 and Hill slope=1.0, 1.1, 1.1, and 1.2 for (a-d), respectively. Plots are shown with different scales. (e) Current-voltage relationships from a representative inside-out patch from a TASK2-expressing cell before (circles) and after (squares) the addition of 50μM C8-PIP2. (f-j) Current-voltage relationships recorded from a representative cell expressing TASK2 mutants K245A, N243A, N243R, W244A, and N243K/K245N with pHint=7 (circles) and pHint=9. (squares). (k-q) Current-voltage relationships recorded from a representative cell expressing TASK2 mutants K245A, R224A, V104A, N87A, N87S, N82A, and E228A with pHext=7 (circles) and pHext=9. (squares). Data in (e-q) are mean currents ± s.e.m. from three consecutive sweeps at the indicated voltage.
Extended Data Figure 3 – Cryo-EM processing pipeline for TASK2 at pH 8.5.

(a) Example micrograph (left) and selected 2D class averages (right) of TASK2 in MSP1D1 lipid nanodiscs at pH 8.5. 2D classification was performed with an extracted box size of 200 pixels. (b) cryo-EM data processing steps in Relion and cryoSPARC2. See Methods for details. Cryo-EM data were collected once. The micrograph in (a) is representative of the 2814 micrographs selected for analysis.
Extended Data Figure 4 – Cryo-EM processing pipeline for TASK2 at pH 6.5.

(a) Example micrograph (left) and selected 2D class averages (right) of TASK2 in MSP1D1 lipid nanodiscs at pH 6.5. 2D classification was performed with an extracted box size of 160 pixels. (b) cryo-EM data processing steps in Relion and cryoSPARC2. See Methods for details. Cryo-EM data were collected once. The micrograph in (a) is representative of the 2683 micrographs selected for analysis.
Extended Data Figure 5 – Cryo-EM validation.

Data for TASK2-nanodisc samples at (a-d) pH 8.5 and (e-h) pH 6.5. (a,e) Angular distribution of particles used in final refinement with final map for reference. (b,f) Local resolution estimated in Relion colored as indicated on the final map. TM4s are indicated in a view from the cytoplasm. (c,g) Fourier Shell Correlation (FSC) relationships between (black) the two unfiltered half-maps from refinement and used for calculating overall resolution at 0.143, (teal) final map versus model, (pink) half-map one versus model, and (orange) half-map two versus model. (d,h) Cryo-EM density carved around TM4A and TM4B with the position of K245 indicated.
Extended Data Figure 6 – Extracellular ion pathways and lateral membrane openings in TASK2.

(a,b) Structures of TASK2 determined at (a) pH 8.5 and (b) pH 6.5. The surface of a bifurcated extracellular pathway from the top of the selectivity filter underneath the helical cap to the extracellular solution on either side is shown in gray. (c) Radius of the extracellular pathway as a function of distance from the conduction axis. The path is similarly accessible to K+ ions in both structures. (d,e) View from the membrane plane of the cytoplasmic sides of TASK2 TM4 and TM2 from (d) low pH (closed) (e) high pH (open) structures. Protein surface is shown half transparent. (f) Change in channel cross sectional area upon opening as a function of membrane depth for TASK2 and TRAAK. TRAAK expands within the membrane upon opening while TASK2 constricts near the membrane-cytoplasm interface. (g,h) View from the membrane plane of the cytoplasmic sides of TRAAK TM4 and TM2 from (g) nonconductive (closed) and (h) conductive (open) structures. (i) Minimum cross-sectional areas of membrane-facing lateral openings in TASK2 closed, and TASK2 open, TRAAK closed, and TRAAK open structures. Cross-sectional areas for each structure correspond to the narrowest 1 Å segment of a path connecting the channel cavity and membrane bilayer calculated using a spherical probe. The cross-sectional area of a lipid acyl chain methylene is drawn with a dashed line for comparison. An acyl chain could access the cavity of TASK2 and TRAAK channels in closed, but not open, conformations.
Extended Data Figure 7 – Comparison of selectivity filters and selectivity filter gates in TASK2 and other K+ channels.

(a-n) Two opposing selectivity filter regions and positions of bound K+ ions from structures of the channels indicated: (a) open TASK2 SF1, (b) closed TASK2 SF1, (c) overlaid open and closed TASK2 SF1s, (d) open TASK2 SF2, (e) closed TASK2 SF2, (f) overlaid open and closed TASK2 SF2s, (g) open Kv1.1-2.1, (h) inactivated Kv1.1-2.1 mutant V406W, (i) overlaid open and inactivated Kv1.1-2.1 mutant V406W, (j) overlaid inactivated Kv1.1-2.1 and closed TASK2 SF1, (k) open KcsA, (l) low K+ inactivated KcsA, (m) overlaid open and inactivated KcsA, and (n) overlaid inactivated KcsA and closed TASK2 SF1.
Extended Data Figure 8 – Comparison of inner gates in TASK2 and other K+ channels.

(a-g) Stereo views from the membrane plane highlighting inner gate regions of selected K+ channels: (a) open MthK, (b) closed KcsA, (c) open TASK2, (d) closed TASK2, and (e) closed TASK1. (f) An overlay of the TASK2 open and closed structures with the canonical “bundle crossing” inner gating channels KcsA and MthK, colored as in (a-d). (g) An overlay of the TASK2 open and closed structures with TASK1, with a distinct inner “X” gate, colored as in (c-e).
Extended Data Table 1 –
Cryo-EM data collection, refinement and validation statistics
| TASK2 pH 6.5 EMDB 21843 PDB 6WLV EMPIAR 10423 |
TASK2 pH 8.5 EMDB 21846 PDB 6WM0 EMPIAR 10422 |
|
|---|---|---|
| Data collection and processing | ||
| Magnification | 36,000 | 36,000 |
| Voltage (kV) | 200 | 200 |
| Electron exposure (e–/Å2) | 50.325 | 50.4625 |
| Defocus range (μm) | −0.8 to −2.0 | −0.8 to −2.0 |
| Pixel size (Å) | 1.137 | 1.137 |
| Symmetry imposed | ||
| Initial particle images (no.) | 3,563,337 | 3,806,879 |
| Final particle images (no.) | 255,808 | 78,594 |
| Map resolution (Å) | 3.5 | 3.5 |
| FSC threshold | 0.143 | 0.143 |
| Refinement | ||
| Model resolution (Å) | 3.2 | 3.5 |
| FSC threshold | 0.143 | 0.143 |
| Map sharpening B factor (Å2) | −151.61 | −86.73 |
| Model composition | ||
| Non-hydrogen atoms | 4111 | 4105 |
| Protein residues | 512 | 510 |
| Ligands | 3 | 5 |
| B factors (Å2) | ||
| Protein | 73.91 | 55.33 |
| Ligand | 36.25 | 22.18 |
| R.m.s. deviations | ||
| Bond lengths (Å) | 0.004 | 0.003 |
| Bond angles (°) | 0.549 | 0.577 |
| Validation | ||
| MolProbity score | 1.82 | 1.48 |
| Clashscore | 9.21 | 6.67 |
| Poor rotamers (%) | 0 | 0 |
| Ramachandran plot | ||
| Favored (%) | 95.28 | 97.43 |
| Allowed (%) | 4.72 | 2.57 |
| Disallowed (%) | 0 | 0 |
Supplementary Material
Acknowledgements
We thank Dr. Jonathan Remis, Dr. Dan Toso, and Paul Tobias at UC Berkeley for assistance with microscope setup and data collection, Dr. Zhu Fu and Nora Kostow for help with initial cloning and screening, and members of the Brohawn lab for feedback on the manuscript. SGB is a New York Stem Cell Foundation-Robertson Neuroscience Investigator. This work was supported by the New York Stem Cell Foundation, NIGMS grant DP2GM123496, a McKnight Foundation Scholar Award, a Klingenstein-Simons Foundation Fellowship Award, and a Sloan Research Fellowship to SGB.
Footnotes
Competing Interests
The authors declare no competing interests.
Data availability
TASK2 protein sequence is available from Uniprot accession Q9JK62. The final maps of TASK2 in MSP1D1 nanodiscs at pH 8.5 and 6.5 have been deposited to the Electron Microscopy Data Bank under accession codes 21846 and 21843. Atomic coordinates have been deposited in the PDB under IDs 6WM0 and 6WLV. Original micrograph movies have been deposited to EMPIAR under accession codes EMPIAR-10422 and EMPIAR-10423.
References
- 1.Reyes R et al. Cloning and expression of a novel pH-sensitive two pore domain K+ channel from human kidney. J Biol Chem 273, 30863–30869 (1998). [DOI] [PubMed] [Google Scholar]
- 2.Enyedi P & Czirják G Molecular background of leak K+ currents: two-pore domain potassium channels. Physiol Rev 90, 559–605 (2010). [DOI] [PubMed] [Google Scholar]
- 3.Cid LP et al. TASK-2: a K2P K(+) channel with complex regulation and diverse physiological functions. Front Physiol 4, 198 (2013). [DOI] [PMC free article] [PubMed] [Google Scholar]
- 4.Niemeyer MI, Cid LP, Barros LF & Sepúlveda FV Modulation of the two-pore domain acid-sensitive K+ channel TASK-2 (KCNK5) by changes in cell volume. J Biol Chem 276, 43166–43174 (2001). [DOI] [PubMed] [Google Scholar]
- 5.Warth R et al. Proximal renal tubular acidosis in TASK2 K+ channel-deficient mice reveals a mechanism for stabilizing bicarbonate transport. Proc Natl Acad Sci USA 101, 8215–8220 (2004). [DOI] [PMC free article] [PubMed] [Google Scholar]
- 6.Wang S et al. TASK-2 channels contribute to pH sensitivity of retrotrapezoid nucleus chemoreceptor neurons. Journal of Neuroscience 33, 16033–16044 (2013). [DOI] [PMC free article] [PubMed] [Google Scholar]
- 7.Bayliss DA, Barhanin J, Gestreau C & Guyenet PG The role of pH-sensitive TASK channels in central respiratory chemoreception. Pflugers Arch 467, 917–929 (2014). [DOI] [PMC free article] [PubMed] [Google Scholar]
- 8.Julio-Kalajzić F et al. K2P TASK-2 and KCNQ1-KCNE3 K+ channels are major players contributing to intestinal anion and fluid secretion. J Physiol (Lond) 596, 393–407 (2018). [DOI] [PMC free article] [PubMed] [Google Scholar]
- 9.Clark RB, Kondo C, Belke DD & Giles WR Two-pore domain K+ channels regulate membrane potential of isolated human articular chondrocytes. J Physiol (Lond) 589, 5071–5089 (2011). [DOI] [PMC free article] [PubMed] [Google Scholar]
- 10.Alvarez-Baron CP, Jonsson P, Thomas C, Dryer SE & Williams C The two-pore domain potassium channel KCNK5: induction by estrogen receptor alpha and role in proliferation of breast cancer cells. Mol. Endocrinol 25, 1326–1336 (2011). [DOI] [PMC free article] [PubMed] [Google Scholar]
- 11.Reed AP, Bucci G, Abd-Wahab F & Tucker SJ Dominant-Negative Effect of a Missense Variant in the TASK-2 (KCNK5) K+ Channel Associated with Balkan Endemic Nephropathy. PLoS ONE 11, e0156456 (2016). [DOI] [PMC free article] [PubMed] [Google Scholar]
- 12.López-Cayuqueo KI, Peña-Münzenmayer G, Niemeyer MI, Sepúlveda FV & Cid LP TASK-2 K2p K+ channel: thoughts about gating and its fitness to physiological function. Pflugers Arch 467, 1043–1053 (2015). [DOI] [PubMed] [Google Scholar]
- 13.Guyenet PG et al. The Retrotrapezoid Nucleus: Central Chemoreceptor and Regulator of Breathing Automaticity. Trends Neurosci 42, 807–824 (2019). [DOI] [PMC free article] [PubMed] [Google Scholar]
- 14.Gestreau C et al. Task2 potassium channels set central respiratory CO2 and O2 sensitivity. Proc Natl Acad Sci USA 107, 2325–2330 (2010). [DOI] [PMC free article] [PubMed] [Google Scholar]
- 15.Kang D & Kim D Single-channel properties and pH sensitivity of two-pore domain K+ channels of the TALK family. Biochem Biophys Res Commun 315, 836–844 (2004). [DOI] [PubMed] [Google Scholar]
- 16.Niemeyer MI, Cid LP, Peña-Münzenmayer G & Sepúlveda FV Separate gating mechanisms mediate the regulation of K2P potassium channel TASK-2 by intra- and extracellular pH. Journal of Biological Chemistry 285, 16467–16475 (2010). [DOI] [PMC free article] [PubMed] [Google Scholar]
- 17.Niemeyer MI et al. Neutralization of a single arginine residue gates open a two-pore domain, alkali-activated K+ channel. Proc Natl Acad Sci USA 104, 666–671 (2007). [DOI] [PMC free article] [PubMed] [Google Scholar]
- 18.Brohawn SG, Campbell EB & MacKinnon R Physical mechanism for gating and mechanosensitivity of the human TRAAK K+ channel. Nature 516, 126–130 (2014). [DOI] [PMC free article] [PubMed] [Google Scholar]
- 19.Miller AN & Long SB Crystal Structure of the Human Two–Pore Domain Potassium Channel K2P1. Science 335, 432–436 (2012). [DOI] [PubMed] [Google Scholar]
- 20.Lolicato M et al. K2P2.1 (TREK-1)-activator complexes reveal a cryptic selectivity filter binding site. Nature 547, 364–368 (2017). [DOI] [PMC free article] [PubMed] [Google Scholar]
- 21.Dong YY et al. K2P channel gating mechanisms revealed by structures of TREK-2 and a complex with Prozac. Science 347, 1256–1259 (2015). [DOI] [PMC free article] [PubMed] [Google Scholar]
- 22.Niemeyer MI, Cid LP, Paulais M, Teulon J & Sepúlveda FV Phosphatidylinositol (4,5)-bisphosphate dynamically regulates the K2P background K+ channel TASK-2. Scientific Reports 7, 45407–14 (2017). [DOI] [PMC free article] [PubMed] [Google Scholar]
- 23.Ritchie TK et al. Chapter 11 - Reconstitution of membrane proteins in phospholipid bilayer nanodiscs. Meth. Enzymol 464, 211–231 (2009). [DOI] [PMC free article] [PubMed] [Google Scholar]
- 24.Isom DG, Castañeda CA, Cannon BR & García-Moreno B Large shifts in pKa values of lysine residues buried inside a protein. Proc Natl Acad Sci USA 108, 5260–5265 (2011). [DOI] [PMC free article] [PubMed] [Google Scholar]
- 25.del Camino D & Yellen G Tight steric closure at the intracellular activation gate of a voltage-gated K(+) channel. Neuron 32, 649–656 (2001). [DOI] [PubMed] [Google Scholar]
- 26.Jiang Y et al. The open pore conformation of potassium channels. Nature 417, 523–526 (2002). [DOI] [PubMed] [Google Scholar]
- 27.Cuello LG, Cortes DM & Perozo E The gating cycle of a K+ channel at atomic resolution. eLife 6, 213 (2017). [DOI] [PMC free article] [PubMed] [Google Scholar]
- 28.Pau V, Zhou Y, Ramu Y, Xu Y & Lu Z Crystal structure of an inactivated mutant mammalian voltage-gated K+ channel. Nat Struct Mol Biol 24, 857–865 (2017). [DOI] [PMC free article] [PubMed] [Google Scholar]
- 29.Brohawn SG How ion channels sense mechanical force: insights from mechanosensitive K2P channels TRAAK, TREK1, and TREK2. Ann. N.Y. Acad. Sci 1352, 20–32 (2015). [DOI] [PubMed] [Google Scholar]
- 30.Brohawn SG et al. The mechanosensitive ion channel TRAAK is localized to the mammalian node of Ranvier. eLife 8, 7898 (2019). [DOI] [PMC free article] [PubMed] [Google Scholar]
- 31.Mastronarde DN Automated electron microscope tomography using robust prediction of specimen movements. J. Struct. Biol 152, 36–51 (2005). [DOI] [PubMed] [Google Scholar]
- 32.Zivanov J, Nakane T & Scheres SHW A Bayesian approach to beam-induced motion correction in cryo-EM single-particle analysis. IUCrJ 6, 5–17 (2019). [DOI] [PMC free article] [PubMed] [Google Scholar]
- 33.Zheng SQ et al. MotionCor2: anisotropic correction of beam-induced motion for improved cryo-electron microscopy. Nat Meth 14, 331–332 (2017). [DOI] [PMC free article] [PubMed] [Google Scholar]
- 34.Zivanov J et al. New tools for automated high-resolution cryo-EM structure determination in RELION-3. eLife 7, 163 (2018). [DOI] [PMC free article] [PubMed] [Google Scholar]
- 35.Rohou A & Grigorieff N CTFFIND4: Fast and accurate defocus estimation from electron micrographs. J. Struct. Biol 192, 216–221 (2015). [DOI] [PMC free article] [PubMed] [Google Scholar]
- 36.Punjani A, Rubinstein JL, Fleet DJ & Brubaker MA cryoSPARC: algorithms for rapid unsupervised cryo-EM structure determination. Nat Meth 14, 290–296 (2017). [DOI] [PubMed] [Google Scholar]
- 37.Afonine PV et al. Real-space refinement in PHENIX for cryo-EM and crystallography. Acta Crystallogr D Struct Biol 74, 531–544 (2018). [DOI] [PMC free article] [PubMed] [Google Scholar]
- 38.Ramírez-Aportela E et al. Automatic local resolution-based sharpening of cryo-EM maps. Bioinformatics 36, 765–772 (2020). [DOI] [PMC free article] [PubMed] [Google Scholar]
- 39.Chen VB et al. MolProbity: all-atom structure validation for macromolecular crystallography. Acta Crystallogr D Biol Crystallogr 66, 12–21 (2010). [DOI] [PMC free article] [PubMed] [Google Scholar]
- 40.Emsley P, Lohkamp B, Scott WG & Cowtan K Features and development of Coot. Acta Crystallogr D Biol Crystallogr 66, 486–501 (2010). [DOI] [PMC free article] [PubMed] [Google Scholar]
- 41.Lolicato M, Natale A, Aberemane-Ali F, bioRxiv DC 2020. K2P channel C-type gating involves asymmetric selectivity filter order-disorder transitions. biorxiv.org doi: 10.1101/2020.03.20.000893 [DOI] [PMC free article] [PubMed] [Google Scholar]
- 42.Rodstrom K et al. A unique lower X-gate in TASK channels traps inhibitors within the vestibule. Nature (2020). 10.1038/s41586-020-2250-8 [DOI] [PubMed] [Google Scholar]
- 43.Piechotta PL et al. The pore structure and gating mechanism of K2P channels. EMBO J 30, 3607–3619 (2011). [DOI] [PMC free article] [PubMed] [Google Scholar]
- 44.Schewe M et al. A Non-canonical Voltage-Sensing Mechanism Controls Gating in K2P K(+) Channels. Cell 164, 937–949 (2016). [DOI] [PMC free article] [PubMed] [Google Scholar]
- 45.Bagriantsev SN, Peyronnet R, Clark KA, Honore E & Minor DL Multiple modalities converge on a common gate to control K2P channel function. The EMBO Journal 30, 3594–3606 (2011). [DOI] [PMC free article] [PubMed] [Google Scholar]
- 46.Hoshi T, Zagotta WN & Aldrich RW Two types of inactivation in Shaker K+ channels: effects of alterations in the carboxy-terminal region. Neuron 7, 547–556 (1991). [DOI] [PubMed] [Google Scholar]
- 47.Cohen A, Ben-Abu Y, Hen S & Zilberberg N A novel mechanism for human K2P2.1 channel gating. Facilitation of C-type gating by protonation of extracellular histidine residues. J Biol Chem 283, 19448–19455 (2008). [DOI] [PubMed] [Google Scholar]
Associated Data
This section collects any data citations, data availability statements, or supplementary materials included in this article.
Supplementary Materials
Data Availability Statement
TASK2 protein sequence is available from Uniprot accession Q9JK62. The final maps of TASK2 in MSP1D1 nanodiscs at pH 8.5 and 6.5 have been deposited to the Electron Microscopy Data Bank under accession codes 21846 and 21843. Atomic coordinates have been deposited in the PDB under IDs 6WM0 and 6WLV. Original micrograph movies have been deposited to EMPIAR under accession codes EMPIAR-10422 and EMPIAR-10423.