

ABSTRACT
The dietary shift from animal protein (AP) to plant protein (PP) sources is encouraged for both environmental and health reasons. For instance, PPs are associated with lower cardiovascular and diabetes risks compared with APs, although the underlying mechanisms mostly remain unknown. Metabolomics is a valuable tool for globally and mechanistically characterizing the impact of AP and PP intake, given its unique ability to provide integrated signatures and specific biomarkers of metabolic effects through a comprehensive snapshot of metabolic status. This scoping review is aimed at gathering and analyzing the available metabolomics data associated with PP- and AP-rich diets, and discusses the metabolic effects underlying these metabolomics signatures and their potential implication for cardiometabolic health. We selected 24 human studies comparing the urine, plasma, or serum metabolomes associated with diets with contrasted AP and PP intakes. Among the 439 metabolites reported in those studies as able to discriminate AP- and PP-rich diets, 46 were considered to provide a robust level of evidence, according to a scoring system, especially amino acids (AAs) and AA-related products. Branched-chain amino acids, aromatic amino acids (AAAs), glutamate, short-chain acylcarnitines, and trimethylamine-N-oxide, which are known to be related to an increased cardiometabolic risk, were associated with AP-rich diets, whereas glycine (rather related to a reduced risk) was associated with PP-rich diets. Tricarboxylic acid (TCA) cycle intermediates and products from gut microbiota AAA degradation were also often reported, but the direction of their associations differed across studies. Overall, AP- and PP-rich diets result in different metabolomics signatures, with several metabolites being plausible candidates to explain some of their differential associations with cardiometabolic risk. Additional studies specifically focusing on protein type, with rigorous intake control, are needed to better characterize the associated metabolic phenotypes and understand how they could mediate differential AP and PP effects on cardiometabolic risk.
Keywords: amino acids, biomarkers, cardiovascular diseases, diabetes, dietary patterns, legumes, meat, metabolites, Mediterranean diet, nutrimetabolomics, vegetable proteins
Statement of Significance: This work is the first review to gather and analyze the available metabolomics data associated with diets with contrasted animal and plant protein intakes in humans and discusses the metabolic effects underlying these metabolomics signatures and their potential implication for cardiometabolic health.
Introduction
The transition towards more plant-based diets is encouraged, with the perspective of moving towards more sustainable diets (1). The shift within protein sources is one key aspect of this transition and dietary guidelines tend to a lower intake of animal protein (AP) sources, more specifically processed and red meat, and a higher intake of plant protein (PP) sources, such as whole grains, legumes, nuts, and seeds, for improving both human (2–5) and planetary (6–9) health. From the standpoint of human health, AP intake has been related to an increased risk of several diseases. For instance, consumption of processed meat has been rated as carcinogenic to humans by the International Agency for Research on Cancer, especially because of its link with colorectal cancer (10), while more recent evidence suggests low certainty and a small effect size (11). AP intake has also been adversely associated with metabolic syndrome–related outcomes (12–18) and with higher risk (and PP with lower risk) or death from type 2 diabetes (T2D) and cardiovascular diseases (CVDs) (19–25). Based on these recent studies and emerging evidence, the present review will specifically focus on the effects of APs and PPs on cardiometabolic health.
The contrasting effects of APs and PPs on cardiometabolic health could be mediated by different factors, such as the “protein package” (i.e., the nutrients and compounds present in protein-rich foodstuff and associated with protein intake) and the overall diet quality associated with AP and PP food-source intake (26–30). The hypothesis that differences in intrinsic amino acid (AA) composition between PPs and APs could contribute to their differential effects on cardiometabolic health has also been proposed (29, 31). Indeed, APs have a higher content in essential AAs such as branched-chain AAs (BCAAs) and aromatic AAs (AAAs), while PPs have a higher content in non-essential AAs such as arginine and glutamate (see Figure 1) (32). Some of these AAs were reported as being strongly associated with cardiometabolic health (33–36).
FIGURE 1.
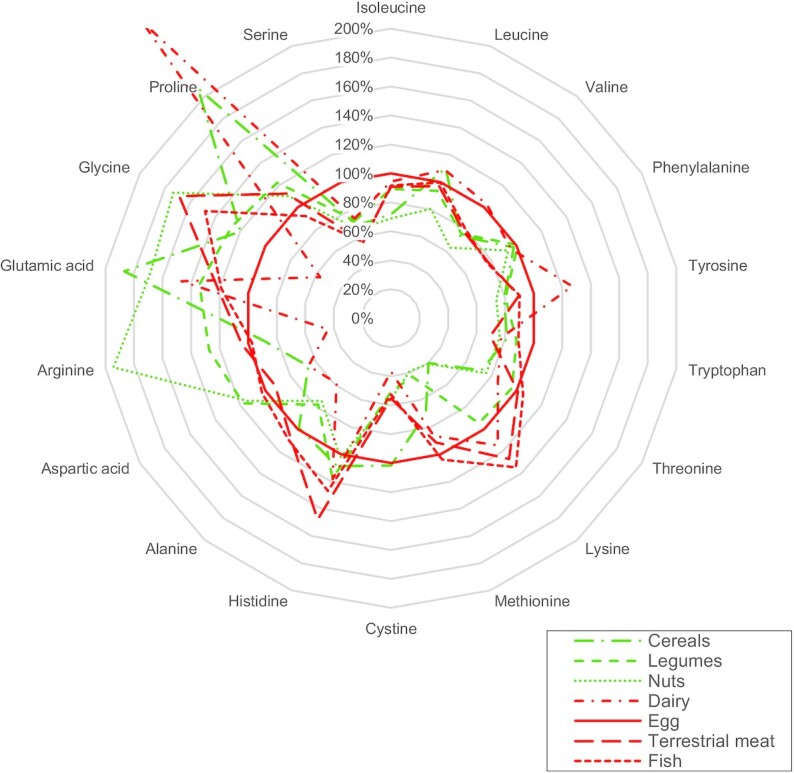
Amino acid compositions of the most common animal protein and plant protein sources, expressed as a percentage of egg amino acid content. Values for each category of protein sources were calculated as the average amino acid content of 3 or 4 common foods within the category as follows, based on the USDA database (32)—cereals: white wheat flour, white rice, corn flour; pulses: red kidney beans, lentils, tofu, chickpeas; nuts: almonds, walnuts, peanuts; dairy: whole milk (cow), plain yogurt (cow), Gruyere cheese; terrestrial meat: beef, pork, chicken; fish: cod, salmon, trout; egg: only the values corresponding to whole hen egg were used. Data are presented as a percentage of egg amino acid content per 100 g total amino acids.
In recent years, metabolomics has developed significantly in the field of nutritional sciences, in which its application is now often referred to as nutrimetabolomics (37). One active orientation in this field is the search for food intake biomarkers (FIBs) (38, 39), which are promising tools to evaluate the exposure to food intake by alleviating the usual caveats of dietary assessment obtained from self-reported questionnaires (40). The nutrimetabolomics research also aims at untangling the physiological effects of dietary patterns, foods, and nutrient consumption through the discovery of effect biomarkers revealing the impact of a specific nutritional effector on a given physiological function (effect biomarkers).
Although several hypotheses have been proposed, the mechanistic bases for the effects of APs and PPs on cardiometabolic health are still widely unknown. A metabolomics-based strategy could therefore point to novel hypotheses leading to better understanding of the molecular processes involved. Interestingly, although the association of AP and PP intake with cardiometabolic health has been extensively discussed (29, 31, 41), only 1 cross-sectional study has specifically investigated the differences in the plasma metabolome associated with AP and PP intake (42), highlighting the gap in knowledge between metabolomics signatures and protein source consumption in the context of cardiometabolic risk. Thus, this review aims at gathering and analyzing the available data on the metabolomics signatures associated with PP and AP intake to better understand their metabolic effects, and more specifically their impact on cardiometabolic health.
Current Status of Knowledge
Studies and metabolites selection using a dedicated scoring system
Given that very few data on the metabolites associated with AP and PP intake are available in preclinical models, we focused our analysis on human studies (both observational and interventional) in which a metabolomics approach was applied to plasma, serum, or urine samples. The evidence strictly specific to AP and PP metabolomics signatures is scarce (42), but there is more evidence available regarding the metabolites associated with broader dietary changes. After an extensive review of the literature, we retained a subset of studies in which we were able to determine that protein type was an important factor differentiating the diets under study (Figure 2).
FIGURE 2.

Description of the methodology applied for study selection and data analysis to identify metabolites associated with diets with contrasted AP and PP intake. AP, animal protein; DASH, Dietary Approaches to Stop Hypertension; HEI, Healthy Eating Index; PP, plant protein.
Overall, 3 types of dietary comparisons were identified. First, the comparison of omnivores with vegetarians and vegans is likely to reflect a strong contrast in AP and PP intakes. For instance, in Western countries, the proportion of APs in total protein intake is ∼70% in omnivores (12, 27, 43–45), against 30% in vegetarians (46–48). Second, although, few quantitative data are available regarding AP and PP intake differences associated with healthy dietary patterns such as the Mediterranean diet (MD), Healthy Eating Index (HEI), or Dietary Approaches to Stop Hypertension (DASH), the metabolites associated with these dietary patterns are likely to be associated with AP or PP intake as those dietary patterns contain a higher plant-based fraction (see Supplemental Table 1 for a detailed description of the dietary pattern adherence scores reported across selected studies). For example, the MD is likely to be associated with a higher PP intake than a typical Western diet as it includes a high consumption of legumes, nuts, and whole grains and a relatively low proportion of AP, corresponding to a moderate consumption of fish, poultry, and dairy foods and a low consumption of red meat products (49). Third, the comparison of metabolites associated with dietary patterns constructed a posteriori by cluster analyses can be of relevance when these patterns are closely related to AP or PP food groups, although the actual AP and PP intake differences might be difficult to quantify.
Overall, 24 references met the above criteria and were considered in this review: 16 observational studies (42, 50–64) and 8 clinical trials (65–72) (Tables 1 and 2). With regard to the analytical approach used, 16 references were MS-based (42, 51, 52, 55–60, 62, 63, 66–68, 71, 72) and 8 were NMR-based (50, 53, 54, 61, 64, 65, 69, 70). Among the 8 clinical trials, 3 compared omnivore with vegetarian diets or meals (65, 70, 72), 2 investigated the effects of the MD (69, 71), and the remaining 3 measured the effects of the New Nordic Diet (NND; rich in typical northern vegetables, whole grains, legumes, and fish) (66–68).
TABLE 1.
Description of the observational studies comparing the metabolites associated with diets with contrasted AP and PP intakes through a metabolomics approach1
| Ref | Type of diets compared (food intake assessment method) | Study design and cohort (country) | Population studied | n | Metabolomics analysis | Biofluid | SC |
|---|---|---|---|---|---|---|---|
| Comparison based on AP and PP intake | |||||||
| (42) | Stratification of subjects by AP and PP intake (FFQ) | Cross-sectional analysis of the baseline of PREDIMED (Prevención con Dieta Mediterránea) study according to protein-type intake (Spain) | Men and women with high CVD risk (T2D or at least 3 cardiovascular risk factors) | 1833 | Untargeted: LC-MS | Plasma | 0.70 |
| Comparison of omnivores, vegetarians, and vegans | |||||||
| (50) | Habitual omnivores | Cross-sectional analysis according to vegetarian status (China) | Healthy men and women | 180 | Untargeted: NMR | Urine | 0.58 |
| Habitual lactovegetarians | |||||||
| Diet followed for at least 5 y (None) | |||||||
| (51) | Omnivores | Cross-sectional analysis of the EPIC (European Prospective Investigation into Cancer and Nutrition)-Oxford cohort according to vegetarian status (UK) | Healthy men only, between 30 and 49 y old | 379 | Targeted: 145 metabolites MS/MS, AbsoluteIDQ p180 kit (BIOCRATES) | Plasma | 0.58 |
| Pesco-vegetarians | |||||||
| Lacto-ovo-vegetarians | |||||||
| Vegans | |||||||
| No criteria on the duration of adherence to the diet (FFQ) | |||||||
| (52) | Omnivores | Cross-sectional analysis according to vegetarian status (China) | Healthy men and women | 36 | Targeted: 132 metabolites, GC-MS | Serum | 0.58 |
| Lacto-ovo-vegetarians | |||||||
| Vegans | |||||||
| Diet followed for at least 6 mo (3-d dietary records) | |||||||
| (53) | Omnivores | Cross-sectional analysis according to vegetarian status (Sweden) | Healthy men and women | 120 | Untargeted: NMR | Serum | 0.58 |
| Pesco-vegetarians | |||||||
| Lacto-ovo-vegetarians | |||||||
| Vegans | |||||||
| No criteria on the duration of adherence to the diet (4-d weighted dietary records) | |||||||
| (54) | Omnivores | Cross-sectional analysis according to vegetarian status (Sweden) | Healthy men and women | 118 | Untargeted: NMR | Urine | 0.58 |
| Pesco-vegetarians | |||||||
| Lacto-ovo-vegetarians | |||||||
| Vegans | |||||||
| No criteria on the duration of adherence to the diet (4-d weighted dietary records) | |||||||
| (64) | Omnivores | Cross-sectional analysis of the EPIC-Oxford cohort according to vegetarian status (UK) | Healthy men only, between 30 and 49 y old | 286 | Targeted: NMR | Serum | 0.58 |
| Pesco-vegetarians | |||||||
| Lacto-ovo-vegetarians | |||||||
| Vegans | |||||||
| No criteria on the duration of adherence to the diet (FFQ) | |||||||
| Comparison based on adherence to defined dietary patterns | |||||||
| (55) | HEI-2010 | Cross-sectional analysis of the Alpha-Tocopherol, Beta-Carotene Cancer Prevention Study according to dietary pattern (Finland) | Healthy men aged between 50 and 69 y and smokers | 1336 | Untargeted: LC-MS | Serum | 0.45 |
| aMD | |||||||
| HDI | |||||||
| Baltic Sea Diet Score (FFQ) | |||||||
| (56) | aMD | Cross-sectional analysis of the Cancer Prevention Study-II Nutrition Cohort according to dietary pattern (USA) | Healthy postmenopausal women | 1367 | Untargeted: LC-MS | Serum | 0.51 |
| aHEI | |||||||
| HEI-2015 | |||||||
| DASH (FFQ) | |||||||
| (57) | MD (FFQ) | Cross-sectional analysis of the Fenland Study according to dietary pattern and cardiovascular disease risk factors (UK) | Healthy men and women | 10,806 | Targeted: 188 metabolites, AbsoluteIDQ p180 kit (BIOCRATES) | Plasma | 0.45 |
| (58) | MD (FFQ) | Cross-sectional analysis according to dietary pattern and longitudinal analysis according to CVD risk | Test cohort: Men and women with high CVD risk (T2D or at least 3 cardiovascular risk factors) | Test cohort: n = 1856 | Untargeted: LC-MS | Plasma | 0.45 |
| Test cohort: PREDIMED study, median follow-up = 4.8 y (Spain) | Validation cohort: Healthy men and women | Validation cohort: n = 6868 | |||||
| Validation cohorts: Nurse Health Study I, median follow-up = 22.3 y; Nurse Health Study II, median follow-up = 15.3 y; Healthy women, Health Professionals Follow-Up Study, median follow-up = 17.6 y (USA) | |||||||
| (59) | aHEI | Cross-sectional analysis of the Framingham Offspring Study according to dietary pattern (USA) | Healthy men and women | 2284 | Targeted: LC-MS | Serum | 0.45 |
| DASH | |||||||
| MD (FFQ) | |||||||
| (60) | HEI-2015 | Cross-sectional analysis of the Atherosclerosis Risk in Communities Study according to dietary pattern (USA) | Healthy men and women | 3862 | Untargeted: LC-MS and GC-MS | Serum | 0.45 |
| aHEI-2010 | |||||||
| DASH | |||||||
| aMD (FFQ) | |||||||
| Comparison of a posteriori (data-driven) dietary patterns | |||||||
| (61) | Comparison of 2 dietary patterns: | Cross-sectional analysis (Ireland) | Healthy men and women | 160 | Untargeted: NMR | Urine | 0.36 |
| - A pattern with more meat products, less vegetables | |||||||
| - A pattern with more vegetables and less meat products (3-d food records) | |||||||
| (62) | Comparison of 2 dietary patterns: | Cross-sectional analysis of the MASALA (Metabolic Syndrome and Atherosclerosis in South Asians Living in America) pilot study (USA) | Healthy men and women | 145 | Targeted: number of metabolites not specified (>60), MS | Serum | 0.33 |
| - “Western/nonvegetarian”: poultry + fish + red meat + coffee + pizza + alcohol | |||||||
| - “vegetarian”: rice + legumes, sweet beverages + snacks (FFQ) | |||||||
| (63) | Comparison of 2 dietary patterns: | Cross-sectional analysis (Swiss) | Healthy men and women | 89 | Targeted: 87 metabolites in plasma and 103 in urine, GC-MS + LC-MS/MS | Urine and plasma | 0.36 |
| - High meat, low vegetable | |||||||
| - Low meat, high vegetable (FFQ) | |||||||
aHEI, alternative Healthy Eating index; aMD, alternate Mediterranean diet; AP, animal protein; CVD, cardiovascular disease; DASH, Dietary Approaches to Stop Hypertension; FFQ, food-frequency questionnaire; HDI, Healthy Diet Indicator; HEI, Healthy Eating Index; MD, Mediterranean diet; PP, plant protein; ref, reference; SC, score of study contribution (see text for additional explanation); T2D, type 2 diabetes.
TABLE 2.
Description of the interventional studies comparing the metabolites associated with diets with contrasted AP and PP intakes through a metabolomics approach1
| Ref | Study design | Type of diet compared | Population studied (country) | n | Metabolomics analysis | Biofluid | SC |
|---|---|---|---|---|---|---|---|
| (65) | Crossover2 wk controlled diet | - High meat- Low meat | Healthy men (UK) | 12 | Untargeted: NMR | Urine | 0.78 |
| - Vegetarian diet | |||||||
| (66) | Parallel 6-mo interventionA large proportion of food provided through a dedicated shop + dietary counseling | - NND: high content of vegetables, fruits, whole grains, nuts, fish, and seafood products- Control: Average Danish Diet: close to actual Danish food consumption | Men and women with high waist circumference (Denmark) | 145 | Untargeted: LC-MS | Urine | 0.71 |
| (67) | Parallel 6-mo interventionA large proportion of food provided through a dedicated shop + dietary counseling | - NND: high content of vegetables, fruits, whole grains, nuts, fish, and seafood products- Control: Average Danish Diet: close to actual Danish food consumption | Men and women with high waist circumference (Denmark) | 145 | Untargeted: GC-MS | Plasma | 0.71 |
| (68) | Parallel 6-mo interventionA large proportion of food provided through a dedicated shop + dietary counseling | - NND: high content of vegetables, fruits, whole grains, nuts, fish, and seafood products- Control: Average Danish Diet: close to actual Danish food consumption | Men and women with high waist circumference (Denmark) | 145 | Untargeted: LC-MS | Plasma | 0.71 |
| (69) | Parallel1- to 3-y interventionDietary counseling with nuts and olive oil provided | - Low-fat diet: instruction to reduce all type of fats and recommendations according to American Heart Association- MD and olive oil supplementation (1 L/wk)- MD and nuts supplementation (30 g/d) | PREDIMED studyMen and women, nondiabetics but with high cardiovascular risk (Spain) | 98 | Untargeted: NMR | Urine | 0.65 |
| (70) | CrossoverPostprandial follow-up after the consumption of different test meal (3 h after meal consumption) | - Omnivore meal- Vegetarian meal- Vegan meal | Healthy men and women (Sweden) | 32 | Untargeted: NMR | Serum | 0.84 |
| (71) | Parallel8-wk interventionCombination of dietary counseling and food supply | - MD: induced an increase in PP-to-AP ratio by 2.5- Control diet: habitual food consumptionIsocaloric diets adjusted for each participant | Obese and overweighed men and women (mean BMI = 30 kg/m2) (Italy) | 62 | Untargeted combined with targeted approach for TMAO, carnitine, choline, creatinine, and betaine: LC-MS | Urine and serum | 0.71 |
| (72) | Crossover4 wk Controlled diet | - Meat-based diet- Vegetarian diet | Mostly men (94%) with ischemic heart disease (Sweden) | 27 | Untargeted: LC-MS/MS | Plasma | 0.84 |
AP, animal protein; MD, Mediterranean diet; NND, New Nordic Diet; PP, plant protein; Ref, reference; SC, score of study contribution (see text for additional explanation); TMAO: trimethylamine-N-oxide.
All observational studies had a cross-sectional design and the intergroup differences across the metabolome are rather expected to result from a long-term exposure to the diets compared. One study directly compared AP and PP intake (42), 6 compared omnivores with vegetarians and vegans (50–54, 64), 6 compared groups according to adherence to defined dietary patterns (55–60), and 3 according to a posteriori (data-driven) dietary patterns (61–63). While most studies were conducted in healthy participants, 8 of them included participants with cardiometabolic risk factors (42, 58, 66–69, 71, 72).
To account for the differences in study design and for the disparities expected in AP and PP intakes, we built a scoring system that balances the potential contribution of each study to improve our ability to identify metabolites associated with AP- and PP-rich diets. Briefly, for each study, we applied a study design contribution score (SD) based on the levels of evidence defined by the Oxford Centre for Evidence-Based Medicine (73) and a dietary contribution score (SP) based on the expected differences in protein type intake and available dietary data (Figure 2). The highest SP values were attributed to studies investigating directly the association of the metabolome with AP and PP intake, followed by studies comparing either vegetarians or vegans with omnivores, different adherence levels to healthy dietary patterns, and finally a posteriori (data-driven) dietary patterns. Then, for each study, an overall contribution score (SC) was calculated by averaging SD and SP, which ranged from 0.33 to 0.84 across studies (Supplemental Tables 2 and 3). For each selected study, we retrieved the discriminating metabolites (see Supplemental Text for additional explanation). Then, we summed the SC of each study reporting a specific metabolite to obtain an overall metabolite score (SM). For a given metabolite, a high SM can be the result of its presence in numerous studies with a low SC or its presence in only a few studies but with a high SC. We finally distinguished a short list of metabolites being associated with AP- and PP-rich diets, with a higher level of evidence among those having the highest SM values, by applying an SM cutoff value of 1.51, which represents 3-fold of 60% of the maximum SC attributed (0.84), so as to highlight the metabolites cited in at least 3 studies of relatively good relevance.
Overall high heterogeneity in the reported metabolites but convergence on AA metabolism
Across the selected studies, 439 metabolites were reported as discriminant between diets with varying AP and PP contents, with a mean SM of 0.89. We summed the SM values of all metabolites within 1 metabolite class to estimate its overall contribution to the global metabolomics signature obtained (Figure 3). Metabolites related to protein and AA metabolism had the highest contribution (high number of metabolites and high mean SM), followed by phosphatidylcholines (high number of metabolites), and then by metabolites of energy and carbohydrate metabolism and acylcarnitines (moderately high number of metabolites and a moderately high mean SM). Taken together, the different lipid classes contributed to a high proportion (45%) of the overall metabolomics signature.
FIGURE 3.
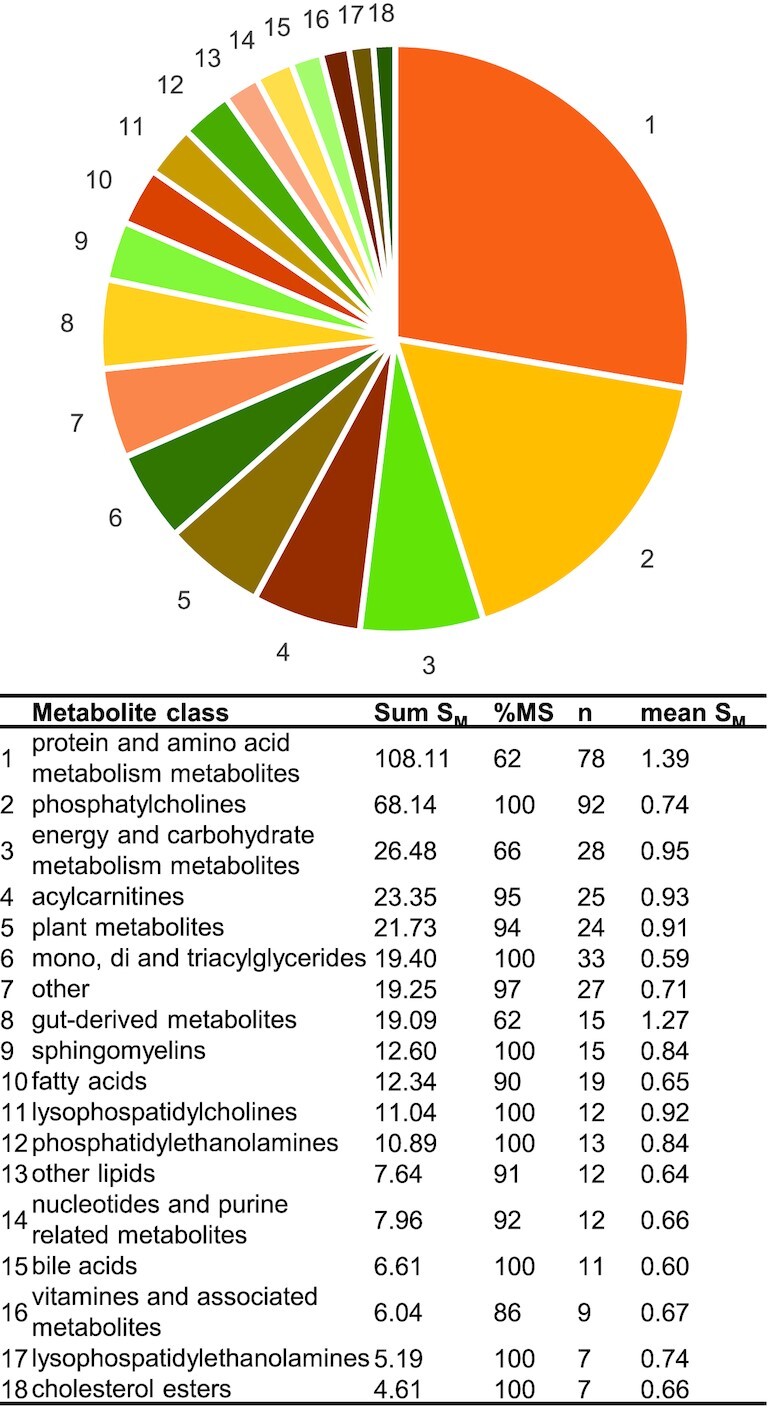
Contribution of each metabolite class to the overall metabolomics signature associated with AP- or PP-rich diets, weighted by overall metabolite score. Sum SM is the relative weight attributed to a metabolite class and calculated as the sum of SM values of each metabolite reported within this class; n is the number of metabolites reported per class; mean SM is the average SM value within 1 metabolite class; % MS represents the percentage of the Sum SM value obtained by MS-based studies as opposed to NMR-based studies. AP, animal protein; PP, plant protein; SM, metabolite score,
Moreover, only 46 of these 439 discriminant metabolites were judged to have a sufficient level of evidence, using an SM cutoff value of 1.51 that ensures concordance of metabolite detection across studies of good relevance (see Table 3). Among them, 14 (30%) were AAs, which highlights their important role in the metabolomics signatures associated with AP- or PP-rich diets. This short list also contained other important endogenous metabolites such as tricarboxylic acid (TCA) cycle intermediates or creatine, creatinine, and choline, mostly provided by the dietary intake of animal products. This short list contained few lipids, although they were very abundant previously, probably because of the high variability of this particular family that may explain the lack of convergence between studies. Moreover, the high contribution of AA-related molecules to metabolomics signatures can be interpreted in terms of biomarkers of exposure and/or effects. Indeed, such metabolomics signatures could reflect the difference in the intrinsic AA composition of APs and PPs (Figure 1), whose intakes were contrasted in the diets compared but are probably not simple protein FIBs, since circulating AA concentrations are usually not considered to directly reflect AA dietary intake (48). They more likely constitute effects biomarkers, either of overall dietary patterns with contrasted protein sources or more specific to protein-type intake as differences in AA intake could lead to modifications in protein and AA metabolism that, in turn, become visible in the metabolome.
TABLE 3.
Short list of metabolites associated with AP- and PP-rich diets with a sufficient level of evidence, as defined by an SM value >1.511
| Associated with AP-rich diets (ref) | Associated with PP-rich diets (ref) | ||||
|---|---|---|---|---|---|
| Metabolite | SM | Obs | Int | Obs | Int |
| Leucine2 | 4.83 | (51, 52, 62)3, 4 (63, 64)3, 5 | (71)3, 4 (70)3, 5 | (69)5,6 | |
| Creatinine2 | 4.24 | (51, 57)3, 4 (53, 64)3, 5 (54)5, 6 | (70)3, 5 | (69)5, 6 | |
| Valine2 | 4.16 | (42, 51, 52, 62)3, 4 (53, 64)3, 5 | (70)3, 5 | ||
| Creatine2 | 4.11 | (42, 51)3, 4 (53)3, 5 | (70)3, 5 (65)5, 6 | (69)5, 6 | |
| Carnitine | 4.05 | (42, 51, 57)3, 4 | (72)3, 4 (71)4, 6 (65)5, 6 | ||
| Glycine2 | 4.03 | (51)3, 4 (53)3, 5 (50, 54, 61)5, 6 | (67)3, 4 (69)5, 6 | ||
| TMAO2 | 3.79 | (50, 61)5, 6 | (65, 69)5, 6 | (68)3, 4 (66)4, 6 | |
| Proline betaine | 3.69 | (68)3, 4 (66)4, 6 (69)5, 6 | (55, 60)3, 4 | (71)3, 4 | |
| Alanine | 3.60 | (52,62)3, 4 | (67)4, 4 | (51)3, 4 (64)3, 5 | (70)3, 5 |
| Threonine | 3.41 | (57)3, 4 | (67, 68)3, 4 (70)3, 5 | (42)3, 4 | |
| Citrate2 | 3.09 | (67)3, 4 | (64)3, 5 (50, 54)5, 6 | (69)5, 6 | |
| Isoleucine2 | 2.76 | (52, 57, 62)3, 4 (53)3, 5 | (70)3, 5 | ||
| Lysine | 2.56 | (51, 52)3, 4 (53)3, 5 | (70)3, 5 | ||
| Lysophosphatidyl-choline a C16:1 | 2.56 | (51, 57)3, 4 | (72)3, 4 | (42)3, 4 | |
| Glutamine2 | 2.50 | (65)5, 6 | (51)3, 4 (53, 64)3, 5 | ||
| Proline | 2.45 | (57, 58, 62)3, 4 (53)3, 5 | (69)5, 6 | ||
| Methionine | 2.44 | (51, 62)3, 4 | (70)3, 5 | (42)3, 4 | |
| Acylcarnitine C42 | 2.44 | (42, 51, 58)3, 4 | (68)3, 4 | ||
| Phenylacetyl-glutamine2 | 2.43 | (42)3, 4 | (71)4, 6 | (61)5, 6 | (69)5, 6 |
| Glutamate2 | 2.41 | (52, 57, 58, 63)3, 4 | (51)3, 4 | ||
| Hippurate | 2.39 | (69)5, 6 | (59)3, 4 (50)5, 6 | (66)4, 6 | |
| Phenylalanine2 | 2.31 | (62)3, 4 (50)5, 6 | (67)3, 4 | (42)3, 4 | |
| Tryptophan2 | 2.19 | (51)3, 4 | (71)3, 4 | (57, 59)3, 4 | |
| Acylcarnitine C22 | 2.18 | (62)3, 4 (61)5, 6 | (71)4, 6 (65)5, 6 | ||
| Lysophosphatidyl-choline a C16:0 | 2.13 | (51)3, 4 | (72)3, 4 | (68)3, 4 | |
| GABA | 2.09 | (42, 52)3, 4 (63)4, 6 | (58)3, 4 | ||
| p-Cresol2 | 2.08 | (71)3, 4, 6 | (69)5, 6 | ||
| 3-Methylhistidine | 2.06 | (50)4, 6 | (72)3, 4 (69)5, 6 | ||
| Tyrosine2 | 2.05 | (51, 52, 62)3, 4 (64)3, 5 | |||
| Betaine | 2.00 | (70)3, 5 | (59)3, 4 | (71)3, 4 | |
| Choline | 1.99 | (59)3, 4 | (70)3, 5 | (42)3, 4 | |
| Succinate2 | 1.99 | (52)3, 4 | (50)5, 6 | (70)3, 5 | |
| Taurine | 1.93 | (53)3, 5 (50)5, 6 | (65)5, 6 | ||
| 1-Methylhistidine | 1.93 | (42)3, 4 (50)5, 6 | (71)3, 4 | ||
| Tryptophan betaine | 1.88 | (55)3, 4 | (71)3, 4, 6 | ||
| Citrulline2 | 1.74 | (57)3, 4 | (51)3, 4 | (71)3, 4 | |
| Kynurenine | 1.73 | (51, 58)3, 4 | (42)3, 4 | ||
| Acylcarnitine C18:2 | 1.73 | (42, 51, 57)3, 4 | |||
| CMPF | 1.68 | (55, 56)3, 4 | (71)3, 4 | ||
| Threonic acid | 1.61 | (55, 56, 60)3, 4 | (67)3, 4 | ||
| Acylcarnitine C18 | 1.60 | (42, 57, 58)3, 4 | |||
| Lactate2 | 1.55 | (67)3, 4 | (70)3, 5 | ||
| Lysophosphatidyl-ethanolamine C22:0 | 1.54 | (72)3, 4 | (42)3, 4 | ||
| DHA | 1.54 | (64)3, 5 | (55, 56)3, 4 | ||
| Sphingomyelin (d18:2/18:1) | 1.54 | (51, 56, 59)3, 4 | |||
| Isocitrate2 | 1.51 | (59)3, 4 (63)4, 6 | (42)3, 4 | ||
AP, animal protein; CMPF, 3-carboxy-4-methyl-5-propyl-2-furanpropanoate; GABA, γ-aminobutyrate; Int, interventional studies; Obs, observational studies; PP, plant protein; ref, reference; SM, metabolite score reflecting the degree of concordance of its identification as a discriminant metabolite between studies of good relevance (see text for additional explanation); TMAO, trimethylamine-N-oxide.
Metabolite discussed in the present review.
Analysis conducted in plasma or serum.
MS-based analysis.
NMR-based analysis.
Analysis conducted in urine.
Replication of already-known FIBs
Across the selected studies, many identified metabolites were already known as potential FIBs. For instance, several metabolites known for their association with animal products and meat consumption were found to be associated with high-AP diets.
Creatine and its degradation product creatinine have been proposed as total meat FIBs, creatine being more reliable than creatinine, whose excretion is closely related to individual muscle mass (74). Both metabolites had among the highest SM values (4.11 and 4.24, respectively) and were often associated with high-AP diets (42, 51, 53, 54, 57, 64, 65, 69, 70). Likewise, 3-methylhistidine (SM = 2.06) has been proposed as a total meat and poultry FIB (74) and was associated with diets with a higher proportion of APs (50, 69, 72).
Metabolites associated with plant food intake were also reported to be associated with PP-rich diets. For instance, hippurate (SM = 2.39), a metabolite formed through endogenous glycine conjugation of benzoic acid but also through gut microbiota degradation of dietary polyphenols (75, 76), was positively associated with diets with a high proportion of PPs (50, 59, 66), with 1 exception in an MD intervention study (69).
Effect of AP- and PP-rich diets on metabolism
Association between metabolomics signatures and cardiometabolic risk
Several studies included in this review conducted mediation analyses between metabolomics signatures derived from diets with different proportions of APs and PPs and cardiometabolic risk or risk factors. In an analysis of the PREvención con DIeta MEDiterránea (PREDIMED) baseline data, adherence to an MD and the related metabolomics signature (60 metabolites) was associated with a lower CVD incidence (58). Furthermore, the association between the metabolomics signature and CVD risk remained significant when adjusting for MD adherence. In addition, the association between MD score and CVD was 37%, mediated by the metabolomics signature, in accordance with another analysis in which the metabolomics signature derived from MD adherence also mediated 37% of the negative association between MD adherence and HOMA-IR (57).
These mediation analyses suggest that some of the discriminating metabolites between diets with contrasted AP and PP contents may contribute to explain the differential effects of these diets on cardiometabolic risk, by acting as some of the causal effectors.
BCAAs, AAAs, and acylcarnitines
BCAAs (leucine, isoleucine, and valine) and AAAs (such as tyrosine and phenylalanine) are present in high quantities in APs (Figure 1). In association with certain short-chain acylcarnitines, they have been consistently reported together in the metabolic signatures associated with several metabolic diseases and are discussed together.
All BCAAs and AAAs were on the short list of metabolites consistently identified by relevant studies (with high SM values ranging between 4.83 and 2.05; Table 3) and were most consistently associated with high-AP diets, with this association being repeated in observational and at least 1 interventional study for each metabolite (with the exception of tyrosine, reported only in observational studies). They were positively associated with omnivore diets (50–53, 64, 70), with the Average Danish Diet compared with the NND (67), and negatively associated with the PP-to-AP ratio and PP intake (42) and with MD adherence (57, 71). In a dietary cluster analysis, the 3 BCAAs, tyrosine, and phenylalanine were also associated with the Western dietary pattern but not the vegetarian one (62). Conversely, an association with PP-rich diets was observed in only 2 cases: phenylalanine was positively associated with the PP-to-AP ratio (42) and leucine was positively associated with the 2 MD intervention groups of the PREDIMED study (69).
Short-chain acylcarnitines, especially C3 and C5 acylcarnitines, are byproducts of BCAA mitochondrial oxidation (77). It is therefore not surprising that short-chain acylcarnitines have been reported to be associated with high-AP diets. This was the case, in particular, for acylcarnitine C4 and C2 (present in the short list of Table 3, with high SM values of 2.44 and 2.18, respectively), which were consistently reported in both observational and interventional studies (42, 51, 58, 61, 62, 65, 68, 71). In additional analyses, urine acylcarnitine C2 was positively associated with meat intake, which was further confirmed by a comparison across meat intake percentile groups (61). C3-acylcarnitine (SM = 1.29) was positively associated with AP-rich diets in a cross-sectional study comparing vegans and non-vegans (51) and in an MD randomized trial (71). Finally, C5-acycarnitine (SM = 0.90) was also associated with AP-rich diets, since it was associated with a Western diet dietary cluster (62) and found at higher concentrations in habitual non-vegans (51).
BCAAs, AAAs, and short-chain acylcarnitines were associated with several cardiometabolic risk factors. In the Fenland study, adherence to an MD was inversely associated with HOMA-IR, and the integration of acylcarnitines in the prediction model resulted in an 11% attenuation of the association, suggesting their implication in the initiation and progression of insulin resistance (57). Further, in the metabolomic profiling of Asian Indians living in the United States (62), one of the identified clusters of metabolites included BCAAs, phenylalanine, and tyrosine, and C2 and C5 acylcarnitines and was positively associated with a high animal product intake dietary pattern and several cardiometabolic risk markers (higher fasting insulin, higher HOMA-IR, total cholesterol, triglyceride, and liver fat concentrations).
Outside of the studies included in this review, there is a wealth of examples of associations between metabolic disorders and this group of metabolites. For instance, a principal component analysis component including BCAAs, C3 and C5 acylcarnitines, phenylalanine, tyrosine, methionine, and glutamate/glutamine was positively associated with obese compared with lean subjects and had a significant linear relation with HOMA-IR, even after adjusting for the lean versus obese status (36). Since then, elevated plasma BCAAs, phenylalanine, and tyrosine have been often reported in cardiometabolic-related conditions (78–81) and numerous cohort studies (78–80, 82–92). Those metabolites also seem to have a predictive value for cardiometabolic disease risk. BCAAs, tyrosine, and phenylalanine were predictive of higher T2D and CVD risk in prospective cohorts (93–98). With regard to acylcarnitines, while several studies showed an association with CVD (96, 99–101), only C5 and C16 acylcarnitines have been reported so far as being positively associated with increased risk of T2D (94).
Several explanations have been discussed to explain the potential causal link of this group of metabolites with cardiometabolic disorders. There is supporting evidence that BCAA overload promotes mitochondrial dysfunction by acylcarnitine accumulation (102). One possible mechanism involves the metabolite 3-hydroxyisobutyrate (3-HIB), a byproduct of valine oxidation that occurs in the mitochondria, but that is also able to leak into the blood circulation (77). In rodents, 3-HIB has been shown to favor fatty acid accumulation in the muscle (103) by leading to acylcarnitine accumulation inside the mitochondria and promoting mitochondrial dysfunction, which is thought to promote insulin resistance (102). In humans, plasma 3-HIB was significantly associated with a higher risk of T2D, even after adjustment for plasma BCAAs and obesity (104). Interestingly, 3-HIB (SM = 0.58) was positively associated with habitual meat consumption in the present review (53).
The results regarding 2-hydroxybutyrate (2-HB) also strengthen the hypothesis of increased fatty acid oxidation in association with AP intake. In the present review, 2-HB (SM = 0.94) was associated with AP-rich diets in 2 cross-sectional studies (63, 91). On the other hand, 2-HB has been associated with a higher risk of insulin resistance and T2D in prospective cohorts (105, 106). In addition, in an untargeted metabolomics analysis, 2-HB proved to be very discriminant and able to distinguish insulin-resistant individuals from insulin-sensitive ones (107). Given that the production of 2-HB from α-ketobutyrate (a byproduct of methionine and threonine) requires the oxidation of NADH to NAD+, a higher concentration of 2-HB could reflect a higher fatty acid oxidation, known to increase the NADH to NAD+ ratio (105, 107). Another explanation for the high 2-HB concentrations could relate to an increased α-ketobutyrate production during the conversion of cystathionine to cysteine, in order to fuel glutathione synthesis under high oxidative stress conditions (107).
In conclusion, the consumption of diets richer in APs is associated with higher plasma BCAAs, AAAs, and short-chain acylcarnitines. Higher concentrations of those metabolites have been observed in individuals with higher cardiometabolic risk factors such as insulin resistance. The causal role of these metabolites in the onset of insulin resistance is not fully established, but there is growing evidence of a mechanism involving an overload of mitochondrial β-oxidation capacity induced by high BCAA circulating concentrations and concomitant acylcarnitine mitochondrial accumulation. Therefore, BCAAs, phenylalanine, tyrosine, and short-chain acylcarnitines are good candidates to explain the association between AP intake and increased cardiometabolic risk.
Glycine, glutamine, and glutamate
Nonessential AAs glycine, glutamine, and glutamate, which were also on the short list of metabolites consistently identified by relevant studies (with high SM values ranging between 4.03 and 2.41; Table 3), are known for their implication in cardiometabolic health.
Glutamate (SM = 2.41) was positively associated with AP-rich diets in 4 cross-sectional studies: it was negatively associated with MD adherence (57, 58) and positively associated with a dietary pattern high in meat and low in vegetable intake (63) and with omnivores compared with vegetarians (52). However, fish-eaters and vegetarians had higher plasma glutamate than omnivores in the European Prospective Investigation into Cancer and Nutrition (EPIC) Oxford cohort (51), and glutamate was positively associated with vegetarian meals and negatively with vegan meals and omnivore meals in 1 interventional study (70), a finding that cannot be interpreted in terms of association with AP and PP meal intake.
Plasma or serum glutamine (SM = 2.50) was positively associated with PP-rich diets in 3 cross-sectional studies comparing habitual omnivores and vegetarians or vegans (51, 53, 64). This was consistent with its lower presence in the urine of high meat eaters in a 2-wk clinical trial (65).
Glycine (SM = 4.03) was found very consistently to be positively associated with PP-rich diets both in observational and interventional studies. Plasma or serum glycine was positively associated with habitual vegetarianism and veganism (50, 51, 53, 54) and with the NND intervention group in a Danish clinical trial (67). In urine, it was further associated with the MD intervention groups in the PREDIMED study (69) and with a dietary pattern with a high proportion of plant foods (61). Additional findings, which were not obtained with a metabolomics approach, also reported a positive association between plasma glycine and PP source intake (48, 108–110), despite glycine intake usually being lower in diets richer in PPs.
Consistent with these findings, an analysis of the EPIC-Potsdam cohort found a negative association between red meat consumption and plasma glycine (111). The association between red meat consumption and T2D risk was 30% mediated by plasma glycine, suggesting that glycine could be a potential mediator of the differential effect of APs and PPs on cardiometabolic health.
Indeed, a meta-analysis of 47 case-control studies showed decreased serum glycine and glutamine and increased glutamate in patients with obesity and metabolic syndrome compared with healthy controls (112), in accordance with several cross-sectional analyses (78, 79). On the other hand, glutamate was rather positively associated with cardiometabolic risk factors (78, 80, 113). A consistent set of studies also showed that the circulating concentrations of these AAs are predictive of cardiometabolic disease risks. Plasma glycine and glutamine were negatively associated with T2D risk while plasma glutamate was associated with higher risk in 2 meta-analyses of prospective cohorts (94, 101). Glutamate was also associated with a higher risk of CVD in several prospective cohorts (114–116), while the glutamine-to-glutamate ratio and glycine were linked to a lower risk (114, 117, 118). Interestingly, one of the studies selected in this review demonstrated both a negative association between plasma glutamate and an MD and a positive association with CVD risk (58).
Several mechanisms have been discussed to explain the positive effects of glycine and glutamine on cardiometabolic health, including their implication in glutathione synthesis for the regulation of oxidative stress (119, 120). In addition, in endothelial cells, the production of ammonia from glutamine to glutamate leads to increased heme degradation and byproduct production—that is, the bile pigments biliverdin and bilirubin, and carbon monoxide, known to be involved in oxidative stress and inflammatory regulation (119). Glutamine could also be indirectly implicated in endothelial cell function and NO synthesis, a regulator of blood flow and pressure (121). In the intestine, glutamine is converted into glutamate and citrulline, the latter being exported into the circulation and further converted by the kidney into arginine, the substrate for NO synthase (119, 122). Citrulline (SM = 1.74) was indeed a discriminant metabolite across 3 studies included in this review, with a positive association with high-PP diets in a cross-sectional study comparing omnivores with vegetarians and vegans and in an MD randomized trial (51, 71) and a negative association with MD adherence level in another cross-sectional study (57). Other potential explanatory mechanisms include the anti-inflammatory effect of glutamine, given its capacity to stimulate macrophage differentiation into the M2 anti-inflammatory type (123).
In contrast, although the mechanisms by which glutamate could contribute to an increased cardiometabolic risk are not well known, its toxicity to the β cells in a high-glucose context has been proposed as a possible explanation for the increased T2D risk observed (124, 125).
To conclude, there is strong evidence that glycine is associated with PP-rich diets and decreased cardiometabolic risk. Glutamine and glutamate seem to be associated with PP- and AP-rich diets, respectively, although with a less conclusive level of evidence than for glycine. Their associations with cardiometabolic health are contrasted, the positive association of glutamine being backed up by more mechanistic explanations than the negative one for glutamate.
TCA cycle intermediates
In our analyses, several TCA cycle intermediates, such as citrate (SM = 3.09), isocitrate (SM = 1.51), succinate (SM = 1.99), malate (SM = 1.15), and cis-aconitate (SM = 1.10), were repeatedly associated with diets with different proportions of APs and PPs (Table 3). However, there was no clear trend regarding the direction of those associations. For instance, malate was positively associated with PP intake and the PP-to-AP ratio (42), but it was negatively associated with an MD, the alternative HEI, and DASH score (59) in 2 observational studies. Glycolysis end-products such as lactate (SM = 1.55) and pyruvate (SM = 0.84) were reported to be either associated with vegetarian meal consumption or with the average Danish diet in another nutritional intervention (67, 70).
The TCA cycle is essential in energy metabolism, and the modulation of its related metabolites is indicative of effects on the central metabolism. However, further investigations are needed to clarify the direction of the association with either AP- or PP-rich diets. In addition, there are not yet enough data to understand whether and how these metabolites are linked to cardiometabolic health and if they could be meaningful in the explanation of the physiological effects of AP and PP intake.
Effects of AP- and PP-rich diets on gut microbiota metabolism
Among the studies included in this review, the 3 that specifically focused on gut microbiota showed differences in activity and composition between vegan, vegetarian, and omnivore diets (54), and according to MD adherence (52, 71).
Plasma and urine metabolomics data also suggested that AP- and PP-rich diets induce a differential activity of gut microbiota, with several gut-derived metabolites being involved (42, 50, 61, 65, 66, 68, 69, 71).
Trimethylamine-N-oxide
Trimethylamine-N-oxide (TMAO) comes from 2 different sources. TMAO is produced by the liver's conversion of trimethylamine (TMA), which itself results from the degradation by the gut microbiome of several dietary precursors such as choline, phosphatidylcholine, betaine, carnitine, dimethylglycine, and ergothioneine (126). Plasma TMAO is also increased by the consumption of fish (in which it is naturally present) and has therefore been proposed as a short-term FIB of this food category (74).
TMAO was on the short list of metabolites consistently identified by relevant studies (with a high SM value of 3.79; Table 3) and was associated with AP-rich diets in both observational and interventional studies. Urinary TMAO was hence positively associated with an omnivore diet (50), a dietary pattern with a high meat intake (61), the control group of the PREDIMED trial (69), and the high meat group of another nutritional intervention (65). The only exception was observed in the New Nordic trial where higher TMAO concentrations were found for the diet with a higher proportion of PP, but probably because this diet was also richer in fish (66, 68). In addition, similar findings were obtained in an interesting 16-wk crossover randomized trial where participants consuming 2 plant-based alternatives per day instead of 2 servings of meat, while maintaining similar intake for all food categories, had lower serum TMAO concentrations overall (127). Similar results were found in another well-controlled trial, where a red meat diet led to higher plasma TMAO concentrations than a white meat diet and a nonmeat diet richer in PPs (128).
The differences in TMAO concentration between dietary protein sources could result from a higher intake of TMAO precursors with AP-rich diets, but also depend on other factors, such as gut microbiota composition, hepatic enzyme activity converting TMA to TMAO, and TMAO renal excretion (129). The higher TMAO concentrations associated with AP-rich diets could also indicate higher cardiometabolic risk associated with this type of protein source, without it necessarily being implicated causally.
TMAO plasma concentrations have indeed been positively associated with all-cause mortality, major adverse cardio- and cerebrovascular events (130–132), and T2D (133). In addition, TMAO has also been linked to several risk factors such as hypertension (134), elevated BMI (135), and systemic inflammation, as assessed by C-reactive protein (136).
Research is still ongoing to understand the mechanistic bases of these associations and whether they are causal (126, 129). In addition, these findings still need to be reconciled with the association of TMAO with fish intake, considered beneficial to cardiometabolic health (137), in particular cardiovascular health (138). Despite these limitations, these recent findings suggest that TMAO could be a promising biomarker of cardiometabolic risk. Therefore, since we found in this review that TMAO is associated with AP-rich diets, it can be considered as a potential mediator or biomarker of the higher cardiometabolic risk associated with higher consumption of this protein type.
Products of AAA gut microbiota degradation
Although most proteins are digested and absorbed in the small intestine, a small fraction can reach the colon and be fermented by the microbiota. Across the selected studies, several microbiota metabolites derived from AAA degradation have been reported as discriminant of AP- and PP-rich diets.
Phenylacetylglutamine (PAGln), a product of phenylalanine, was on the short list of the metabolites consistently identified by relevant studies (SM = 2.43). It was inversely associated in cross-sectional studies with the PP-to-AP ratio (42) but positively associated with a dietary cluster with a low meat intake (61), where secondary analyses reported a positive association between its urinary concentration and vegetable intake. Results are conflicting regarding PAGln association in MD randomized trials, as it was reported to be either positive (69) or negative (71).
Although no conclusion can be drawn regarding the direction of its association with AP- or PP-rich diets, this metabolite is worth mentioning as emerging evidence suggests its association with increased CVD risk (139, 140).
Tryptophan can also be catabolized by specific bacteria of the gut into indole propionic acid, indole lactic acid, and indole acetic acid (141). These 3 tryptophan-bacteria–derived byproducts were reported across the articles selected in this review, but the direction of the association with either AP- or PP-rich diets was not clear. Plasma indole-3-propionate (SM = 1.41) was associated with high PP intake (42) and to adherence to an MD in an 8-wk dietary intervention (71). In the same trial, oxindole-3-acetic acid (SM = 0.71) was also positively associated with MD adherence. On the other hand, urinary indole-3-acetic acid glucuronide (SM = 0.71) (66) and plasma indole-3-lactic acid (SM = 0.71) (68) were positively associated with the Average Danish Diet, which predominantly includes AP sources.
Interestingly, these indole derivatives are thought to exert a positive effect on the intestinal physiology (improved intestinal immune response, regulation of the intestinal barrier and gastrointestinal motility, and stimulation of glucagon-like peptide 1 secretion), but also on the host, by promoting direct anti-inflammatory effects. The evidence regarding these mechanisms, reviewed extensively recently (142, 143), is mostly derived from in vitro and animal studies and additional research is needed to confirm these findings in human studies.
Indoxyl sulfate (SM = 1.41), another metabolite of tryptophan, and p-cresol (SM = 2.08), derived from tyrosine (144), were generally associated with AP-rich diets across the selected studies. Plasma indoxyl sulfate was negatively correlated to PP intake (42) and adherence to the MD, as was p-cresol (71). However, p-cresol was also positively associated with the MD intervention groups of the PREDIMED study (69). Both are well-known uremic toxins with harmful effects in chronic kidney disease (145).
Together, these findings highlight the possible implication of these microbial AAA degradation products on cardiometabolic health, with either an increase in CVD risk for PAGln or beneficial effects for indole derivatives. Because they were reported as discriminant by several studies included in this review, they are likely to be associated with diets with contrasted protein-type intake, but the direction of those associations needs to be clarified.
Limitations
Several limitations should be mentioned regarding this review. To the best of our knowledge, only 1 cross-sectional study specifically investigated the metabolomics signature associated with the nature (APs or PPs) of the protein intake (42). To reduce this knowledge gap, we also considered both interventional and observational studies in which AP and PP intakes were likely to differ between groups, even if the magnitude of these differences was often not precisely quantified. With the implementation of a dedicated scoring system for weighting each study's contribution according to the extent of the expected differences in protein intake between its groups and the level of evidence expected from its study design, we were able to account for these between-study differences in our global analysis. However, we could not fully compensate for the initial lack of dietary data, and the design quality was only approximately estimated since no validated tool is available to assess all those criteria on the same scale.
Overall, the metabolites reported here were discussed in relation to AP or PP intake, but this interpretation remains subject to caution because of several additional reasons. First, APs and PPs are not consumed alone but as whole foods within diets: the “whole food package” or “protein package” not only contains dietary proteins but also other nutrients and compounds, such as fiber, vitamins, and unsaturated or saturated fats, which may contribute to the physiological effects observed (141). Second, the consumption of AP and PP sources is closely associated with overall diet quality. For instance, fish consumption is associated with a healthier dietary pattern, with higher vegetable intake and lower meat and alcohol intake (26). PPs themself are associated with nutrient adequacy and diet quality (27, 28), and the nutrient clusters associated with APs and PPs could be important mediators of long-term health effects (29, 30). Consequently, findings obtained in a specific dietary context cannot be readily generalized to other populations with a different dietary environment.
It should also be kept in mind that analyses grouping all AP or PP sources together are not representative of the large variability in their metabolic effects, which differ according to the specific sources, especially within AP sources. A set of meta-analyses investigating the effects of food group intakes on health outcomes has shown an increased risk of all-cause mortality, CVD, hypertension, T2D, and overweight associated with red meat and processed meat, while fish and dairy intakes were associated with decreased risks (146–150).
On the other hand, to date, there is no available analytical tool able to describe the entire human metabolome. Therefore, our understanding of the modulation of the metabolome remains limited to the detected and annotated molecules.
Main Findings and Perspectives
Overall, the consumption of AP- and PP-rich diets has been associated with distinct metabolites, confirming the relevance of nutrimetabolomics in exploring the complex interactions between dietary protein sources and health outcomes.
Despite considerable heterogeneity in the metabolites identified and the level of evidence, several of them were good candidates to explain the effects of AP and PP intake on cardiometabolic health (Figure 4). Plasma BCAAs, AAAs, and short-chain acylcarnitines were positively associated with AP-rich diets: they are of particular interest because they have often been reported together and have been repeatedly associated with cardiometabolic risk factors in multiple design settings. This metabolic signature might be an early marker of muscle lipotoxicity, and partially explain the positive association between AP intake and higher cardiometabolic risk. AP-rich diets also induce higher TMAO urinary concentrations, which have been linked to higher cardiovascular risks, although causality remains to be established. In contrast, circulating concentrations of glycine and glutamine were positively associated with PP-rich diets, and both have been proposed to exert beneficial effects on cardiometabolic health. On the other hand, glutamate has been associated with AP-rich diets and increased cardiometabolic risk.
FIGURE 4.
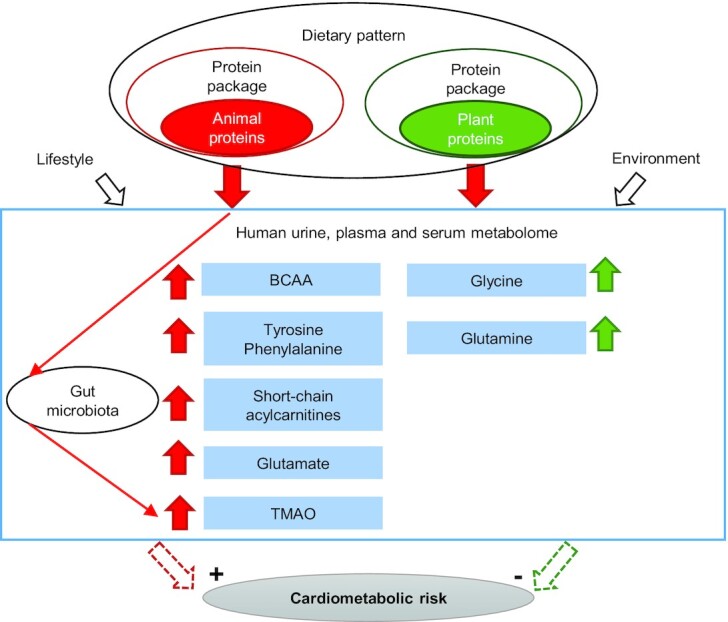
Main metabolites discriminant between AP- and PP-rich diets and their potential implication in cardiometabolic risk. AP- and PP-rich diets are associated with distinct urine, plasma, and serum metabolites in humans. BCAAs (leucine, isoleucine, valine), tyrosine, phenylalanine, glutamate, short-chain acylcarnitines, and gut-derived TMAO were associated with AP-rich diets while glycine and glutamine were associated with PP-rich diets. With regard to their potential implication in cardiometabolic risk, metabolites associated with AP-rich diets have been shown to be associated with higher risk while metabolites associated with PP-rich diets have been associated with lower risk. AP, animal protein; BCAA, branched-chain amino acid; PP, plant protein; TMAO, trimethylamine-N-oxide.
To overcome the limitations discussed previously regarding the difficulty of interpreting differences in diet in terms of variations in protein source in the studies published, additional studies with a specific focus on protein type, detailed dietary data, and strict intake control are needed: both observational studies including a large number of participants and closely describing the protein and AA intake and randomized controlled trials investigating the specific effects of AP and PP intake on plasma and urinary metabolomes. Such detailed studies are required to better characterize the metabolites associated with PA and PP intake, and to understand how they can impact cardiometabolic risk.
Supplementary Material
ACKNOWLEDGEMENTS
The authors’ responsibilities were as follows—HF, GL, and SP: designed the review and were responsible for the final content; GL: wrote the manuscript; HF, J-FH, FM, DR, and SP: reviewed the initial manuscript; and all authors: read and approved the final manuscript.
Notes
The authors reported no funding received for this work.
Author disclosures: The authors report no conflicts of interest.
Supplemental Tables 1–3 and Supplemental Text are available from the “Supplementary data” link in the online posting of the article and from the same link in the online table of contents at https://academic.oup.com/advances/.
Abbreviations used: AA, amino acid; AAA, aromatic amino acid; AP, animal protein; BCAA, branched-chain amino acid; CVD, cardiovascular disease; DASH, Dietary Approaches to Stop Hypertension; EPIC, European Prospective Investigation into Cancer and Nutrition; FIB, food intake biomarker; HEI, Healthy Eating Index; MD, Mediterranean diet; NND, New Nordic diet; PAGln, phenylacetylglutamine; PP, plant protein; PREDIMED, PREvención con DIeta MEDiterránea; SC, overall contribution score; SD, study design contribution score; SM, metabolite score; SP, dietary contribution score; TCA, tricarboxylic acid; TMA, trimethylamine; TMAO, trimethylamine-N-oxide; T2D, type 2 diabetes; 2-HB, 2-hydroxybutyrate; 3-HIB, 3-hydroxyisobutyrate.
Contributor Information
Gaïa Lépine, Université Clermont Auvergne, INRAE, UMR 1019, Unité Nutrition Humaine, Clermont-Ferrand, France; Université Paris-Saclay, AgroParisTech, INRAE, UMR PNCA, Paris, France.
Hélène Fouillet, Université Paris-Saclay, AgroParisTech, INRAE, UMR PNCA, Paris, France.
Didier Rémond, Université Clermont Auvergne, INRAE, UMR 1019, Unité Nutrition Humaine, Clermont-Ferrand, France.
Jean-François Huneau, Université Paris-Saclay, AgroParisTech, INRAE, UMR PNCA, Paris, France.
François Mariotti, Université Paris-Saclay, AgroParisTech, INRAE, UMR PNCA, Paris, France.
Sergio Polakof, Université Clermont Auvergne, INRAE, UMR 1019, Unité Nutrition Humaine, Clermont-Ferrand, France.
References
- 1. FAO; WHO . Sustainable healthy diets: guiding principles. Rome (Italy): FAO; 2019. [Google Scholar]
- 2. Tilman D, Clark M. Global diets link environmental sustainability and human health. Nature. 2014;515:518–22. [DOI] [PubMed] [Google Scholar]
- 3. Springmann M, Godfray HCJ, Rayner M, Scarborough P. Analysis and valuation of the health and climate change cobenefits of dietary change. Proc Natl Acad Sci. 2016;113:4146–51. [DOI] [PMC free article] [PubMed] [Google Scholar]
- 4. Willett W, Rockström J, Loken B, Springmann M, Lang T, Vermeulen S, Garnett T, Tilman D, DeClerck F, Wood Aet al. Food in the Anthropocene: the EAT–Lancet Commission on healthy diets from sustainable food systems. Lancet North Am Ed. 2019;393:447–92. [DOI] [PubMed] [Google Scholar]
- 5. Kesse-Guyot E, Chaltiel D, Wang J, Pointereau P, Langevin B, Allès B, Rebouillat P, Lairon D, Vidal R, Mariotti Fet al. Sustainability analysis of French dietary guidelines using multiple criteria. Nat Sustain. 2020;3:377–85. [Google Scholar]
- 6. Gardner CD, Hartle JC, Garrett RD, Offringa LC, Wasserman AS. Maximizing the intersection of human health and the health of the environment with regard to the amount and type of protein produced and consumed in the United States. Nutr Rev. 2019;77:197–215. [DOI] [PMC free article] [PubMed] [Google Scholar]
- 7. Poore J, Nemecek T. Reducing food's environmental impacts through producers and consumers. Science. 2018;360:987–92. [DOI] [PubMed] [Google Scholar]
- 8. Mekonnen MM, Hoekstra AY. A global assessment of the water footprint of farm animal products. Ecosystems. 2012;15:401–15. [Google Scholar]
- 9. Cleveland DA, Gee Q. 9-Plant-based diets for mitigating climate change. In: Mariotti F, editor. Vegetarian and plant-based diets in health and disease prevention. London (UK): Elsevier/Academic Press, an imprint of Elsevier; 2017. p.135–56. [Google Scholar]
- 10. IARC Working Group on the Evaluation of Carcinogenic Risks to Humans . Red Meat and Processed Meat. Lyon (France): International Agency for Research on Cancer; 2018. [Google Scholar]
- 11. Han MA, Zeraatkar D, Guyatt GH, Vernooij RWM, El Dib R, Zhang Y, Algarni A, Leung G, Storman D, Valli Cet al. Reduction of red and processed meat intake and cancer mortality and incidence. Ann Intern Med. 2019;171:711–20. [DOI] [PubMed] [Google Scholar]
- 12. Lin Y, Bolca S, Vandevijvere S, Vriese SD, Mouratidou T, Neve MD, Polet A, Oyen HV, Camp JV, Backer GDet al. Plant and animal protein intake and its association with overweight and obesity among the Belgian population. Br J Nutr. 2011;105:1106–16. [DOI] [PubMed] [Google Scholar]
- 13. Li S, Blanco Mejia S, Lytvyn L, Stewart S, Effie V, Ha V, de Souza R, Leiter L, Kendall C, Jenkins Det al. Effect of plant protein on blood lipids: a systematic review and meta-analysis of randomized controlled trials. J Am Heart Assoc. 2017;6:e006659. [DOI] [PMC free article] [PubMed] [Google Scholar]
- 14. Zhao H, Song A, Zheng C, Wang M, Song G. Effects of plant protein and animal protein on lipid profile, body weight and body mass index on patients with hypercholesterolemia: a systematic review and meta-analysis. Acta Diabetol. 2020;57:1169–80. [DOI] [PubMed] [Google Scholar]
- 15. Wang YF, Yancy WS Jr, Yu D, Champagne C, Appel LJ, Lin P-H. The relationship between dietary protein intake and blood pressure: results from the PREMIER study. J Hum Hypertens. 2008;22:745–54. [DOI] [PubMed] [Google Scholar]
- 16. Elliott P, Stamler J, Dyer AR, Appel L, Dennis B, Kesteloot H, Ueshima H, Okayama A, Chan Q, Garside DBet al. Association between protein intake and blood pressure: the INTERMAP study. Arch Intern Med. 2006;166:79–87. [DOI] [PMC free article] [PubMed] [Google Scholar]
- 17. Chen Z, Franco OH, Lamballais S, Ikram MA, Schoufour JD, Muka T, Voortman T. Associations of specific dietary protein with longitudinal insulin resistance, prediabetes and type 2 diabetes: the Rotterdam Study. Clin Nutr. 2020;39:242–9. [DOI] [PubMed] [Google Scholar]
- 18. Azemati B, Rajaram S, Jaceldo-Siegl K, Sabate J, Shavlik D, Fraser GE, Haddad EH. Animal-protein intake is associated with insulin resistance in Adventist Health Study 2 (AHS-2) calibration substudy participants: a cross-sectional analysis. Curr Dev Nutr. 2017;1:e000299. [DOI] [PMC free article] [PubMed] [Google Scholar]
- 19. Tian S, Xu Q, Jiang R, Han T, Sun C, Na L. Dietary protein consumption and the risk of type 2 diabetes: a systematic review and meta-analysis of cohort studies. Nutrients. 2017;9:982. [DOI] [PMC free article] [PubMed] [Google Scholar]
- 20. Fan M, Li Y, Wang C, Mao Z, Zhou W, Zhang L, Yang X, Cui S, Li L. Dietary protein consumption and the risk of type 2 diabetes: a dose-response meta-analysis of prospective studies. Nutrients. 2019;11:2783. [DOI] [PMC free article] [PubMed] [Google Scholar]
- 21. Zhao L-G, Zhang Q-L, Liu X-L, Wu H, Zheng J-L, Xiang Y-B. Dietary protein intake and risk of type 2 diabetes: a dose–response meta-analysis of prospective studies. Eur J Nutr. 2019;58:1351–67. [DOI] [PubMed] [Google Scholar]
- 22. Chen Z, Glisic M, Song M, Aliahmad HA, Zhang X, Moumdjian AC, Gonzalez-Jaramillo V, van der Schaft N, Bramer WM, Ikram MAet al. Dietary protein intake and all-cause and cause-specific mortality: results from the Rotterdam Study and a meta-analysis of prospective cohort studies. Eur J Epidemiol. 2020;35:411–29. [DOI] [PMC free article] [PubMed] [Google Scholar]
- 23. Qi X-X, Shen P. Associations of dietary protein intake with all-cause, cardiovascular disease, and cancer mortality: a systematic review and meta-analysis of cohort studies. Nutr Metab Cardiovasc Dis. 2020;30:1094–105. [DOI] [PubMed] [Google Scholar]
- 24. Shang X, Scott D, Hodge AM, English DR, Giles GG, Ebeling PR, Sanders KM. Dietary protein intake and risk of type 2 diabetes: results from the Melbourne Collaborative Cohort Study and a meta-analysis of prospective studies. Am J Clin Nutr. 2016;104:1352–65. [DOI] [PubMed] [Google Scholar]
- 25. Naghshi S, Sadeghi O, Willett WC, Esmaillzadeh A. Dietary intake of total, animal, and plant proteins and risk of all cause, cardiovascular, and cancer mortality: systematic review and dose-response meta-analysis of prospective cohort studies. BMJ. 2020;370:m2412. [DOI] [PMC free article] [PubMed] [Google Scholar]
- 26. Ascherio A, Rimm EB, Stampfer MJ, Giovannucci EL, Willett WC. Dietary intake of marine n-3 fatty acids, fish intake, and the risk of coronary disease among men. N Engl J Med. 1995;332:977–83. [DOI] [PubMed] [Google Scholar]
- 27. Camilleri GM, Verger EO, Huneau J-F, Carpentier F, Dubuisson C, Mariotti F. Plant and animal protein intakes are differently associated with nutrient adequacy of the diet of French adults. J Nutr. 2013;143:1466–73. [DOI] [PubMed] [Google Scholar]
- 28. Bianchi CM, Egnell M, Huneau J-F, Mariotti F. Plant protein intake and dietary diversity are independently associated with nutrient adequacy in French adults. J Nutr. 2016;146:2351–60. [DOI] [PubMed] [Google Scholar]
- 29. Mariotti F. Animal and plant protein sources and cardiometabolic health. Adv Nutr. 2019;10:S351–66. [DOI] [PMC free article] [PubMed] [Google Scholar]
- 30. Mariotti F, Huneau J-F. Plant and animal protein intakes are differentially associated with large clusters of nutrient intake that may explain part of their complex relation with CVD risk. Adv Nutr. 2016;7:559–60. [DOI] [PMC free article] [PubMed] [Google Scholar]
- 31. Richter CK, Skulas-Ray AC, Champagne CM, Kris-Etherton PM. Plant protein and animal proteins: do they differentially affect cardiovascular disease risk?. Adv Nutr. 2015;6:712–28. [DOI] [PMC free article] [PubMed] [Google Scholar]
- 32. Haytowitz D, Ahuja J, Wu X, Khan M, Somanchi M, Nickle M, Nguyen QA, Roseland J, Williams J, Patterson Ket al. USDA National Nutrient Database for Standard Reference, Legacy. USA: US Department of Agriculture; 2018. [Google Scholar]
- 33. Rodrigues-Krause J, Krause M, Rocha IMG, Umpierre D, Fayh APT. Association of L-arginine supplementation with markers of endothelial function in patients with cardiovascular or metabolic disorders: a systematic review and meta-analysis. Nutrients. 2019;11:15. [DOI] [PMC free article] [PubMed] [Google Scholar]
- 34. Mariotti F. Arginine supplementation and cardiometabolic risk. Curr Opin Clin Nutr Metab Care. 2020;23:29–34. [DOI] [PubMed] [Google Scholar]
- 35. Newgard CB. Interplay between lipids and branched-chain amino acids in development of insulin resistance. Cell Metab. 2012;15:606–14. [DOI] [PMC free article] [PubMed] [Google Scholar]
- 36. Newgard CB, An J, Bain JR, Muehlbauer MJ, Stevens RD, Lien LF, Haqq AM, Shah SH, Arlotto M, Slentz CAet al. A branched-chain amino acid-related metabolic signature that differentiates obese and lean humans and contributes to insulin resistance. Cell Metab. 2009;9:311–26. [DOI] [PMC free article] [PubMed] [Google Scholar]
- 37. Ulaszewska MM, Weinert CH, Trimigno A, Portmann R, Lacueva CA, Badertscher R, Brennan L, Brunius C, Bub A, Capozzi Fet al. Nutrimetabolomics: an integrative action for metabolomic analyses in human nutritional studies. Mol Nutr Food Res. 2019;63:1800384. [DOI] [PubMed] [Google Scholar]
- 38. Brennan L, Hu FB. Metabolomics-based dietary biomarkers in nutritional epidemiology-current status and future opportunities. Mol Nutr Food Res. 2019;63:1701064. [DOI] [PubMed] [Google Scholar]
- 39. Gao Q, Praticò G, Scalbert A, Vergères G, Kolehmainen M, Manach C, Brennan L, Afman LA, Wishart DS, Andres-Lacueva Cet al. A scheme for a flexible classification of dietary and health biomarkers. Genes Nutr. 2017;12:34. [DOI] [PMC free article] [PubMed] [Google Scholar]
- 40. Naska A, Lagiou A, Lagiou P. Dietary assessment methods in epidemiological research: current state of the art and future prospects. F1000Research. 2017;6:926. [DOI] [PMC free article] [PubMed] [Google Scholar]
- 41. Zhubi-Bakija F, Bajraktari G, Bytyçi I, Mikhailidis DP, Henein MY, Latkovskis G, Rexhaj Z, Zhubi E, Banach M, Alnouri Fet al. The impact of type of dietary protein, animal versus vegetable, in modifying cardiometabolic risk factors: a position paper from the International Lipid Expert Panel (ILEP). Clin Nutr. 2021;40:255–76. [DOI] [PubMed] [Google Scholar]
- 42. Hernández-Alonso P, Becerra-Tomás N, Papandreou C, Bulló M, Guasch-Ferré M, Toledo E, Ruiz-Canela M, Clish CB, Corella D, Dennis Cet al. Plasma metabolomics profiles were associated with the amount and source of protein intake: a metabolomics approach within the PREDIMED study. Mol Nutr Food Res. 2020;64:2000178. [DOI] [PMC free article] [PubMed] [Google Scholar]
- 43. Shan Z, Rehm CD, Rogers G, Ruan M, Wang DD, Hu FB, Mozaffarian D, Zhang FF, Bhupathiraju SN. Trends in dietary carbohydrate, protein, and fat intake and diet quality among US adults, 1999–2016. JAMA. 2019;322:1178–87. [DOI] [PMC free article] [PubMed] [Google Scholar]
- 44. Halkjær J, Olsen A, Bjerregaard LJ, Deharveng G, Tjønneland A, Welch AA, Crowe FL, Wirfält E, Hellstrom V, Niravong Met al. Intake of total, animal and plant proteins, and their food sources in 10 countries in the European Prospective Investigation into Cancer and Nutrition. Eur J Clin Nutr. 2009;63:S16–36. [DOI] [PubMed] [Google Scholar]
- 45. Salomé M, de Gavelle E, Dufour A, Dubuisson C, Volatier J-L, Fouillet H, Huneau J-F, Mariotti F. Plant-protein diversity is critical to ensuring the nutritional adequacy of diets when replacing animal with plant protein: observed and modeled diets of French adults (INCA3). J Nutr. 2020;150:536–45. [DOI] [PubMed] [Google Scholar]
- 46. Allès B, Baudry J, Méjean C, Touvier M, Péneau S, Hercberg S, Kesse-Guyot E. Comparison of sociodemographic and nutritional characteristics between self-reported vegetarians, vegans, and meat-eaters from the NutriNet-Santé study. Nutrients. 2017;9:1023. [DOI] [PMC free article] [PubMed] [Google Scholar]
- 47. Rizzo NS, Jaceldo-Siegl K, Sabate J, Fraser GE. Nutrient profiles of vegetarian and non vegetarian dietary patterns. J Acad Nutr Diet. 2013;113:1610–19. [DOI] [PMC free article] [PubMed] [Google Scholar]
- 48. Schmidt JA, Rinaldi S, Scalbert A, Ferrari P, Achaintre D, Gunter MJ, Appleby PN, Key TJ, Travis RC. Plasma concentrations and intakes of amino acids in male meat-eaters, fish-eaters, vegetarians and vegans: a cross-sectional analysis in the EPIC-Oxford cohort. Eur J Clin Nutr. 2016;70:306–12. [DOI] [PMC free article] [PubMed] [Google Scholar]
- 49. Willett WC, Sacks F, Trichopoulou A, Drescher G, Ferro-Luzzi A, Helsing E, Trichopoulos D. Mediterranean diet pyramid: a cultural model for healthy eating. Am J Clin Nutr. 1995;61:1402S–6S. [DOI] [PubMed] [Google Scholar]
- 50. Xu J, Yang S, Cai S, Dong J, Li X, Chen Z. Identification of biochemical changes in lactovegetarian urine using 1H NMR spectroscopy and pattern recognition. Anal Bioanal Chem. 2010;396:1451–63. [DOI] [PubMed] [Google Scholar]
- 51. Schmidt JA, Rinaldi S, Ferrari P, Carayol M, Achaintre D, Scalbert A, Cross AJ, Gunter MJ, Fensom GK, Appleby PNet al. Metabolic profiles of male meat eaters, fish eaters, vegetarians, and vegans from the EPIC-Oxford cohort. Am J Clin Nutr. 2015;102:1518–26. [DOI] [PMC free article] [PubMed] [Google Scholar]
- 52. Wang F, Wan Y, Yin K, Wei Y, Wang B, Yu X, Ni Y, Zheng J, Huang T, Song Met al. Lower circulating branched-chain amino acid concentrations among vegetarians are associated with changes in gut microbial composition and function. Mol Nutr Food Res. 2019;63:1900612. [DOI] [PubMed] [Google Scholar]
- 53. Lindqvist HM, Rådjursöga M, Malmodin D, Winkvist A, Ellegård L. Serum metabolite profiles of habitual diet: evaluation by 1H-nuclear magnetic resonance analysis. Am J Clin Nutr. 2019;110:53–62. [DOI] [PMC free article] [PubMed] [Google Scholar]
- 54. Lindqvist HM, Rådjursöga M, Torstensson T, Jansson L, Ellegård L, Winkvist A. Urine metabolite profiles and nutrient intake based on 4-day weighed food diary in habitual vegans, vegetarians, and omnivores. J Nutr. 2021;151:30–9. [DOI] [PMC free article] [PubMed] [Google Scholar]
- 55. Playdon MC, Moore SC, Derkach A, Reedy J, Subar AF, Sampson JN, Albanes D, Gu F, Kontto J, Lassale Cet al. Identifying biomarkers of dietary patterns by using metabolomics. Am J Clin Nutr. 2017;105:450–65. [DOI] [PMC free article] [PubMed] [Google Scholar]
- 56. McCullough ML, Maliniak ML, Stevens VL, Carter BD, Hodge RA, Wang Y. Metabolomic markers of healthy dietary patterns in US postmenopausal women. Am J Clin Nutr. 2019;109:1439–51. [DOI] [PubMed] [Google Scholar]
- 57. Tong TYN, Koulman A, Griffin JL, Wareham NJ, Forouhi NG, Imamura F. A combination of metabolites predicts adherence to the Mediterranean diet pattern and its associations with insulin sensitivity and lipid homeostasis in the general population: the Fenland Study, United Kingdom. J Nutr. 2020;150:568–78. [DOI] [PMC free article] [PubMed] [Google Scholar]
- 58. Li J, Guasch-Ferré M, Chung W, Ruiz-Canela M, Toledo E, Corella D, Bhupathiraju SN, Tobias DK, Tabung FK, Hu Jet al. The Mediterranean diet, plasma metabolome, and cardiovascular disease risk. Eur Heart J. 2020;41:2645–56. [DOI] [PMC free article] [PubMed] [Google Scholar]
- 59. Walker ME, Song RJ, Xu X, Gerszten RE, Ngo D, Clish CB, Corlin L, Ma J, Xanthakis V, Jacques PFet al. Proteomic and metabolomic correlates of healthy dietary patterns: the Framingham Heart Study. Nutrients. 2020;12:1476. [DOI] [PMC free article] [PubMed] [Google Scholar]
- 60. Kim H, Hu EA, E Wong K, Yu B, Steffen LM, Seidelmann SB, Boerwinkle E, Coresh J, Rebholz CM. Serum metabolites associated with healthy diets in African Americans and European Americans. J Nutr. 2021;151:40–9. [DOI] [PMC free article] [PubMed] [Google Scholar]
- 61. O'Sullivan A, Gibney MJ, Brennan L. Dietary intake patterns are reflected in metabolomic profiles: potential role in dietary assessment studies. Am J Clin Nutr. 2011;93:314–21. [DOI] [PubMed] [Google Scholar]
- 62. Bhupathiraju SN, Guasch-Ferré M, Gadgil MD, Newgard CB, Bain JR, Muehlbauer MJ, Ilkayeva OR, Scholtens DM, Hu FB, Kanaya AMet al. Dietary patterns among Asian Indians living in the United States have distinct metabolomic profiles that are associated with cardiometabolic risk. J Nutr. 2018;148:1150–9. [DOI] [PMC free article] [PubMed] [Google Scholar]
- 63. Wei R, Ross AB, Su M, Wang J, Guiraud S-P, Draper CF, Beaumont M, Jia W, Martin F-P. Metabotypes related to meat and vegetable intake reflect microbial, lipid and amino acid metabolism in healthy people. Mol Nutr Food Res. 2018;62:1800583. [DOI] [PubMed] [Google Scholar]
- 64. Schmidt JA, Fensom GK, Rinaldi S, Scalbert A, Gunter MJ, Holmes MV, Key TJ, Travis RC. NMR metabolite profiles in male meat-eaters, fish-eaters, vegetarians and vegans, and comparison with MS metabolite profiles. Metabolites. 2021;11:121. [DOI] [PMC free article] [PubMed] [Google Scholar]
- 65. Stella C, Beckwith-Hall B, Cloarec O, Holmes E, Lindon JC, Powell J, van der Ouderaa F, Bingham S, Cross AJ, Nicholson JK. Susceptibility of human metabolic phenotypes to dietary modulation. J Proteome Res. 2006;5:2780–8. [DOI] [PubMed] [Google Scholar]
- 66. Andersen M-BS, Rinnan Å, Manach C, Poulsen SK, Pujos-Guillot E, Larsen TM, Astrup A, Dragsted LO. Untargeted metabolomics as a screening tool for estimating compliance to a dietary pattern. J Proteome Res. 2014;13:1405–18. [DOI] [PubMed] [Google Scholar]
- 67. Khakimov B, Poulsen SK, Savorani F, Acar E, Gürdeniz G, Larsen TM, Astrup A, Dragsted LO, Engelsen SB. New Nordic diet versus average Danish diet: a randomized controlled trial revealed healthy long-term effects of the new Nordic diet by GC–MS blood plasma metabolomics. J Proteome Res. 2016;15:1939–54. [DOI] [PubMed] [Google Scholar]
- 68. Acar E, Gürdeniz G, Khakimov B, Savorani F, Korndal SK, Larsen TM, Engelsen SB, Astrup A, Dragsted LO. Biomarkers of individual foods, and separation of diets using untargeted LC–MS-based plasma metabolomics in a randomized controlled trial. Mol Nutr Food Res. 2019;63:1800215. [DOI] [PubMed] [Google Scholar]
- 69. Vázquez-Fresno R, Llorach R, Urpi-Sarda M, Lupianez-Barbero A, Estruch R, Corella D, Fitó M, Arós F, Ruiz-Canela M, Salas-Salvadó Jet al. Metabolomic pattern analysis after Mediterranean diet intervention in a nondiabetic population: a 1- and 3-year follow-up in the PREDIMED study. J Proteome Res. 2015;14:531–40. [DOI] [PubMed] [Google Scholar]
- 70. Rådjursöga M, Lindqvist HM, Pedersen A, Karlsson BG, Malmodin D, Ellegård L, Winkvist A. Nutritional metabolomics: postprandial response of meals relating to vegan, lacto-ovo vegetarian, and omnivore diets. Nutrients. 2018;10:1063. [DOI] [PMC free article] [PubMed] [Google Scholar]
- 71. Meslier V, Laiola M, Roager HM, Filippis FD, Roume H, Quinquis B, Giacco R, Mennella I, Ferracane R, Pons Net al. Mediterranean diet intervention in overweight and obese subjects lowers plasma cholesterol and causes changes in the gut microbiome and metabolome independently of energy intake. Gut. 2020;69:1258–68. [DOI] [PMC free article] [PubMed] [Google Scholar]
- 72. Demir D, Lin S, Harald B, Frida C, Charlotte S, Otto S, Yang C, Fredrik B, Valentina T, Rikard Let al. Effects of a vegetarian diet on cardiometabolic risk factors, gut microbiota, and plasma metabolome in subjects with ischemic heart disease: a randomized, crossover study. J Am Heart Assoc. 2020;9:e016518. [DOI] [PMC free article] [PubMed] [Google Scholar]
- 73. OCEBM Levels of Evidence Working Group . The Oxford levels of evidence 2. Oxford Centre for Evidence-Based Medicine. Available from: https://www.cebm.ox.ac.uk/resources/levels-of-evidence/ocebm-levels-of-evidence. [Google Scholar]
- 74. Cuparencu C, Praticó G, Hemeryck LY, Sri Harsha PSC, Noerman S, Rombouts C, Xi M, Vanhaecke L, Hanhineva K, Brennan Let al. Biomarkers of meat and seafood intake: an extensive literature review. Genes Nutr. 2019;14:35. [DOI] [PMC free article] [PubMed] [Google Scholar]
- 75. Temellini A, Mogavero S, Giulianotti PC, Pietrabissa A, Mosca F, Pacifici GM. Conjugation of benzoic acid with glycine in human liver and kidney: a study on the interindividual variability. Xenobiotica. 1993;23:1427–33. [DOI] [PubMed] [Google Scholar]
- 76. Walsh MC, Brennan L, Pujos-Guillot E, Sébédio J-L, Scalbert A, Fagan A, Higgins DG, Gibney MJ. Influence of acute phytochemical intake on human urinary metabolomic profiles. Am J Clin Nutr. 2007;86:1687–93. [DOI] [PubMed] [Google Scholar]
- 77. Neinast M, Murashige D, Arany Z. Branched chain amino acids. Annu Rev Physiol. 2019;81:139–64. [DOI] [PMC free article] [PubMed] [Google Scholar]
- 78. Cheng S, Rhee EP, Larson MG, Lewis GD, McCabe EL, Shen D, Palma MJ, Roberts LD, Dejam A, Souza ALet al. Metabolite profiling identifies pathways associated with metabolic risk in humans. Circulation. 2012;125:2222–31. [DOI] [PMC free article] [PubMed] [Google Scholar]
- 79. Ho JE, Larson MG, Ghorbani A, Cheng S, Chen M-H, Keyes M, Rhee EP, Clish CB, Vasan RS, Gerszten REet al. Metabolomic profiles of body mass index in the Framingham Heart Study reveal distinct cardiometabolic phenotypes. PLoS One. 2016;11:e0148361. [DOI] [PMC free article] [PubMed] [Google Scholar]
- 80. Liu J, Klinken JB, Semiz S, Dijk KW, Verhoeven A, Hankemeier T, Harms AC, Sijbrands E, Sheehan NA, Duijn CMet al. A Mendelian randomization study of metabolite profiles, fasting glucose, and type 2 diabetes. Diabetes. 2017;66:2915–26. [DOI] [PubMed] [Google Scholar]
- 81. Rangel-Huerta OD, Pastor-Villaescusa B, Gil A. Are we close to defining a metabolomic signature of human obesity? A systematic review of metabolomics studies. Metabolomics. 2019;15:93. [DOI] [PMC free article] [PubMed] [Google Scholar]
- 82. Shaham O, Wei R, Wang TJ, Ricciardi C, Lewis GD, Vasan RS, Carr SA, Thadhani R, Gerszten RE, Mootha VK. Metabolic profiling of the human response to a glucose challenge reveals distinct axes of insulin sensitivity. Mol Syst Biol. 2008;4:214. [DOI] [PMC free article] [PubMed] [Google Scholar]
- 83. Huffman KM, Shah SH, Stevens RD, Bain JR, Muehlbauer M, Slentz CA, Tanner CJ, Kuchibhatla M, Houmard JA, Newgard CBet al. Relationships between circulating metabolic intermediates and insulin action in overweight to obese, inactive men and women. Diabetes Care. 2009;32:1678–83. [DOI] [PMC free article] [PubMed] [Google Scholar]
- 84. Tai ES, Tan MLS, Stevens RD, Low YL, Muehlbauer MJ, Goh DLM, Ilkayeva OR, Wenner BR, Bain JR, Lee JJMet al. Insulin resistance is associated with a metabolic profile of altered protein metabolism in Chinese and Asian-Indian men. Diabetologia. 2010;53:757–67. [DOI] [PMC free article] [PubMed] [Google Scholar]
- 85. Batch BC, Shah SH, Newgard CB, Turer CB, Haynes C, Bain JR, Muehlbauer M, Patel MJ, Stevens RD, Appel LJet al. Branched chain amino acids are novel biomarkers for discrimination of metabolic wellness. Metabolism. 2013;62:961–9. [DOI] [PMC free article] [PubMed] [Google Scholar]
- 86. Kim JY, Park JY, Kim OY, Ham BM, Kim H-J, Kwon DY, Jang Y, Lee JH. Metabolic profiling of plasma in overweight/obese and lean men using ultra performance liquid chromatography and Q-TOF mass spectrometry (UPLC−Q-TOF MS). J Proteome Res. 2010;9:4368–75. [DOI] [PubMed] [Google Scholar]
- 87. Butte NF, Liu Y, Zakeri IF, Mohney RP, Mehta N, Voruganti VS, Göring H, Cole SA, Comuzzie AG. Global metabolomic profiling targeting childhood obesity in the Hispanic population. Am J Clin Nutr. 2015;102:256–67. [DOI] [PMC free article] [PubMed] [Google Scholar]
- 88. Perng W, Gillman MW, Fleisch AF, Michalek RD, Watkins SM, Isganaitis E, Patti M-E, Oken E. Metabolomic profiles and childhood obesity. Obesity. 2014;22:2570–8. [DOI] [PMC free article] [PubMed] [Google Scholar]
- 89. McCormack SE, Shaham O, McCarthy MA, Deik AA, Wang TJ, Gerszten RE, Clish CB, Mootha VK, Grinspoon SK, Fleischman A. Circulating branched-chain amino acid concentrations are associated with obesity and future insulin resistance in children and adolescents. Pediatr Obesity. 2013;8:52–61. [DOI] [PMC free article] [PubMed] [Google Scholar]
- 90. Lee A, Jang HB, Ra M, Choi Y, Lee H-J, Park JY, Kang JH, Park K-H, Park SI, Song J. Prediction of future risk of insulin resistance and metabolic syndrome based on Korean boy's metabolite profiling. Obesity Res Clin Pract. 2015;9:336–45. [DOI] [PubMed] [Google Scholar]
- 91. Wang SM, Yang RY, Wang M, Ji FS, Li HX, Tang YM, Chen WX, Dong J. Identification of serum metabolites associated with obesity and traditional risk factors for metabolic disease in Chinese adults. Nutr Metab Cardiovasc Dis. 2018;28:112–18. [DOI] [PubMed] [Google Scholar]
- 92. Yu H-T, Fu X-Y, Xu B, Zuo L-L, Ma H-B, Wang S-R. Untargeted metabolomics approach (UPLC-Q-TOF-MS) explores the biomarkers of serum and urine in overweight/obese young men. Asia Pac J Clin Nutr. 2018;27:1067–76. [DOI] [PubMed] [Google Scholar]
- 93. Guasch-Ferré M, Hruby A, Toledo E, Clish CB, Martínez-González MA, Salas-Salvadó J, Hu FB. Metabolomics in prediabetes and diabetes: a systematic review and meta-analysis. Diabetes Care. 2016;39:833–46. [DOI] [PMC free article] [PubMed] [Google Scholar]
- 94. Sun Y, Gao H-Y, Fan Z-Y, He Y, Yan Y-X. Metabolomics signatures in type 2 diabetes: a systematic review and integrative analysis. J Clin Endocrinol Metab. 2020;105:1000–8. [DOI] [PubMed] [Google Scholar]
- 95. Shah SH, Bain JR, Muehlbauer MJ, Stevens RD, Crosslin DR, Haynes C, Dungan J, Newby LK, Hauser ER, Ginsburg GSet al. Association of a peripheral blood metabolic profile with coronary artery disease and risk of subsequent cardiovascular events. Circ Cardiovasc Genet. 2010;3:207–14. [DOI] [PubMed] [Google Scholar]
- 96. Bhattacharya S, Granger CB, Craig D, Haynes C, Bain J, Stevens RD, Hauser ER, Newgard CB, Kraus WE, Newby LKet al. Validation of the association between a branched chain amino acid metabolite profile and extremes of coronary artery disease in patients referred for cardiac catheterization. Atherosclerosis. 2014;232:191–6. [DOI] [PMC free article] [PubMed] [Google Scholar]
- 97. Würtz P, Havulinna AS, Soininen P, Tynkkynen T, Prieto-Merino D, Tillin T, Ghorbani A, Artati A, Wang Q, Tiainen Met al. Metabolite profiling and cardiovascular event risk: a prospective study of 3 population-based cohorts. Circulation. 2015;131:774–85. [DOI] [PMC free article] [PubMed] [Google Scholar]
- 98. Tobias DK, Mora S, Verma S, Lawler PR. Altered branched chain amino acid metabolism: toward a unifying cardiometabolic hypothesis. Curr Opin Cardiol. 2018;33:558–64. [DOI] [PMC free article] [PubMed] [Google Scholar]
- 99. Shah SH, Sun J-L, Stevens RD, Bain JR, Muehlbauer MJ, Pieper KS, Haynes C, Hauser ER, Kraus WE, Granger CBet al. Baseline metabolomic profiles predict cardiovascular events in patients at risk for coronary artery disease. Am Heart J. 2012;163:844–50, e1. [DOI] [PubMed] [Google Scholar]
- 100. Rizza S, Copetti M, Rossi C, Cianfarani MA, Zucchelli M, Luzi A, Pecchioli C, Porzio O, Di Cola G, Urbani Aet al. Metabolomics signature improves the prediction of cardiovascular events in elderly subjects. Atherosclerosis. 2014;232:260–4. [DOI] [PubMed] [Google Scholar]
- 101. Guasch-Ferré M, Zheng Y, Ruiz-Canela M, Hruby A, Martínez-González MA, Clish CB, Corella D, Estruch R, Ros E, Fitó Met al. Plasma acylcarnitines and risk of cardiovascular disease: effect of Mediterranean diet interventions. Am J Clin Nutr. 2016;103:1408. [DOI] [PMC free article] [PubMed] [Google Scholar]
- 102. Yang Q, Vijayakumar A, Kahn BB. Metabolites as regulators of insulin sensitivity and metabolism. Nat Rev Mol Cell Biol. 2018;19:654–72. [DOI] [PMC free article] [PubMed] [Google Scholar]
- 103. Jang C, Oh SF, Wada S, Rowe GC, Liu L, Chan MC, Rhee J, Hoshino A, Kim B, Ibrahim Aet al. A branched-chain amino acid metabolite drives vascular fatty acid transport and causes insulin resistance. Nat Med. 2016;22:421–6. [DOI] [PMC free article] [PubMed] [Google Scholar]
- 104. Mardinoglu A, Gogg S, Lotta LA, Stančáková A, Nerstedt A, Boren J, Blüher M, Ferrannini E, Langenberg C, Wareham NJet al. Elevated plasma levels of 3-hydroxyisobutyric acid are associated with incident type 2 diabetes. EBioMedicine. 2018;27:151–5. [DOI] [PMC free article] [PubMed] [Google Scholar]
- 105. Ferrannini E, Natali A, Camastra S, Nannipieri M, Mari A, Adam K-P, Milburn MV, Kastenmüller G, Adamski J, Tuomi Tet al. Early metabolic markers of the development of dysglycemia and type 2 diabetes and their physiological significance. Diabetes. 2013;62:1730–7. [DOI] [PMC free article] [PubMed] [Google Scholar]
- 106. Tricò D, Prinsen H, Giannini C, de Graaf R, Juchem C, Li F, Caprio S, Santoro N, Herzog RI. Elevated α-hydroxybutyrate and branched-chain amino acid levels predict deterioration of glycemic control in adolescents. J Clin Endocrinol Metab. 2017;102:2473–81. [DOI] [PMC free article] [PubMed] [Google Scholar]
- 107. Gall WE, Beebe K, Lawton KA, Adam K-P, Mitchell MW, Nakhle PJ, Ryals JA, Milburn MV, Nannipieri M, Camastra Set al. α-Hydroxybutyrate is an early biomarker of insulin resistance and glucose intolerance in a nondiabetic population. PLoS One. 2010;5:e10883. [DOI] [PMC free article] [PubMed] [Google Scholar]
- 108. Nebl J, Drabert K, Haufe S, Wasserfurth P, Eigendorf J, Tegtbur U, Hahn A, Tsikas D. Exercise-induced oxidative stress, nitric oxide and plasma amino acid profile in recreational runners with vegetarian and non-vegetarian dietary patterns. Nutrients. 2019;11:1875. [DOI] [PMC free article] [PubMed] [Google Scholar]
- 109. Altorf-van der Kuil W, Brink EJ, Boetje M, Siebelink E, Bijlsma S, Engberink MF, Veer, P't, Tomé D, Bakker SJL, van Baak MAet al. Identification of biomarkers for intake of protein from meat, dairy products and grains: a controlled dietary intervention study. Br J Nutr. 2013;110:810–22. [DOI] [PubMed] [Google Scholar]
- 110. Draper CF, Vassallo I, Di Cara A, Milone C, Comminetti O, Monnard I, Godin J-P, Scherer M, Su M, Jia Wet al. A 48-hour vegan diet challenge in healthy women and men induces a branch-chain amino acid related, health associated, metabolic signature. Mol Nutr Food Res. 2018;62:1700703. [DOI] [PubMed] [Google Scholar]
- 111. Wittenbecher C, Mühlenbruch K, Kröger J, Jacobs S, Kuxhaus O, Floegel A, Fritsche A, Pischon T, Prehn C, Adamski Jet al. Amino acids, lipid metabolites, and ferritin as potential mediators linking red meat consumption to type 2 diabetes. Am J Clin Nutr. 2015;101:1241–50. [DOI] [PubMed] [Google Scholar]
- 112. Okekunle AP, Li Y, Liu L, Du S, Wu X, Chen Y, Li Y, Qi J, Sun C, Feng R. Abnormal circulating amino acid profiles in multiple metabolic disorders. Diabetes Res Clin Pract. 2017;132:45–58. [DOI] [PubMed] [Google Scholar]
- 113. Carayol M, Leitzmann MF, Ferrari P, Zamora-Ros R, Achaintre D, Stepien M, Schmidt JA, Travis RC, Overvad K, Tjønneland Aet al. Blood metabolic signatures of body mass index: a targeted metabolomics study in the EPIC cohort. J Proteome Res. 2017;16:3137–46. [DOI] [PMC free article] [PubMed] [Google Scholar]
- 114. Zheng Y, Hu FB, Ruiz-Canela M, Clish CB, Dennis C, Salas-Salvado J, Hruby A, Liang L, Toledo E, Corella Det al. Metabolites of glutamate metabolism are associated with incident cardiovascular events in the PREvención con DIeta MEDiterránea (PREDIMED) trial. J Am Heart Assoc Cardiovasc Cerebrovasc Dis. 2016;5:e003755. [DOI] [PMC free article] [PubMed] [Google Scholar]
- 115. Vaarhorst AAM, Verhoeven A, Weller CM, Böhringer S, Göraler S, Meissner A, Deelder AM, Henneman P, Gorgels APM, van den Brandt PAet al. A metabolomic profile is associated with the risk of incident coronary heart disease. Am Heart J. 2014;168:45–52.e7. [DOI] [PubMed] [Google Scholar]
- 116. Kume S, Araki S, Ono N, Shinhara A, Muramatsu T, Araki H, Isshiki K, Nakamura K, Miyano H, Koya Det al. Predictive properties of plasma amino acid profile for cardiovascular disease in patients with type 2 diabetes. PLoS One. 2014;9:e101219. [DOI] [PMC free article] [PubMed] [Google Scholar]
- 117. Ding Y, Svingen GFT, Pedersen ER, Gregory JF, Ueland PM, Tell GS, Nygård OK. Plasma glycine and risk of acute myocardial infarction in patients with suspected stable angina pectoris. J Am Heart Assoc. 2015;5:e002621. [DOI] [PMC free article] [PubMed] [Google Scholar]
- 118. Wittemans LBL, Lotta LA, Oliver-Williams C, Stewart ID, Surendran P, Karthikeyan S, Day FR, Koulman A, Imamura F, Zeng Let al. Assessing the causal association of glycine with risk of cardio-metabolic diseases. Nat Commun. 2019;10:1060. [DOI] [PMC free article] [PubMed] [Google Scholar]
- 119. Durante W. The emerging role of L-glutamine in cardiovascular health and disease. Nutrients. 2019;11:2092. [DOI] [PMC free article] [PubMed] [Google Scholar]
- 120. Alves A, Bassot A, Bulteau A-L, Pirola L, Morio B. Glycine metabolism and its alterations in obesity and metabolic diseases. Nutrients. 2019;11:1356. [DOI] [PMC free article] [PubMed] [Google Scholar]
- 121. Tousoulis D, Kampoli A-M, Tentolouris C, Papageorgiou N, Stefanadis C. The role of nitric oxide on endothelial function. Curr Vasc Pharmacol. 2012;10:4–18. [DOI] [PubMed] [Google Scholar]
- 122. Darmaun D, Torres-Santiago L, Mauras N. Glutamine and type 1 diabetes mellitus: is there a role in glycemic control?. Curr Opin Clin Nutr Metab Care. 2019;22:91–5. [DOI] [PubMed] [Google Scholar]
- 123. Ren W, Xia Y, Chen S, Wu G, Bazer FW, Zhou B, Tan B, Zhu G, Deng J, Yin Y. Glutamine metabolism in macrophages: a novel target for obesity/type 2 diabetes. Adv Nutr. 2019;10:321–30. [DOI] [PMC free article] [PubMed] [Google Scholar]
- 124. Davalli AM, Perego C, Folli FB. The potential role of glutamate in the current diabetes epidemic. Acta Diabetol. 2012;49:167–83. [DOI] [PubMed] [Google Scholar]
- 125. Huang X-T, Li C, Peng X-P, Guo J, Yue S-J, Liu W, Zhao F-Y, Han J-Z, Huang Y-H, Yang-Liet al. An excessive increase in glutamate contributes to glucose-toxicity in β-cells via activation of pancreatic NMDA receptors in rodent diabetes. Sci Rep. 2017;7:44120. [DOI] [PMC free article] [PubMed] [Google Scholar]
- 126. Papandreou C, Moré M, Bellamine A. Trimethylamine N-oxide in relation to cardiometabolic health—cause or effect?. Nutrients. 2020;12:1330. [DOI] [PMC free article] [PubMed] [Google Scholar]
- 127. Crimarco A, Springfield S, Petlura C, Streaty T, Cunanan K, Lee J, Fielding-Singh P, Carter MM, Topf MA, Wastyk HCet al. A randomized crossover trial on the effect of plant-based compared with animal-based meat on trimethylamine-N-oxide and cardiovascular disease risk factors in generally healthy adults: Study With Appetizing Plantfood—Meat Eating Alternative Trial (SWAP-MEAT). Am J Clin Nutr. 2020;112:1188–99. [DOI] [PMC free article] [PubMed] [Google Scholar]
- 128. Wang Z, Bergeron N, Levison BS, Li XS, Chiu S, Jia X, Koeth RA, Li L, Wu Y, Tang WHWet al. Impact of chronic dietary red meat, white meat, or non-meat protein on trimethylamine N-oxide metabolism and renal excretion in healthy men and women. Eur Heart J. 2019;40:583–94. [DOI] [PMC free article] [PubMed] [Google Scholar]
- 129. Naghipour S, Cox AJ, Peart JN, Du Toit EF, Headrick JP. Trimethylamine-N-oxide: heart of the microbiota-cardiovascular disease nexus?. Nutr Res Rev. 2021;34(1):125–46. [DOI] [PubMed] [Google Scholar]
- 130. Schiattarella GG, Sannino A, Toscano E, Giugliano G, Gargiulo G, Franzone A, Trimarco B, Esposito G, Perrino C. Gut microbe-generated metabolite trimethylamine-N-oxide as cardiovascular risk biomarker: a systematic review and dose-response meta-analysis. Eur Heart J. 2017;38:2948–56. [DOI] [PubMed] [Google Scholar]
- 131. Yao M-E, Liao P-D, Zhao X-J, Wang L. Trimethylamine-N-oxide has prognostic value in coronary heart disease: a meta-analysis and dose-response analysis. BMC Cardiovasc Disord. 2020;20:7. [DOI] [PMC free article] [PubMed] [Google Scholar]
- 132. Farhangi MA, Vajdi M, Asghari-Jafarabadi M. Gut microbiota-associated metabolite trimethylamine N-oxide and the risk of stroke: a systematic review and dose–response meta-analysis. Nutr J. 2020;19:76. [DOI] [PMC free article] [PubMed] [Google Scholar]
- 133. Zhuang R, Ge X, Han L, Yu P, Gong X, Meng Q, Zhang Y, Fan H, Zheng L, Liu Zet al. Gut microbe–generated metabolite trimethylamine N-oxide and the risk of diabetes: a systematic review and dose-response meta-analysis. Obes Rev. 2019;20:883–94. [DOI] [PubMed] [Google Scholar]
- 134. Ge X, Zheng L, Zhuang R, Yu P, Xu Z, Liu G, Xi X, Zhou X, Fan H. The gut microbial metabolite trimethylamine N-oxide and hypertension risk: a systematic review and dose–response meta-analysis. Adv Nutr. 2020;11:66–76. [DOI] [PMC free article] [PubMed] [Google Scholar]
- 135. Dehghan P, Farhangi MA, Nikniaz L, Nikniaz Z, Asghari-Jafarabadi M. Gut microbiota-derived metabolite trimethylamine N-oxide (TMAO) potentially increases the risk of obesity in adults: an exploratory systematic review and dose-response meta-analysis. Obes Rev. 2020;21:e12993. [DOI] [PubMed] [Google Scholar]
- 136. Farhangi MA, Vajdi M. Novel findings of the association between gut microbiota–derived metabolite trimethylamine N-oxide and inflammation: results from a systematic review and dose-response meta-analysis. Crit Rev Food Sci Nutr. 2020;60(16):2801–23. [DOI] [PubMed] [Google Scholar]
- 137. Karimi G, Heidari Z, Firouzi S, Haghighatdoost F. A systematic review and meta-analysis of the association between fish consumption and risk of metabolic syndrome. Nutr Metab Cardiovasc Dis. 2020;30:717–29. [DOI] [PubMed] [Google Scholar]
- 138. Krittanawong C, Isath A, Hahn J, Wang Z, Narasimhan B, Kaplin SL, Jneid H, Virani SS, Tang WHW. Fish consumption and cardiovascular health: a systematic review. Am J Med. 2021;134:713–20. [DOI] [PubMed] [Google Scholar]
- 139. Nemet I, Saha PP, Gupta N, Zhu W, Romano KA, Skye SM, Cajka T, Mohan ML, Li L, Wu Yet al. A cardiovascular disease-linked gut microbial metabolite acts via adrenergic receptors. Cell. 2020;180:862–77..e22. [DOI] [PMC free article] [PubMed] [Google Scholar]
- 140. Ottosson F, Brunkwall L, Smith E, Orho-Melander M, Nilsson PM, Fernandez C, Melander O. The gut microbiota-related metabolite phenylacetylglutamine associates with increased risk of incident coronary artery disease. J Hypertens. 2020;38:2427–34. [DOI] [PubMed] [Google Scholar]
- 141. Shang X, Scott D, Hodge A, English DR, Giles GG, Ebeling PR, Sanders KM. Dietary protein from different food sources, incident metabolic syndrome and changes in its components: an 11-year longitudinal study in healthy community-dwelling adults. Clin Nutr. 2017;36:1540–8. [DOI] [PubMed] [Google Scholar]
- 142. Agus A, Planchais J, Sokol H. Gut microbiota regulation of tryptophan metabolism in health and disease. Cell Host Microbe. 2018;23:716–24. [DOI] [PubMed] [Google Scholar]
- 143. Roager HM, Licht TR. Microbial tryptophan catabolites in health and disease. Nat Commun. 2018;9:3294. [DOI] [PMC free article] [PubMed] [Google Scholar]
- 144. Glorieux G, Gryp T, Perna A. Gut-derived metabolites and their role in immune dysfunction in chronic kidney disease. Toxins. 2020;12:245. [DOI] [PMC free article] [PubMed] [Google Scholar]
- 145. Plata C, Cruz C, Cervantes LG, Ramírez V. The gut microbiota and its relationship with chronic kidney disease. Int Urol Nephrol. 2019;51:2209–26. [DOI] [PubMed] [Google Scholar]
- 146. Schwingshackl L, Hoffmann G, Lampousi A-M, Knüppel S, Iqbal K, Schwedhelm C, Bechthold A, Schlesinger S, Boeing H. Food groups and risk of type 2 diabetes mellitus: a systematic review and meta-analysis of prospective studies. Eur J Epidemiol. 2017;32:363–75. [DOI] [PMC free article] [PubMed] [Google Scholar]
- 147. Schwingshackl L, Schwedhelm C, Hoffmann G, Knüppel S, Iqbal K, Andriolo V, Bechthold A, Schlesinger S, Boeing H. Food groups and risk of hypertension: a systematic review and dose-response meta-analysis of prospective studies. Adv Nutr. 2017;8:793–803. [DOI] [PMC free article] [PubMed] [Google Scholar]
- 148. Schwingshackl L, Schwedhelm C, Hoffmann G, Lampousi A-M, Knüppel S, Iqbal K, Bechthold A, Schlesinger S, Boeing H. Food groups and risk of all-cause mortality: a systematic review and meta-analysis of prospective studies. Am J Clin Nutr. 2017;105:1462–73. [DOI] [PubMed] [Google Scholar]
- 149. Bechthold A, Boeing H, Schwedhelm C, Hoffmann G, Knüppel S, Iqbal K, Henauw SD, Michels N, Devleesschauwer B, Schlesinger Set al. Food groups and risk of coronary heart disease, stroke and heart failure: a systematic review and dose-response meta-analysis of prospective studies. Crit Rev Food Sci Nutr. 2019;59:1071–90. [DOI] [PubMed] [Google Scholar]
- 150. Schlesinger S, Neuenschwander M, Schwedhelm C, Hoffmann G, Bechthold A, Boeing H, Schwingshackl L. Food groups and risk of overweight, obesity, and weight gain: a systematic review and dose-response meta-analysis of prospective studies. Adv Nutr. 2019;10:205–18. [DOI] [PMC free article] [PubMed] [Google Scholar]
Associated Data
This section collects any data citations, data availability statements, or supplementary materials included in this article.