

Abstract
Multiple Myeloma (MM) arises from malignant transformation and deregulated proliferation of clonal plasma cells (PCs) harbouring heterogeneous molecular anomalies. The effect of evolving mutations on clone fitness and their cellular prevalence shapes the progressing myeloma genome and impacts clinical outcomes. Although clonal heterogeneity in MM is well established, which subclonal mutations emerge/persist/perish with progression in MM and which of these can be targeted therapeutically remains an open question. In line with this, we have sequenced pairwise whole exomes of 62 MM patients collected at two time points, i.e., at diagnosis and on progression. Somatic variants were called using a novel ensemble approach where a consensus was deduced from four variant callers (Illumina’s Dragen, Strelka2, SomaticSniper and SpeedSeq) and actionable/druggable gene targets were identified. A marked intraclonal heterogeneity was observed. Branching evolution was observed among 72.58% patients, of whom 64.51% had low TMBs (<10) and 61.29% had 2 or more founder clones. The hypermutator patients (with high TMB levels ≥10 to ≤100) showed a significant decrease in their TMBs from diagnosis (median TMB 77.11) to progression (median TMB 31.22). A distinct temporal fall in subclonal driver mutations was identified recurrently across diagnosis to progression e.g., in PABPC1, BRAF, KRAS, CR1, DIS3 and ATM genes in 3 or more patients suggesting such patients could be treated early with target specific drugs like Vemurafenib/Cobimetinib. An analogous rise in driver mutations was observed in KMT2C, FOXD4L1, SP140, NRAS and other genes. A few drivers such as FAT4, IGLL5 and CDKN1A retained consistent distribution patterns at two time points. These findings are clinically relevant and point at consideration of evaluating multi time point subclonal mutational landscapes for designing better risk stratification strategies and tailoring time to time risk adapted combination therapies in future.
Keywords: Multiple myeloma, NGS, exome sequencing, clonal evolution, driver genes, mutations, tumor mutation burden, progression
Introduction
Multiple Myeloma (MM) is a malignancy of clonal plasma cells that tend to evolve and accumulate as disease progresses from precursor transition states of monoclonal gammopathy of undetermined significance (MGUS)/Smoldering Multiple Myeloma (SMM) to active MM and ultimately Extramedullary disease/Plasma cell leukemia (PCL). Reservoir founder clones may exist prior to MGUS [1], which may become detectable and dominant with progression and gradually evolve into heterogeneous subclones. The process of subclonal propagation of PCs during myelomagenesis is complex and is driven under the influence of selection pressures exerted by immune surveillance, microenvironment and therapeutic agents.
Molecular mechanisms that underlie early progression in newly diagnosed MM patients who fail to respond to existing treatments are not completely understood. MM shows heterogeneity in terms of clinical phenotypes, rates of disease progression, response to therapy and survival outcomes, all of which are influenced by the underlying genomic complexity of the patient [2]. It is established that two types of primary oncogenic events are involved in initiation of myelomagenesis [3,4]. These include IgH translocations (found in ~55% patients) and hyperdiploidy of odd numbered chromosomes (observed at a frequency of ~40%). These two kinds of aberrations may coexist in ~10% of cases. A gamut of secondary events (mutations in RAS, NF-kB pathway, overexpression of MYC, haploinsufficiency of p53, (1q) gain and (1p) loss) are known to occur that provide further growth advantage to evolving (sub)clones, promote drug resistance, genome instability and progression. Deletion 13q is commonly found among non-hyperdiploid MM as well as in MGUS which suggests its role as a primary event during early oncogenesis of MM [5-7].
Based on mutational complexity and subclonal architecture, different patterns of clonal evolution have been reported in MM. The branching type of clonal evolution analogous to Darwinian model is the most frequent one and is found in ≥50% MM patients whereas linear or stable evolution with no significant alteration in subclonal architecture have been observed in ≤30% cases [8-10]. Analysis of WES data obtained from MM patients on IMiDs from UK Myeloma XI phase 3 trial and the CoMMpass study has revealed that 20% MM patients experienced neutral tumor evolution associated with poor prognosis while remaining 80% encountered branching evolution [11]. Patients with branching evolution may respond well to IMiDs as these can reconfigure bone marrow stromal cum immune microenvironment and prolong survival [11]. Instead, patients with neutral clonal evolution with random genetic drift may benefit from combinations of PIs with high dose melphalan [11,12].
Recent NGS studies conducted on pairwise myeloma genomes/exomes at two or more serial time points have reported presence of intraclonal heterogeneity during progression and relapse [1,7,8,12-21]. A series of somatic mutations including substitutions, indels and copy number variations emerge during disease progression that contour the pattern of clonal evolution. Numerous driver mutations have been identified in myeloma genome [17] that may co-evolve mutually in cooperation or exclusively either in same or different (sub)clones and modulate their net impact on clinical outcomes.
Although clonal heterogeneity in MM is well established, subclonal remodelling of gains/losses and rewiring of functional pathways are not completely understood. There is currently a paucity of data available on longitudinal subclonal evolution profiles associated with progression in MM and a deeper understanding is required to assess mutations of clinical relevance that could potentially be targeted for treatment in future therapeutic approaches against MM and its precursor states [11,22]. The progressing subclonal shifts are of paramount clinical significance as these could promote oncogenesis and lead to drug refractoriness. Estimation of their cellular prevalence could further predict likelihood of depth of response and a rationalized approach of combinatorial therapy. More and more longitudinal studies are needed to explore the progressing subclonal events and ultimately guide combinations of targeted therapy that can eradicate such subclonal populations and delay progression. Hence, we decided to conduct this study to capture subclonal mutational landscapes associated with progression of MM and identify potential actionable/druggable targets that can be treated with their corresponding drugs.
In this study, we have evaluated 186 pairwise whole exome sequences obtained from 62 MM patients at two time points representing tumor at diagnosis, tumor at progression and compared to their germline landscapes respectively using NGS. We have identified individual clonal genomic complexities, tumor mutation burdens (TMBs) and divergence of clusters of mutations in founder clones. This study has provided novel insights into recurrent subclonal shifts in drivers (DRV), oncogenes (ONC), tumor suppressor genes (TSGs) and the potential actionable targets (ACT) associated with progression of MM.
Materials and methods
This study was approved by the Institute Ethics Committee and conducted as per ethical guidelines. Voluntary written informed consent was obtained from all the study individuals.
Whole exome sequencing
Genomic DNA was isolated from CD138+ plasma cells enriched from bone marrow aspirates with MACS magnetic microbeads (Miltenyi Biotech, Germany), collected from 62 patients including 61 newly diagnosed treatment naïve MM patients and 1 MGUS (who later converted to MM at TP2) diagnosed as per IMWG guidelines (Table 1). Patients diagnosed and treated at our center from 2014 to 2019 in whom DNA samples were available prior to therapy and at the time of disease progression were included in this study. The patients were treated with triplet combination induction chemotherapy-VCD (bortezomib, cyclophosphamide and dexamethasone) or VTD (bortezomib, thalidomide, dexamethasone) or VRD (bortezomib, lenalidomide, dexamethasone) prior to time of progression. The median OS of the patient cohort was 152.5 weeks and median PFS was 87.21 weeks.
Table 1.
Baseline demographic, laboratory and clinical characteristics of multiple myeloma (MM) patients (n = 62)
| Parameter | No. of patients |
|---|---|
| Median Age (Range) In Years | 58 (31 to 72) |
| Gender | |
| Male | 38 |
| Female | 24 |
| Hemoglobin (g/dL) | |
| ≤10 | 39 |
| >10 | 23 |
| Platelet Count (/dL) | |
| <100 | 10 |
| ≥100 | 52 |
| Serum creatinine (mg/dL) | |
| ≤2 | 49 |
| >2 | 13 |
| Seruam albumin (g/dL) | |
| <3.5 | 30 |
| ≥3.5 | 32 |
| ISS 1/2/3 | 1/17/44 |
| RISS I/II/III/NA | 1/36/14/11 |
| MRS 1/2/3/NA | 7/33/21/1 |
| Serum calcium, mg/dL | |
| 0-11 | 54 |
| >11 | 8 |
| eGFR, mL/min | |
| <40 | 17 |
| ≥40 | 45 |
| IgG Isotype | |
| IgA | 14 |
| IgG | 37 |
| Light chain κ/λ | 11 |
| BM plasma cells, % | |
| ≤40 | 21 |
| >40 | 41 |
| Serum LDH (IU/L) | |
| ≤420 | 51 |
| >420 | 6 |
| NA | 5 |
| β2-microglobulin, mg/L | |
| <3.5 | 3 |
| ≥3.5 | 59 |
MRS = modified risk staging [52].
Whole exome sequencing (WES) was carried out on 186 DNA samples extracted from 62 MM patients collected at two time points- one prior to any therapy at diagnosis (Time Point 1 = TP1) and second at a follow up time point of disease progression (Time Point 2 = TP2). WES was also carried out on paired germline DNA obtained from peripheral blood mononuclear cells for all the patients.
For WES, DNA was extracted using Maxwell RSC cultured cells DNA kit (Promega, Wisconsin, USA) on automated nucleic acid extraction system (Promega, Wisconsin, USA). Prior to library construction, DNA was quantified fluorometrically with a DNA high sensitivity kit with Qubit (ThermoFisher Scientific, MA, USA). WES libraries were constructed from genomic DNA using the Nextera Exome kit (Illumina, San Diego, California, USA) which targets a genomic footprint of 62 Mb with >3,40,000, 95 mer probes. After quantification, the DNA was normalized to 10 ng/µl and a total of 50 ng DNA was tagmented with transposons. The tagmented DNA was purified from the transposome with sample purification beads. The purified tagmented DNA was subjected to a unique combination of dual index adapters and amplified with sequences required for cluster generation. After amplification, the DNA libraries were purified and the purified libraries containing unique indices were combined into a single pool using a 3-plex strategy. The target regions of interest in the purified libraries were hybridized with coding exome oligos and captured with streptavidin magnetic beads. The enriched libraries were eluted from the beads and subjected to a second round of hybridization with coding exome oligos. Final libraries were eluted and then quantified and evaluated for quality using DNA high sensitivity Qubit kit (ThermoFisher Scientific, MA, USA) and DNA HS Kit (Agilent Technologies, Santa Clara, USA) on Agilent Bioanalyser respectively. The size range of generated libraries was 200-500 bp. The resultant captured libraries were pooled, normalized following standard normalization method and paired-end sequencing was carried out using the Illumina cBot system and HiSeq SBS kit V4-250 cycles on HiSeq 2500 (Illumina).
Analysis of WES data
The overall workflow of data analysis is shown in Figure 1. Raw sequencing reads were quality checked using FastQC software (v0.11.4, http://www.bioinformatics.babraham.ac.uk/projects/fastqc/). The adapter sequences were removed using Trimmomatic software (v0.39, http://www.usadellab.org/cms/?page=trimmomatic). Illumina Dragen somatic pipeline (v3.5.7) was used to process the trimmed reads and aligned with human reference genome, hg19 available at UCSC (https://sapac.illumina.com/products/by-type/informatics-products/basespace-sequence-hub/apps/edico-genome-inc-dragen-somatic-pipeline.html).
Figure 1.
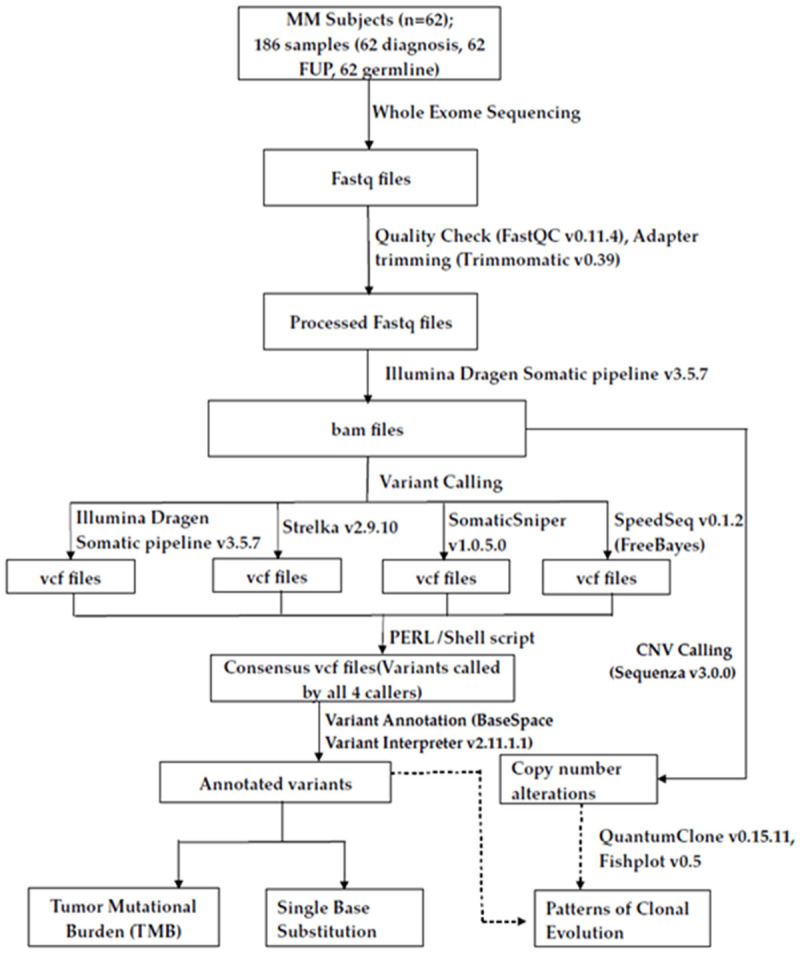
Workflow of study and data analysis. Analysis workflow of the WES study performed on 62 MM patients whose tumor PC samples were sequenced at diagnosis, at follow up and compared with their germline profiles. Fastq files were quality checked with FastQC, adaptors trimmed with Trimmomatic and processed further through Illumina Dragen Somatic pipeline for variant calling. Variants were validated with additional 3 variant callers (Strelka2, SomaticSniper and SpeedSeq), a consensus .vcf was derived and annotated with Variant Interpreter for deducing TMB and SBS. CNVs were identified with Sequenza and processed further with QuantumClone and Fishplot for interpretation of patterns of clonal evolution.
The tumor and normal bam files obtained from Illumina Dragen somatic pipeline were used for variant calling using three additional variant callers, Strelka v2.9.10 [23]; SomaticSniper v1.0.5.0 [24] and SpeedSeq v0.1.2 (FreeBayes) [25] in order to validate the variants called by Dragen somatic pipeline. Only those variants called by all the four callers and passed filters of base quality (≥20), mapping quality (≥20), tumor reads (≥10) and normal reads (≥5) qualified as a consensus. These validated variants were further annotated using BaseSpace Variant Interpreter (https://variantinterpreter.informatics.illumina.com/home).
Further, COSMIC database was explored for assignment of variant pathogenicity (Pathogenic/Neutral/Unknown). Variants predicted as Deleterious/Damaging/Pathogenic by any of the three tools (SIFT/PolyPhen/FATHMM) were considered as Pathogenic. For identification of CNVs, the .bam files of tumor and normal samples obtained from Illumina Dragen (v3.5.7) somatic pipeline were analyzed using Sequenza (https://cran.r-project.org/web/packages/sequenza/) package along with human reference .fasta file from UCSC (ucsc.hg19.fasta).
Variants identified were compared with MMRF CoMMPass Study database (www.themmrf.org). The mutated genes were classified as driver genes, oncogenes and tumor suppressor genes based on publicly available resources listed at cBioPortal [26,27] (https://www.cbioportal.org/); at intOgen (https://www.intogen.org/search) database [28]; OncoKB [29] (https://www.oncokb.org/) and as described by Walker et al., 2014 [17].
Potentially actionable targets were identified in this study based on repository of FDA approved on label or off-label drugs or those experimentally druggable compiled and listed in literature [30,31], at the TARGET (Tumor Alterations Relevant for Genomics driven Therapy) database of the Broad Institute (https://software.broadinstitute.org/cancer/cga/target) and the COSMIC actionability data v93 (https://cancer.sanger.ac.uk/cosmic). The TARGET database is a database of genes that when somatically altered in cancer, are directly linked to a clinical action. The tumor mutational burden (TMB) defined as the number of nonsynonymous mutations/Mb was calculated from average coverage with respect to total bases (3137161264) in binary mode and with reference to human genome (hg19). Clonal evolution patterns were evaluated using QuantumClone [32] and the cellular prevalence values Mark 1 were calculated as defined below (https://www.rdocumentation.org/packages/QuantumClone/versions/0.15.11) (Equation 1).
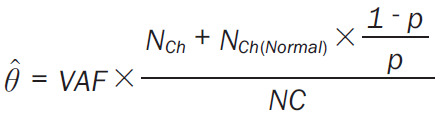 |
where NCh is the number of copies of the corresponding locus in cancer cells, NCh(Normal) is the number of copies of the corresponding locus in the normal cells (NCh(Normal) = 2 for autosomes) and NC is the number of chromosomal copies bearing the variant and p is the tumor purity.
The cellular prevalence values Mark 1 of each cluster obtained from QuantumClone were subjected to fishplot R package for visualization [33]. Cellular prevalence values higher than 1 were set to 1 as suggested [32]. Clonal patterns were classified as branching or linear or stable as described [13]. In case of branching evolution, both gain and loss of clones was observed. In case of linear evolution, there was gain of mutations but no clonal loss; while in stable progression, the clonal structure remained preserved at two time points. Stable with loss pattern had predominantly conserved clonal structure but there was also evidence of clonal loss at a subsequent time point. The biological pathways relating to altered clonal mutational profiles were deduced by gene enrichment analysis using Enrichr (https://maayanlab.cloud/Enrichr/) as described [34].
Statistical analysis
Clinical and biological characteristics of the patients were analysed using Chi-squared or Fisher’s exact test for discrete categorical variables as applicable. Nonparametric statistical analysis was carried out for continuous variables with Wilcoxon signed rank test. A P-value of <0.05 was considered statistically significant.
Results
Estimation of somatic mutations at two time points
A total of 13951 and 11684 nonsynonymous (NS) somatic mutations were identified in myeloma pairwise whole exomes sequenced at diagnosis (TP1) and at progression (TP2) respectively (Table 2). Among these, 4410 somatic mutations in TP1 and 3833 in TP2 were classifiable as pathogenic. At diagnosis, 10561 somatic mutations were missense type, 1227 belonged to 3’UTR, 1437 were in splicing sites and 538 mapped in 5’UTR regions. On progression, these reduced to 8996, 946, 1207 and 375 somatic mutations representing missense, 3’UTR, splicing and 5’UTR mutations, respectively.
Table 2.
A comparison of number of nonsynonymous (NS) somatic mutations, tumor mutation burden (TMB) and single base substitutions (SBS) in MM at diagnosis and on progression
| Type of somatic mutations | Time point | |
|---|---|---|
|
| ||
| TP1 (at Diagnosis) | TP2 (on progression) | |
| IN ALL SAMPLES (n = 59) | ||
| Number of somatic mutations | 13951 | 11684 |
| Number of known pathogenic somatic mutations | 4410 | 3833 |
| Number of Missense somatic mutations | 10561 | 8996 |
| Number of Nonsense somatic mutations | 188 | 160 |
| Number of somatic mutations in 3’UTR | 1227 | 946 |
| Number of somatic mutations at Splicing sites | 1437 | 1207 |
| Number of somatic mutations in 5’UTR | 538 | 375 |
| MEANS PER SAMPLE | ||
| Average number of somatic mutations/sample | 236.45 | 198.03 |
| Average number of Missense somatic mutations/sample | 179 | 152.47 |
| Average number of Nonsense somatic mutations/sample | 3.19 | 2.71 |
| Average number of somatic mutations in 3’UTR/sample | 20.80 | 16.03 |
| Average number of somatic mutations at Splicing sites/sample | 24.36 | 20.46 |
| Average number of somatic mutations in 5’UTR/sample | 9.12 | 6.36 |
| MEDIAN number of NS somatic mutations | 32 | 34 |
| Tumor Mutation Burden (TMB) | ||
| MEDIAN TMB | 0.85 | 0.93 |
| AVERAGE SBS IN ALL SAMPLES | ||
| C>T | 128.88 | 101.86 |
| T>C | 85.02 | 64.66 |
| C>A | 34.34 | 27.56 |
| C>G | 28.64 | 21.92 |
| T>G | 21.98 | 16.47 |
| T>A | 15.90 | 12.25 |
The average numbers of somatic mutations/sample at diagnosis totalled 236.45 at TP1 while 198.03 at TP2 (Table 2). At TP1, there were an average of 179 missense mutations/sample (152.47 at TP2), followed by 20.8 in 3’UTR (16.03 at TP2), 24.36 in splicing regions (20.46 at TP2), and 9.12 in 5’UTR region (6.36 at TP2). Patients with high somatic mutations may possess high neoantigen loads and may benefit from immunotherapies.
Tumor mutation burden declines from diagnosis to progression in hypermutators
Patients at diagnosis had an average tumor mutation burden (TMB) of 10.8 NS somatic mutations/Mb/sample (range 0.15 to 95) that reduced to 7.46 (range 0.03 to 105.47) on progression. The median TMB among patients at TP1 and TP2 were 0.85 and 0.93 respectively. The median TMB at two time points among patients with age at diagnosis ≤65 years (0.82 versus 0.76) and those with >65 years (1.62 versus 1.22) were comparable.
Patients were classified on the basis of their TMB levels at diagnosis as those with low TMB of ≤10 (n = 51) and high TMB levels ≥10 to ≤100 (n = 8) (i.e., hypermutators). Three patients (SM0007, SM0052 and SM0145) were outliers or super-hypermutators with ≥100 TMBs (134.43, 132.12 and 126.3 respectively) and were analyzed for clonal evolution exclusively. In particular, patients grouped into high TMB category (TMB levels ≥10 to ≤100) had median TMB levels at TP1 (77.11) that significantly reduced at TP2 (31.32; P = 0.039) (Figure 2). Hypermutators might sustain stable drug resistant clones and hence may benefit from combinations of IMiDs with novel therapeutics.
Figure 2.
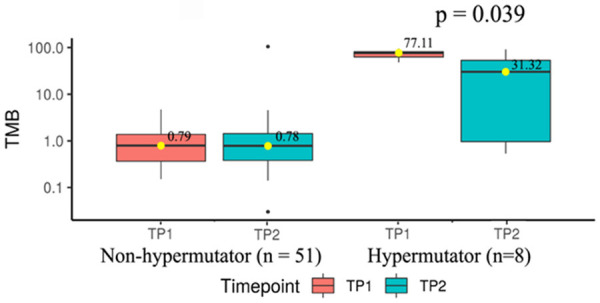
Changes in TMB at diagnosis and on progression. Comparison of median TMB across MM patients at TP1 and TP2 in non-hypermutator (n = 51) (TMB<10) versus hypermutator category (n = 8) (TMB between 10 and 100).
Comparison of frequencies of driver genes mutated at diagnosis versus progression
Table 3 summarizes number of mutated genes and mutations that were encountered in MM in this study. Out of 8977 total mutated genes that got shortlisted, 8869 were found to be mutated in some form of cancer while 7107 genes were identified to be mutated in MM among which 6690 genes have been reported in MMRF CoMMPass dataset. A set of 131 mutated genes turned out to be known oncogenes, 176 were established tumor suppressors, 320 were known drivers across different cancers while 72 genes were found to be known driver genes in the context of MM. Of all these genes harbouring somatic mutations in MM, 100 genes got classified as COSMIC candidate actionable targets.
Table 3.
Classification of genes harbouring NS somatic mutations and the variants observed in MM in this study
| Classification | Number of genes with mutations (n = 8977) | Number of mutations (n = 19022) |
|---|---|---|
| Known to be mutated in some cancer | 8869 | 18817 |
| Known to be mutated in MM | 7107 | 15864 |
| Mutated in MMRF CoMMPass study | 6690 | 15063 |
| Known oncogenes | 131 | 252 |
| Known tumor suppressor genes | 176 | 443 |
| Known to be driver genes in some cancer | 320 | 821 |
| Known to be driver genes in MM | 72 | 221 |
| Known as actionable (COSMIC) | 100 | 239 |
| Drivers with decreased frequencies on progression | 39 | 140 |
| Drivers with increased frequencies on progression | 12 | 36 |
| Drivers with constant frequencies both at diagnosis and on progression | 21 | 45 |
We screened the WES data for a total repertoire of 102 known driver genes for MM and found 72 driver genes to be mutated. We then analyzed which driver genes had subclonal gains or losses or remained stable with progression and arranged them in descending and ascending series (Figure 3). These drivers were further shortlisted to those that had topmost number of recurrent subclonal shifts and were observed in atleast 3 or more patients. Figure 3A shows topmost temporal falls in PABPC1, BRAF, KRAS, CR1, DIS3, ATM and other genes while Figure 3C shows topmost temporal increases that were observed in KMT2C, FOXD4L1, SP140 and NRAS. Similarly, Figure 3B shows the most recurrent drivers like FAT4 and IGLL5 that remained stable on progression. Contrasting mutational landscapes at diagnosis and at progression highlight the importance of their immediate monitoring prior to tailoring therapy.
Figure 3.
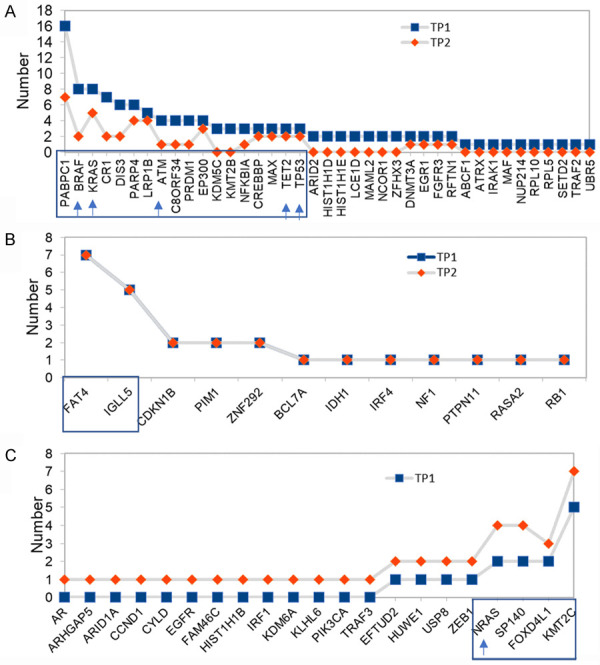
Temporal changes in distribution of driver genes on progression. Distribution of mutated driver genes in MM patients at TP1 and compared to TP2. (A) Falling mutated drivers whose frequencies decreased in TP2, (B) Drivers that are maintained at constant frequencies throughout the disease, and (C) Rising mutated drivers whose preponderance increased in patients at TP2. Driver mutation profiles observed in atleast 3 or more patients are shown inside boxed frames. Actionable genes are indicated by arrows on X axis.
Distribution of mutated potential actionable target genes at diagnosis and progression
As many as 19022 somatic mutations (Table 3) were observed at varying frequencies among 8977 genes in MM patients in this study. Of these, 18817 variants are known mutants in cancers of some kind, 15864 have been reported to be mutated in MM while 15063 have been described in MMRF dataset. These consisted of 821 mutations across drivers known to be associated with different cancers and 221 mutations in 72 driver genes (BRAF, SP140, EP300, FAT4, PABPC1, CREBBP, FOXD4L1, PRDM1, KMT2C, C8ORF34, NRAS, KRAS, DIS3, NFKBIA, LRP1B, IGLL5, ZNF292, ATM, CR1, PTPN11, BCL7A, CDKN1B, PARP4, RB1, MAX, NF1, EFTUD2, TP53, DNMT3A, RASA2, RFTN1, TET2, EGR1, HIST1H1E, PIM1, ZEB1, FAM46C, LCE1D, CCND1, MAML2, ARID2, ARID1A, TRAF3, ARHGAP5, USP8, CYLD, ZFHX3, MAF, NCOR1, RPL5, KMT2B, IDH1, PIK3CA, KLHL6, SETD2, FGFR3, IRF1, HIST1H1D, HIST1H1B, ABCF1, IRF4, EGFR, UBR5, NUP214, TRAF2, IRAK1, RPL10, KDM6A, KDM5C, HUWE1, AR, ATRX) known to be involved in MM. There were 252 somatic mutations in oncogenes, 443 in tumor suppressor genes and finally 239 variants were found across 100 potential actionable genes.
Table 4 summarizes a list of variations in 22 actionable target genes that were found mutated in atleast 3 patients at either or both time points. These consisted of BRAF, FANCM, MRE11, WRN, EXO1, FANCA, ALK, FANCD2, MSH3, NBN, NRAS, KRAS, FLT3 MAP2K1, PALB2, RAD51D, RAD51C, MERTK, KDR, RAD54B, FANCG, PTCH1. The most common actionable mutation was Val600Glu in BRAF that was most abundant at the time of diagnosis. Identification of druggable targets at subclonal levels could aid in treating patients with genome defined target specific drugs.
Table 4.
Frequency of variations in actionable genes observed in atleast 3 or more multiple myeloma patients
| VARIANT | REF | ALT | EXON | HGVSC | HGVSP | CONSEQUENCE | GENE | Number of patients with mutation | Count at TP1 | Count at TP2 |
|---|---|---|---|---|---|---|---|---|---|---|
| 7:140453136:T | A | T | 15/18 | c.1799T>A | p.(Val600Glu) | missense_variant | BRAF | 7 | 5 | 2 |
| 14:45606287:T | C | T | 2/23 | c.524C>T | p.(Ser175Phe) | missense_variant | FANCM | 6 | 5 | 1 |
| 14:45650900:G | A | G | 16/23 | c.4378A>G | p.(Ile1460Val) | missense_variant | FANCM | 6 | 5 | 1 |
| 14:45665468:G | C | G | 21/23 | c.5434C>G | p.(Pro1812Ala) | missense_variant | FANCM | 6 | 4 | 2 |
| 11:94212048:T | C | T | c.403-6G>A | splice_region_intron_variant | MRE11 | 5 | 2 | 3 | ||
| 8:30999280:T | G | T | 26/35 | c.3222G>T | p.(Leu1074Phe) | missense_variant | WRN | 5 | 3 | 2 |
| 1:242042301:A | G | A | 13/16 | c.1765G>A | p.(Glu589Lys) | missense_variant | EXO1 | 4 | 3 | 1 |
| 16:89836323:T | C | T | 26/43 | c.2426G>A | p.(Gly809Asp) | missense_variant | FANCA | 4 | 2 | 2 |
| 16:89849480:T | C | T | 16/43 | c.1501G>A | p.(Gly501Ser) | missense_variant | FANCA | 4 | 2 | 2 |
| 2:29416366:C | G | C | 29/29 | c.4587C>G | p.(Asp1529Glu) | missense_variant | ALK | 4 | 3 | 1 |
| 3:10088266:T | G | T | 15/43 | c.1137G>T | c.1137G>T (p.(Val379=)) | splice_region,synonymous_variant | FANCD2 | 4 | 1 | 3 |
| 3:10140671:A | G | A | 43/43 | c.*37G>A | 3_prime_UTR_variant | FANCD2 | 4 | 2 | 2 | |
| 3:10140696:G | A | G | 43/43 | c.*62A>G | 3_prime_UTR_variant | FANCD2 | 4 | 2 | 2 | |
| 5:79960955:A | G | A | c.359-7G>A | splice_region_intron_variant | MSH3 | 4 | 3 | 1 | ||
| 8:30999123:A | G | A | c.3138+7G>A | splice_region,intron_variant | WRN | 4 | 3 | 1 | ||
| 8:90958530:C | T | C | c.1915-7A>G | splice_region_intron_variant | NBN | 4 | 2 | 2 | ||
| 8:90990479:G | C | G | 5/16 | c.553G>C | p.(Glu185Gln) | missense_variant | NBN | 4 | 2 | 2 |
| 1:115256529:C | T | C | 3/7 | c.182A>G | p.(Gln61Arg) | missense_variant | NRAS | 3 | 1 | 2 |
| 12:25362777:G | A | G | 6/6 | c.*73T>C | 3_prime_UTR_variant | KRAS | 3 | 2 | 1 | |
| 12:25380275:G | T | G | 3/6 | c.183A>C | p.(Gln61His) | missense_variant | KRAS | 3 | 2 | 1 |
| 13:28610183:G | A | G | c.1310-3T>C | splice_region_intron_variant | FLT3 | 3 | 1 | 2 | ||
| 15:66782048:T | C | T | c.1023-8C>T | splice_region,intron_variant | MAP2K1 | 3 | 1 | 2 | ||
| 16:23646191:C | T | C | 4/13 | c.1676A>G | p.(Gln559Arg) | missense_variant | PALB2 | 3 | 2 | 1 |
| 17:33433487:T | C | T | 6/10 | c.494G>A | p.(Arg165Gln) | missense_variant | RAD51D | 3 | 2 | 1 |
| 17:56811608:G | C | G | 9/9 | c.*25C>G | 3_prime_UTR_variant | RAD51C | 3 | 2 | 1 | |
| 2:112686988:A | G | A | 2/19 | c.353G>A | p.(Ser118Asn) | missense_variant | MERTK | 3 | 2 | 1 |
| 2:29416481:C | T | C | 29/29 | c.4472A>G | p.(Lys1491Arg) | missense_variant | ALK | 3 | 2 | 1 |
| 3:10106532:T | C | T | 23/43 | c.2141C>T | p.(Pro714Leu) | missense_variant | FANCD2 | 3 | 2 | 1 |
| 4:55972974:A | T | A | 11/30 | c.1416A>T | p.(Gln472His) | missense_variant | KDR | 3 | 2 | 1 |
| 5:80168937:A | G | A | 23/24 | c.3133G>A | p.(Ala1045Thr) | missense_variant,splice_region_variant | MSH3 | 3 | 2 | 1 |
| 8:95479680:C | G | C | 2/15 | c.88C>G | p.(Leu30Val) | missense_variant | RAD54B | 3 | 2 | 1 |
| 9:35074917:C | T | C | c.1636+7A>G | splice_region,intron variant | FANCG | 3 | 3 | 0 | ||
| 9:98239147:G | A | G | c.1504-8T>C | splice_region,intron_variant | PTCH1 | 3 | 1 | 2 | ||
Comparison of single nucleotide substitutions at diagnosis and progression
As shown in Table 2, six types of single base substitutions (SBS) were observed. The SBS C>T was the most predominant form of mutation found both at TP1 (128.88; 40.94%) and TP2 (101.86; 41.63%) followed by T>C (85.02; 27.017% at TP1, 64.66; 26.42% at TP2), C>A (34.34; 10.9% at TP1, 27.56; 11.26% at TP2), C>G (28.64, 9.09% at TP1; 21.92, 8.95% at TP2), T>G (21.98, 6.98% at TP1; 16.47, 6.73% at TP2), T>A (15.9, 5.05% at TP1; 12.25, 5% at TP2).
Heterogeneity in clonal evolution
Three types of clonal evolutionary patterns with 1 to 3 founder clones were observed in this study (Figure 4). The branching pattern of clonal evolution was observed in maximum number of patients (45; 72.58%) followed by Linear in 9 cases (14.51%) and Stable with loss of clone in 8 patients (12.90%) (Figure 4A). Distribution of founder clones in different subsets of patients with branching (n = 45) and non-branching (n = 17) evolution is shown in Figure 4B. One, two and three founder clones were detected in 18, 20 and 7 patients respectively out of 45 patients with branching patterns of clonal evolution. Patients with branching pattern of evolution had significantly higher number of founder clones (p = 0.0173, Figure 4B) than those with non-branching patterns. A significant number of patients with low TMB at TP1 developed branching clonal evolution (n = 40 out of 51) whereas those with high TMB had both branching (n = 5 out of 11) and non-branching evolutionary patterns (n = 6 out of 11) (P = 0.026) (Figure 4C).
Figure 4.
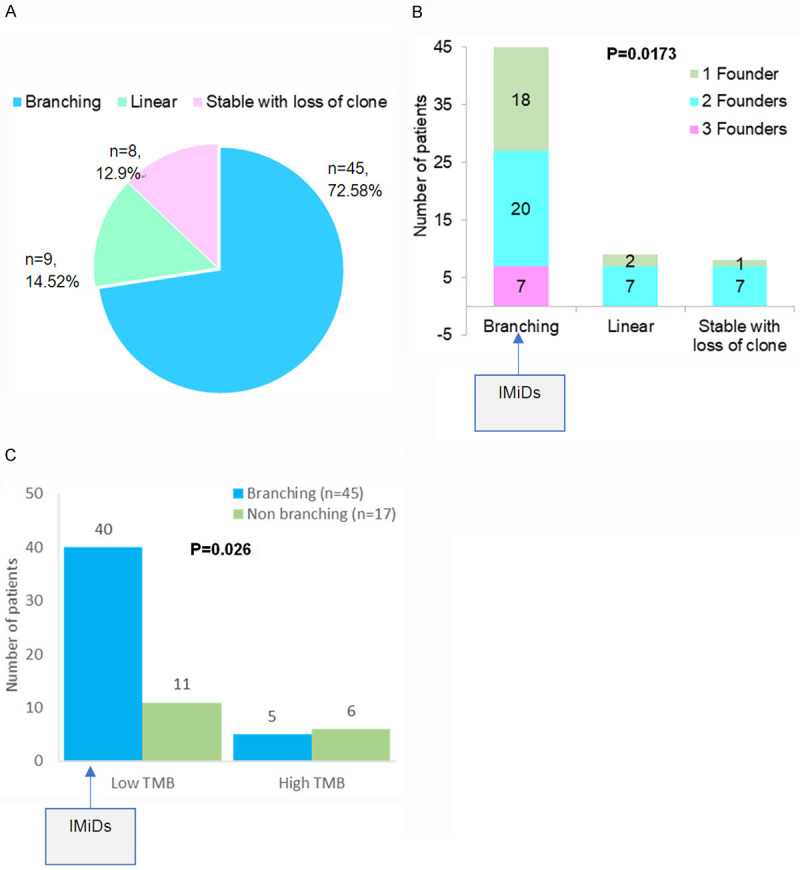
Frequencies of types of clonal evolution patterns, TMB and founder clones. (A) Distribution of types of clonal evolution patterns including branching and non-branching (Linear, Stable with loss of clone) observed in MM patients, (B) Number of founder clones observed in patients with branching and non-branching clonal evolution, and (C) Comparison of number of MM patients with either low or high TMB and who developed branching versus non-branching patterns of clonal evolution. Patients with branching evolution may benefit from IMiDs.
Each case of MM was analyzed in depth by QuantumClone and their individual fish plots, clonal density and evolution plots were generated (Supplementary Figures 1, 2, 3, 4, 5, 6, 7, 8, 9, 10, 11, 12, 13). A median of 3 clones (range 2 to 9) was observed among 45 patients with branching clonal evolution. The number of clones was relatively lower among patients with non-branching evolution patterns-Linear (2 to 4) and Stable with loss of clone (2 to 3). Figure 5A-C shows a representative fish plot of each of the three types of clonal patterns of evolution (Branching, Linear and Stable with loss) observed in this study. The somatic mutational diversity in founder clones and their cellular prevalence was compared at two time points for each patient. A schematic representation of genes found to be mutated in founder clones including actionable/non-actionable genes and the significantly associated biological pathways predicted to be affected by such mutated genes in patients are shown in Figures 6A, 6B and 7 respectively.
Figure 5.
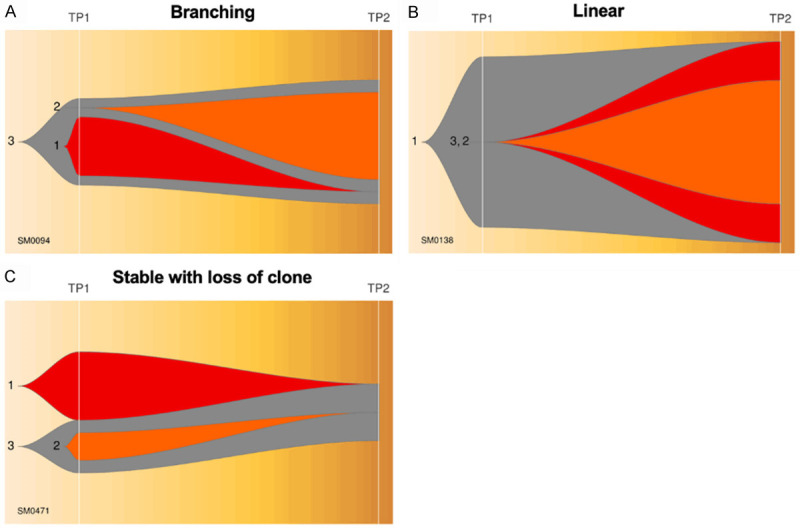
Three patterns of clonal evolution. A representative scheme of fish plots corresponding to three patterns of clonal evolution (A) Branching, (B) Linear, and (C) Stable with loss of clone.
Figure 6.

Comparison of potential actionable and non-actionable mutated genes in different samples grouped as with branching or non-branching clonal evolution patterns and low or high TMB levels. A. Heatmap depicting distribution of actionable targets including drivers, oncogenes and tumor suppressors with rising or falling frequency trends across MM patients classified on the basis of branching/non-branching clonal evolutionary patterns, TMB levels and number of founder clones. B. Heatmap depicting distribution of non-actionable target genes drivers, oncogenes and tumor suppressors with rising or falling trends across MM patients classified on the basis of branching/non-branching clonal evolutionary patterns, TMB levels and number of founder clones.
Figure 7.

Predicted pathways affected by somatic mutations across samples. Heatmap depicting significantly affected biological pathways predicted to be altered by Enrichr across MM patients classified on the basis of branching/non-branching clonal evolutionary patterns and TMB levels.
The heatmaps in Figure 6A and 6B also depict falling/rising frequencies of actionable and non-actionable targets (including DRV/ONC/TSG/others) respectively. The topmost ten genes mutated in founder clones were BAGE2 (37.28%) >PABPC1 (30.5%) >MUC17/NBPF1 (23.72%) >DNAH14/FLG (22.03%) >FAT1/ RHPN2/TPTE (20.33%). The topmost frequently mutated actionable targets were KRAS (18.64%) >BRAF/FANCM (13.55%) >FANCD2/WRN (11.86%) >FANCA/MLH1 (10.16%) >NRAS/ATM (8.47%) >TET2/BRCA1 (6.77%) >FGFR3/TP53 (5.08%), and others.
The cellular prevalence of topmost mutated tumor suppressor gene KMT2C showed an increase with progression in 6 out of 11 patients followed by FAT1 (6 out of 12), FANCA (3 out of 6), BRCA1 (3 out of 4), TET2 (2 out of 4) and NRAS (4 out of 5) (Figure 6). On the contrary, cellular prevalence of mutated driver PABPC1 decreased with progression in 13 out of 18 patients, KRAS (8 out of 11), BRAF (6 out of 8), ATM (4 out of 5) and others (Figure 6).
Prediction of biological pathways affected by somatic mutations
A comprehensive gene enrichment analysis by Enrichr identified a network of biological pathways found to be significantly associated with somatic mutations on progression of MM (Figure 7). These included, notably, ECM-receptor interaction, Galactose metabolism, Protein digestion and absorption, Cholesterol metabolism, Antigen processing and presentation, Drug metabolism, RNA degradation, Starch and sucrose metabolism, Hematopoietic cell lineage, Base excision repair, MAPK signaling pathway, viral carcinogenesis, cell cycle, apoptosis, Th17 cell differentiation, Th1 and Th2 cell differentiation, beta-Alanine metabolism, cellular senescence and others.
Pathways that were affected by 2434 mutated genes found exclusively at diagnosis and those affected by new mutations in genes at TP2 are shown in Figure 8. Additional pathways (n = 13) found to be affected exclusively on progression included NK cell mediated cytotoxicity, chemical carcinogenesis, PI3K-Akt signaling, phototransduction, PPAR signaling, GnRH signaling and others. Likewise, 18 pathways were exclusively affected by mutations at TP1.
Figure 8.
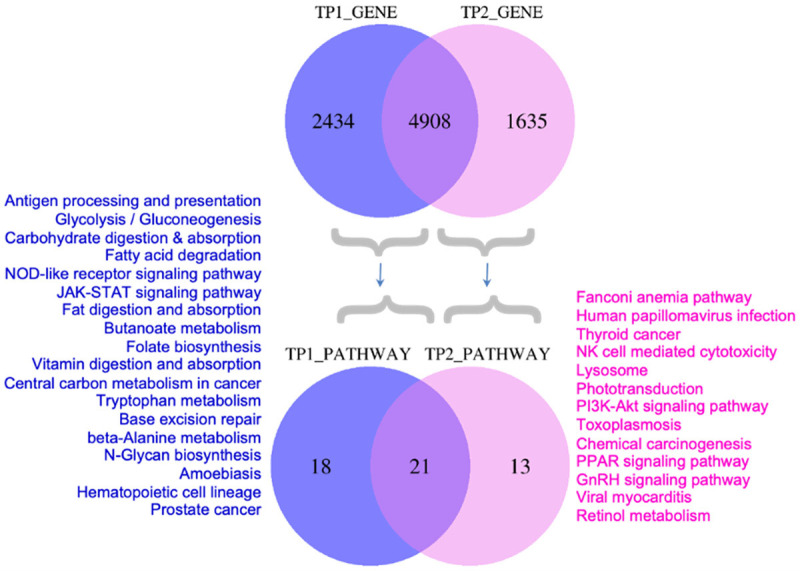
Comparison of mutated genes and associated pathways at diagnosis and at progression. Venn diagram representing number of mutated genes and the predicted biological pathways affected by mutations exclusively at diagnosis (TP1) or progression (TP2).
Clonal divergence in individual cases
Figure 5A-C Shows a representative fish plot of each of the three types of clonal patterns of evolution (Branching, Linear and Stable with loss) observed in this study. A case-wise description of subclones and their patterns of evolution are summarized in Supplementary Figures 1, 2, 3, 4, 5, 6, 7, 8, 9, 10, 11, 12, 13 and in Supplementary Note 1.
Discussion
Progression of MM is linked with a spatiotemporal shift in subclonal structure. The prime objective of this study was to explore subclonal evolution associated with progression of MM and identify potential actionable targets for each patient. In order to achieve this, we adopted a novel Ensemble algorithm approach for identification of mutations. As per our findings and as suggested by others [35,36], there can be significant differences in the SNV outputs processed by different variant callers based on the properties of the caller used, their strengths and weaknesses. Since no somatic caller has the ultimate ability to perform, an ensemble approach that combines multiple callers has been reported to offer the best balance of both sensitivity and specificity [36-38]. Hence, we decided to call mutations through four common variant callers (Dragen, Strelka2, SomaticSniper and SpeedSeq) and generate a common consensus rather than depending on any single one. This innovative approach ensured that the clonal landscape of MM captured in our study was closest possible estimation to reality.
An important observation of this study is that we have been able to identify recurrent subclonal shifts in actionable/druggable targets of clinical importance such as BRAF, KRAS, ATM, TET2 and TP53 at diagnosis in multiple patients (in atleast 3 patients or more) (Figure 3A). A similar gain in subclonal NRAS mutations was observed at the time of progression (Figure 3C). The reduction in frequencies of driver genes with progression can be explained by their selective loss in response to therapy that may coincide with fulfillment of their initial functional role(s) needed in triggering myelomagenesis. On the other hand, an increase in another set of driver genes indicates an effect of evolutionary pressure that allows selection of topmost fit clones. These sweeping subclones may either be novel or may result from expansion of pre-existing mutations known to be present at low or undetectable frequencies at the time of diagnosis or earlier. The inability to detect low copy mutations is largely due to technical limitations of sequencing of bulk tumor tissue and recent advanced technologies of single cell sequencing may be able to resolve effect of evolving somatic mutations more lucidly.
Screening of actionable genetic mutations in these genes allows to match patients with future treatments that would be most beneficial, which is in coherence with the overall goal of the ongoing Multiple Myeloma Research Foundation (MMRF) MyDRUG (Myeloma-Developing Regimens Using Genomics) clinical trial (NCT03732703) [39]. The MyDRUG aims at enrolling patients with mutations in BRAF, NRAS, KRAS, FGFR3, CDKN2C, IDH2 or t(11;14) and assign to appropriate targeted agent against that mutation. Patients with BRAF V600E or any NRAS or KRAS actionable mutations found in subclonal populations could thus benefit the most if treated early with BRAF inhibitor e.g. Vemurafenib or MEK inhibitor Cobimetinib respectively. Heat maps in Figure 6A show genomic signatures of actionable genes for each patient enrolled in this study that could be targeted specifically to select the right drug for the right patient based on the specificity of the mutation.
TMB is an emerging prognostic biomarker of response to immunotherapy, approximation of neoantigen load and overall survival especially in solid tumors [40,41]. A high TMB is considered a biomarker of higher neoantigen load, increased response rates to immunotherapy and better outcomes. High somatic mutation and neoantigen loads have been found to correlate with reduced PFS in MM [42]. Patients were classified in this study into those with low TMB between ≤1 to 10 or high TMB (≥10 or hypermutators). This study has shown a modest loss of TMB from diagnosis to progression but only in a subset of patients with hypermutator status (i.e. TMB≥10) (Figure 2). There could be a selective loss of less fit drug sensitive clones yet with persistence of drug resistant clones in such patients and hence combinations IMiDs with novel therapeutics could be used to treat such patients.
This study has shown a predominance of branching pattern of clonal evolution in MM in concurrence to other studies [8,13-19] (Figure 4A). An increase in DNA damage and a branching pattern of evolution are considered hallmarks of effectiveness of therapy and attainment of deep response [13]. Although the branching type of evolution reflects on the better response rates to therapy while tumor strives to mutate and acquire fitter clones to survive, it is also a prominent underlying mechanism of relapse. While mutations in founder clones are primarily involved in initiation of myelomagenesis, those in subclones may contribute significantly to relapse. The study has further shown that branching evolution is more predominant among patients with 2 or more founder clones (Figure 4B) and those with low tumor mutation burden (TMB<10) (Figure 4C). Since, this happens under the positive selection pressure of therapy and the microenvironment, such patients could perhaps benefit more from immunomodulatory drugs (IMiDs) such as thalidomide/lenalidomide and analogues [12].
Studies have shown that ongoing DNA damage intensifies from MGUS to MM and provides a mechanism by which chromosomal aberrations and heterogeneity are acquired by malignant plasma cells [43]. Figures 7 and 8 show the functional pathways that were affected by genetic mutations on progression. These include pathways in cancer, metabolism of galactose, cholesterol, drugs, cellular senescence, cell cycle, apoptosis, viral carcinogenesis, RNA degradation, base excision repair and several other crucial signalling pathways involved in pathogenesis of MM or immune surveillance. Deregulated DNA damage repair related pathways as also seen in our study have been associated with poor prognosis [44] since the tumor cells can withstand DNA damaging drugs and repopulate with therapy resistant cells on treatment. It has been suggested that a ‘synthetic lethality’ approach [45] may be more beneficial where co-treatment of patients with current drugs and those targeting DNA repair pathways [46] (e.g, Bortezomib with PARP1 inhibitor [47] or Spironolactone [48] or a novel compound DCZ3301 [49]) may reverse drug resistance in such patients [50,51].
Studies like this have shown genomic plasticity of mutational landscapes and how relative preponderance of mutated drivers changes with disease progression. Supplementary Figures 1, 2, 3, 4, 5, 6, 7, 8, 9, 10, 11, 12, 13 shows individual evolution patterns as FISH plots followed by summarized individual case reports on 62 newly diagnosed MM patients enrolled in this study. It provides a detailed genomic architecture and cellular prevalence of each and every subclone identified for every patient at diagnosis and at progression. Table 4 summarizes the number of patients who had an actionable/druggable mutation and who could qualify for targeted treatments with target specific drugs. Comprehensive analysis of mutational subclonal landscapes of patients as observed in this study is a pre-requisite to infer the genomic mutations that can be treated in future in similar lines as in MyDRUG trial. An integration of such early genomic biomarkers with clinical biomarkers could help in risk estimation and identification of patients who could benefit more from a rationalized therapeutic approach at early stages. It is indeed not just the individual mutations but an extended treatment landscape that needs to be monitored preferably at multiple time points to tailor therapy. An early assessment of TMB along with mutations in drivers and actionable target genes during decision making, may therefore, allow most appropriate therapeutic personification in clinics.
In conclusion, a systematic analysis of evolving mutational landscapes, TMB and SBS signatures could help in better stratification of high risk MGUS/SMM/MM patients prior to subclonal expansion and therefore open the opportunities of early and personified cure for the disease.
Acknowledgements
This work was supported by grants from Department of Biotechnology, Govt. of India [BT/MED/30/SP11006/2015] and Department of Science and Technology, Govt. of India [DST/ICPS/CPS-Individual/2018/279(G)]. Akanksha Farswan would like to thank University Grants Commission, Govt. of India for UGC-Senior Research Fellowship. Authors acknowledge Multiple Myeloma Research Foundation (MMRF) for providing the dataset. These data were generated as part of the Multiple Myeloma Research Foundation Personalised Medicine Initiative.
Disclosure of conflict of interest
None.
Supplementary Figures 1-13
Supplementary Note 1
References
- 1.Maura F, Rustad EH, Boyle EM, Morgan GJ. Reconstructing the evolutionary history of multiple myeloma. Best Pract Res Clin Haematol. 2020;33:101145. doi: 10.1016/j.beha.2020.101145. [DOI] [PMC free article] [PubMed] [Google Scholar]
- 2.Kumar SK, Rajkumar SV. The multiple myelomas-current concepts in cytogenetic classification and therapy. Nat Rev Clin Oncol. 2018;15:409–421. doi: 10.1038/s41571-018-0018-y. [DOI] [PubMed] [Google Scholar]
- 3.Landgren O, Morgan GJ. Biologic frontiers in multiple myeloma: from biomarker identification to clinical practice. Clin Cancer Res. 2014;20:804–813. doi: 10.1158/1078-0432.CCR-13-2159. [DOI] [PMC free article] [PubMed] [Google Scholar]
- 4.van Nieuwenhuijzen N, Spaan I, Raymakers R, Peperzak V. From MGUS to multiple myeloma, a paradigm for clonal evolution of premalignant cells. Cancer Res. 2018;78:2449–2456. doi: 10.1158/0008-5472.CAN-17-3115. [DOI] [PubMed] [Google Scholar]
- 5.Kaufmann H, Ackermann J, Baldia C, Nösslinger T, Wieser R, Seidl S, Sagaster V, Gisslinger H, Jäger U, Pfeilstöcker M, Zielinski C, Drach J. Both IGH translocations and chromosome 13q deletions are early events in monoclonal gammopathy of undetermined significance and do not evolve during transition to multiple myeloma. Leukemia. 2004;18:1879–1882. doi: 10.1038/sj.leu.2403518. [DOI] [PubMed] [Google Scholar]
- 6.Rajan AM, Rajkumar SV. Interpretation of cytogenetic results in multiple myeloma for clinical practice. Blood Cancer J. 2015;5:e365. doi: 10.1038/bcj.2015.92. [DOI] [PMC free article] [PubMed] [Google Scholar]
- 7.Manier S, Salem KZ, Park J, Landau DA, Getz G, Ghobrial IM. Genomic complexity of multiple myeloma and its clinical implications. Nat Rev Clin Oncol. 2016;14:100–113. doi: 10.1038/nrclinonc.2016.122. [DOI] [PubMed] [Google Scholar]
- 8.Bolli N, Avet-Loiseau H, Wedge DC, Van Loo P, Alexandrov LB, Martincorena I, Dawson KJ, Iorio F, Nik-Zainal S, Bignell GR, Hinton JW, Li Y, Tubio JMC, McLaren S, O’Meara S, Butler AP, Teague JW, Mudie L, Anderson E, Rashid N, Tai YT, Shammas MA, Sperling AS, Fulciniti M, Richardson PG, Parmigiani G, Magrangeas F, Minvielle S, Moreau P, Attal M, Facon T, Futreal PA, Anderson KC, Campbell PJ, Munshi NC. Heterogeneity of genomic evolution and mutational profiles in multiple myeloma. Nat Commun. 2014;5:2997. doi: 10.1038/ncomms3997. [DOI] [PMC free article] [PubMed] [Google Scholar]
- 9.Furukawa Y, Kikuchi J. Molecular pathogenesis of multiple myeloma. Int J Clin Oncol. 2015;20:413–422. doi: 10.1007/s10147-015-0837-0. [DOI] [PubMed] [Google Scholar]
- 10.Bolli N, Maura F, Minvielle S, Gloznik D, Szalat R, Fullam A, Martincorena I, Dawson KJ, Samur MK, Zamora J, Tarpey P, Davies H, Fulciniti M, Shammas MA, Tai YT, Magrangeas F, Moreau P, Corradini P, Anderson K, Alexandrov L, Wedge DC, Avet-Loiseau H, Campbell P, Munshi N. Genomic patterns of progression in smoldering multiple myeloma. Nat Commun. 2018;9:3363. doi: 10.1038/s41467-018-05058-y. [DOI] [PMC free article] [PubMed] [Google Scholar]
- 11.Johnson DC, Lenive O, Mitchell J, Jackson G, Owen R, Drayson M, Cook G, Jones JR, Pawlyn C, Davies FE, Walker BA, Wardell C, Gregory WM, Cairns D, Morgan GJ, Houlston RS, Kaiser MF. Neutral tumor evolution in myeloma is associated with poor prognosis. Blood. 2017;130:1639–1643. doi: 10.1182/blood-2016-11-750612. [DOI] [PMC free article] [PubMed] [Google Scholar]
- 12.Furukawa Y, Kikuchi J. Molecular basis of clonal evolution in multiple myeloma. Int J Hematol. 2020;111:496–511. doi: 10.1007/s12185-020-02829-6. [DOI] [PubMed] [Google Scholar]
- 13.Jones JR, Weinhold N, Ashby C, Walker BA, Wardell C, Pawlyn C, Rasche L, Melchor L, Cairns DA, Gregory WM, Johnson D, Begum DB, Ellis S, Sherborne AL, Cook G, Kaiser MF, Drayson MT, Owen RG, Jackson GH, Davies FE, Greaves M, Morgan GJ NCRI Haemato-Oncology CSG. Clonal evolution in myeloma: the impact of maintenance lenalidomide and depth of response on the genetics and sub-clonal structure of relapsed disease in uniformly treated newly diagnosed patients. Haematologica. 2019;104:1440–1450. doi: 10.3324/haematol.2018.202200. [DOI] [PMC free article] [PubMed] [Google Scholar]
- 14.Weinhold N, Ashby C, Rasche L, Chavan SS, Stein C, Stephens OW, Tytarenko R, Bauer MA, Meissner T, Deshpande S, Patel PH, Buzder T, Molnar G, Peterson EA, van Rhee F, Zangari M, Thanendrarajan S, Schinke C, Tian E, Epstein J, Barlogie B, Davies FE, Heuck CJ, Walker BA, Morgan GJ. Clonal selection and double-hit events involving tumor suppressor genes underlie relapse in myeloma. Blood. 2016;128:1735–1744. doi: 10.1182/blood-2016-06-723007. [DOI] [PMC free article] [PubMed] [Google Scholar]
- 15.Melchor L, Brioli A, Wardell CP, Murison A, Potter NE, Kaiser MF, Fryer RA, Johnson DC, Begum DB, Hulkki Wilson S, Vijayaraghavan G, Titley I, Cavo M, Davies FE, Walker BA, Morgan GJ. Single-cell genetic analysis reveals the composition of initiating clones and phylogenetic patterns of branching and parallel evolution in myeloma. Leukemia. 2014;28:1705–1715. doi: 10.1038/leu.2014.13. [DOI] [PubMed] [Google Scholar]
- 16.Lohr JG, Stojanov P, Carter SL, Cruz-Gordillo P, Lawrence MS, Auclair D, Sougnez C, Knoechel B, Gould J, Saksena G, Cibulskis K, McKenna A, Chapman MA, Straussman R, Levy J, Perkins LM, Keats JJ, Schumacher SE, Rosenberg M, Getz G, Golub TR. Widespread genetic heterogeneity in multiple myeloma: implications for targeted therapy. Cancer Cell. 2014;25:91–101. doi: 10.1016/j.ccr.2013.12.015. [DOI] [PMC free article] [PubMed] [Google Scholar]
- 17.Walker BA, Wardell CP, Melchor L, Brioli A, Johnson DC, Kaiser MF, Mirabella F, Lopez-Corral L, Humphray S, Murray L, Ross M, Bentley D, Gutiérrez NC, Garcia-Sanz R, San Miguel J, Davies FE, Gonzalez D, Morgan GJ. Intraclonal heterogeneity is a critical early event in the development of myeloma and precedes the development of clinical symptoms. Leukemia. 2014;28:384–390. doi: 10.1038/leu.2013.199. [DOI] [PMC free article] [PubMed] [Google Scholar]
- 18.Chapman MA, Lawrence MS, Keats JJ, Cibulskis K, Sougnez C, Schinzel AC, Harview CL, Brunet JP, Ahmann GJ, Adli M, Anderson KC, Ardlie KG, Auclair D, Baker A, Bergsagel PL, Bernstein BE, Drier Y, Fonseca R, Gabriel SB, Hofmeister CC, Jagannath S, Jakubowiak AJ, Krishnan A, Levy J, Liefeld T, Lonial S, Mahan S, Mfuko B, Monti S, Perkins LM, Onofrio R, Pugh TJ, Rajkumar SV, Ramos AH, Siegel DS, Sivachenko A, Stewart AK, Trudel S, Vij R, Voet D, Winckler W, Zimmerman T, Carpten J, Trent J, Hahn WC, Garraway LA, Meyerson M, Lander ES, Getz G, Golub TR. Initial genome sequencing and analysis of multiple myeloma. Nature. 2011;471:467–472. doi: 10.1038/nature09837. [DOI] [PMC free article] [PubMed] [Google Scholar]
- 19.Maura F, Bolli N, Angelopoulos N, Dawson KJ, Leongamornlert D, Martincorena I, Mitchell TJ, Fullam A, Gonzalez S, Szalat R, Abascal F, Rodriguez-Martin B, Samur MK, Glodzik D, Roncador M, Fulciniti M, Tai YT, Minvielle S, Magrangeas F, Moreau P, Corradini P, Anderson KC, Tubio JMC, Wedge DC, Gerstung M, Avet-Loiseau H, Munshi N, Campbell PJ. Genomic landscape and chronological reconstruction of driver events in multiple myeloma. Nat Commun. 2019;10:3835. doi: 10.1038/s41467-019-11680-1. [DOI] [PMC free article] [PubMed] [Google Scholar]
- 20.Lawrence MS, Stojanov P, Polak P, Kryukov GV, Cibulskis K, Sivachenko A, Carter SL, Stewart C, Mermel CH, Roberts SA, Kiezun A, Hammerman PS, McKenna A, Drier Y, Zou L, Ramos AH, Pugh TJ, Stransky N, Helman E, Kim J, Sougnez C, Ambrogio L, Nickerson E, Shefler E, Cortés ML, Auclair D, Saksena G, Voet D, Noble M, DiCara D, Lin P, Lichtenstein L, Heiman DI, Fennell T, Imielinski M, Hernandez B, Hodis E, Baca S, Dulak AM, Lohr J, Landau DA, Wu CJ, Melendez-Zajgla J, Hidalgo-Miranda A, Koren A, McCarroll SA, Mora J, Crompton B, Onofrio R, Parkin M, Winckler W, Ardlie K, Gabriel SB, Roberts CWM, Biegel JA, Stegmaier K, Bass AJ, Garraway LA, Meyerson M, Golub TR, Gordenin DA, Sunyaev S, Lander ES, Getz G. Mutational heterogeneity in cancer and the search for new cancer-associated genes. Nature. 2013;499:214–218. doi: 10.1038/nature12213. [DOI] [PMC free article] [PubMed] [Google Scholar]
- 21.Samur MK, Aktas Samur A, Fulciniti M, Szalat R, Han T, Shammas M, Richardson P, Magrangeas F, Minvielle S, Corre J, Moreau P, Thakurta A, Anderson KC, Parmigiani G, Avet-Loiseau H, Munshi NC. Genome-wide somatic alterations in multiple myeloma reveal a superior outcome group. J. Clin. Oncol. 2020;38:3107–3118. doi: 10.1200/JCO.20.00461. [DOI] [PMC free article] [PubMed] [Google Scholar]
- 22.Keats JJ, Chesi M, Egan JB, Garbitt VM, Palmer SE, Braggio E, Van Wier S, Blackburn PR, Baker AS, Dispenzieri A, Kumar S, Rajkumar SV, Carpten JD, Barrett M, Fonseca R, Stewart AK, Bergsagel PL. Clonal competition with alternating dominance in multiple myeloma. Blood. 2012;120:1067–1076. doi: 10.1182/blood-2012-01-405985. [DOI] [PMC free article] [PubMed] [Google Scholar]
- 23.Kim S, Scheffler K, Halpern AL, Bekritsky MA, Noh E, Källberg M, Chen X, Kim Y, Beyter D, Krusche P, Saunders CT. Strelka2: fast and accurate calling of germline and somatic variants. Nat Methods. 2018;15:591–594. doi: 10.1038/s41592-018-0051-x. [DOI] [PubMed] [Google Scholar]
- 24.Larson DE, Abbott TE, Wilson RK. Using somaticsniper to detect somatic single nucleotide variants. Curr Protoc Bioinforma. 2014;45:15.5.1–8. doi: 10.1002/0471250953.bi1505s45. [DOI] [PMC free article] [PubMed] [Google Scholar]
- 25.Chiang C, Layer RM, Faust GG, Lindberg MR, Rose DB, Garrison EP, Marth GT, Quinlan AR, Hall IM. SpeedSeq: ultra-fast personal genome analysis and interpretation. Nat Methods. 2015;12:966–968. doi: 10.1038/nmeth.3505. [DOI] [PMC free article] [PubMed] [Google Scholar]
- 26.Gao J, Aksoy BA, Dogrusoz U, Dresdner G, Gross B, Sumer SO, Sun Y, Jacobsen A, Sinha R, Larsson E, Cerami E, Sander C, Schultz N. Integrative analysis of complex cancer genomics and clinical profiles using the cBioPortal. Sci Signal. 2013;6:pl1. doi: 10.1126/scisignal.2004088. [DOI] [PMC free article] [PubMed] [Google Scholar]
- 27.Cerami E, Gao J, Dogrusoz U, Gross BE, Sumer SO, Aksoy BA, Jacobsen A, Byrne CJ, Heuer ML, Larsson E, Antipin Y, Reva B, Goldberg AP, Sander C, Schultz N. The cBio cancer genomics portal: an open platform for exploring multidimensional cancer genomics data. Cancer Discov. 2012;2:401–404. doi: 10.1158/2159-8290.CD-12-0095. [DOI] [PMC free article] [PubMed] [Google Scholar]
- 28.Gonzalez-Perez A, Perez-Llamas C, Deu-Pons J, Tamborero D, Schroeder MP, Jene-Sanz A, Santos A, Lopez-Bigas N. IntOGen-mutations identifies cancer drivers across tumor types. Nat Methods. 2013;10:1081–1082. doi: 10.1038/nmeth.2642. [DOI] [PMC free article] [PubMed] [Google Scholar]
- 29.Chakravarty D, Gao J, Phillips SM, Kundra R, Zhang H, Wang J, Rudolph JE, Yaeger R, Soumerai T, Nissan MH, Chang MT, Chandarlapaty S, Traina TA, Paik PK, Ho AL, Hantash FM, Grupe A, Baxi SS, Callahan MK, Snyder A, Chi P, Danila D, Gounder M, Harding JJ, Hellmann MD, Iyer G, Janjigian Y, Kaley T, Levine DA, Lowery M, Omuro A, Postow MA, Rathkopf D, Shoushtari AN, Shukla N, Voss M, Paraiso E, Zehir A, Berger MF, Taylor BS, Saltz LB, Riely GJ, Ladanyi M, Hyman DM, Baselga J, Sabbatini P, Solit DB, Schultz N. OncoKB: a precision oncology knowledge base. JCO Precis Oncol. 2017;2017:PO.17.00011. doi: 10.1200/PO.17.00011. [DOI] [PMC free article] [PubMed] [Google Scholar]
- 30.Schuh A, Dreau H, Knight SJL, Ridout K, Mizani T, Vavoulis D, Colling R, Antoniou P, Kvikstad EM, Pentony MM, Hamblin A, Protheroe A, Parton M, Shah KA, Orosz Z, Athanasou N, Hassan B, Flanagan AM, Ahmed A, Winter S, Harris A, Tomlinson I, Popitsch N, Church D, Taylor JC. Clinically actionable mutation profiles in patients with cancer identified by whole-genome sequencing. Cold Spring Harb Mol Case Stud. 2018;4:a002279. doi: 10.1101/mcs.a002279. [DOI] [PMC free article] [PubMed] [Google Scholar]
- 31.Galanina N, Bejar R, Choi M, Goodman A, Wieduwilt M, Mulroney C, Kim L, Yeerna H, Tamayo P, Vergilio JA, Mughal TI, Miller V, Jamieson C, Kurzrock R. Comprehensive genomic profiling reveals diverse but actionable molecular portfolios across hematologic malignancies: implications for next generation clinical trials. Cancers (Basel) 2019;11:11. doi: 10.3390/cancers11010011. [DOI] [PMC free article] [PubMed] [Google Scholar]
- 32.Deveau P, Colmet Daage L, Oldridge D, Bernard V, Bellini A, Chicard M, Clement N, Lapouble E, Combaret V, Boland A, Meyer V, Deleuze JF, Janoueix-Lerosey I, Barillot E, Delattre O, Maris JM, Schleiermacher G, Boeva V. QuantumClone: clonal assessment of functional mutations in cancer based on a genotype-aware method for clonal reconstruction. Bioinformatics. 2018;34:1808–1816. doi: 10.1093/bioinformatics/bty016. [DOI] [PMC free article] [PubMed] [Google Scholar]
- 33.Miller CA, McMichael J, Dang HX, Maher CA, Ding L, Ley TJ, Mardis ER, Wilson RK. Visualizing tumor evolution with the fishplot package for R. BMC Genomics. 2016;17:880. doi: 10.1186/s12864-016-3195-z. [DOI] [PMC free article] [PubMed] [Google Scholar]
- 34.Kuleshov MV, Jones MR, Rouillard AD, Fernandez NF, Duan Q, Wang Z, Koplev S, Jenkins SL, Jagodnik KM, Lachmann A, McDermott MG, Monteiro CD, Gundersen GW, Ma’ayan A. Enrichr: a comprehensive gene set enrichment analysis web server 2016 update. Nucleic Acids Res. 2016;44:W90–97. doi: 10.1093/nar/gkw377. [DOI] [PMC free article] [PubMed] [Google Scholar]
- 35.Roberts ND, Kortschak RD, Parker WT, Schreiber AW, Branford S, Scott HS, Glonek G, Adelson DL. A comparative analysis of algorithms for somatic SNV detection in cancer. Bioinforma Oxf Engl. 2013;29:2223–2230. doi: 10.1093/bioinformatics/btt375. [DOI] [PMC free article] [PubMed] [Google Scholar]
- 36.Koboldt DC. Best practices for variant calling in clinical sequencing. Genome Med. 2020;12:91. doi: 10.1186/s13073-020-00791-w. [DOI] [PMC free article] [PubMed] [Google Scholar]
- 37.Fang LT, Afshar PT, Chhibber A, Mohiyuddin M, Fan Y, Mu JC, Gibeling G, Barr S, Asadi NB, Gerstein MB, Koboldt DC, Wang W, Wong WH, Lam HY. An ensemble approach to accurately detect somatic mutations using SomaticSeq. Genome Biol. 2015;16:197. doi: 10.1186/s13059-015-0758-2. [DOI] [PMC free article] [PubMed] [Google Scholar]
- 38.Anzar I, Sverchkova A, Stratford R, Clancy T. NeoMutate: an ensemble machine learning framework for the prediction of somatic mutations in cancer. BMC Med Genomics. 2019;12:63. doi: 10.1186/s12920-019-0508-5. [DOI] [PMC free article] [PubMed] [Google Scholar]
- 39.Auclair D, Anderson K, Avigan D, Biran N, Chaudhry M, Cho H, Furlong M, Hofmeister C, Kansagra A, Krishnan A, Larsen J, Orloff G, Vij R, Voorhees P, Yee A, Ye J, Zonder J, Lonial S, Kumar S. The myeloma-developing regimens using genomics (MyDRUG) master protocol. J. Clin. Oncol. 2019;37:TPS8057. [Google Scholar]
- 40.McGranahan N, Furness AJS, Rosenthal R, Ramskov S, Lyngaa R, Saini SK, Jamal-Hanjani M, Wilson GA, Birkbak NJ, Hiley CT, Watkins TBK, Shafi S, Murugaesu N, Mitter R, Akarca AU, Linares J, Marafioti T, Henry JY, Van Allen EM, Miao D, Schilling B, Schadendorf D, Garraway LA, Makarov V, Rizvi NA, Snyder A, Hellmann MD, Merghoub T, Wolchok JD, Shukla SA, Wu CJ, Peggs KS, Chan TA, Hadrup SR, Quezada SA, Swanton C. Clonal neoantigens elicit T cell immunoreactivity and sensitivity to immune checkpoint blockade. Science. 2016;351:1463–1469. doi: 10.1126/science.aaf1490. [DOI] [PMC free article] [PubMed] [Google Scholar]
- 41.Rizvi NA, Hellmann MD, Snyder A, Kvistborg P, Makarov V, Havel JJ, Lee W, Yuan J, Wong P, Ho TS, Miller ML, Rekhtman N, Moreira AL, Ibrahim F, Bruggeman C, Gasmi B, Zappasodi R, Maeda Y, Sander C, Garon EB, Merghoub T, Wolchok JD, Schumacher TN, Chan TA. Cancer immunology. Mutational landscape determines sensitivity to PD-1 blockade in non-small cell lung cancer. Science. 2015;348:124–128. doi: 10.1126/science.aaa1348. [DOI] [PMC free article] [PubMed] [Google Scholar]
- 42.Miller A, Asmann Y, Cattaneo L, Braggio E, Keats J, Auclair D, Lonial S, Russell SJ, Stewart AK. High somatic mutation and neoantigen burden are correlated with decreased progression-free survival in multiple myeloma. Blood Cancer J. 2017;7:e612. doi: 10.1038/bcj.2017.94. [DOI] [PMC free article] [PubMed] [Google Scholar]
- 43.Walters DK, Wu X, Tschumper RC, Arendt BK, Huddleston PM, Henderson KJ, Dispenzieri A, Jelinek DF. Evidence for ongoing DNA damage in multiple myeloma cells as revealed by constitutive phosphorylation of H2AX. Leukemia. 2011;25:1344–1353. doi: 10.1038/leu.2011.94. [DOI] [PMC free article] [PubMed] [Google Scholar]
- 44.Kassambara A, Gourzones-Dmitriev C, Sahota S, Rème T, Moreaux J, Goldschmidt H, Constantinou A, Pasero P, Hose D, Klein B. A DNA repair pathway score predicts survival in human multiple myeloma: the potential for therapeutic strategy. Oncotarget. 2014;5:2487–2498. doi: 10.18632/oncotarget.1740. [DOI] [PMC free article] [PubMed] [Google Scholar]
- 45.Cottini F, Hideshima T, Suzuki R, Tai YT, Bianchini G, Richardson PG, Anderson KC, Tonon G. Synthetic lethal approaches exploiting DNA damage in aggressive myeloma. Cancer Discov. 2015;5:972–987. doi: 10.1158/2159-8290.CD-14-0943. [DOI] [PMC free article] [PubMed] [Google Scholar]
- 46.Szalat R, Samur MK, Fulciniti M, Lopez M, Nanjappa P, Cleynen A, Wen K, Kumar S, Perini T, Calkins AS, Reznichenko E, Chauhan D, Tai YT, Shammas MA, Anderson KC, Fermand JP, Arnulf B, Avet-Loiseau H, Lazaro JB, Munshi NC. Nucleotide excision repair is a potential therapeutic target in multiple myeloma. Leukemia. 2018;32:111–119. doi: 10.1038/leu.2017.182. [DOI] [PMC free article] [PubMed] [Google Scholar]
- 47.Gourzones C, Bret C, Moreaux J. Treatment may be harmful: mechanisms/prediction/prevention of drug-induced DNA damage and repair in multiple myeloma. Front Genet. 2019;10:861. doi: 10.3389/fgene.2019.00861. [DOI] [PMC free article] [PubMed] [Google Scholar]
- 48.Chauhan D, Ray A, Viktorsson K, Spira J, Paba-Prada C, Munshi N, Richardson P, Lewensohn R, Anderson KC. In vitro and in vivo antitumor activity of a novel alkylating agent, melphalan-flufenamide, against multiple myeloma cells. Clin Cancer Res. 2013;19:3019–3031. doi: 10.1158/1078-0432.CCR-12-3752. [DOI] [PMC free article] [PubMed] [Google Scholar]
- 49.Hu L, Li B, Chen G, Song D, Xu Z, Gao L, Xi M, Zhou J, Li L, Zhang H, Feng Q, Wang Y, Lu K, Lu Y, Bu W, Wang H, Wu X, Zhu W, Shi J. A novel M phase blocker, DCZ3301 enhances the sensitivity of bortezomib in resistant multiple myeloma through DNA damage and mitotic catastrophe. J Exp Clin Cancer Res. 2020;39:105. doi: 10.1186/s13046-020-01597-9. [DOI] [PMC free article] [PubMed] [Google Scholar]
- 50.Neri P, Ren L, Gratton K, Stebner E, Johnson J, Klimowicz A, Duggan P, Tassone P, Mansoor A, Stewart DA, Lonial S, Boise LH, Bahlis NJ. Bortezomib-induced “BRCAness” sensitizes multiple myeloma cells to PARP inhibitors. Blood. 2011;118:6368–6379. doi: 10.1182/blood-2011-06-363911. [DOI] [PMC free article] [PubMed] [Google Scholar]
- 51.Ino R, Saitoh T, Kitamura Y, Homma K, Takahashi N, Nanami G, Kasamatsu T, Shimizu H, Takizawa M, Matsumoto M, Sawamura M, Yokohama A, Tsukamoto N, Handa H, Murakami H. The role and therapeutic target of base excision repair genes in multiple myeloma (MM) Blood. 2017;130:4403. [Google Scholar]
- 52.Farswan A, Gupta A, Gupta R, Hazra S, Khan S, Kumar L, Sharma A. AI-supported modified risk staging for multiple myeloma cancer useful in real-world scenario. Transl Oncol. 2021;14:101157. doi: 10.1016/j.tranon.2021.101157. [DOI] [PMC free article] [PubMed] [Google Scholar]
Associated Data
This section collects any data citations, data availability statements, or supplementary materials included in this article.