



Abstract
Rationale: Obstructive sleep apnea (OSA) is associated with cardiovascular disease and incident type 2 diabetes (T2DM). Seven OSA phenotypes, labeled on the basis of their most distinguishing polysomnographic features, have been shown to be differentially associated with incident cardiovascular disease. However, little is known about the relevance of polysomnographic phenotypes for the risk of T2DM.
Objectives: To assess whether polysomnographic phenotypes are associated with incident T2DM and to compare the predictive value of baseline polysomnographic phenotypes with the Apnea–Hypopnea Index (AHI) for T2DM.
Methods: The study included 840 individuals without baseline diabetes from a multisite observational U.S. veteran cohort who underwent OSA evaluation between 2000 and 2004, with follow-up through 2012. The primary outcome was incident T2DM, defined as no diagnosis at baseline and a new physician diagnosis confirmed by fasting blood glucose >126 mg/dL during follow-up. Relationships between the seven polysomnographic phenotypes (1. mild, 2. periodic limb movements of sleep [PLMS], 3. non–rapid eye movement and poor sleep, 4. rapid eye movement and hypoxia, 5. hypopnea and hypoxia, 6. arousal and poor sleep, and 7. combined severe) and incident T2DM were investigated using Cox proportional hazards regression and competing risk regression models with and without adjustment for baseline covariates. Likelihood ratio tests were conducted to compare the predictive value of the phenotypes with the AHI.
Results: During a median follow-up period of 61 months, 122 (14.5%) patients developed incident T2DM. After adjustment for baseline sociodemographics, fasting blood glucose, body mass index, comorbidities, and behavioral risk factors, hazard ratios among persons with “hypopnea and hypoxia” and “PLMS” phenotypes as compared with persons with “mild” phenotype were 3.18 (95% confidence interval [CI], 1.53–6.61] and 2.26 (95% CI, 1.06–4.83) for incident T2DM, respectively. Mild OSA (5 ⩽ AHI < 15) (vs. no OSA) was directly associated with incident T2DM in both unadjusted and multivariable-adjusted regression models. The addition of polysomnographic phenotypes, but not AHI, to known T2DM risk factors greatly improved the predictive value of the computed prediction model.
Conclusions: Polysomnographic phenotypes “hypopnea and hypoxia” and “PLMS” independently predict risk of T2DM among a predominantly male veteran population. Polysomnographic phenotypes improved T2DM risk prediction comared with the use of AHI.
Keywords: incident type 2 diabetes, sleep apnea, phenotype, polysomnography, risk prediction
Obstructive sleep apnea (OSA) affects up to 30% of adults and is associated with major neurocognitive and cardiovascular sequelae, including hypertension, stroke, heart failure, and overall mortality (1–3). Emerging evidence also indicates that OSA is independently linked with increased risk of type 2 diabetes (T2DM), which is known to predispose individuals to a wide range of vascular diseases (4–6). However, it remains unknown whether the association between OSA and T2DM is direct (e.g., due to effects on insulin secretion and/or insulin action) or indirect (e.g., due to OSA being a marker of obesity and insulin resistance that increases risk of T2DM) or due to shared mechanisms (7–9). Data from animal and human studies suggest that intermittent hypoxia and sleep fragmentation, the two cardinal features of OSA, may be causal in glucose metabolism dysregulation observed in patients with OSA (10–12). However, the exact mechanisms connecting intermittent hypoxia and sleep fragmentation to metabolic dysfunction are less well understood. More work is needed to better characterize subgroups of the OSA population who are most susceptible to its metabolic effects (10, 11).
The conventional metric used to capture intermittent hypoxemia and arousals in OSA is the Apnea–Hypopnea Index (AHI). Thus, most previous studies exploring prognostic significance of OSA for incident T2DM were based on the AHI (4, 5, 13). Only a few studies have shown relevance of other metrics such as sleep time with oxygen saturation under 90% in T2DM risk prediction (T90) (5, 14). OSA, however, is a heterogeneous syndrome (15) with varied pathophysiological mechanisms (16), clinical and polysomnographic presentations (17), and consequences of respiratory events (e.g., apneas and hypopneas) (18). A single metric such as the AHI (or several) may not fully capture the physiologic consequences of OSA (15, 19, 20). Accordingly, we have previously identified seven distinct polysomnographic phenotypes in patients with suspected OSA by applying cluster analysis to a wide scope of polysomnographic metrics. These phenotypes captured different sleep apnea phenomena, including co-occurrence with periodic limb movements of sleep (PLMS), association of respiratory events with arousals, hypoxic load, and specific sleep states. Importantly, they differentially predicted adverse cardiovascular disease (CVD) outcomes (20).
Because pathophysiological processes in the causal pathway between OSA and CVD (breathing disturbance, autonomic dysregulation, hypoxemia, and sleep disturbance) (21, 22) may also link OSA with T2DM, such phenotypes may help identify individuals at the greatest risk for T2DM. Therefore, our objectives were to 1) examine the relationship between polysomnographic phenotypes and incident T2DM and 2) compare the predictive value of polysomnographic phenotypes and the AHI as risk factors for the development of incident T2DM.
Part of this work was published in an abstract in the American Thoracic Society 2021 International Conference (23).
Methods
Study Design, Participants, and Analytic Sample
We analyzed the data from the DREAM (Determining Risk of Vascular Events by Apnea Monitoring) study, a clinic-based observational cohort of veterans referred for OSA evaluation at three Veterans Affairs Medical Centers (West Haven, Connecticut; Cleveland, Ohio; and Indianapolis, Indiana) (24). Briefly, this study was designed to identify polysomnographic metrics of OSA physiology predictive of incident cardiovascular and metabolic outcomes. Details of the DREAM study, its data acquisition, and its variable definitions have been described previously (21, 24).
A total of 2,041 Veterans were enrolled from 2000 to 2004 and followed through 2012 for incident CVD and diabetes (24). At the time of enrollment (baseline: defined as time of the nocturnal clinical polysomnography), detailed characterization of PSG metrics was performed, and clinical risk factors for CVD and metabolic outcomes were identified. Our analytic sample included 840 patients, with selection criteria shown in Figure 1. The DREAM study was approved by the research ethics committee at each participating center.
Figure 1.
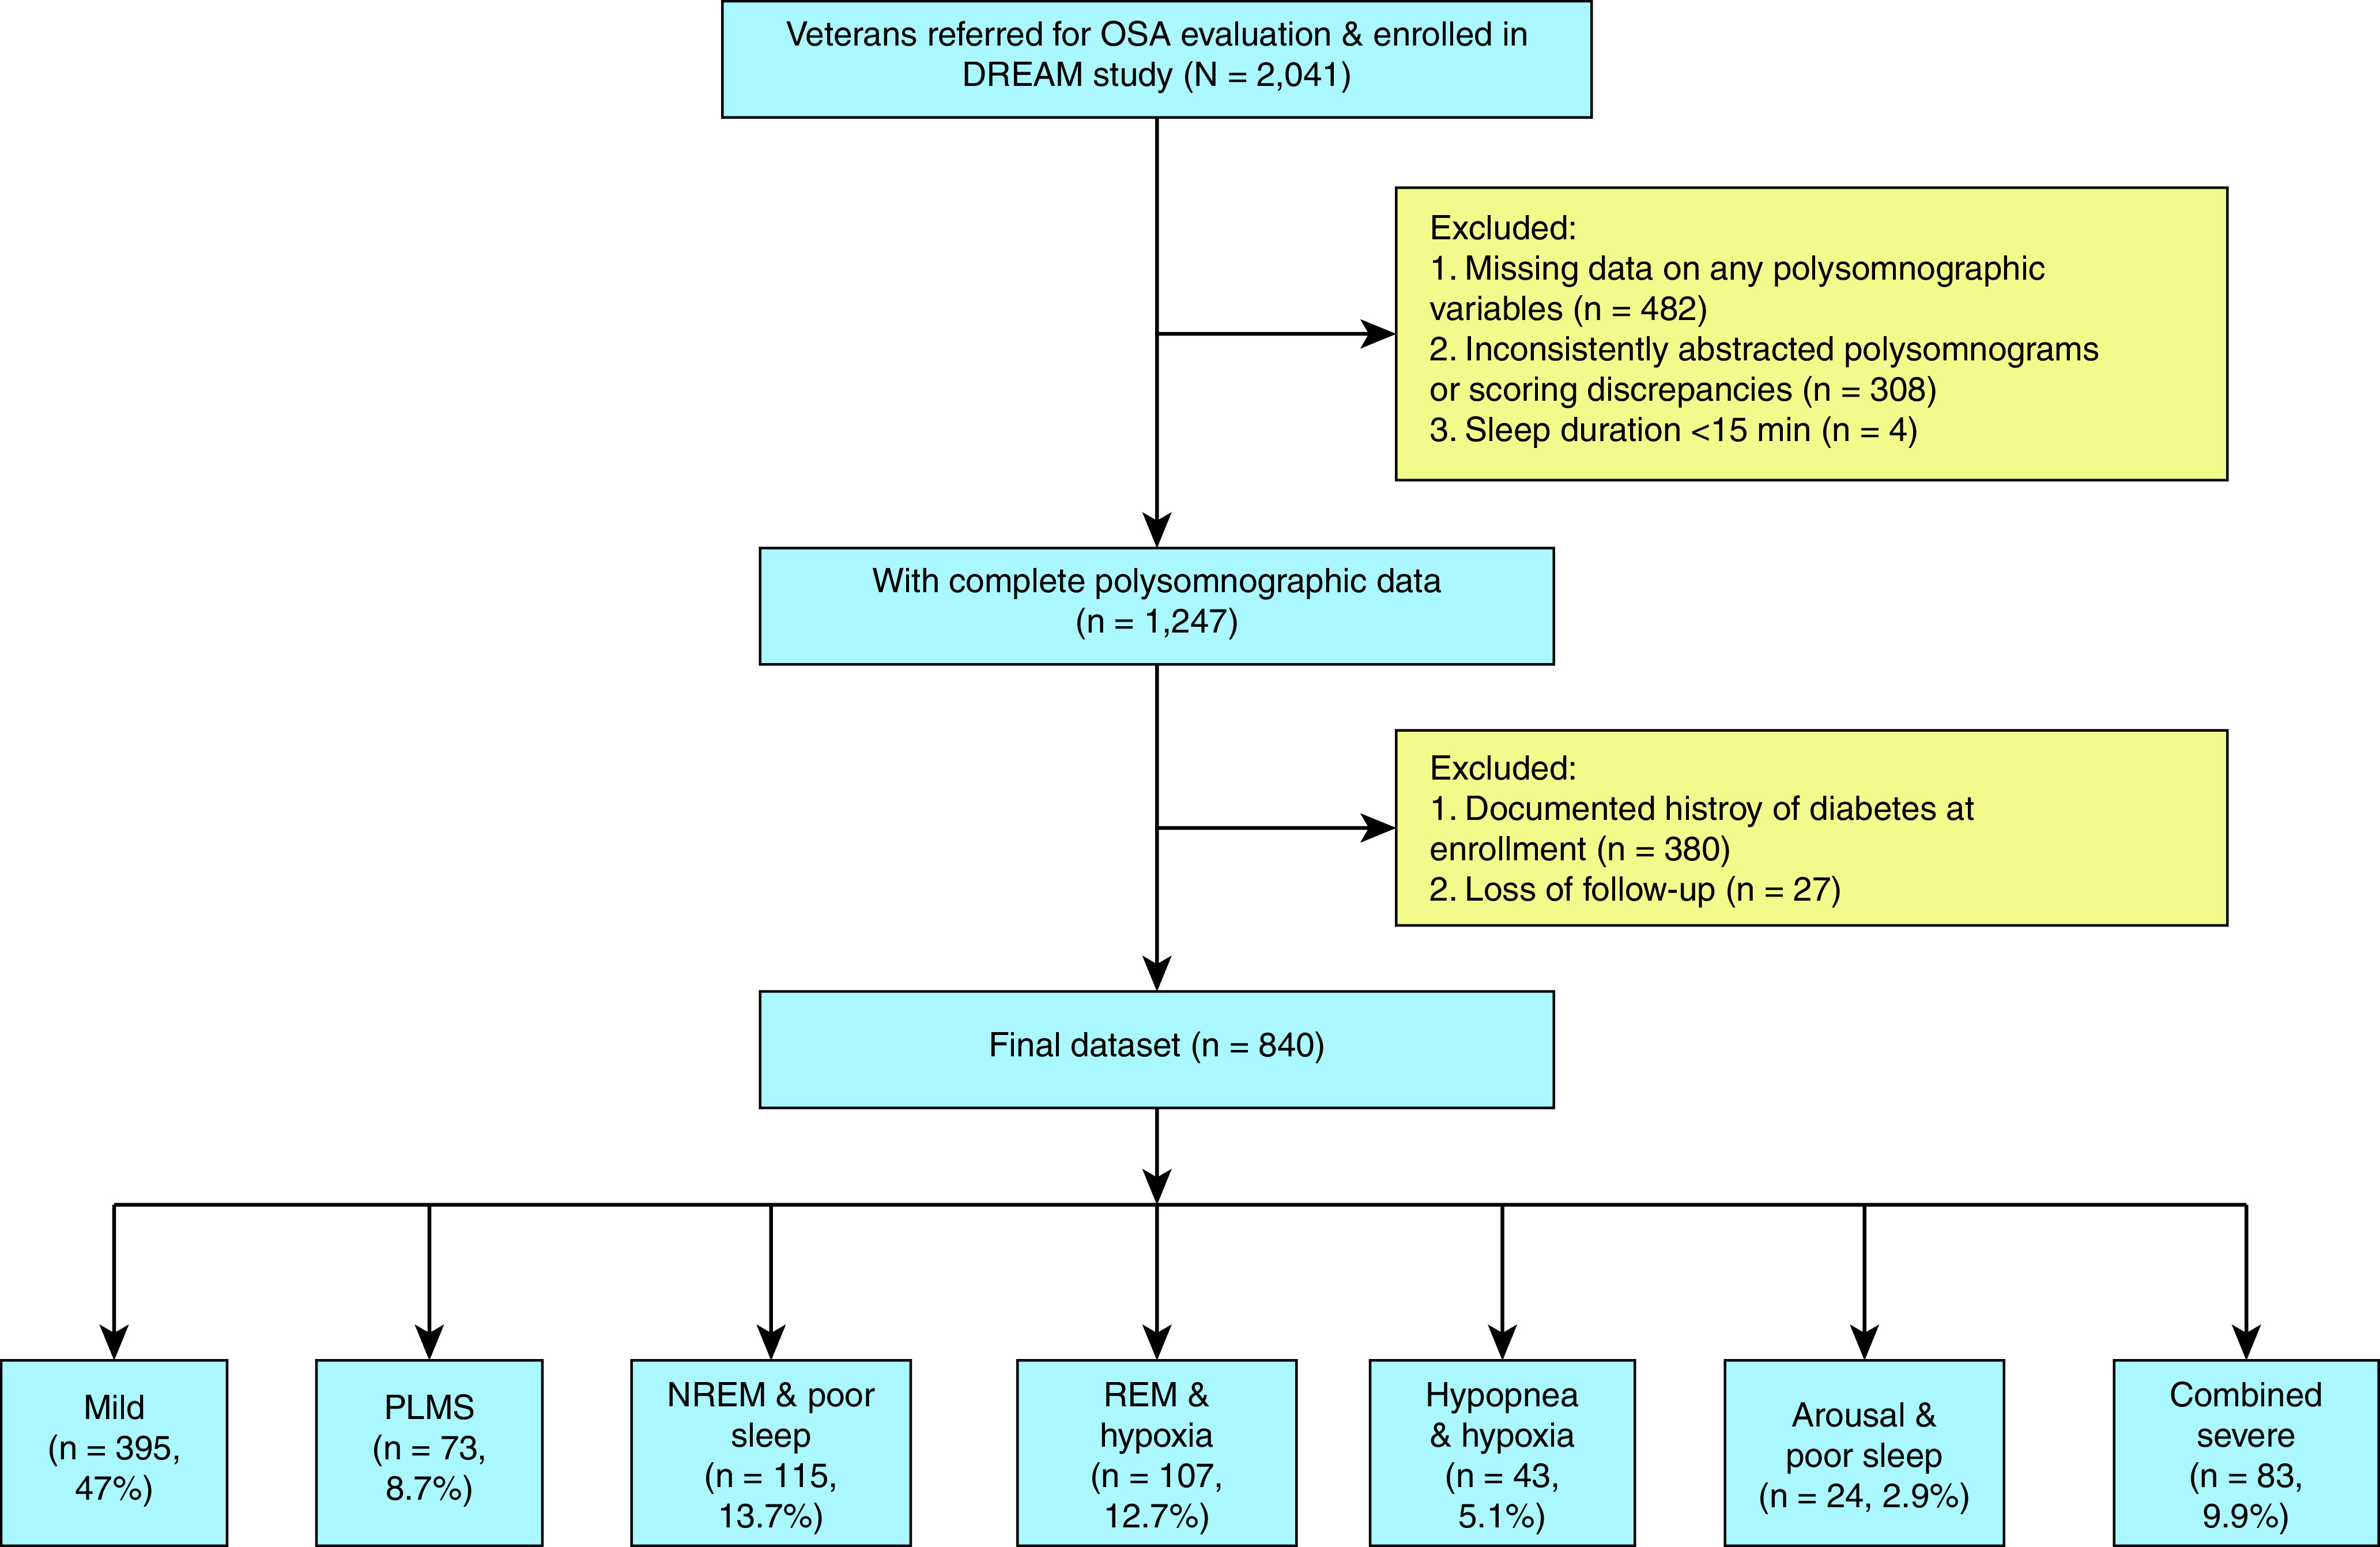
Selection of analytic sample. DREAM = Determining Risk of Vascular Events by Apnea Monitoring; NREM = non–rapid eye movement; OSA = obstructive sleep apnea; PLMS = periodic limb movements of sleep; REM = rapid eye movement.
Outcomes
Our primary outcome was incident T2DM, defined as a fasting glucose level >126 mg/dL with a corresponding new diagnosis of diabetes during follow-up. Two physician investigators, who were blinded to patients’ OSA status, reviewed electronic medical records to ascertain diabetes status.
Clinical Data
Demographic, anthropometric, and clinical variables, including measures of fasting glucose and HbA1c, body mass index (BMI), alcohol intake, smoking, medication usage, and details of medical history, were abstracted from electronic health records by experienced and trained research staff.
Sleep Studies and Polysomnographic Phenotypes
Sleep stages and events were scored at a single center (West Haven, Connecticut) by trained technicians according to standard criteria (21, 24). The AHI was determined using the hypopnea definition of 30% flow decrement associated with 4% arterial oxygen desaturation (24).
Previously, we identified seven distinct patient subgroups by applying cluster analysis to 29 polysomnographic variables from the following four domains believed to represent pathophysiological processes linking OSA to CVD: breathing disturbance, autonomic dysregulation, hypoxemia, and sleep disturbance (21, 22). See the full variable list in Tables E1 and E2 in the online supplement. The seven subgroups, referred to as “phenotypes,” were named according to their distinguishing polysomnographic features, as follows: mild, PLMS, non–rapid eye movement (NREM) and poor sleep, rapid eye movement (REM) and hypoxia, hypopnea and hypoxia, arousal and poor sleep, and combined severe (21). These phenotypes constitute the primary predictors in our study. Continuous positive airway pressure (CPAP) therapy adherence was dichotomized as regular use and not regular use. Further details of this CPAP use metric were previously published (21, 25).
Statistical Analyses
We summarized baseline characteristics and polysomnographic metrics using mean (±SD) or median (interquartile range) for continuous variables and using frequencies with proportions for categorical variables.
The T2DM incidence rate was calculated as the number of patients with the outcome divided by the total number of patient-years under observation, expressed as the number of events per 100 patient-years. The cumulative incidence of incident T2DM for each phenotype group was estimated by using the Kaplan-Meier method and compared among polysomnographic phenotypes using a log-rank test. Patients who did not develop incident T2DM were censored at either the end of follow-up or the time of death, whichever occurred first.
We used Cox proportional hazards regression survival models to evaluate associations between polysomnographic phenotypes and incident T2DM (with the mild phenotype designated as reference group). The Cox proportional hazards assumption was assessed and confirmed using a test of correlation between Schoenfeld residuals and survival time (26, 27) (Text E3).
Potential confounders were adjusted for in a sequence of six models to assess the role of each confounder domain (e.g., demographics, baseline blood glucose concentrations, obesity, BMI changes over time, comorbidities, and behavioral risk factors) (28). Because many comorbidities were considered as potential risk factors, to avoid model overfitting, we selected those reported in prior literature and those with P values of less than 0.1 on bivariate analyses with the primary outcome. The final model was adjusted for sex, age, race/ethnicity, baseline fasting glucose concentrations, BMI, changes of BMI over time, hypertension, heart failure, myocardial infarction, depression, smoking status, and alcohol use.
We also investigated whether OSA severity categories defined by AHI (AHI < 5, 5 ⩽ AHI < 15, 15 ⩽ AHI < 30, and AHI ⩾ 30 events/h) predicted incident T2DM. Covariates were adjusted for using the same procedure as for polysomnographic phenotypes. We also performed a sensitivity analysis with the same approach using hypoxia metrics (sleep time with oxygen saturation under 90%, oxygen desaturation index >4%, and nadir oxygen saturation).
To assess the added value of phenotypes (or AHI severity categories) in predicting incident T2DM, we first developed a parsimonious model of T2DM risk using the covariates noted above and excluding polysomnographic characteristics (“established risk factor model”). We then added the phenotypes (or AHI severity categories) to assess for improvement in the established risk factor model of T2DM using likelihood ratio tests (29) (P values from likelihood ratio tests are reported). Because diabetes is a major risk factor for cardiovascular morbidity and mortality and vice versa (30, 31), we conducted exploratory analyses to assess for overlap between the subjects who developed CVD events or death and those who developed T2DM (analytic details reported in Tables E8, E10, E11, and Text E9).
Statistical analyses were conducted using SAS version 9.4 (SAS Institute Inc.). A two-sided P value of 0.05 was used to assess statistical significance. Details about missing data, power calculation, parsimonious model building, and additional analyses are listed in the online supplement (Tables E4–E8, Text E9, and Tables E10–E13).
Results
Cohort Baseline Characteristics
Table 1 shows baseline characteristics of patients by diabetes status. Most (94%) patients were men with a mean age of 57 ± 12.4 years, BMI of 33.4 ± 6.9, and median (interquartile range, IQR) AHI of 12.0 (32.1) events/hour. Of the 122 patients who developed incident T2DM, 79 (64.8%) were receiving antidiabetic medications by the end of follow-up. Compared with patients without diabetes, patients who developed incident T2DM had higher baseline BMI, fasting blood glucose concentrations, and median AHI and greater oxygen desaturation and total arousal index.
Table 1.
Baseline characteristics of 840 patients stratified by diabetes status
| Characteristics | Incident T2DM (n = 122) | No Incident T2DM (n = 718) | All Patients (N = 840) | P Value* |
|---|---|---|---|---|
| Age, mean ± SD, yr | 55.7 ± 11.6 | 57.7 ± 12.5 | 57.4 ± 12.4 | 0.1003 |
| Sex, male, n (%) | 117 (95.9) | 676 (94.2) | 793 (94.4) | 0.4365 |
| Race, white, n (%) | 86 (70.5) | 577 (80.4) | 663 (78.9) | 0.0364 |
| Employed, n (%) | 40 (32.8) | 281 (39.1) | 321 (38.2) | 0.045 |
| BMI, mean ± SD | 36.1 ± 7.0 | 33.0 ± 6.8 | 33.4 ± 6.9 | <0.0001 |
| BMI change from baseline, mean ± SD | 0.7 ± 4.6 | −0.1 ± 4.2 | 0.0 ± 4.2 | 0.0437 |
| ESS, mean ± SD | 11.3 ± 6.1 | 10.9 ± 5.6 | 10.9 ± 5.7 | 0.5287 |
| Tobacco, current use, n (%) | 54 (44.6) | 238 (34.0) | 292 (35.5) | 0.0234 |
| Alcohol, current use, n (%) | 72 (60.0) | 353 (51.0) | 425 (52.3) | 0.0688 |
| Hypertension, n (%) | 87 (71.3) | 446 (62.1) | 533 (63.5) | 0.0512 |
| Coronary artery disease, n (%) | 22 (18.0) | 95 (13.2) | 117 (13.9) | 0.1567 |
| Congestive HF, n (%) | 7 (5.7) | 51 (7.1) | 58 (6.9) | 0.5824 |
| Prior CVD, n (%) | 5 (4.1) | 49 (6.8) | 54 (6.4) | 0.2563 |
| Atrial fibrillation, n (%) | 4 (3.3) | 46 (6.4) | 50 (6.0) | 0.1770 |
| MI within past 5 yr, n (%) | 11 (9.0) | 47 (6.5) | 58 (6.9) | 0.3197 |
| β-blockers, n (%) | 43 (35.2) | 215 (29.9) | 258 (30.7) | 0.2406 |
| Renal failure, n (%) | 1 (0.8) | 18 (2.5) | 19 (2.3) | 0.2452 |
| Chronic lung disease, n (%) | 41 (33.6) | 221 (30.8) | 262 (31.2) | 0.5397 |
| Cancer, n (%) | 5 (4.1) | 71 (9.9) | 76 (9.0) | 0.0393 |
| Depression, n (%) | 54 (44.3) | 260 (36.3) | 314 (37.5) | 0.0936 |
| PTSD, n (%) | 14 (11.5) | 78 (10.9) | 92 (11.0) | 0.8494 |
| Dementia, n (%) | 2 (1.6) | 10 (1.4) | 12 (1.4) | 0.8348 |
| AHI, median (IQR), events/hr | 19.5 (47.7) | 10.9 (29.8) | 12.0 (32.1) | <0.0001 |
| OSA severity by AHI categories | 0.0002 | |||
| No OSA (AHI < 5/hr), n (%) | 25 (20.5) | 257 (35.8) | 282 (33.6) | |
| Mild OSA (5 ⩽ AHI < 15/hr), n (%) | 27 (22.1) | 152 (21.2) | 179 (21.3) | |
| Moderate OSA (15 ⩽ AHI < 30/hr), n (%) | 15 (12.3) | 116 (16.2) | 131 (15.6) | |
| Severe OSA (AHI ⩾ 30/hr), n (%) | 55 (45.1) | 193 (26.9) | 248 (29.5) | |
| T60-89, median (IQR), % | 2.0 (13.0) | 1.0 (8.0) | 1.0 (9.0) | 0.0787 |
| Desat 2 to 4% Index, median (IQR), events/hr | 13.5 (19.1) | 8.4 (12.8) | 9.0 (14.4) | <0.0001 |
| Desat 4% or greater Index, median (IQR), events/hr | 18.2 (45.2) | 9.8 (23.4) | 10.9 (25.5) | 0.0008 |
| Total arousal index, median (IQR), events/hr | 43.6 (43.6) | 33.1 (34.8) | 34.8 (37.1) | 0.0005 |
| Sleep Efficiency, median (IQR), % | 77.3 (26.1) | 77.1 (24.8) | 77.2 (24.9) | 0.8885 |
| Regular CPAP use, n (%) | 48 (39.3) | 231 (32.2) | 279 (33.2) | 0.120 |
| Fasting glucose, mean ± SD, mg/dL | 114.0 ± 22.7 | 101.2 ± 18.3 | 103.0 ± 19.4 | <0.0001 |
| ADA impaired fasting glucose definition, n (%) | <0.0001 | |||
| Fasting glucose < 100 mg/dL | 23 (23.5) | 337 (55.4) | 360 (51.0) | |
| Impaired fasting glucose (100-125 mg/dL) | 53 (54.1) | 228 (37.5) | 281 (39.8) | |
| Fasting glucose ⩾ 126 mg/dL | 22 (22.4) | 43 (7.1) | 65 (9.2) | |
| WHO impaired fasting glucose definition, n (%) | <0.0001 | |||
| Fasting glucose < 100 mg/dL | 51 (52.0) | 479 (78.8) | 530 (75.1) | |
| Impaired fasting glucose (110-125 mg/dL) | 25 (25.5) | 86 (14.1) | 111 (15.7) | |
| Fasting glucose ⩾ 126 mg/dL | 22 (22.4) | 43 (7.1) | 65 (9.2) | |
| Antidiabetic medication at end of follow-up, n (%) | 79 (64.8) | 49 (6.8) | 128 (15.2) | <0.0001 |
Definition of abbreviations: ADA = American Diabetes Association; AHI = Apnea–Hypopnea Index; BMI = body mass index; CCI = Charlson comorbidity index; CPAP = continuous positive airway pressure therapy; CVD = cardiovascular disease; Desat = desaturation; ESS = Epworth sleepiness scale; HbA1c = hemoglobin A1c; HF = heart failure; IQR = interquartile range; MI = myocardial infarction; OSA = obstructive sleep apnea; PTSD = post-traumatic stress disorder; T60–89% = T60–89% O2 saturation index; WHO = World Health Organization.
P values compared the differences between patients with incident diabetes and those without diabetes.
Baseline Characteristics of Different Polysomnographic Phenotypes
The main polysomnographic features of phenotypes were similar to those reported in our prior study and are described below (21). Because OSA severity is conventionally assessed on the basis of AHI categories, we grouped the seven polysomnographic phenotypes into three AHI-based categories (<15 none/mild OSA, 15 to <30 moderate OSA, and ⩾30 severe OSA) to facilitate easier understanding of phenotypes characteristics.
None/Mild OSA
Patients with the mild phenotype exhibited the lowest AHI, greater sleep efficiency, and higher percentage of REM sleep and nadir nocturnal oxygen saturation (Table 2). The PLMS phenotype was characterized by the highest PLMS index and low respiratory event frequency (AHI = 12.6 events/h).
Table 2.
Polysomnographic features of OSA phenotypes grouped according to the domain (breathing disturbance, hypoxemia, sleep architecture disturbance and autonomic dysregulation)
| Phenotypes/variable | Mild | PLMS | NREM and Poor Sleep | REM and Hypoxia | Hypopnea and Hypoxia | Arousal and Poor Sleep | Combined Severe | P Value |
|---|---|---|---|---|---|---|---|---|
| N | 395 | 73 | 115 | 107 | 43 | 24 | 83 | |
| AHI, median (IQR) | 4.0 (9.5) | 12.6 (22.9) | 19.4 (31.9) | 19.2 (28.4) | 44.2 (34.1) | 62.9 (31.0) | 84.1 (26.7) | <0.0001 |
| Breathing disturbance | ||||||||
| Total apnea index, median (IQR) | 2.1 (5.8) | 7.3 (18.1) | 13.8 (29.3) | 14.1 (20.5) | 13.8 (33.3) | 55.6 (26.8) | 78.1 (26.3) | <0.0001 |
| Total hypopnea Index median (IQR) | 3.3 (6.2) | 7.4 (10.5) | 10.5 (13.7) | 9.1 (11.4) | 34.3 (20.3) | 10.3 (25.1) | 4.6 (11.2) | <0.0001 |
| % Obstructive apneas, mean ± SD | 66.0 ± 37.1 | 82.0 ± 27.4 | 78.7 ± 30.9 | 88.4 ± 18.9 | 88.9 ± 23.6 | 84.1 ± 27.1 | 82.6 ± 24.9 | <0.0001 |
| % Combined apneas, mean ± SD | 44.2 ± 32.0 | 47.4 ± 32.7 | 56.6 ± 30.0 | 54.0 ± 25.3 | 61.2 ± 29.7 | 30.7 ± 20.3 | 81.2 ± 20.0 | <0.0001 |
| % Apneas with arousal only, mean ± SD | 33.5 ± 33.8 | 36.6 ± 34.3 | 31.3 ± 29.6 | 16.3 ± 19.7 | 9.9 ± 18.9 | 66.3 ± 20.8 | 5.9 ± 7.0 | <0.0001 |
| REM: NREM apnea ratio, mean ± SD | 3.3 ± 7.1 | 1.8 ± 5.5 | 1.0 ± 4.4 | 8.0 ± 15.9 | 0.4 ± 1.3 | 0.2 ± 0.5 | 0.1 ± 0.3 | <0.0001 |
| Apnea D4: apnea arousal ratio, mean ± SD | 1.3 ± 2.9 | 0.9 ± 1.9 | 0.8 ± 1.7 | 3.5 ± 4.3 | 9.3 ± 13.0 | 0.1 ± 0.1 | 5.2 ± 9.9 | <0.0001 |
| Hypoxemia | ||||||||
| T < 90% O2 Index, median (IQR) | 0.00 (0.01) | 0.02 (0.09) | 0.01 (0.09) | 0.06 (0.18) | 0.06 (0.27) | 0.00 (0.01) | 0.21 (0.36) | <0.0001 |
| >4% desaturation index, median (IWR) | 4.0 (8.8) | 9.1 (15.5) | 17.5 (24.0) | 19.0 (22.5) | 49.3 (40.4) | 17.4 (37.1) | 74.7 (30.5) | <0.0001 |
| Lowest nocturnal O2% saturation, mean ± SD | 86.4 ± 4.0 | 83.4 ± 6.2 | 84.9 ± 4.7 | 72.6 ± 7.6 | 80.1 ± 5.8 | 87.3 ± 4.1 | 78.5 ± 6.3 | <0.0001 |
| Sleep architecture disturbance | ||||||||
| Sleep efficiency, mean ± SD | 78.9 ± 13.9 | 67.8 ± 19.2 | 56.4 ± 16.9 | 81.3 ± 12.8 | 67.9 ± 17.0 | 57.7 ± 25.2 | 69.7 ± 16.0 | <0.0001 |
| Stage 1%, median (IQR) | 13.3 (10.6) | 15.8 (17.9) | 38.8 (24.1) | 14.6 (15.9) | 20.7 (21.7) | 33.7 (25.7) | 30.8 (42.1) | <0.0001 |
| Stages 3 and 4%, median (IQR) | 2.2 (10.7) | 0.0 (5.8) | 0.0 (0.0) | 0.4 (7.3) | 0.0 (2.2) | 0.0 (0.0) | 0.0 (0.0) | <0.0001 |
| REM, median (IQR), % | 12.5 (12.8) | 6.1 (13.3) | 0.0 (8.0) | 12.8 (9.3) | 0.0 (4.7) | 0.0 (0.0) | 0.0 (0.0) | <0.0001 |
| Stage shift index, mean ± SD | 23.6 ± 10.1 | 27.4 ± 14.0 | 46.6 ± 23.6 | 23.6 ± 11.6 | 33.6 ± 19.6 | 56.1 ± 30.7 | 41.6 ± 24.5 | <0.0001 |
| Autonomic dysregulation | ||||||||
| Total arousal index, mean ± SD | 25.5 ± 12.2 | 41.7 ± 20.2 | 64.5 ± 23.9 | 35.7 ± 19.3 | 57.3 ± 26.9 | 85.1 ± 28.2 | 90.9 ± 25.0 | <0.0001 |
| % Spontaneous arousals, mean ± SD | 66.9 ± 21.3 | 40.6 ± 19.6 | 50.3 ± 21.6 | 43.2 ± 23.1 | 31.2 ± 14.2 | 17.8 ± 10.9 | 12.1 ± 10.1 | <0.0001 |
| PLMS index, median (IQR) | 0.0 (4.1) | 65.7 (28.8) | 0.0 (4.2) | 0.0 (4.1) | 0.0 (0.0) | 0.0 (0.8) | 0.0 (0.0) | <0.0001 |
Definition of abbreviations: AHI = Apnea–Hypopnea Index; BMI = body mass index; CPAP = continuous positive airway pressure therapy; ESS = Epworth sleepiness scale; HF = heart failure; MI = myocardial infarction; NREM = non–rapid eye movement; OSA = obstructive sleep apnea; PLMS = periodic limb movements of sleep; PTSD = post-traumatic stress disorder; REM = rapid eye movement; SD.
Numbers marked in bold indicate distinguishing features of each polysomnographic phenotype.
Moderate OSA
Despite similar AHIs, the polysomnographic features of the NREM and poor sleep phenotype and the REM and hypoxia phenotype were dramatically different. Impaired sleep architecture (56% sleep efficiency; 38% Stage 1 sleep), events in NREM sleep, and minimal hypoxia (T90% O2 index, 0.01) characterized the NREM and poor sleep phenotype. In contrast, patients with the REM and hypoxia phenotype exhibited relatively preserved sleep (81% sleep efficiency; 14% Stage 1 sleep) and experienced respiratory events during REM sleep with a higher burden of hypoxia (T90% O2 index, 0.06).
Severe OSA
Hypopneas comprised more than 75% of respiratory events in the hypopnea and hypoxia phenotype, with 9 of 10 events associated with ⩾4% desaturation. Despite lower AHI, the hypopnea and hypoxia phenotype exhibited higher burden of hypoxia compared with the arousal and poor sleep phenotype (AHI, 44 events/h and 63 events/h, respectively; T90% O2 index, 0.06 and 0.01, respectively). The latter phenotype was dominated by apneas with arousals only (66%) and markedly disturbed sleep (57% sleep efficiency; 33% Stage 1 sleep). The combined severe phenotype presented with markedly elevated AHIs and total apnea index, the highest percentage of combined apneas, and the most severe burden of hypoxia.
Regarding clinical features, patients in the mild phenotype were much younger, had the lowest BMI and fasting glucose concentration, had the highest prevalence of depression, and were less likely to have a history of hypertension or myocardial infarction (Table 3). Compared with the mild group, the PLMS, NREM and poor sleep, and REM and hypoxia groups were older, had more obesity, and were more likely to have a history of hypertension and use CPAP regularly. Patients with the hypopnea and hypoxia phenotype exhibited the highest BMI and baseline fasting glucose concentrations, and this group had the largest percentage of regular CPAP users. Compared with the combined severe phenotype, patients in the arousal and poor sleep group tended to be older, were more likely to have history of hypertension, and were less likely to use CPAP regularly. One-half of combined severe phenotype patients smoked.
Table 3.
Baseline clinical features stratified by polysomnographic phenotypes
| Phenotype/Variable | Mild | PLMS | NREM and Poor Sleep | REM and Hypoxia | Hypopnea and Hypoxia | Arousal and Poor Sleep | Combined Severe | P Value |
|---|---|---|---|---|---|---|---|---|
| N | 395 | 73 | 115 | 107 | 43 | 24 | 83 | |
| Age, mean ± SD, yr | 54.4 ± 12.6 | 64.9 ± 11.1 | 60.5 ± 11.1 | 57.0 ± 11.5 | 59.7 ± 12.5 | 67.3 ± 10.9 | 57.2 ± 10.5 | <0.0001 |
| Sex, male, N (%) | 361 (91.4) | 70 (95.9) | 113 (98.3) | 102 (95.3) | 41 (95.3) | 23 (95.8) | 83 (100.0) | 0.0162 |
| White, n (%) | 319 (80.8) | 63 (86.3) | 96 (83.5) | 75 (70.1) | 38 (88.4) | 16 (66.7) | 56 (67.5) | 0.0003 |
| Employed, n (%) | 155 (39.2) | 21 (28.8) | 47 (40.9) | 46 (43.0) | 12 (27.9) | 8 (33.3) | 32 (38.6) | 0.0001 |
| BMI, mean ± SD | 31.6 ± 6.1 | 32.7 ± 6.0 | 33.2 ± 7.0 | 36.0 ± 7.4 | 37.9 ± 7.8 | 35.9 ± 6.4 | 36.8 ± 6.6 | <0.0001 |
| BMI change, mean ± SD | 0.2 ± 4.0 | −0.5 ± 4.1 | 0.1 ± 3.6 | 0.2 ± 5.0 | −0.7 ± 3.7 | −2.9 ± 5.5 | 0.2 ± 4.6 | 0.0221 |
| Weight change, mean±SD, lbs | 1.8 ± 23.1 | −1.3 ± 21.8 | −0.9 ± 24.3 | 3.2 ± 27.7 | −3.1 ± 25.8 | −19.3 ± 33.7 | −2.5 ± 27.6 | 0.0039 |
| ESS, mean ± SD | 10.5 ± 5.8 | 9.7 ± 5.6 | 11.3 ± 5.6 | 11.4 ± 5.6 | 12.3 ± 5.5 | 10.2 ± 5.3 | 12.3 ± 5.9 | 0.2958 |
| Tobacco, current use, n (%) | 136 (35.4) | 23 (31.5) | 44 (38.6) | 31 (29.2) | 10 (24.4) | 7 (31.8) | 41 (50.0) | 0.0487 |
| Alcohol, current use, n (%) | 192 (50.1) | 34 (48.6) | 67 (60.9) | 48 (46.2) | 22 (53.7) | 15 (65.2) | 47 (58.0) | 0.1981 |
| Hypertension, n (%) | 218 (55.2) | 53 (72.6) | 78 (67.8) | 67 (62.6) | 33 (76.7) | 20 (83.3) | 64 (77.1) | <0.0001 |
| Coronary artery disease, n (%) | 43 (10.9) | 14 (19.2) | 21 (18.3) | 17 (15.9) | 4 (9.3) | 3 (12.5) | 15 (18.1) | 0.1811 |
| Congestive HF, n (%) | 18 (4.6) | 10 (13.7) | 10 (8.7) | 5 (4.7) | 5 (11.6) | 2 (8.3) | 8 (9.6) | 0.0505 |
| Prior CVD, n (%) | 27 (6.8) | 6 (8.2) | 8 (7.0) | 5 (4.7) | 1 (2.3) | 2 (8.3) | 5 (6.0) | 0.8718 |
| Atrial fibrillation, n (%) | 22 (5.6) | 5 (6.8) | 8 (7.0) | 7 (6.5) | 1 (2.3) | 4 (16.7) | 3 (3.6) | 0.3006 |
| MI within past 5 yr, n (%) | 22 (5.6) | 6 (8.2) | 12 (10.4) | 5 (4.7) | 2 (4.7) | 2 (8.3) | 9 (10.8) | 0.3427 |
| β-blockers, n (%) | 126 (31.9) | 20 (27.4) | 39 (33.9) | 40 (37.4) | 9 (20.9) | 7 (29.2) | 17 (20.5) | 0.1487 |
| Renal failure, n (%) | 6 (1.5) | 0 (0.0) | 6 (5.3) | 1 (0.9) | 2 (4.7) | 1 (4.2) | 3 (3.6) | 0.1118 |
| Chronic lung disease, n (%) | 125 (31.6) | 28 (38.4) | 31 (27.2) | 35 (32.7) | 10 (23.3) | 12 (50.0) | 21 (25.3) | 0.1573 |
| Cancer, n (%) | 36 (9.1) | 8 (11.0) | 16 (13.9) | 6 (5.6) | 5 (11.6) | 0 (0.0) | 5 (6.0) | 0.1833 |
| Depression, n (%) | 173 (43.8) | 31 (42.5) | 40 (35.1) | 33 (31.1) | 13 (30.2) | 4 (16.7) | 20 (24.1) | 0.0016 |
| PTSD, n (%) | 48 (12.2) | 6 (8.2) | 11 (9.6) | 13 (12.3) | 2 (4.7) | 3 (12.5) | 9 (10.8) | 0.7664 |
| Dementia, n (%) | 4 (1.0) | 3 (4.1) | 3 (2.6) | 1 (0.9) | 1 (2.3) | 0 (0.0) | 0 (0.0) | 0.2906 |
| OSA severity by AHI categories, n (%) | <0.0001 | |||||||
| No OSA (AHI < 5/h) | 220 (55.7) | 24 (32.9) | 23 (20.0) | 13 (12.1) | 2 (4.7) | 0 (0.0) | 0 (0.0) | |
| Mild OSA (5 ⩽ AHI < 15/h), n (%) | 110 (27.8) | 14 (19.2) | 22 (19.1) | 28 (26.2) | 4 (9.3) | 0 (0.0) | 1 (1.2) | |
| Moderate OSA (15 ⩽ AHI < 30/h) | 47 (11.9) | 23 (31.5) | 28 (24.3) | 28 (26.2) | 5 (11.6) | 0 (0.0) | 0 (0.0) | |
| Severe OSA (AHI ⩾ 30/h) | 18 (4.6) | 12 (16.4) | 42 (36.5) | 38 (35.5) | 32 (74.4) | 24 (100.0) | 82 (98.8) | |
| Regular CPAP use, n (%) | 94 (23.8) | 28 (38.4) | 41 (35.7) | 56 (52.3) | 24 (55.8) | 5 (20.8) | 31 (37.3) | <0.0001 |
| Fasting glucose, mean ± SD, mg/dL | 100.8 ± 17.2 | 102.1 ± 19.0 | 102.3 ± 16.3 | 103.4 ± 19.9 | 111.7 ± 24.3 | 108.1 ± 33.4 | 108.0 ± 22.4 | 0.0049 |
| Lowering-Glucose Medications, n (%) | 4 (1.0) | 2 (2.7) | 4 (3.5) | 3 (2.8) | 1 (2.3) | 1 (4.2) | 3 (3.6) | 0.5357 |
Definition of abbreviations: AHI = Apnea–Hypopnea Index; BMI = body mass index; CPAP = continuous positive airway pressure therapy; ESS = Epworth sleepiness scale; HF = heart failure; MI = myocardial infarction; NREM = non–rapid eye movement; OSA = obstructive sleep apnea; PLMS = periodic limb movements of sleep; PTSD = post-traumatic stress disorder; REM = rapid eye movement.
Unadjusted Incidence of T2DM
Over a median follow-up of 61.0 months, 122 (14.5%) patients developed incident T2DM (incidence rate, 3.0 per 100 person-years; 95% confidence interval [CI], 2.5–3.6). The incidence of new-onset T2DM (per 100 person-years) varied according to polysomnography phenotypes (Figure 2 and Table E14), with the highest rate in the hypopnea and hypoxia phenotype (6.8; 95% CI, 3.6–11.6), followed by arousal and poor sleep (5.8; 95% CI, 2.1–12.5), combined severe (4.4; 95% CI, 2.6–6.9), REM and hypoxia (4.3; 95% CI, 2.7–6.4), PLMS (3.7; 95% CI, 1.9–6.4), and mild (2.0; 95% CI, 1.4–2.7) phenotypes, whereas the NREM and poor sleep phenotype had the lowest incidence rate (1.9; 95% CI, 0.9–3.4).
Figure 2.

Rates of incident type 2 diabetes (T2DM) among individuals referred for OSA screening, stratified by polysomnographic phenotypes. Note that Apnea–Hypopnea Index (AHI) was not used in generating patient phenotypes. The red color data points denote incidence rate of T2DM for each phenotype; black color data points denote median AHI values for each phenotype. NREM = non–rapid eye movement; OSA = obstructive sleep apnea; PLMS = periodic limb movements of sleep; REM = rapid eye movement.
Associations between AHI/Polysomnographic Phenotypes and Risk of Incident T2DM
When patients were grouped by AHI severity categories, the unadjusted hazard ratio (HR) for incident T2DM was greater among patients with severe OSA (2.4; 95% CI, 1.5–3.9; P = 0.0003) than in those without OSA (Table E15). However, when accounting for confounders, the association between severe OSA and incident T2DM was no longer significant. In patients with mild OSA, the risk for incident T2DM remained greater than in those without OSA in the fully adjusted model (Model 6; 2.1; 95% CI, 1.1–4.1; P = 0.024). After accounting for competing risk of death in the fully adjusted model, both mild and severe OSA were associated with increased risk of T2DM (Table E16) (HR, 2.8; 95% CI, 1.4–5.5, and HR, 2.4; 95% CI, 1.2–4.9, respectively).
In comparison, when stratifying patients by polysomnographic phenotypes, the cumulative risk of incident T2DM differed greatly among phenotypes (Figure 3). Compared with mild group patients, the risk of new-onset T2DM was much greater for those in PLMS, REM and hypoxia, hypopnea and hypoxia, and combined severe groups in the unadjusted model and models adjusted for sex, age, race/ethnicity, and fasting glucose concentrations (Figure 4 and Table 4). After adjustment for BMI and changes of BMI over time (Model 4; Table 4), only phenotypes of PLMS and hypopnea and hypoxia (vs. mild) were associated with increased risk of T2DM (Model 4; 2.4; 95% CI, 1.1–5.0 [P = 0.03], and 3.3; 95% CI, 1.6–6.9 [P = 0.002], respectively). Further adjustment for comorbidities and behavioral risk factors (Models 5 and 6) did not alter conclusions. Adjustment for changes in BMI over time or CPAP use to the final model did not affect the associations. In adjusted analyses, hypoxia measures alone were not significantly associated with incident T2DM (Table E12). After accounting for death as a competing event, HRs were similar for PLMS and hypopnea and hypoxia phenotypes compared with HRs obtained in the fully adjusted Cox proportional hazards models (Table E17) (2.8; 95% CI, 1.3–6.4, and 3.7; 95% CI, 1.68–8.1, respectively).
Figure 3.

Kaplan-Meier curves for the association of polysomnographic phenotypes and incident type 2 diabetes. NREM = non–rapid eye movement; PLMS = periodic limb movements of sleep; REM = rapid eye movement.
Figure 4.

Unadjusted and fully adjusted HRs for incident type 2 diabetes in patients who were referred for obstructive sleep apnea evaluation, stratified by polysomnographic phenotypes. Adjustments include age, sex, race, fasting blood glucose, body mass index (BMI), changes in BMI, history of heart failure, myocardial infarction, hypertension, depression, alcohol use, smoking. AHI = Apnea–Hypopnea Index; CL = confidence level; HR = hazard ratio; LCL = lower bound of the confidence level; UCL = upper bound of the confidence level; NREM = non–rapid eye movement; PLMS = periodic limb movements of sleep; REM = rapid eye movement.
Table 4.
Cox proportional hazards regression models of incident T2DM in patients who were referred for OSA evaluation, stratified by polysomnographic phenotypes
| Mild (n = 395) | PLMS (n = 73) | NREM and Poor Sleep (n = 115) | REM and Hypoxia (n = 107) | Hypopnea and Hypoxia (n = 43) | Arousal and Poor Sleep (n = 24) | Combined Severe (n = 83) | |
|---|---|---|---|---|---|---|---|
| Model 1, unadjusted* | 1 (Reference) | 1.85 (0.97–3.53) | 0.96 (0.49–1.87) | 2.15 (1.28–3.60) | 3.42 (1.83–6.41) | 2.90 (1.23–6.84) | 2.22 (1.27–3.88) |
| Model 2: Model 1 + age + sex + race | 1 (Reference) | 2.17 (1.10–4.28) | 1.04 (0.53–2.05) | 2.05 (1.22–3.46) | 3.65 (1.94–6.88) | 3.13 (1.27–7.72) | 2.16 (1.23–3.83) |
| Model 3: Model 2 + fasting blood glucose | 1 (Reference) | 2.68 (1.30–5.56) | 0.84 (0.36–1.93) | 1.97 (1.08–3.60) | 4.27 (2.16–8.44) | 2.19 (0.79–6.05) | 1.93 (1.03–3.61) |
| Model 4: Model 3 + BMI + BMI changes over time | 1 (Reference) | 2.36 (1.11–5.02) | 0.74 (0.32–1.73) | 1.46 (0.76–2.81) | 3.30 (1.58–6.91) | 1.84 (0.63–5.38) | 1.61 (0.84–3.09) |
| Model 5: Model 4 + comorbidities (history of HTN, MI, HF, or depression) | 1 (Reference) | 2.42 (1.14–5.17) | 0.74 (0.32–1.73) | 1.52 (0.78–2.94) | 3.12 (1.49–6.52) | 1.72 (0.59–5.07) | 1.52 (0.78–2.98) |
| Model 6: Model 5 + behavioral risk factors (alcohol use and smoking) | 1 (Reference) | 2.36 (1.11–5.05) | 0.74 (0.31–1.73) | 1.28 (0.63–2.58) | 3.18 (1.52–6.66) | 1.46 (0.47–4.58) | 1.35 (0.68–2.68) |
| Sensitivity analyses | |||||||
| Model 6 + CPAP use | 1 (Reference) | 2.25 (1.05–4.82) | 0.79 (0.34–1.84) | 1.48 (0.74–2.95) | 3.14 (1.48–6.64) | 1.41 (0.46–4.35) | 1.42 (0.72–2.79) |
| Model 6 + chronic lung disease† | 1 (Reference) | 2.3 (1.07–4.91) | 0.83 (0.36–1.95) | 1.50 (0.76–2.97) | 3.29 (1.58–6.89) | 1.43 (0.47–4.39) | 1.46 (0.75–2.88) |
Definition of abbreviations: BMI = body mass index; CPAP = continuous positive airway pressure; HF = heart failure; HTN = hypertension; MI = myocardial infarction; NREM = non–rapid eye movement; OSA = obstructive sleep apnea; PLMS = periodic limb movements of sleep; REM = rapid eye movement; T2DM = type 2 diabetes.
Data are given as hazard ratio (95% confidence interval).
Model 1 includes polysomnographic phenotypes only.
Chronic lung disease in our study was defined as any of the following: chronic bronchitis, emphysema, asbestosis with symptoms, pneumoconiosis, chest X-ray suggestive of chronic obstructive pulmonary disease if the patient has symptoms and/or is under treatment, diagnosis of asthma on standing inhalers or systemic steroids, sarcoidosis, restrictive lung disease, pneumonectomy, or lung fibrosis.
Prognostic Value of Polysomnographic Phenotypes Versus AHI
Analyses using likelihood ratio tests show that polysomnographic phenotypes greatly improved the predictive value of a parsimonious T2DM risk model based on established predictors, increasing the likelihood ratio from 40.5 to 54.4 (likelihood ratio test P = 0.031; χ2 of 13.9; Table E18). However, addition of AHI to the established risk factor model did not improve the predictive ability of the established risk factor model for T2DM risk (P = 0.053; χ2 of 7.7; Table E18).
Potential Overlap between CVD and Incident T2DM risk
In prior work, we showed that polysomnographic phenotypes differentially predispose to CVD or death (21). In our current sample (patients without preexisting diabetes), of the patients who ultimately developed T2DM, the percentage of patients who also developed incident CVD or death varied across different phenotypes (Table E8 and Text E9) and was relatively low (ranging from 0% [95% CI, 0.0–45.9%] for the arousal and poor sleep phenotype to 27.8% [95% CI, 9.7–54.0%] for the combined severe group). The incidence of T2DM among those with and without baseline CVD was similar (8.5–33.3% and 8.4–35.3%, respectively), with relatively low overlap that also varied by phenotype (Table E10).
We observed a significant association between PLMS phenotype and T2DM risk only among patients with baseline CVD (Table E11; HR, 7.39; 95% CI, 1.89–28.85). Among those free of CVD at baseline, the hypopnea and hypoxia phenotype was significantly associated with increased risk for incident T2DM (Table E11; HR, 3.48; 95% CI, 1.57–7.73).
Discussion
Although it is known that OSA is a risk factor for T2DM, we found that distinct polysomnographic phenotypes were differentially associated with incident T2DM. The crude incidence of T2DM was 3.0/100 person-years in our predominantly male study population, which was 4.3 times higher than the incidence observed in U.S. adults (32). Specifically, compared with individuals with the mild phenotype, those with PLMS and hypopnea and hypoxia phenotypes exhibited more than twofold and threefold increased T2DM risk, respectively. Although polysomnographic phenotypes and AHI severity categories were independently associated with incident T2DM, the addition of polysomnographic phenotypes to known T2DM risk factors such as obesity, fasting blood glucose, and smoking greatly improved the predictive value of the T2DM risk prediction model according to likelihood ratio tests. These findings provide new clues for deciphering pathophysiological mechanisms that underlie the association between various abnormalities in polysomnographic metrics and T2DM.
To our knowledge, these data are the first to use multiple polysomnographic phenotypes to identify and characterize a subgroup of patients with OSA who are most susceptible to incident T2DM. Our findings that patients with the hypopnea and hypoxia phenotype were independently associated with markedly higher T2DM risk are consistent with the hypothesis that sleep-related hypoxia is related to insulin resistance and glucose intolerance in the development of T2DM (33–35). Potential mechanisms underlying the association between the hypopnea and hypoxia phenotype and T2DM may include a direct effect of hypoxia on glucose intolerance and insulin resistance (36); modification effect of hypoxia in the pattern of hypothalamic-pituitary-adrenal axis that leads to cortisol levels elevation (35); endothelial dysfunction in capillary and arteriolar microcirculation triggered by hypoxia (37, 38); and hypoxia-inducible factor-1–dependent pancreatic β-cell dysfunction manifesting as insulin hypersecretion and resistance (39, 40). In aggregate, these data support a central role for hypoxia during sleep in metabolic abnormalities.
Our data also demonstrate that not all patients with OSA-related hypoxia have the same risk for T2DM. For example, phenotypes of REM and hypoxia and combined severe exhibit a similar or higher degree burden of hypoxia but were not associated with T2DM in adjusted analyses. When comparing characteristics of these three groups, highest BMI, higher indices of hypopneas, and a greater ratio of apnea with 4% desaturations only to apneas with arousals only were noted in the hypopnea and hypoxia group. Notably, a mediation analysis of T2DM risk in the hypopnea and hypoxia phenotype (adjustment for T90%, ODI > 4% or nadir O2 saturation) revealed that risk persisted, with only a 7% HR reduction after accounting for T90% (Table E12), suggesting that hypoxia alone (as measured by current metrics) is not solely responsible for higher T2DM risk. Therefore, we speculate that a combination of hypoxia and cardiometabolic risk factors, including obesity and elevated fasting glucose, might be involved in development of T2DM in the hypopnea and hypoxia group. In exploratory analyses, we observed the association between the hypopnea and hypoxia phenotype and incident T2DM among participants with obesity (HR, 3.57; 95% CI, 1.68–7.56), potentially supporting this notion (Table E13). The rate of oxygen desaturation and the degree of upper airway obstruction may also play a role in the association between hypopnea and hypoxia and incident T2DM given the known association between rapid desaturation and CVD comorbidities (41, 42). Thus, future studies on OSA and T2DM risk should consider the interaction of factors such as obesity, desaturation rate, and degrees of upper airway obstruction because these factors may not only determine the risk and severity of OSA but also the risk of T2DM.
A novel finding in the current study is the positive association of the PLMS phenotype with incident T2DM. Several lines of evidence support the importance of PLMS and their consequences in OSA. First, sympathetic activation is greater for periodic limb movements than for other movements in sleep and is probably causally related to the pathogenesis of periodic limb movements (43). The magnitude and frequency of movements can vary depending on the magnitude and frequency of oscillation of sympathetic nerve activity (43, 44). Second, periodic limb movements and OSA may have additive effects on systemic inflammation, and such movements are independently associated with inflammation markers, including plasma C-reactive protein and fibrinogen (45). Third, periodic limb movements during sleep are associated with prevalent hypertension and incident myocardial infarction (46–48). Although the effect of periodic limb movements on myocardial infarction risk may be independent of its effect on blood pressure, T2DM often coexists with multiple CVD risk factors such as hypertension and obesity, and it is associated with CVD morbidity and mortality (48–50). Further studies are needed to confirm our findings in other cohorts and to determine whether periodic limb movements act synergistically or independently of OSA in conferring risk for T2DM.
Although pathophysiological processes in the causal pathway of OSA and CVD (21, 22) may also link OSA and T2DM, our exploratory analyses revealed relatively low overlap between subjects who developed both (<30%) (Table E8 and Text E9). This suggests that, in addition to the shared pathways between T2DM and CVD, such as sedentary behavior, obesity (51), or the degree of OSA-induced hypoxia (52), there are also unique mechanisms for each disease. This is consistent with prior mendelian randomization studies that identified shared genes for T2DM and CVD but also suggested that the shared pathways may have divergent effects on T2DM and CVD (53, 54). It is plausible that such pathways may be reflected in polysomnographic phenotypes of OSA. Although our study was not powered to detect significant differences in T2DM and CVD co-occurrence, we observed that the presence of CVD at baseline may modify the risk of T2DM among the phenotypes. For example, among those free of CVD, the risk is increased only for the hypopnea and hypoxia group. In contrast, among those with established CVD, only the PLMS phenotype was at higher risk of T2DM, suggesting that the increased sympathetic outflow, altered heart rate, and blood pressure variability observed in both CVD and PLMS may play a role in overlap between risk of CVD and T2DM (12). We note that caution must be used when interpreting these exploratory analyses, especially among those with prevalent CVD. The Small sample size of this group may have resulted in insufficient power to detect significant associations or identifying erroneous ones because of sampling bias. Future work, assessing the impact of OSA’s polysomnographic features on incidence of both T2DM and CVD, may help dissect the shared predisposition for and unique mechanisms of these common disorders.
Our study confirms and extends findings of previous reports that evaluated the relationship between T2DM risk and AHI (4, 5, 14). Importantly, we compared the fit of predictive models that included AHI with polysomnographic phenotypes using likelihood ratio tests. These tests indicated that the addition of polysomnographic phenotypes to the parsimonious model resulted in greatly improved T2DM prediction compared with the parsimonious model. Our finding suggests that assessment of polysomnographic phenotypes may help identify patients at increased risk for T2DM more accurately than solely relying on AHI assessment.
Contrary to previous studies that found increasing OSA severity to be associated with increasing risk for T2DM (4, 5, 14), we found that mild and severe OSA categories were independently associated with incident T2DM. To account for potential confounders unequally distributed between OSA severity categories, we progressively adjusted for multiple covariates. Risk for T2DM in mild OSA category (vs. no OSA) remained elevated after adjustments. It is plausible that increased risk with mild OSA was observed because of unmeasured risk factors, such as poor diet or sedentary lifestyle (51). Alternatively, our findings may suggest a nonlinear, U-shaped association between AHI and T2DM risk. Notably and similar to our findings, a recent study suggests a U-shaped relationship between myocardial infarct size and AHI, whereby risk was lowest for patients with moderate OSA (55). These observations are supported by animal models of hypoxemic preconditioning (56). The above findings highlight a clear need to better understand which consequences of OSA physiology portend T2DM risk.
There are several study limitations to consider when interpreting our findings. First is the retrospective design and criteria used to define incident T2DM, which may have limited our sample size and choice of variables. Because HbA1c was made the recommended criterion in 2010 and was not measured routinely during the study period, HbA1c was missing for most patients and thus not used to define T2DM. However, we used a rigorous definition that required elevated fasting blood glucose and a chart-documented diagnosis determined by physicians blinded to the analyses. Second, although strict criteria were used to identify incident T2DM, it is possible a small proportion of prevalent cases may be misclassified as incident cases. Because of the insidious nature of T2DM, patients may not have any symptoms and are less likely to be tested or diagnosed. However, we have to acknowledge that our study did not include other metrics of physiological sleep disturbances such as hypoxic burden and heart rate responses in identifying polysomnographic phenotypes, which could be an additional limitation (57, 58). These new metrics should be incorporated in future work investigating T2DM risk. Finally, our sample consisted of mainly male veterans, which will affect generalizability of study results. Notably, prior reports indicate that sex did not modify the association between OSA severity and incident diabetes (59, 60). Moreover, T2DM and OSA are both common among veterans, supporting the clinical relevance of our findings in this vulnerable population (4).
Conclusions
Our study provides evidence that polysomnographic phenotypes can be useful in predicting T2DM among individuals referred for OSA evaluation. Specifically, patients with polysomnographic features such as those with phentoypes of PLMS and hypopnea and hypoxia have greater risk for T2DM than individuals without OSA. We found that the inclusion of polysomnographic phenotypes, but not AHI, improved the predictive value of a T2DM risk model based on established risk factors such as BMI and fasting blood glucose levels. Our results, together with those of previous studies, suggest other polysomnographic measures may improve diabetes risk stratification. Findings in this study add to growing literature implicating increased risk of T2DM in OSA and could help characterize high-risk subgroups that might not be identified using AHI alone.
Acknowledgments
Acknowledgment
The authors thank U.S. veterans, staff at the Clinical Epidemiology Research Center at Connecticut’s Veterans Affairs Medical Center, and faculty and fellows of Yale’s Sections of Pulmonary and Endocrinology, Critical Care and Sleep Medicine, who provided valuable feedback in formulating this work.
Footnotes
Supported by the Veterans Affairs Clinical Science Research and Development (CSR&D) Merit Review Program (CSRDS07), Veterans Affairs Cooperative Studies Program, National Institutes of Health K24HL132093, and the Parker B. Francis Fellowship award.
Author Contributions: All authors contributed substantially to the conception, design, analysis, or interpretation of the data in this study. L.Q., H.K.Y., and A.V.Z. had full access to all the data in the study and take responsibility for the integrity and the accuracy of the data analyses. Q.D., L.Q., S.E.I., H.K.Y., and A.V.Z. were involved in the interpretation of data. Q.D., L.Q., and A.V.Z. drafted the manuscript. Q.D., L.Q., B.W., S.E.I., A.I., D.M.B., K.P.S., H.K.Y., and A.V.Z. revised it critically for important intellectual content. Q.D., L.Q., B.W., S.E.I., A.I., D.M.B., K.P.S., H.K.Y., and A.V.Z. gave final approval of this version to be submitted.
This article has an online supplement, which is accessible from this issue's table of contents at www.atsjournals.org
Author disclosures are available with the text of this article at www.atsjournals.org.
References
- 1. Peppard PE, Young T, Barnet JH, Palta M, Hagen EW, Hla KM. Increased prevalence of sleep-disordered breathing in adults. Am J Epidemiol. 2013;177:1006–1014. doi: 10.1093/aje/kws342. [DOI] [PMC free article] [PubMed] [Google Scholar]
- 2. Yaggi HK, Concato J, Kernan WN, Lichtman JH, Brass LM, Mohsenin V. Obstructive sleep apnea as a risk factor for stroke and death. N Engl J Med. 2005;353:2034–2041. doi: 10.1056/NEJMoa043104. [DOI] [PubMed] [Google Scholar]
- 3. Marin JM, Agusti A, Villar I, Forner M, Nieto D, Carrizo SJ, et al. Association between treated and untreated obstructive sleep apnea and risk of hypertension. JAMA. 2012;307:2169–2176. doi: 10.1001/jama.2012.3418. [DOI] [PMC free article] [PubMed] [Google Scholar]
- 4. Botros N, Concato J, Mohsenin V, Selim B, Doctor K, Yaggi HK. Obstructive sleep apnea as a risk factor for type 2 diabetes. Am J Med. 2009;122:1122–1127. doi: 10.1016/j.amjmed.2009.04.026. [DOI] [PMC free article] [PubMed] [Google Scholar]
- 5. Xu PH, Hui CKM, Lui MMS, Lam DCL, Fong DYT, Ip MSM. Incident Type 2 Diabetes in OSA and Effect of CPAP Treatment: A Retrospective Clinic Cohort Study. Chest. 2019;156:743–753. doi: 10.1016/j.chest.2019.04.130. [DOI] [PubMed] [Google Scholar]
- 6. Sarwar N, Gao P, Seshasai SR, Gobin R, Kaptoge S, Di Angelantonio E, et al. Emerging Risk Factors Collaboration. Diabetes mellitus, fasting blood glucose concentration, and risk of vascular disease: a collaborative meta-analysis of 102 prospective studies. Lancet. 2010;375:2215–2222. doi: 10.1016/S0140-6736(10)60484-9. [DOI] [PMC free article] [PubMed] [Google Scholar]
- 7. Kent BD, Grote L, Bonsignore MR, Saaresranta T, Verbraecken J, Lévy P, et al. European Sleep Apnoea Database collaborators. Sleep apnoea severity independently predicts glycaemic health in nondiabetic subjects: the ESADA study. Eur Respir J. 2014;44:130–139. doi: 10.1183/09031936.00162713. [DOI] [PubMed] [Google Scholar]
- 8. Tasali E, Mokhlesi B, Van Cauter E. Obstructive sleep apnea and type 2 diabetes: interacting epidemics. Chest. 2008;133:496–506. doi: 10.1378/chest.07-0828. [DOI] [PubMed] [Google Scholar]
- 9. Tasali E, Ip MS. Obstructive sleep apnea and metabolic syndrome: alterations in glucose metabolism and inflammation. Proc Am Thorac Soc. 2008;5:207–217. doi: 10.1513/pats.200708-139MG. [DOI] [PubMed] [Google Scholar]
- 10. Punjabi NM. Workshop Participants. Do sleep disorders and associated treatments impact glucose metabolism? Drugs. 2009;69:13–27. doi: 10.2165/11531150-000000000-00000. [DOI] [PubMed] [Google Scholar]
- 11. Reutrakul S, Mokhlesi B. Obstructive sleep apnea and diabetes: a state of the art review. Chest. 2017;152:1070–1086. doi: 10.1016/j.chest.2017.05.009. [DOI] [PMC free article] [PubMed] [Google Scholar]
- 12. Wang N, Khan SA, Prabhakar NR, Nanduri J. Impairment of pancreatic β-cell function by chronic intermittent hypoxia. Exp Physiol. 2013;98:1376–1385. doi: 10.1113/expphysiol.2013.072454. [DOI] [PMC free article] [PubMed] [Google Scholar]
- 13.Marshall NS, Wong KK, Phillips CL, Liu PY, Knuiman MW, Grunstein RR. Is sleep apnea an independent risk factor for prevalent and incident diabetes in the Busselton Health Study? J Clin Sleep Med. 2009;5:15–20. [PMC free article] [PubMed] [Google Scholar]
- 14. Kendzerska T, Gershon AS, Hawker G, Tomlinson G, Leung RS. Obstructive sleep apnea and incident diabetes. A historical cohort study. Am J Respir Crit Care Med. 2014;190:218–225. doi: 10.1164/rccm.201312-2209OC. [DOI] [PubMed] [Google Scholar]
- 15. Zinchuk A, Yaggi HK. Phenotypic subtypes of OSA: a challenge and opportunity for precision medicine. Chest. 2020;157:403–420. doi: 10.1016/j.chest.2019.09.002. [DOI] [PMC free article] [PubMed] [Google Scholar]
- 16. Carberry JC, Amatoury J, Eckert DJ. Personalized management approach for OSA. Chest. 2018;153:744–755. doi: 10.1016/j.chest.2017.06.011. [DOI] [PubMed] [Google Scholar]
- 17. Conwell W, Patel B, Doeing D, Pamidi S, Knutson KL, Ghods F, et al. Prevalence, clinical features, and CPAP adherence in REM-related sleep-disordered breathing: a cross-sectional analysis of a large clinical population. Sleep Breath. 2012;16:519–526. doi: 10.1007/s11325-011-0537-6. [DOI] [PubMed] [Google Scholar]
- 18. Koch H, Schneider LD, Finn LA, Leary EB, Peppard PE, Hagen E, et al. breathing disturbances without hypoxia are associated with objective sleepiness in sleep apnea. Sleep (Basel) 2017;40:zsx152. doi: 10.1093/sleep/zsx152. [DOI] [PMC free article] [PubMed] [Google Scholar]
- 19. Edwards BA, Redline S, Sands SA, Owens RL. More than the sum of the respiratory events: personalized medicine approaches for obstructive sleep apnea. Am J Respir Crit Care Med. 2019;200:691–703. doi: 10.1164/rccm.201901-0014TR. [DOI] [PMC free article] [PubMed] [Google Scholar]
- 20. Zinchuk AV, Gentry MJ, Concato J, Yaggi HK. Phenotypes in obstructive sleep apnea: a definition, examples and evolution of approaches. Sleep Med Rev. 2017;35:113–123. doi: 10.1016/j.smrv.2016.10.002. [DOI] [PMC free article] [PubMed] [Google Scholar]
- 21. Zinchuk AV, Jeon S, Koo BB, Yan X, Bravata DM, Qin L, et al. Polysomnographic phenotypes and their cardiovascular implications in obstructive sleep apnoea. Thorax. 2018;73:472–480. doi: 10.1136/thoraxjnl-2017-210431. [DOI] [PMC free article] [PubMed] [Google Scholar]
- 22. Leung RS, Comondore VR, Ryan CM, Stevens D. Mechanisms of sleep-disordered breathing: causes and consequences. Pflugers Arch. 2012;463:213–230. doi: 10.1007/s00424-011-1055-x. [DOI] [PubMed] [Google Scholar]
- 23. Ding Q, Qin L, Wojeck B, Inzucchi SE, Ibrahim A, Bravata DM, et al. Associations between polysomnographic phenotypes of obstructive sleep apnea and incident type 2 diabetes. Am J Respir Crit Care Med . 2021;203:A4679. doi: 10.1513/AnnalsATS.202012-1556OC. [DOI] [PMC free article] [PubMed] [Google Scholar]
- 24.Koo BB, Won C, Selim BJ, Qin L, Jeon S, Redeker NS, et al. The Determining Risk of Vascular Events by Apnea Monitoring (DREAM) study: design, rationale, and methods. Sleep Breath. 2016;20:893–900. doi: 10.1007/s11325-015-1254-3. [DOI] [PubMed] [Google Scholar]
- 25. Zinchuk A, Edwards BA, Jeon S, Koo BB, Concato J, Sands S, et al. prevalence, associated clinical features, and impact on continuous positive airway pressure use of a low respiratory arousal threshold among male united states veterans with obstructive sleep apnea. J Clin Sleep Med. 2018;14:809–817. doi: 10.5664/jcsm.7112. [DOI] [PMC free article] [PubMed] [Google Scholar]
- 26. Schoenfeld D. Partial residuals for the proportional hazards regression model. Biometrika. 1982;69:239–241. [Google Scholar]
- 27. Hosmer D, Lemeshow S, May S. Applied survival analysis: regression modeling of time to event data. J Am Stat Assoc. 2000;95 [Google Scholar]
- 28. McNamee R. Regression modelling and other methods to control confounding. Occup Environ Med. 2005;62:500–506. doi: 10.1136/oem.2002.001115. [DOI] [PMC free article] [PubMed] [Google Scholar]
- 29. Pepe MS, Kerr KF, Longton G, Wang Z. Testing for improvement in prediction model performance. Stat Med. 2013;32:1467–1482. doi: 10.1002/sim.5727. [DOI] [PMC free article] [PubMed] [Google Scholar]
- 30. Paneni F, Beckman JA, Creager MA, Cosentino F. Diabetes and vascular disease: pathophysiology, clinical consequences, and medical therapy: part I. Eur Heart J. 2013;34:2436–2443. doi: 10.1093/eurheartj/eht149. [DOI] [PMC free article] [PubMed] [Google Scholar]
- 31. Gu K, Cowie CC, Harris MI. Mortality in adults with and without diabetes in a national cohort of the U.S. population, 1971-1993. Diabetes Care. 1998;21:1138–1145. doi: 10.2337/diacare.21.7.1138. [DOI] [PubMed] [Google Scholar]
- 32.Centers for Disease Control and Prevention. Atlanta, GA: Centers for Disease Control and Prevention, US Department of Health and Human Services; 2020. [Google Scholar]
- 33. Punjabi NM, Shahar E, Redline S, Gottlieb DJ, Givelber R, Resnick HE. Sleep Heart Health Study Investigators. Sleep-disordered breathing, glucose intolerance, and insulin resistance: the Sleep Heart Health Study. Am J Epidemiol. 2004;160:521–530. doi: 10.1093/aje/kwh261. [DOI] [PubMed] [Google Scholar]
- 34. Muraki I, Tanigawa T, Yamagishi K, Sakurai S, Ohira T, Imano H, et al. CIRCS Investigators. Nocturnal intermittent hypoxia and the development of type 2 diabetes: the Circulatory Risk in Communities Study (CIRCS) Diabetologia. 2010;53:481–488. doi: 10.1007/s00125-009-1616-0. [DOI] [PubMed] [Google Scholar]
- 35. Aurora RN, Punjabi NM. Obstructive sleep apnoea and type 2 diabetes mellitus: a bidirectional association. Lancet Respir Med. 2013;1:329–338. doi: 10.1016/S2213-2600(13)70039-0. [DOI] [PubMed] [Google Scholar]
- 36. Punjabi NM, Ahmed MM, Polotsky VY, Beamer BA, O’Donnell CP. Sleep-disordered breathing, glucose intolerance, and insulin resistance. Respir Physiol Neurobiol. 2003;136:167–178. doi: 10.1016/s1569-9048(03)00079-x. [DOI] [PubMed] [Google Scholar]
- 37. Seif F, Patel SR, Walia H, Rueschman M, Bhatt DL, Gottlieb DJ, et al. Association between obstructive sleep apnea severity and endothelial dysfunction in an increased background of cardiovascular burden. J Sleep Res. 2013;22:443–451. doi: 10.1111/jsr.12026. [DOI] [PMC free article] [PubMed] [Google Scholar]
- 38. Meigs JB, Hu FB, Rifai N, Manson JE. Biomarkers of endothelial dysfunction and risk of type 2 diabetes mellitus. JAMA. 2004;291:1978–1986. doi: 10.1001/jama.291.16.1978. [DOI] [PubMed] [Google Scholar]
- 39.Wang N, Shi XF, Khan SA, Wang B, Semenza GL, Prabhakar NR, et al. Hypoxia-inducible factor-1 mediates pancreatic β-cell dysfunction by intermittent hypoxia. Am J Physiol Cell Physiol. 2020;319:C922–C932. doi: 10.1152/ajpcell.00309.2020. [DOI] [PMC free article] [PubMed] [Google Scholar]
- 40. Prabhakar NR, Peng YJ, Nanduri J. Hypoxia-inducible factors and obstructive sleep apnea. J Clin Invest. 2020;130:5042–5051. doi: 10.1172/JCI137560. [DOI] [PMC free article] [PubMed] [Google Scholar]
- 41. Sands SA, Edwards BA, Kelly VJ, Skuza EM, Davidson MR, Wilkinson MH, et al. Mechanism underlying accelerated arterial oxygen desaturation during recurrent apnea. Am J Respir Crit Care Med. 2010;182:961–969. doi: 10.1164/rccm.201003-0477OC. [DOI] [PubMed] [Google Scholar]
- 42. Wang N, Meng Z, Ding N, Chen W, Zhang X, Huang M, et al. Oxygen desaturation rate as a novel intermittent hypoxemia parameter in severe obstructive sleep apnea is strongly associated with hypertension. J Clin Sleep Med. 2020;16:1055–1062. doi: 10.5664/jcsm.8396. [DOI] [PMC free article] [PubMed] [Google Scholar]
- 43. Guggisberg AG, Hess CW, Mathis J. The significance of the sympathetic nervous system in the pathophysiology of periodic leg movements in sleep. Sleep. 2007;30:755–766. doi: 10.1093/sleep/30.6.755. [DOI] [PMC free article] [PubMed] [Google Scholar]
- 44. Rizzi M, Barrella M, Kotzalidis GD, Bevilacqua M. periodic limbic movement disorder during sleep as diabetes-related syndrome? A polysomnographic study. ISRN Endocrinol. 2011;2011:246157. doi: 10.5402/2011/246157. [DOI] [PMC free article] [PubMed] [Google Scholar]
- 45. Murase K, Hitomi T, Hamada S, Azuma M, Toyama Y, Harada Y, et al. The additive impact of periodic limb movements during sleep on inflammation in patients with obstructive sleep apnea. Ann Am Thorac Soc. 2014;11:375–382. doi: 10.1513/AnnalsATS.201306-144OC. [DOI] [PubMed] [Google Scholar]
- 46. Koo BB, Sillau S, Dean DA, 2nd, Lutsey PL, Redline S. Periodic limb movements during sleep and prevalent hypertension in the multi-ethnic study of atherosclerosis. Hypertension. 2015;65:70–77. doi: 10.1161/HYPERTENSIONAHA.114.04193. [DOI] [PMC free article] [PubMed] [Google Scholar]
- 47. Sun D, Zhou T, Heianza Y, Li X, Fan M, Fonseca VA. et al. Type 2 diabetes and hypertension. Circ Res. 2019;124:930–937. doi: 10.1161/CIRCRESAHA.118.314487. [DOI] [PMC free article] [PubMed] [Google Scholar]
- 48. Winkelman JW, Blackwell T, Stone K, Ancoli-Israel S, Redline S. Associations of incident cardiovascular events with restless legs syndrome and periodic leg movements of sleep in older men, for the Outcomes of Sleep Disorders in Older Men Study (MrOS Sleep Study) Sleep (Basel) 2017;40:zsx023. doi: 10.1093/sleep/zsx023. [DOI] [PMC free article] [PubMed] [Google Scholar]
- 49. Gottlieb DJ, Somers VK, Punjabi NM, Winkelman JW. Restless legs syndrome and cardiovascular disease: a research roadmap: a response. Sleep Med. 2017;36:181. doi: 10.1016/j.sleep.2017.05.002. [DOI] [PubMed] [Google Scholar]
- 50. Martín-Timón I, Sevillano-Collantes C, Segura-Galindo A, Del Cañizo-Gómez FJ. Type 2 diabetes and cardiovascular disease: have all risk factors the same strength? World J Diabetes. 2014;5:444–470. doi: 10.4239/wjd.v5.i4.444. [DOI] [PMC free article] [PubMed] [Google Scholar]
- 51. Hu FB. Sedentary lifestyle and risk of obesity and type 2 diabetes. Lipids. 2003;38:103–108. doi: 10.1007/s11745-003-1038-4. [DOI] [PubMed] [Google Scholar]
- 52. Rasche K, Keller T, Tautz B, Hader C, Hergenc G, Antosiewicz J, et al. Obstructive sleep apnea and type 2 diabetes. Eur J Med Res. 2010;15:152–156. doi: 10.1186/2047-783X-15-S2-152. [DOI] [PMC free article] [PubMed] [Google Scholar]
- 53. Goodarzi MO, Rotter JI. Genetics insights in the relationship between type 2 diabetes and coronary heart disease. Circ Res. 2020;126:1526–1548. doi: 10.1161/CIRCRESAHA.119.316065. [DOI] [PMC free article] [PubMed] [Google Scholar]
- 54. Strawbridge RJ, van Zuydam NR. Shared genetic contribution of type 2 diabetes and cardiovascular disease: implications for prognosis and treatment. Curr Diab Rep. 2018;18:59. doi: 10.1007/s11892-018-1021-5. [DOI] [PMC free article] [PubMed] [Google Scholar]
- 55. Shah NA, Rowland J, Khan S, Kini A, Menegus M, Vengrenyuk Y, et al. Sleep apnea severity, myocardial infarct size on magnetic resonance imaging and coronary collaterals in ST-Elevation myocardial infarction: a multidisciplinary study. Am J Resp Crit Care Med. 2019;199:A4460. [Google Scholar]
- 56. Davis EM, O'Donnell CP. Rodent models of sleep apnea. Respir Physiol Neurobiol. 2013;188:355–361. doi: 10.1016/j.resp.2013.05.022. [DOI] [PMC free article] [PubMed] [Google Scholar]
- 57. Azarbarzin A, Sands SA, Stone KL, Taranto-Montemurro L, Messineo L, Terrill PI, et al. The hypoxic burden of sleep apnoea predicts cardiovascular disease-related mortality: the Osteoporotic Fractures in Men Study and the Sleep Heart Health Study. Eur Heart J. 2019;40:1149–1157. doi: 10.1093/eurheartj/ehy624. [DOI] [PMC free article] [PubMed] [Google Scholar]
- 58. Azarbarzin A, Sands SA, Younes M, Taranto-Montemurro L, Sofer T, Vena D, et al. The sleep apnea-specific pulse-rate response predicts cardiovascular morbidity and mortality. Am J Respir Crit Care Med. 2021;203:1546–1555. doi: 10.1164/rccm.202010-3900OC. [DOI] [PMC free article] [PubMed] [Google Scholar]
- 59. Nagayoshi M, Punjabi NM, Selvin E, Pankow JS, Shahar E, Iso H, et al. Obstructive sleep apnea and incident type 2 diabetes. Sleep Med. 2016;25:156–161. doi: 10.1016/j.sleep.2016.05.009. [DOI] [PMC free article] [PubMed] [Google Scholar]
- 60. Punjabi NM, Sorkin JD, Katzel LI, Goldberg AP, Schwartz AR, Smith PL. Sleep-disordered breathing and insulin resistance in middle-aged and overweight men. Am J Respir Crit Care Med. 2002;165:677–682. doi: 10.1164/ajrccm.165.5.2104087. [DOI] [PubMed] [Google Scholar]