

Summary
The growth and development of root systems is influenced by mechanical properties of the substrate in which the plants grow. Mechanical impedance, such as by compacted soil, can reduce root elongation and limit crop productivity.
To understand better the mechanisms involved in plant root responses to mechanical impedance stress, we investigated changes in the root transcriptome and hormone signalling responses of Arabidopsis to artificial root barrier systems in vitro.
We demonstrate that upon encountering a barrier, reduced Arabidopsis root growth and a characteristic ‘step‐like’ growth pattern is due to a reduction in cell elongation associated with changes in signalling gene expression. Data from RNA‐sequencing combined with reporter line and mutant studies identified essential roles for reactive oxygen species, ethylene and auxin signalling during the barrier response.
We propose a model in which early responses to mechanical impedance include reactive oxygen signalling integrated with ethylene and auxin responses to mediate root growth changes. Inhibition of ethylene responses allows improved growth in response to root impedance, an observation that may inform future crop breeding programmes.
Keywords: Arabidopsis thaliana, auxin, ethylene, mechanical impedance, reactive oxygen species (ROS), root growth
Short abstract
See also the Commentary on this article by Del Bianco & Kepinski 231: 8–10.
Introduction
When growing through soils, plant roots must be able to respond to a range of environmental cues and rely on flexible growth to adapt to changing conditions. Establishment of robust root growth and adaptive root architecture is important for maintaining crop yields, and so root traits are of interest to plant breeders (Gewin, 2010). Various stress conditions in soils limit root elongation, including insufficient nutrients, oxygen or water, and physical barriers (Bengough et al., 2006). As plant roots navigate the soil environment, they encounter physical barriers and must be able to adapt their growth in order to respond to mechanical impedance. An increase in the mechanical strength of soils can occur as a result of drying and drought conditions, as there is a strong interaction between soil strength and water content (Whalley et al., 2005; Jin et al., 2013). The effect of increasing mechanical strength can be further exacerbated by soil compaction caused by the use of heavy farming machinery (Jin et al., 2013). Penetrometer resistance is commonly used as a measure of soil strength, and increased resistance correlates with reduced root elongation (Whitmore & Whalley, 2009; Bengough et al., 2011).
Mechanical impedance of the root also results in a slowing of shoot growth (Iijima & Kono, 1991; Roberts et al., 2002; Kobaissi et al., 2013; Potocka & Szymanowska‐Pulka, 2018), and changes to leaf growth and morphology are also reported. Leaf number (Grzesiak, 2009), area (Alexander & Miller, 1991; Bingham et al., 2010; Kobaissi et al., 2013) and elongation rates (Young et al., 1997) decrease and stomatal closure has been observed (Roberts et al., 2002). There is therefore an agronomic relevance to understanding the response of roots to mechanical impedance, as the effects of soil drying and compaction can reduce crop yields (Whalley et al., 2008).
Diverse methods have been used to investigate the effect that physically constraining root growth has on the morphology and architecture of root systems (Potocka & Szymanowska‐Pulka, 2018), and many studies have focused predominantly on the morphological effect of mechanical impedance and barriers to root growth in crop species. It has previously been demonstrated that an increase in soil strength results in a decrease in root elongation in cotton (Taylor & Ratliff, 1969), maize (Bengough & Mullins, 1991), pea (Croser et al., 1999; Iijima & Kato, 2007) and tobacco (Alameda et al., 2012). In addition studies have demonstrated that in response to mechanical impedance, cell length is reduced and the length of the elongation zone shortened (Veen, 1982; Croser et al., 1999; Hanbury & Atwell, 2005; Okamoto et al., 2008). This reduced rate of growth is therefore likely to be due to a reduced rate of cell elongation, as axial tension is increased by stiffening of the cell walls to reduce elongation (Bengough et al., 2006).
More recently, studies have begun focusing on the response of Arabidopsis thaliana in order to investigate in more detail the molecular basis of the root response to mechanical stimulus (Massa & Gilroy, 2003; Okamoto et al., 2008; Monshausen et al., 2009; Lee et al., 2020). Previous studies have sought to investigate the role of plant hormones and signalling pathways in roots in response to touch stimuli or mechanical impedance, but the precise nature of the signalling mechanisms involved remains unknown. Evidence exists that both ethylene and auxin are likely to be involved in mediating the root response to mechanical impedance (Masle, 2002; Braam, 2005; Okamoto et al., 2008; Yamamoto et al., 2008; Lee et al., 2020). Changes in root morphology in mechanically impeded roots often resemble changes observed when roots are exposed to ethylene, with an inhibition of root elongation and increase in the proliferation of root hairs (Masle, 2002; Buer et al., 2003). Classic studies have examined the response of roots to inclined, hard agar plates (1.5% as opposed to 1% agar) in order to examine thigmotropic responses in roots. Roots exhibit a wavy growth pattern due to the mechanical stimulus avoidance response (Okada & Shimura, 1990), and Buer et al. (2003) demonstrated that ethylene modulates this response. When Arabidopsis is grown in medium consisting of a standard density layer and a lower, harder layer, the root can show a bending response at the harder layer. The bending or non‐bending response of roots has been shown to depend on ethylene (Yamamoto et al., 2008). The role of ethylene signalling has also been demonstrated in continuously mechanically impeded Arabidopsis roots (Okamoto et al., 2008; Okamoto & Takahashi, 2019). It is possible that ethylene signalling mediates the response of roots to mechanical stress through co‐action with auxin. It has previously been demonstrated that the effect of ethylene on root growth is mediated through regulation of auxin biosynthesis and localization of auxin transporters (Ružička et al., 2007; Strader et al., 2010).
Previous work also demonstrated that roots respond to obstacles through a combination of thigmotropic and gravitropic reactions (Massa & Gilroy, 2003). Auxin signalling has long been demonstrated to be involved in the gravitropic response of roots (Ottenschläger et al., 2003; Swarup et al., 2005; Muday & Rahman, 2008). It has also been proposed that the dynamic trafficking system of auxin and the auxin transport system is a key element in controlling tropic growth (Friml et al., 2002; Blilou et al., 2005; Pernisova et al., 2016). Three previous studies to study mechanical root impedance effects in Arabidopsis used either continuous mechanical impedance (horizontal root growth across the surface of a dialysis membrane; Okamoto et al., 2008) or the impedance of vertical root growth by glass or metal barriers (Massa & Gilroy, 2003; Lee et al., 2020). Massa & Gilroy (2003) implicated barrier sensing via the root cap; Okamoto et al. (2008) demonstrated a role for ethylene signalling in inducing growth inhibition and radial thickening of roots; and Lee et al. (2020) showed a role for auxin transport via PIN2 to mediate root bending. However, little is known about the possible involvement of other signalling pathways such as reactive oxygen, gibberellins or abscisic acid.
To understand better the network of signalling pathways involved in the Arabidopsis root response to impedance, we used global transcriptional profiling followed by experimental validation of gene expression data, with a focus on signalling pathway genes. We demonstrate that the early response involves a transcriptional activation of genes encoding components of reactive oxygen species (ROS) signalling associated with ethylene and auxin signalling, and show that each is required for the impedance response.
Materials and Methods
Plant material
Wild‐type (WT) Arabidopsis thaliana seeds (Columbia (Col‐0) ecotype), the auxin signalling mutant axr1, transport mutants aux1‐7 and eir1‐4, and ethylene‐insensitive etr1 and ein2 were from laboratory stocks. atrbohF, atrobhD and atrbohD/F mutants were from Prof. Alistair Hetherington (University of Bristol, UK). proCYCB1;2::CYCB1:2:GUS (Schnittger et al., 2002) was from laboratory stocks. HyPer (Belousov et al., 2006) was from Prof. Marc Knight (Durham University, UK). DR5rev::3xVENUS‐N7 (Brunoud et al., 2012) and R2D2 reporter lines (Liao et al., 2015) were from the Nottingham Arabidopsis Stock Centre (http://arabidopsis.info/). Seeds were stratified at 4°C for 24 h, surface sterilized and seedlings grown on sterile half strength Murashige and Skoog medium (½MS10) with 0.5% (w/v) agar, or 0.3% (w/v) or 1.2% (w/v) Phytagel depending on the assay, as described (Casson et al., 2002).
Barrier assays
We used three different barrier systems: a high density Phytagel (split medium) system, the use of plastic barriers, and growth on the surface of a dialysis membrane, as follows.
Split medium assay
Seedlings were grown in Magenta vessels (77 mm × 77 mm × 97 mm) containing a lower layer of 1.2% Phytagel ½MS10 medium, and once set, 0.3% Phytagel medium was poured on top. Seeds were placed just below the surface of the medium, to grow through the upper layer before reaching the barrier layer (Supporting Information Fig. S1a).
Plastic and dialysis membrane barrier assays
One horizontal barrier impedance system was adapted from Massa & Gilroy (2003). Seeds were grown on vertical plates containing ½MS10 with 0.5% Phytagel. Plastic barriers of clear acetate (1 cm × 2 cm) were sterilized in 70% ethanol and at 6 d after stratification (DAS) were placed horizontally directly beneath growing root tips (Fig. S1b); control roots had no barriers. For chemical treatments, seedlings were first stratified and germinated on standard ½MS10 medium and transferred at 6 DAS to the treatment plates before barrier placement. For some experiments, roots were grown along the surface of a dialysis membrane on the surface of a horizontal agar plate, to provide continuous impedance, as described (Okamoto et al., 2008; Fig. S1c).
For root architecture analysis, seedlings were photographed using a Zeiss STEMI SV8 dissecting stereomicroscope (Carl Zeiss, Cambridge, UK). Each growth assay was repeated three times with 15 individuals per treatment. Fluoridon treatment of roots was as described previously (Rowe et al., 2016). All image analysis was carried out using imagej, and lateral root analysis used the Smart Root Plugin (Lobet et al., 2011). Root tip angle (RTA) was measured as the angle between the outer root tip and the horizontal barrier (Massa & Gilroy, 2003; Fig. S1d). For root hair length analysis, up to 20 mature root hairs were measured. The imagej straight‐line tool was used to draw and measure a line from the quiescent centre (QC) to the proximal end of the meristem (defined as the first cell that was twice the length of the immediately preceding cell; González‐García et al., 2011). Elongation zone size was measured from the end of the meristem to the first indication of emerging root hairs. Time‐lapse imaging of roots used a Dino‐lite microscope (www.dino‐lite.com) over 12 h, with images captured every 15 min. RTA and root growth was measured in each image from the point at which the root tip made contact with the barrier.
Histochemistry
Histochemical staining of proCYCB1;2::CYCB1:2:GUS activity with clearing in chloral hydrate solution was as described (Topping & Lindsey, 1997). Number of dividing (GUS‐positive) cells was calculated using the imagej ‘Cell Counter’ plugin. CellROX Deep Red dye (ThermoFisher, Loughborough, UK) revealed intracellular accumulation of ROS, and has previously been used for plant roots (Kováčik et al., 2014; Wright et al., 2016). Whole seedlings were stained with 1 μM dye for 30 min then washed twice with sterile distilled water.
Confocal microscopy
Roots were imaged using a Leica SP5 laser scanning confocal microscope (www.leica‐microsystems.com) or Zeiss LSCM 880 (https://www.zeiss.com/microscopy/int/home.html). Seedlings were fixed in 4% paraformaldehyde (PFA) before clearing with ClearSee (Kurihara et al., 2015) and staining with 0.1% (w/v) Calcofluor White for 30 min or unfixed tissues stained with 0.5% (w/v) propidium iodide (PI) solution for 90 s. Images were opened in LAS AF lite software (v.2.63 build 8173) or zen lite software. Images were taken from at least six individual roots for each analysis in imagej.
Analysis of reporter fluorescence
The imagej polygon tool was used to delineate regions of interest (ROIs) in the root tip. Fluorescence was measured either as mean green channel intensity or mean grey value. Mean green channel intensity was calculated in RGB (red, green, blue) images using the colour histogram tool. For grey values, all channels were exported as separate TIFFs and converted to 32‐bit images and mean grey value measured using the ‘set measurement’ function in imagej. ROIs were selected using the ROI analyser tool and an RGB reference image with all channels, subtracting background from the value. For R2D2, reduction of the Venus signal relative to the tdTomato signal is a proxy for auxin accumulation (Liao et al., 2015). Separate TIFFs of the Venus and tdTomato channels were exported and converted to 32‐bit in imagej. The Image Calculator function of imagej determined the ratio of Venus to tdTomato signals (https://imagej.nih.gov/ij/docs/menus/process.html#calculator). For HyPer analysis (Belousov et al., 2006), images were acquired at 488 nm (green channel) for analysis using Image Calculator. Images of CellROX DeepRed stained roots were obtained using both confocal and brightfield, using the electronically switchable illumination and detection module (ESID). Fluorescence was measured as mean grey value in 32‐bit images containing only the DeepRed channel. DELLA imaging used REPRESSOR OF GIBBERELLIC ACID (RGA):GREEN FLUORESCENT PROTEIN (GFP) transgenic lines as previously described (Rowe et al., 2016), with seedlings grown on a dialysis membrane for 7 DAS.
RNA‐sequencing
For transcriptomic analysis of the root response to mechanical impedance, RNA was isolated from three independent biological replicates of whole roots of seedlings grown for 6 DAS followed by barrier contact for either 6 h or 30 h. Briefly, 20 mg of root tissue for each replicate was ground in liquid nitrogen using TissueLyser II (Qiagen, Manchester, UK) and RNA extracted using the Qiagen ReliaPrepTM RNA Tissue Miniprep System. RNA quality was determined using the NanoDrop ND‐1000 spectrophotometer (ThermoFisher Scientific, Waltham, MA, USA) and Agilent 2200 TapeStation (Agilent Technologies, Santa Clara, CA, USA). Libraries were constructed from 100 ng and 1 μg total RNA using the NEBNext UltraTM Directional RNA Library Prep Kit for Illumina for use with the NEBNext Poly(A) mRNA Magnetic Isolation Module (NEB, Hitchin, UK). Messenger RNA (mRNA) was isolated, fragmented and primed, complementary DNA (cDNA) was synthesized and end prep was performed. NEBNext Adaptor was ligated and the ligation reaction was purified using AMPure XP Beads. PCR enrichment of adaptor ligated DNA was conducted using NEBNext Multiplex Oligos for Illumina (Set 1, NEB#E7335). The PCR reaction was purified using Agencourt AMPure XP Beads. Library quality was then assessed using a DNA analysis ScreenTape on the Agilent Technologies 2200 TapeStation. Quantitative polymerase chain reaction (qPCR) was used for sample quantification using NEBNext® Library Quant Kit Quick Protocol Quant kit for Illumina. Samples were diluted to 10 nM. 7 μl of each 10 nM sample was pooled together and all were run on two lanes using an Illumina HiSeq2500 (DBS Genomics facility, Durham University, UK). Approximately 30 M unique paired‐end 125 bp reads were carried per sample. Primers were designed using Primer‐Blast (http://www.ncbi.nlm.nih.gov/tools/primer‐blast/) and synthesized by MWG Eurofins (http://www.eurofinsdna.com/).
FastQC (https://www.bioinformatics.babraham.ac.uk/projects/fastqc/) was used to assess read quality and Trimmomatic (Bolger et al., 2014) was used to cut down and remove low quality reads. Salmon (Patro et al., 2017) was used for quasi‐mapping of reads against the AtRTD2‐QUASI (Brown et al., 2017; Zhang et al., 2017) transcriptome and to estimate transcript‐level abundances. The tximport R package (Soneson et al., 2016) was used to import transcript‐level abundance, estimate counts and transcript lengths, and summarize into matrices for downstream analysis in R. Before differential expression analysis, low quality reads were filtered out of the data set. Only genes with a count per million of 0.744 in six or more samples were retained. The deseq2 (Love et al., 2014) R package was used to estimate variance‐mean dependence in count data and to test for differential expression (using the negative binomial distribution model). A padj‐value of ≤ 0.05 and a log2fold change (log2FC) of ≥ 0.5 were selected to identify differentially expressed genes (DEGs). The three‐dimensional (3D) RNA‐sequencing (RNA‐seq) online App (Calixto et al., 2018; Guo et al., 2019) was used for independent verification of estimated DEGs and for differential alternative splicing analysis. RNA‐seq data are deposited in the Dryad Digital Repository.
Quantitative RT‐PCR (qRT‐PCR)
RNA extraction and cDNA synthesis for quantitative reverse transcription polymerase chain reaction (qRT‐PCR) was carried out using WT and atrbohD/F double mutant seedlings (7 DAS) essentially as described previously (Rowe et al., 2016), using four biololocal and three technical replicates. UBIQUITIN10 (UBQ10) or PEROXIN4 (PEX4) were used as reference genes. qRT‐PCR reactions were carried out using 2 × SensiFAST SYBR® No‐ROX Mix and were run on a Rotor‐Gene Q Machine (Qiagen). Expression analysis was conducted using the Rotorgene Q Series software v.1.7. Relative normalized levels of transcript of each gene were calculated relative to the reference gene and analysed by comparative quantification using an assumption‐free, linear regression analysis approach (Ramakers et al., 2003). Primer sequences are listed in Table S1.
Results
The root response to mechanical impedance involves radially asymmetric changes in cell expansion
To examine the short‐term (0–24 h) impedance response, seedlings were grown on vertical plates on the gel surface, and at 6 DAS plastic barriers were placed horizontally directly beneath growing roots. Consistent with previous studies (Massa & Gilroy, 2003; Lee et al., 2020), roots were found to attempt to rapidly bend away from obstacles, forming a ‘step‐like’ growth pattern where the root grows parallel to the obstacle while the root tip maintains contact with the barrier. It is hypothesized that the first bend represents a touch response to the barrier, leading to ‘exploration’ of the substrate, while the second bend downwards represents a gravitropic response. RTA was measured between the leading edge of the root tip and the surface of the barrier, i.e. at the initiation of the second bend (Fig. 1a,d); this provides a measurable ‘readout’ of the response to mechanical impedance. RTA changed from an average of 93.8° ± 2.20° (0 h) to 120° ± 1.25° (180–480 min; Fig. 1b), detectable within 60 min of the root encountering an obstacle, with a second bend forming between 3 and 4 h. The rate of bending (∆RTA/min) was greatest between 15 and 90 min (Fig. 1c); root growth rate was fairly constant along the barrier (average 0.96 ± 0.14 mm over 480 min; Fig. 1d).
Fig. 1.

Short‐term bending response of a root to a barrier. Plastic barriers were placed in front of growing Arabidopsis roots 6 d after stratification, and root tips were imaged every 15 min. (a) Time‐lapse images of a Col‐0 root tip encountering a horizontal barrier at 0–8 h after contact with the barrier. (b) Root tip angle (RTA) over 0–480 min after contact with a barrier. RTA was measured every 15 min. (c) Bending rate between 15 and 480 min. (d) Root growth of the primary root tip between 0 and 480 min after contact with the barrier. Blue line represents regression line. (e) Typical elongation zone of primary root tips stained with Calcofluor White and grown in the presence or absence of a barrier for 6 h. Cells of the elongation zone used for measurements are outlined and highlighted in orange. (f) Total cortical cell number in the meristem and elongation zone after 6 h. (g) Ratio of meristem and elongation zone length between the left and right side of the root tip. (h) Ratio of cell length between the left and right side of the root tip in the first 11 cells of the elongation zone. The root tip was divided through the middle into a left and right side and measurements taken separately for each side. Ratio was calculated using the formula exp(|log(left/right)|) to account for any bias in assigning left/right. For (b, c, d, h), error bars represent mean ± SE. For (f, g) the upper and lower boundaries of each boxplot indicate the interquartile range, the black line within the box marks the median, and whiskers represent the minimum and maximum excluding outliers. Open circles represent outliers, and red diamonds represent the mean. Bars: 0.5 mm (a); 50 µm (e).
After 6 h, meristem size was unaffected in roots responding to the barrier (Fig. 1e,f), suggesting changes in cell division are unlikely to be involved in the early response to a barrier (Fig. S2; Okamato et al., 2008). However, the ratio of the length of the elongation zone between the two sides of the root significantly increased in response to a barrier, from a median ratio of 1.01 (interquartile range (IQR) = 0.017) to 1.04 (IQR = 0.027), demonstrating asymmetry in cell elongation (Fig. 1g). The average ratio of cell length for the first 8–11 cells of the elongation zone significantly increased in response to a barrier, confirming the asymmetry of response (Fig. 1h).
Analysis of CYCB1;2:GUS reporter expression, which marks the G2/M cell cycle transition (Colon‐Carmona et al., 1999; Schnittger et al., 2002), confirmed that the number of dividing cells remained unchanged in response to impedance (Fig. S2a,b). The ratio of dividing cells on the ‘left’ and ‘right’ sides of the axial root plane was calculated using the formula exp(|log(left/right)|), which obviates the need to assign left or right sides. This ratio does not change in impeded roots (Fig. S2c), indicating cell division rate remains constant radially across the meristem.
Consistent with previous studies, primary root length significantly decreased on encountering the barrier, with median root length reducing from 15.8 mm (IQR = 4.0) to 10.6 mm (IQR = 3.4) (Fig. S3a). Root length between 4 and 7 DAS was significantly reduced on impedance, with a significant reduction occurring from 5 DAS (8.21 ± 0.24 mm compared to 5.65 ± 0.36 mm; Fig. S3g). The distance of root hair emergence from the root tip was also significantly reduced on encountering a barrier (Fig. S3b; Okamoto et al., 2008). The meristem length of impeded roots (7 DAS) was not significantly different to the control (Fig. S3c,e), but the elongation zone length was significantly reduced, from a median of 467 µm (IQR = 132) in the control to 362 µm (IQR = 123) in impeded roots (Fig. S3d,f). While primary root length was significantly reduced in impeded roots, lateral root density (i.e. number of laterals per length of primary root) increased (Fig. S3h).
Transcriptional analysis reveals specific signalling changes in the impeded root
The results described show mechanical impedance induces reduced root growth and step‐like bending due to differential cell elongation, rather than altered meristem activity, enhanced root hair growth and increased lateral root density. To understand better the molecular events in roots under mechanical impedance stress, RNA‐seq was used to identify transcriptional changes for three independent biological replicates for control and barrier treatments of 6 DAS roots at 6 h and 30 h after impedance. The objective was to identify gene expression changes as a means to build a hypothesis for signalling changes during this time period. The 6 h time point was used to capture transcriptional changes following the initial intense bending period (at between 1 and 4 h), and the 30 h time point was used to capture transcriptional changes following more prolonged contact with a barrier.
Principal component analysis (Fig. S4a) and a heatmap of the 50 most highly expressed genes with clustering across samples (Fig. S4a) show that variation between sample groups is greater than variation within groups. A P‐value of < 0.05 and log2FC of > 0.5 or <−0.5 were selected to identify DEGs between barrier and control conditions at each time‐point (Fig. S5a). A total of 1941 genes were upregulated and 406 downregulated at 6 h after barrier placement. Fewer genes were differentially expressed at 30 h, with 852 upregulated and 607 downregulated genes (Fig. S5b). A total of 372 genes were differentially expressed at both 6 h and 30 h (Fig. S5c–i).
To verify data from the RNA‐seq experiment, qRT‐PCR was carried out on two DEGs, one differentially expressed at 6 h and one at 30 h. The genes RPL2 (encoding mitochondrial ribosomal protein L2) and IF2/IF5 (encoding translation initiation factor IF2/IF5) were selected as they show significant changes in expression in response to a barrier. RPL2 has a log2FC of –2.44 at 6 h and IF2/IF5 has a log2FC of –2.36 at 30 h. qRT‐PCR analysis of these genes confirmed a decrease in expression of RPL2 and IF2/IF5 at 6 and 30 h respectively, relative to the internal control gene PEROXIN4 (PEX4) (Fig. S5j,k).
In an hypothesis‐building process, we carried out an unbiased gene ontology (GO) enrichment analysis to interpret the biological functions of genes upregulated and downregulated at each timepoint, and treemaps were generated using data from REVIGO (Supek et al., 2011). Results reveal little overlap between GO terms in the response at 6 h vs 30 h after impedance. Of particular interest, there is seen a strong upregulation in genes involved in ‘response to stress’, the largest supercluster of GO terms, at 6 h (Fig. S6). GO terms that relate to ROS are more frequent, including ‘hydrogen peroxide catabolism’ and ‘reactive oxygen species metabolism’. Also identified was an upregulation of genes involved in ‘signalling’, ‘protein phosphorylation’, ‘cell communication’, ‘secondary metabolism’ and ‘localization’. At 30 h, there is an upregulation of genes involved in mRNA splicing, cellular respiration and ribonucleoprotein complex biogenesis (Fig. S7). In contrast to the response at 6 h, genes involved in ‘cell communication’, ‘signalling’ and ‘response to stimulus’ are downregulated at 30 h (Fig. S7), indicating a switch from the response at 6 h.
At 6 h we found that GO terms relating to hormone responses were more frequent in upregulated genes (Fig. S8). In contrast, the majority of genes relating to hormone signalling at 30 h are downregulated, consistent with the observation that many stress‐related genes are also downregulated after 30 h (Fig. S8). This indicates that hormone‐related transcriptional changes principally occur relatively early in the response to mechanical impedance. Although transcriptional upregulation of genes associated with gibberellic acid (GA) and abscisic acid (ABA) signalling were identified, analysis of RGA:GFP expression (GA signalling) and treatments with fluoridon (an inhibitor of ABA synthesis; Rowe et al., 2016) provided no further evidence for an essential role for these pathways in the early impedance response (Fig. S9); further analysis therefore focused on ROS, ethylene and auxin requirements.
A role for reactive oxygen species in the impedance response
ROS have been proposed to act as a rapid wave‐like signal during stress responses, mediated by RESPIRATORY BURST OXIDASE HOMOLOG D (RBOHD) activation (Miller et al., 2009; Gilroy et al., 2014, 2016). GO analysis showed overrepresentation of terms relating to ROS metabolism. At 6 h there was an upregulation in genes relating to ‘reactive oxygen species metabolism’ and ‘hydrogen peroxide catabolism’. NADPH oxidases (respiratory burst oxidase homologues) are key ROS‐producing enzymes and act as molecular ‘hubs’ during ROS‐mediated signalling (Hu et al., 2020). Six NADPH oxidase genes are upregulated at 6 h (Table S2), including RBHOD and RBOHF, which have been shown to be involved in a number of abiotic and biotic stress responses (Xie et al., 2011; Liu et al., 2015; Morales et al., 2016; Wang et al., 2019). ROOT HAIR DEFECTIVE 2 (RHD2) is upregulated at 6 h, and has been linked to root hair growth (Foreman et al., 2003) and root touch responses (Monshausen et al., 2009). In addition, 20 known ROS scavenging genes were upregulated at 6 h (Table S3).
Transcriptomic changes in response to ROS have previously been documented and a transcriptomic footprint created (Gadjev et al., 2006). Comparison of this footprint with the data obtained for response to a barrier revealed that, at 6 h, 32 upregulated genes overlap with the ROS footprint (Fig. 2a). The greatest number of DEGs at 6 h appear to be upregulated in response to singlet oxygen (Fig. 2b), strongly suggesting an elevation of ROS transcriptional and signalling responses when a root encounters a barrier.
Fig. 2.

Reactive oxygen species (ROS)‐related gene expression at 6 h in response to a barrier in Arabidopsis. (a) Venn diagram showing common genes between genes differentially expressed at 6 h in response to a barrier and genes identified as a general ROS transcriptomic footprint (Gadjev et al., 2006). The ROS footprint comprises genes identified by Gadjev et al. (2006) as being upregulated in response to several oxidative stress conditions. (b) Bar chart showing number of genes identified from the RNA‐seq data set at 6 h identified by Gadjev et al. (2006) as responding to specific ROS responses.
Since RBHOD and RBOHF genes were upregulated within 6 h, time‐lapse imaging was used to examine the early root response of the atrbohD/F double mutant after encountering a barrier (Fig. 3a). The atrbohD/F RTA differed significantly from Col‐0 at 360 min, with a mean RTA for atrbohD/F of 148.8° (± 5.7°) compared with 118.9° (± 8.2°) in the control (Fig. 3b; ANCOVA, P < 0.001); differences were detected from c. 75 min. At 75 min the RTA of atrbohD/F is greater, at 124.0° (± 6.7°), compared with 108.9° (±4.4°) for Col‐0 (Fig. 3b), demonstrating a requirement for these ROS signalling pathway genes in the early impedance response.
Fig. 3.

Reactive oxygen species (ROS) is required for the barrier response in Arabidopsis. (a) Timelapse imaging of atrbohD/F double mutant in response to a barrier. Plastic barriers were placed in front of vertically growing roots 6 d after stratification (DAS) and root tips were imaged every 15 min. (b) Root tip angle of atrbohD/F double mutant (yellow) and wild‐type (grey) roots from 0 to 360 min after contact with a barrier. Root tip angle (RTA) was measured every 15 min. Data show mean RTA ± SD. (c, d) The effect of diphenylene iodonium (DPI) on RTA during the barrier response 6 h after barrier placement. Lines indicate mean and surrounding shaded area indicates ± SD. (e–g) HyPer fluorescence in unfixed roots after responding to a barrier. Barriers were placed in front of seedlings 6 DAS and roots were imaged between 3 and 5 h after barrier placement. Roots were stained with propidium iodide before imaging. (e) Typical fluorescence of HyPer probe YFP excited at 488 nm (green) in roots stained with propidium iodide (magenta). (f) Measured fluorescence of HyPer YFP in the outer lateral root cap (LRC) cells. (g) Measured fluorescence of HyPer YFP in the columella. (h) Measured fluorescence of HyPer YFP in the lateral root cap. Bars: 0.5 mm (a); 50 µm (e). Asterisks show significance (***, P < 0.001). Letters indicate significance with a Tukey pairwise comparison P < 0.05 (c, d).
Diphenylene iodonium (DPI), a chemical inhibitor of ROS production, was used to investigate further the role of ROS in the barrier response. Seedlings were grown on 10 µM DPI or 10 µM dimethyl sulfoxide (DMSO) as a control, and barrier response determined. At 6 h, seedlings grown on 10 µM of DPI encountering a barrier exhibited a higher RTA compared to the control (10 µm DMSO; Fig. 3c), confirming the mutant study. At 24 h, there was no significant difference in RTA between seedlings grown in the presence of 10 µM DPI on 10 µM DMSO when encountering a barrier (Fig. 3d).
Confocal imaging of the hydrogen peroxide (H2O2) reporter HyPer (Belousov et al., 2006) was used to investigate possible changes in H2O2 levels at the root tip in response to impedance within 6 h. Yellow fluorescent protein (YFP) fluorescence increased significantly in the outer lateral root cap cells, indicating an increase in H2O2 (Fig. 3e,f). There was no significant change detected in other cells of the root cap (Fig. 3g,h).
CellROX Deep Red is a cell‐permeant dye that is weakly fluorescent in the reduced state and exhibits photostable fluorescence upon oxidation by several ROS. Three hours after barrier placement, fluorescence was observed in the outermost root cap cells and in the lateral root cap (Fig. 4a) but was not significantly different in either the columella cells or lateral root cap in the two treatments (Fig. 4b). Fluorescence was also observed in both the meristematic and elongation zones (Fig. 4c), and while there was no difference in meristem cells, there was found a significant decrease in CellROX fluorescence in the elongation zone in roots encountering a barrier (Fig. 4d, Student’s t‐test, P = 0.05), indicating a decrease in ROS.
Fig. 4.

CellROX staining to reveal reactive oxygen species (ROS) levels. Barriers were placed in front of Arabidopsis seedling roots 6 d after stratification and seedlings were removed 3 h after barrier placement for staining with CellROX Deep Red. (a) Typical staining pattern of CellROX Deep Red (red) at the root tip, with and without bright field image of the root tip. (b) Measured fluorescence of CellROX Deep Red stain in the root tip columella, lateral root cap (LRC). (c) Typical staining pattern of CellROX Deep Red (red) in the meristem (m) and elongation zone (e), with (upper panels) and without (lower panels) bright field imaging. (d) Measured fluorescence of CellROX Deep Red stain in the elongation zone and meristem. Bars, 50 µm. Black circles and error bars represent mean ± SE. Coloured circles represent distribution of individual data points. Lines and asterisks show significance (ns, not significant; *, P < 0.05).
A role for ethylene in the impedance response
KEGG pathway mapping identified an upregulation of ethylene‐related transcription at 6 h, including key ethylene response genes such as ETHYLENE INSENSTIVE LIKE 2 (EIL2; Fig. S10a) and two ETHYLENE RESPONSE FACTOR (ERF) genes ERF1A and ERF4, and genes involved in ethylene biosynthesis – ACS5 is upregulated by log2FC of 2.52, and the ACC oxidase gene ETHYLENE FORMING ENZYME (EFE) is also upregulated at 6 h, suggesting increased ethylene production in response to a barrier (Fig. S10b). At 30 h, ACS5 and ELO1 are both downregulated, indicating a possible decrease in ethylene biosynthesis. These data suggest that upregulation in ethylene biosynthesis may be early and transient during the barrier response.
Previous studies describe controversy around a role for ethylene synthesis, and suggested primarily a role for ethylene signalling in the response to continuous impedance (Okamoto et al., 2003). To investigate a possible requirement for ethylene signalling for the root response, time lapse imaging was used to investigate the bending of the ethylene resistant etr1‐1 mutant in response to a barrier (Fig. 5a). RTA changed more rapidly in etr1 compared with Col‐0 in response to a barrier, detectable from c. 45–60 min, indicating a relatively early role of ethylene signalling in the impedance response. At 60 min, mean RTA of etr1 was 122.9° ± 3.4°, 15.6° higher than the RTA of Col‐0 (107.3° ± 5.5°). The RTA of etr1 also reduced again toward the vertical between 195 and 270 min, reaching 117.6° ± 9.9° at 270 min before increasing again to 150° ± 12.9° at 360 min (Fig. 5b,c), associated with the second bend. The ethylene‐insensitive ein2 also showed a slightly more vertical root than WT (Fig. S11), indicating a role for ethylene signalling in reducing growth rate and bending on impedance. The etr1 seedlings grew longer than WT in a gel barrier (Fig. S12) and roots of a range of ethylene‐insensitive mutants (ein2, etr1, aux1, eir1) showed a significantly reduced response to barrier impedance, with enhanced growth rate compared to WT (ANOVA, P < 0.0001; Fig. S13), indicative of the requirement of ethylene signalling for the normal response to a barrier.
Fig. 5.

Ethylene signalling is required for the barrier response in Arabidopsis. (a) Timelapse imaging of wild‐type (Col‐0, upper row of panels) and etr1 (lower two rows of panels) between 0 and 8 h after barrier placement. Plastic barriers were placed in front of vertically growing roots 6 d after stratification and root tips were imaged every 15 min. In some cases, etr1 shows a reversal of growth direction (lowest row of panels at 6 and 8 h). (b) Root tip angle (RTA) from 0 to 480 min after contact with a barrier. RTA was measured every 15 min. The central ‘dip’ in etr1 RTA reflects the directional change. Lines and dots indicate mean, with shaded area indicating ± SE. Bars, 0.5 mm. Asterisks show significance (***, P < 0.001). (c) Angle of primary root tips to the horizontal barrier 24 h after barrier placement for wild‐type (Col‐0) and etr1. (d, e) Effect of aminoethoxyvinylglycine (AVG) and silver thiosulphate (STS) on RTA 6 h (d) and 30 h (e) after barrier placement. Lines indicate mean and surrounding shaded area indicates ± SD. Letters indicate significance with a Tukey pairwise comparison P < 0.05 (c–e).
To further examine the role of ethylene, seedlings were grown in the presence of chemical inhibitors of ethylene biosynthesis (10 µM aminoethoxyvinylglycine (AVG)) and signalling (10 µM silver thiosulphate (STS)). At 6 h after barrier placement, seedlings grown in the presence of either inhibitor showed a slightly higher RTA than the control (Fig. 6a, ANOVA, P = 0.08). After 24 h of growth, seedlings grown on 10 µM AVG had a significantly higher mean RTA than the control (Fig. 6b; ANOVA, P < 0.001; Tukey P = 0.003), indicating a role for ethylene synthesis at the later stages of impedance response (likely associated with gravitropism). However, seedlings grown in the presence of STS did not exhibit any significant change in RTA compared with the control (Fig. 6c), suggesting a less effective inhibition of ethylene signalling by STS than either etr1 or ein2 mutations.
Fig. 6.

Root hair responses to a barrier in Arabidopsis. (a) Typical root hair growth after 24 h in the presence or absence of a barrier: untreated (upper panel), in presence of silver thiosulphate (STS) (middle panel), in presence of aminoethoxyvinylglycine (AVG) (lower panel). Bars, 500 µm. (b) Root hair density (number of root hairs/mm root). Root hairs were counted in an approximate 2 mm section of mature root and exact distance measured to calculate root density. (c) Root hair length. Root hair length was measured in 20 root hairs within a 2 mm region of root and the average taken to determine root hair length for the sample. For (b, c), the upper and lower boundaries of each boxplot indicate the interquartile range, the black line within the box marks the median, and whiskers represent the minimum and maximum excluding outliers. Red diamonds represent the mean. Asterisks indicate significance with a Tukey pairwise comparison (ns, not significant; ***, P < 0.001).
Root hair density and length were measured in roots responding to a barrier in the presence of 10 µM AVG or STS. At 24 h of barrier treatment, control seedlings showed an increase in root hair length in response to a barrier as described earlier, which together with root hair density was significantly reduced by treatment with 10 µM AVG or 10 µM STS in either the presence or absence of barrier (Fig. 6a–c; ANOVA, P < 0.001). This shows that normal ethylene biosynthesis and signalling are each essential for root hair elongation and formation, but only root hair length increases in response to barrier contact.
A role for auxin in the impedance response
Further KEGG pathway mapping revealed DEGs associated with auxin signalling. At 6 h PHYTOCHROME‐ASSOCIATED PROTEIN 2 (PAP2), a member of the AUXIN/INDOLE‐3‐ACETIC ACID (Aux/IAA) family, and SAUR36 are downregulated, while SAUR55 is upregulated; SAUR36 is upregulated at 30 h. At 30 h, three AUX/IAA genes are differentially expressed: IAA30 and PAP2 are upregulated while IAA14 is downregulated (Fig. S14). Three genes involved in auxin conjugation, GH3.17, BRU6 and DFL1 (Staswick et al., 2005) are also upregulated at 6 h and two downregulated at 30 h (GH3.17 and DFL2, Fig. S14), suggesting a role for auxin conjugation in controlling free auxin levels during the barrier response. Three ATP‐Binding Cassette (ABC) family genes, ABCB1, ABCB4 and ABCG37, associated with auxin transport and gravitropic response (Geisler et al., 2005; Lewis et al., 2007; Wu et al., 2007; Růžička et al., 2010) are upregulated at 6 h.
The transcriptomic data presented earlier, and recent work by Lee et al. (2020), support a role for auxin and its transport in obstacle avoidance. Using time lapse imaging, we found that RTA for the auxin transport (and ethylene‐insensitive) mutants eir1‐4 and aux1‐7 was significantly closer to the horizontal than Col‐0 (Fig. 7a,b), apparent from c. 210 min (average RTA for eir1‐4 is 133° ± 5.5° and 138.4° ± 3.4° for aux1‐7, compared with 123.8° ± 2.6° for Col‐0). Initial bending between 0 and 210 min appears the same between Col‐0 and the mutants (Fig. 7b). After 24 h the RTA was still significantly different between Col‐0 and the mutants (ANOVA, P < 0.001; Fig. 7c). WT seedlings treated with the auxin transport inhibitor N‐1‐naphthylphthalamic acid (10 µM NPA) at 6 h after barrier interaction had a significantly higher RTA than untreated controls (161° ± 4.4°; Fig. 7d) and at 24 h mean RTA in the presence of both 2.5 and 10 µM NPA was greater than for the untreated controls (Fig. 7e).
Fig. 7.
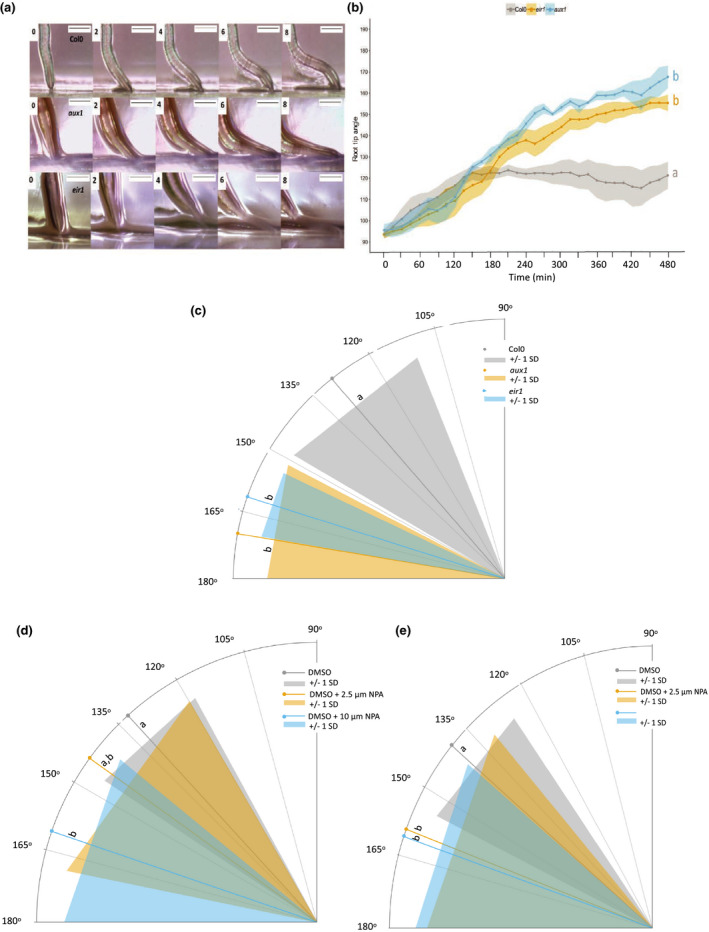
Ethylene signalling is required for the barrier response in Arabidopsis. (a) Timelapse imaging of wild‐type (Col‐0), aux1‐7 (aux1) and eir1‐4 (eir1) between 0 and 8 h after barrier placement. Plastic barriers were placed in front of growing roots 6 d after stratification and root tips were imaged every 15 min. (b) Root tip angle (RTA) over time from 0 to 480 min after contact with a barrier. RTA was measured every 15 min. Lines and dots indicate mean with shaded area indicating ± SD. (c) Angle of primary root tips to the horizontal barrier 24 h after barrier placement. (d, e) Effect of 1‐naphthylphthalamic acid (NPA) on RTA during the barrier response 6 h (d) or 24 h (e) after barrier placement. Lines indicate mean and surrounding shaded area indicates ± SD. Bars, 0.5 mm. Letters indicate significance with a Tukey pairwise comparison, P < 0.05.
Mechanical impedance caused a significant increase in fluorescence of the reporter line DR5rev::3xVENUS‐N7 tip 6 h after encountering a barrier in the stele and lateral root cap (Fig. 8a,b). Similarly, the ratiometric reporter R2D2 showed Tomato/Venus fluorescence increased significantly at 6 h (Fig. 8c–e), indicating an increase in auxin levels. Asymmetric distribution of auxin was also detected, with ‘left to right’ auxin level increasing significantly in response to impedance (Fig. 8d). There was also a significant increase in Tomato/Venus fluorescence by 4 h (ANOVA P = 0.001, Fig. S15), i.e. the time when auxin transport mutants showed altered RTA responses, indicating a significant increase in auxin at the root tip in that early response period. Cell type analysis also revealed a significant change in left/right auxin level in the LRC/Epidermis between 2 h and 4 h (ANOVA, P = 0.03; Fig. S15). These data show auxin distribution dynamics across the root occurring from the first impedance bending response.
Fig. 8.

Imaging of reporters reveals auxin distribution changes. Barriers were placed in front of vertically growing Arabidopsis roots for 6 d after stratification. (a) Confocal imaging of the DR5rev::3xVENUS‐N7 auxin reporter 6 h after placement of a barrier and stained with propidium iodide before imaging, compared with control. Yellow, Venus; magenta, propidium iodide. (b) Relative mean fluorescence measured using imagej in the stele, columella/quiescent centre (QC) and lateral root cap (LRC). (c) Confocal imaging of the R2D2 auxin reporter in roots responding to a barrier at 6 h. Green, DII‐m3xVenus; magenta, mDII‐ndTomato. Ratiometric image of mDII‐ndTomato/DII‐m3xVenus fluorescence produced in imagej using image calculator. (d) Ratio of mDII‐ndTomato/DII‐m3xVenus fluorescence. (e) Ratio of auxin level across the left and right sides of the root tip. Ratio was calculated using the formula exp(|(log(left/right))|) to account for any bias in assigning left/right side of the root. Bars, 50 µm. Black circles and error bars represent mean ± SE. Coloured circles represent distribution of individual data points. Lines and asterisks show significance (ns, not significant; *, P < 0.05; **, P < 0.01).
Auxin and ethylene rsponses in the reactive oxygen species mutant atrbohD/F
To gain some insight into the relationship between ROS, auxin and ethylene signalling, we used qRT‐PCR to monitor the expression of two auxin responsive genes, AUXIN INDUCIBLE 1 (IAA1) and IAA2, and one ethylene response gene, ERF1, in the atrbohD/F mutant background at 7 DAS. While the auxin genes showed no change in expression compared to WT controls, ERF1 showed some reduction in mean expression in the mutant compared to WT, though only statistically significant at P = 0.4 (Fig. 9). The results do however suggest that ATRBOHD/F function may be required for correct ethylene responses.
Fig. 9.

Auxin and ethylene pathway gene expression in the Arabidopsis atrbohD/F double mutant. Expression of IAA1, IAA2 and ERF1 were determined by qRT‐PCR in control and mutant seedlings at 7 d after statification. UBQ10 was the reference geen. Results represent the mean of four biological replicates. The upper and lower boundaries of each boxplot indicate the interquartile range, the black line within the box marks the median, circles represent the mean, and whiskers represent the minimum and maximum excluding outliers. P values are indicated.
Discussion
Placing a horizontal obstacle in the way of a vertically growing root reveals a response likely to be induced by a combination of touch sensing and gravity, and resulting in a ‘step‐like’ growth pattern, with only the root tip remaining in contact with the barrier surface (Massa & Gilroy, 2003; Lee et al., 2020). Root bending has also been observed in roots grown in a medium consisting of a soft upper layer and a hard lower layer, with roots exhibiting a bending response at the harder layer (Yamamoto et al., 2008; Yan et al., 2017, 2018). It has been suggested that a zone of ‘mechanical weakness’ is required for the bending process and that this is localized between the growing and mature zones of the root (Bizet et al., 2016).
In our experiments, we similarly observed the two‐step growth pattern, and the RNA‐seq analysis revealed significant changes in three, likely interrelated, signalling pathways, namely ROS, ethylene and auxin. From an analysis of the RTA of ROS, ethylene signalling and auxin transport mutants and reporter imaging studies, it would appear that ROS and ethylene responses occur relatively early, based on relatively early transcriptional changes and early ROS reporter activity observed during the period of the touch and first bend of the root, followed by auxin responses. The root behaviour of the atrbohD/F double mutant, defective in ROS generation, is first detectable relatively quickly after impedance, within c. 75 min of barrier touching, followed by HyPer and CellROX ROS reporter accumulation in outer root cap cells and lateral root cap and root elongation zone within 3 h (Figs 3, 4). No significant barrier effect on ROS reporter activity was seen in the root meristem. CellROX dyes measure general oxidative stress whereas as HyPer is specific to H2O2 (Belousov et al., 2006). Both CellROX and HyPer exhibited fluorescence in the root tip, however only CellROX showed a strong signal in the meristem and elongation zone. CellROX may not be sensitive enough to pick up any changes in the level of a specific ROS such as H2O2, hence no change observed in CellROX at the root tip. As HyPer was only observed at the root tip it cannot be compared directly to the CellROX stain in the meristem and EZ. It is also possible that redistribution of ROS occurs, with an increase at the root tip and decrease in the elongation zone.
Early ethylene requirements were also seen as altered root behaviour of the ethylene‐insensitive etr1 mutant within 45–60 min of barrier contact. Over a longer period (6–24 h), a likely role for ethylene biosynthesis was identified through root responses of seedlings (RTA, root hair density and length) treated with the ethylene synthesis inhibitor AVG (Fig. 5). There is evidence that ROS and ethylene signalling pathways interact in a positive loop, such that one activates the other (Xia et al., 2015). However, our RNA‐seq data suggest an upregulation in ethylene signalling and biosynthesis at the transcriptional level is transient. At 30 h, ACS5 is downregulated and there is no upregulation of any ethylene signalling genes. When ethylene signalling is perturbed, decreases in root growth in response to a barrier are not observed (Okamoto et al., 2008; Okamoto & Takahashi, 2019). The Arabidopsis ethylene‐insensitive mutants either grow longer or are less inhibited than WT following barrier contact (Figs S12, S13), consistent with inhibitory effects of ethylene on primary and lateral root growth via auxin effects (Ružička et al., 2007); and suggesting that ethylene signalling may represent a useful target for breeders hoping to improve root growth in compact soils.
Consistent with recent previous work (Lee et al., 2020), auxin transport effects were observed through altered bending responses of aux1 and eir1 (pin2) mutants (which also exhibit ethylene insensitivity) or seedlings treated with the auxin transport inhibitor NPA, but not until after c. 6–24 h after barrier contact (Fig. 7); although auxin‐related transcriptional changes were established by 6 h. Although auxin transport mutants have reduced gravitropic responses, it was nevertheless possible to place barriers beneath the advancing root tips to determine effects on growth. The results indicate a role for auxin transport in the WT impedance response.
Plant signalling systems form an interacting network to elicit developmental change, such as in root growth and developmental responses to environmental stresses in the soil (Moore et al., 2015; Rowe et al., 2016). As indicated earlier, ethylene can lead to reduced primary root growth in Arabidopsis by activating auxin biosynthesis in the root tip and promoting its transport to the elongation zone, where it inhibits cell elongation (Ruzicka et al., 2007; Swarup et al., 2007). Given this evidence, and the observed timing of ROS, ethylene and auxin responses on contact with a mechanical barrier, it seems likely that a ROS‐ethylene signalling and/or synthesis module leads to altered root growth and bending by effects on auxin distribution, as seen in Figs 7, 8 and S15. It is also likely that PIN2 is involved in the observed auxin redistribution (Lee et al., 2020), though other PIN proteins, AUX1, and possibly ABC transporters may also be involved. Interestingly, lateral root development can be induced by mechanically induced root bending, associated with the local elevation of calcium ion (Ca2+) levels and asymmetric auxin redistribution to the site of emergence (Richter et al., 2009). Asymmetric auxin distribution was also found for mechanically impeded roots in our experimental system (Figs 8, S15). The activation of root hair and lateral root development in response to barrier contact may represent a mechanism to anchor the root in the soil to facilitate the observed lateral growth around the barrier, as part of the soil exploration process.
An interesting question is around the role of ROS. The evidence presented shows a relatively rapid upregulation of ROS‐related gene transcription, including of genes encoding ROS‐generating enzymes such as RHD2, required for root hair development and other stress responses (Foreman et al., 2003). An interesting question surrounds the mechanistic relationship between ROS production and the activity of other signalling pathways, such as ethylene and auxin (Fig. S16). Inhibition of ROS signalling, such as in the atrbohD/F mutant or following treatment with the ROS inhibitor DPI, led to early changes in the root response to mechanical impedance, and our results (Fig. 9) tenatively suggest a requirement for ROS signalling in the activation of ethylene signalling (which in turn can induce auxin synthesis and transport); but details of such ROS‐dependent crosstalk remain to be discovered. Monshausen et al. (2009) have demonstrated that ROS production in response to mechanical stimuli requires Ca2+ signalling. ROS and Ca2+ have been proposed to act together, with NADPH oxidase‐produced ROS activating Ca2+ channels and the increase in Ca2+, in turn further activating NADPH oxidase activity (Gilroy et al., 2016). Recently, Wu et al. (2020) identified the first H2O2 receptor in plants, HPCA1. This membrane‐bound receptor kinase was also shown to mediate H2O2‐induced activation of Ca2+ channels in guard cells, providing further evidence for how ROS mediates Ca2+ signalling. Data from our RNA‐seq at 6 h after barrier contact did reveal an upregulation of this gene, three related genes (HPCAL1, HPCAL2, HPCAL4) and also genes involved in Ca2+ signalling, binding and transport, suggesting changes in levels of Ca2+ in the root. Future work should aim to explore further the interactions between ROS and Ca2+, and auxin and ethylene signalling during the root barrier response.
Author contributions
KL and JFT devised the project; AGRJ and GJ carried out the experimental work; KL, JFT and JX supervised the work; KL and AGRJ drafted the manuscript; all authors edited the manuscript.
Supporting information
Fig. S1 Barrier systems.
Fig. S2 proCYCB1;2::CYCB1:2:GUS expression reveals cell division in impeded roots.
Fig. S3 Barrier effects on primary root growth.
Fig. S4 Analysis of variation in gene expression between and within sample groups.
Fig. S5 Genes differentially expressed in roots encountering a barrier compared with controls after 6 h and 30 h treatment identified through RNA‐seq.
Fig. S6 Treemap output from REVIGO of genes identified as significantly upregulated and downregulated 6 h after encountering a barrier.
Fig. S7 Treemap output from REVIGO of genes identified as significantly upregulated and downregulated 30 h after encountering a barrier.
Fig. S8 Hormone signalling and metabolic/biosynthesis related GO terms identified by GO analysis of genes differentially expressed in response to a barrier.
Fig. S9 ABA and GA have no clear role in the root impedance response.
Fig. S10 Ethylene‐related gene expression analysis.
Fig. S11 Response of etr1 and ein2 to a barrier.
Fig. S12 Growth of etr1 between 0 and 8 h after barrier placement.
Fig. S13 Growth of wild‐type and ethylene‐sensitive mutant roots after barrier placement.
Fig. S14 KEGG pathway mapping of genes differentially expressed at 6 and 30 h in response to a barrier and identified as being involved in the auxin signalling pathway.
Fig. S15 Confocal imaging of R2D2 in roots responding to a barrier between 0 and 4 h.
Fig. S16 Pathways involved in the root barrier response.
Table S1 Primers used for qRT‐PCR.
Table S2 NADPH‐oxidase genes identified through RNA‐seq that are upregulated during the barrier response at 6 h.
Table S3 List of genes that act as reactive oxygen species (ROS) scavengers identified in the RNA‐seq data of differentially expressed genes in response to a barrier log2FC identified with P‐value < 0.05.
Please note: Wiley Blackwell are not responsible for the content or functionality of any Supporting Information supplied by the authors. Any queries (other than missing material) should be directed to the New Phytologist Central Office.
Acknowledgements
KL acknowledges The Biotechnology and Biological Sciences Research Council (BBSRC; BBS/B/0773X), a BBSRC DTP studentship to GJ (BB/M011186/1), and Durham University, for funding.
See also the Commentary on this article by Del Bianco & Kepinski 231: 8–10.
Data availability
All materials and data described in this article are available to readers from the corresponding author, upon reasonable request.
References
- Alameda D, Anten NP, Villar R. 2012. Soil compaction effects on growth and root traits of tobacco depend on light, water regime and mechanical stress. Soil and Tillage Research 120: 121–129. [Google Scholar]
- Alexander KG, Miller MH. 1991. The effect of soil aggregate size on early growth and shoot‐root ratio of maize (Zea mays L.). Plant and Soil 138: 189–194. [Google Scholar]
- Belousov VV, Fradkov AF, Lukyanov KA, Staroverov DB, Shakhbazov KS, Terskikh AV, Lukyanov S. 2006. Genetically encoded fluorescent indicator for intracellular hydrogen peroxide. Nature Methods 3: 281–286. [DOI] [PubMed] [Google Scholar]
- Bengough AG, Bransby MF, Hans J, McKenna SJ, Roberts TJ, Valentine TA. 2006. Root responses to soil physical conditions; growth dynamics from field to cell. Journal of Experimental Botany 57: 437–447. [DOI] [PubMed] [Google Scholar]
- Bengough AG, McKenzie BM, Hallett PD, Valentine TA. 2011. Root elongation, water stress, and mechanical impedance: a review of limiting stresses and beneficial root tip traits. Journal of Experimental Botany 62: 59–68. [DOI] [PubMed] [Google Scholar]
- Bengough AG, Mullins CE. 1991. Penetrometer resistance, root penetration resistance and root elongation rate in two sandy loam soils. Plant and Soil 131: 59–66. [Google Scholar]
- Bingham IJ, Bengough AG, Rees RM. 2010. Soil compaction‐N interactions in barley: root growth and tissue composition. Soil and Tillage Research 106: 241–246. [Google Scholar]
- Bizet F, Bengough AG, Hummel I, Bogeat‐Triboulot MB, Dupuy LX. 2016. 3D deformation field in growing plant roots reveals both mechanical and biological responses to axial mechanical forces. Journal of Experimental Botany 67: 5605–5614. [DOI] [PMC free article] [PubMed] [Google Scholar]
- Blilou I, Xu J, Wildwater M, Willemsen V, Paponov I, Friml J, Heldstra R, Aida M, Palme K, Scheres B. 2005. The PIN auxin efflux facilitator network controls growth and patterning in Arabidopsis roots. Nature 433: 39–44. [DOI] [PubMed] [Google Scholar]
- Bolger AM, Lohse M, Usadel B. 2014. Trimmomatic: a flexible trimmer for Illumina sequence data. Bioinformatics 30: 2114–2120. [DOI] [PMC free article] [PubMed] [Google Scholar]
- Braam J. 2005. In touch: plant responses to mechanical stimuli. New Phytologist 165: 373–389. [DOI] [PubMed] [Google Scholar]
- Brown JW, Calixto CP, Zhang R. 2017. High‐quality reference transcript datasets hold the key to transcript‐specific RNA‐sequencing analysis in plants. New Phytologist 213: 525–530. [DOI] [PubMed] [Google Scholar]
- Brunoud G, Wells DM, Oliva M, Larrieu A, Mirabet V, Burrow AH, Beeckman T, Kepinski S, Traas J, Bennett MJ et al. 2012. A novel sensor to map auxin response and distribution at high spatio‐temporal resolution. Nature 482: 103–106. [DOI] [PubMed] [Google Scholar]
- Buer CS, Wasteneys GO, Masle J. 2003. Ethylene modulates root‐wave responses in Arabidopsis. Plant Physiology 132: 1085–1096. [DOI] [PMC free article] [PubMed] [Google Scholar]
- Calixto CP, Guo W, James AB, Tzioutziou NA, Entizne JC, Panter PE, Knight H, Nimmo HG, Zhang R, Brown JW. 2018. Rapid and dynamic alternative splicing impacts the Arabidopsis cold response transcriptome. Plant Cell 30: 1424–1444. [DOI] [PMC free article] [PubMed] [Google Scholar]
- Casson SA, Chilley PM, Topping JF, Evans I, Souter MA, Lindsey K. 2002. The POLARIS gene of Arabidopsis encodes a predicted peptide required for correct root growth and leaf vascular patterning. Plant Cell 14: 1705–1721. [DOI] [PMC free article] [PubMed] [Google Scholar]
- Colon‐Carmona A, You R, Haimovitch‐Gal T, Doerner P. 1999. Spatio‐temporal analysis of mitotic activity with a labile cyclin‐GUS fusion protein. The Plant Journal 20: 503–508. [DOI] [PubMed] [Google Scholar]
- Croser C, Bengough AG, Pritchard J. 1999. The effect of mechanical impedance on root growth in pea (Pisum sativum). I. Rates of cell flux, mitosis, and strain during recovery. Physiologia Plantarum 107: 277–286. [Google Scholar]
- Foreman J, Demidchik V, Bothwell JH, Mylona P, Miedema H, Angel Torres M, Linstead P, Costa S, Brownlee C, Jones JD et al. 2003. Reactive oxygen species produced by NADPH oxidase regulate plant cell growth. Nature 422: 442–446. [DOI] [PubMed] [Google Scholar]
- Friml J, Wisniewska J, Benková E, Mendgen K, Palme K. 2002. Lateral relocation of auxin efflux regulator PIN3 mediates tropism in Arabidopsis. Nature 415: 806–809. [DOI] [PubMed] [Google Scholar]
- Gadjev I, Vanderauwera S, Gechev TS, Laloi C, Minkov IN, Shulaev V, Apel K, Inzé D, Mittler R, Van Breusegem F. 2006. Transcriptomic footprints disclose specificity of reactive oxygen species signaling in Arabidopsis. Plant Physiology 141: 436–445. [DOI] [PMC free article] [PubMed] [Google Scholar]
- Geisler M, Blakeslee JJ, Bouchard R, Lee OR, Vincenzetti V, Bandyopadhyay A, Titapiwatanakun B, Peer WA, Bailly A, Richards EL et al. 2005. Cellular efflux of auxin catalyzed by the Arabidopsis MDR/PGP transporter AtPGP1. The Plant Journal 44: 179–194. [DOI] [PubMed] [Google Scholar]
- Gewin V. 2010. Food: An underground revolution. Nature 466: 552–553. [DOI] [PubMed] [Google Scholar]
- Gilroy S, Białasek M, Suzuki N, Górecka M, Devireddy AR, Karpińsk S, Mittler R. 2016. ROS, calcium, and electric signals: key mediators of rapid systemic signaling in plants. Plant Physiology 171: 1606–1615. [DOI] [PMC free article] [PubMed] [Google Scholar]
- Gilroy S, Suzuki N, Miller G, Choi WG, Toyota M, Devireddy AR, Mittler R. 2014. A tidal wave of signals: calcium and ROS at the forefront of rapid systemic signaling. Trends in Plant Science 19: 623–630. [DOI] [PubMed] [Google Scholar]
- González‐García M‐P, Vilarrasa‐Blasi J, Zhiponova M, Divol F, Mora‐García S, Russinova E, Caño‐Delgado AI. 2011. Brassinosteroids control meristem size by promoting cell cycle progression in Arabidopsis roots. Development 138: 849–859. [DOI] [PubMed] [Google Scholar]
- Grzesiak MT. 2009. Impact of soil compaction on root architecture, leaf water status, gas exchange and growth of maize and triticale seedlings. Plant Root 3: 10–16. [Google Scholar]
- Guo W, Tzioutziou N, Stephen G, Milne I, Calixto C, Waugh R, Brown JW, Zhang R. 2019. 3D RNA‐seq – a powerful and flexible tool for rapid and accurate differential expression and alternative splicing analysis of RNA‐seq data for biologists. BioRxiv: 656686. [DOI] [PMC free article] [PubMed] [Google Scholar]
- Hanbury CD, Atwell BJ. 2005. Growth dynamics of mechanically impeded lupin roots: does altered morphology induce hypoxia? Annals of Botany 96: 913–924. [DOI] [PMC free article] [PubMed] [Google Scholar]
- Hu C‐H, Wang P‐Q, Zhang P‐P, Nie X‐M, Li B‐B, Tai L, Liu W‐T, Li W‐Q, Chen K‐M. 2020. NADPH oxidases: the vital performers and center hubs during plant growth and signaling. Cells 9: 437. [DOI] [PMC free article] [PubMed] [Google Scholar]
- Iijima M, Kato J. 2007. Combined soil physical stress of soil drying, anaerobiosis and mechanical impedance to seedling root growth of four crop species. Plant Production Science 10: 451–459. [Google Scholar]
- Iijima M, Kono Y. 1991. Interspecific differences of the root system structures of four cereal species as affected by soil compaction. Japanese Journal of Crop Science 60: 130–145. [Google Scholar]
- Jin K, Shen J, Ashton RW, Dodd IC, Parry MA, Whalley WR. 2013. How do roots elongate in a structured soil? Journal of Experimental Botany 64: 4761–4777. [DOI] [PubMed] [Google Scholar]
- Kobaissi A, Kanso AA, Kanbar HJ, Kazpard VA. 2013. Morpho‐physiological changes caused by soil compaction and irrigation on Zea mays . Eurasian Journal of Soil Science 2: 114–121. [Google Scholar]
- Kováčik J, Babula P, Hedbavny J, Švec P. 2014. Manganese‐induced oxidative stress in two ontogenetic stages of chamomile and amelioration by nitric oxide. Plant Science 215–216: 1–10. [DOI] [PubMed] [Google Scholar]
- Kurihara D, Mizuta Y, Sato Y, Higashiyama T. 2015. ClearSee: a rapid optical clearing reagent for whole‐plant fluorescence imaging. Development 142: 4168–4179. [DOI] [PMC free article] [PubMed] [Google Scholar]
- Lee HJ, Kim HS, Park JM, Cho HS, Jeon JH. 2020. PIN‐mediated polar auxin transport facilitates root obstacle avoidance. New Phytologist 225: 1285–1296. [DOI] [PubMed] [Google Scholar]
- Lewis DR, Miller ND, Splitt BL, Wu G, Spalding EP. 2007. Separating the roles of acropetal and basipetal auxin transport on gravitropism with mutations in two Arabidopsis multidrug resistance‐like ABC transporter genes. Plant Cell 19: 1838–1850. [DOI] [PMC free article] [PubMed] [Google Scholar]
- Liao CY, Smet W, Brunoud G, Yoshida S, Vernoux T, Weijers D. 2015. Reporters for sensitive and quantitative measurement of auxin response. Nature Methods 12: 1098. [DOI] [PMC free article] [PubMed] [Google Scholar]
- Liu HB, Wang XD, Zhang YY, Dong JJ, Ma C, Chen WL. 2015. NADPH oxidase RBOHD contributes to autophagy and hypersensitive cell death during the plant defense response in Arabidopsis thaliana . Biologia Plantarum 59: 570–580. [Google Scholar]
- Lobet G, Pagès L, Dray X. 2011. A novel image‐analysis toolbox enabling quantitative analysis of root system architecture. Plant Physiology 157: 29–39. [DOI] [PMC free article] [PubMed] [Google Scholar]
- Love MI, Huber W, Anders S. 2014. Moderated estimation of fold change and dispersion for RNA‐seq data with DESeq2. Genome Biology 15: 550. [DOI] [PMC free article] [PubMed] [Google Scholar]
- Masle J. 2002. High soil strength: mechanical forces at play on root morphogenesis and in root:shoot signaling. In: Waisel Y, Amram E, Uzi K, eds. Plant roots: the hidden half. New York, NY, USA: Marcel Dekker, 807–819. [Google Scholar]
- Massa GD, Gilroy S. 2003. Touch modulates gravity sensing to regulate the growth of primary roots of Arabidopsis thaliana . Plant Journal 33: 435–445. [DOI] [PubMed] [Google Scholar]
- Miller G, Schlauch K, Tam R, Cortes D, Torres MA, Shulaev V, Dangl JL, Mittler R. 2009. The plant NADPH oxidase RBOHD mediates rapid systemic signaling in response to diverse stimuli. Science Signaling 2: ra45. [DOI] [PubMed] [Google Scholar]
- Monshausen GB, Bibikova TN, Weisenseel MH, Gilroy S. 2009. Ca2+ regulates reactive oxygen species production and pH during mechanosensing in arabidopsis roots. The Plant Cell 21: 2341–2356. [DOI] [PMC free article] [PubMed] [Google Scholar]
- Moore S, Zhang X, Mudge A, Rowe JH, Topping JF, Liu J, Lindsey K. 2015. Spatiotemporal modelling of hormonal crosstalk explains the level and patterning of hormones and gene expression in Arabidopsis thaliana wild‐type and mutant roots. New Phytologist 207: 1110–1122. [DOI] [PMC free article] [PubMed] [Google Scholar]
- Morales J, Kadota Y, Zipfel C, Molina A, Torres MA. 2016. The Arabidopsis NADPH oxidases RbohD and RbohF display differential expression patterns and contributions during plant immunity. Journal of Experimental Botany 67: 1663–1676. [DOI] [PubMed] [Google Scholar]
- Muday GK, Rahman A. 2008. Auxin transport and the integration of gravitropic growth. In: Gilroy S, Masson P, eds. Plant tropisms. Oxford, UK: Blackwell, 47–77. [Google Scholar]
- Okada K, Shimura Y. 1990. Reversible root tip rotation in Arabidopsis seedlings induced by obstacle‐touching stimulus. Science 250: 274–276. [DOI] [PubMed] [Google Scholar]
- Okamoto T, Takahashi T. 2019. Ethylene signaling plays a pivotal role in mechanical‐stress‐induced root‐growth cessation in Arabidopsis thaliana . Plant Signaling and Behavior 14: 1669417. [DOI] [PMC free article] [PubMed] [Google Scholar]
- Okamoto T, Tsurumi S, Shibasaki K, Obana Y, Takaji H, Oono Y, Rahman A. 2008. Genetic dissection of hormonal responses in the roots of arabidopsis grown under continuous mechanical impedance. Plant Physiology 146: 1651–1662. [DOI] [PMC free article] [PubMed] [Google Scholar]
- Ottenschläger I, Wolff P, Wolverton C, Bhalerao RP, Sandberg G, Ishikawa H, Evans M, Palme K. 2003. Gravity‐regulated differential auxin transport from columella to lateral root cap cells. Proceedings of the National Academy of Sciences, USA 100: 2987–2991. [DOI] [PMC free article] [PubMed] [Google Scholar]
- Patro R, Duggal G, Love MI, Irizarry RA, Kingsford C. 2017. Salmon provides fast and bias‐aware quantification of transcript expression. Nature Methods 14: 417–419. [DOI] [PMC free article] [PubMed] [Google Scholar]
- Pernisova M, Prat T, Grones P, Harustiakova D, Matonohova M, Spichal L, Nodzynski T, Friml J, Hejatk J. 2016. Cytokinins influence root gravitropism via differential regulation of auxin transporter expression and localization in Arabidopsis. New Phytologist 212: 497–509. [DOI] [PubMed] [Google Scholar]
- Potocka I, Szymanowska‐Pulka J. 2018. Morphological responses of plant roots to mechanical stress. Annals of Botany 122: 711–723. [DOI] [PMC free article] [PubMed] [Google Scholar]
- Ramakers C, Ruitjer JM, Deprez RHL, Moorman AFM. 2003. Assumption‐free analysis of quantitative real‐time polymerase chain reaction (PCR) data. Neuroscience Letters 339: 62–66. [DOI] [PubMed] [Google Scholar]
- Richter GL, Monhausen GB, Krol A, Gilroy S. 2009. Mechanical stimuli modulate lateral root organogenesis. Plant Physiology 151: 1855–1866. [DOI] [PMC free article] [PubMed] [Google Scholar]
- Roberts JA, Hussain A, Taylor IB, Black CR. 2002. Use of mutants to study long‐distance signalling in response to compacted soil. Journal of Experimental Botany 53: 45–50. [PubMed] [Google Scholar]
- Rowe J, Topping JF, Liu J, Lindsey K. 2016. Abscisic acid regulates root growth under osmotic stress conditions via an interacting hormonal network with cytokinin, ethylene and auxin. New Phytologist 211: 225–239. [DOI] [PMC free article] [PubMed] [Google Scholar]
- Ružička K, Ljung K, Vanneste S, Podhorská R, Beeckman T, Friml J, Benková E. 2007. Ethylene regulates root growth through effects on auxin biosynthesis and transport‐dependent auxin distribution. Plant Cell 19: 2197–2212. [DOI] [PMC free article] [PubMed] [Google Scholar]
- Růžička K, Strader LC, Bailly A, Yang H, Blakeslee J, Łangowski Ł, Nejedlá E, Fujita H, Itoh H, Syono K. 2010. Arabidopsis PIS1 encodes the ABCG37 transporter of auxinic compounds including the auxin precursor indole‐3‐butyric acid. Proceedings of the National Academy of Sciences, USA 107: 10749–10753. [DOI] [PMC free article] [PubMed] [Google Scholar]
- Schnittger A, Schoebinger U, Stierhof Y‐D, Huelskamp M. 2002. Ectopic B‐type cyclin expression induces mitotic cycles in endoreduplicating Arabidopsis trichomes. Current Biology 12: 415–420. [DOI] [PubMed] [Google Scholar]
- Soneson C, Love MI, Robinson MD. 2016. Differential analyses for RNA‐seq: transcript‐level estimates improve gene‐level inferences. F1000 Research 4: 1521. [DOI] [PMC free article] [PubMed] [Google Scholar]
- Staswick PE, Serban B, Rowe M, Tiryaki I, Maldonado MT, Maldonado MC, Suza W. 2005. Characterization of an arabidopsis enzyme family that conjugates amino acids to indole‐3‐acetic acid. Plant Cell 17: 616–627. [DOI] [PMC free article] [PubMed] [Google Scholar]
- Strader LC, Chen GL, Bartel B. 2010. Ethylene directs auxin to control root cell expansion. Plant Journal 64: 874–884. [DOI] [PMC free article] [PubMed] [Google Scholar]
- Supek F, Bošnjak M, Škunca N, Šmuc T. 2011. Revigo summarizes and visualizes long lists of gene ontology terms. PLoS ONE 6: e21800. [DOI] [PMC free article] [PubMed] [Google Scholar]
- Swarup R, Kramer EM, Perry P, Knox K, Leyser HMO, Haseloff J, Beemster GT, Bhalerao R, Bennett MJ. 2005. Root gravitropism requires lateral root cap and epidermal cells for transport and response to a mobile auxin signal. Nature Cell Biology 7: 1057–1065. [DOI] [PubMed] [Google Scholar]
- Swarup R, Perry P, Hagenbeek D, Van Der Straeten D, Beemster GT, Sandberg G, Bhalerao R, Ljung K, Bennett MJ. 2007. Ethylene upregulates auxin biosynthesis in Arabidopsis seedlings to enhance inhibition of root cell elongation. Plant Cell 19: 2186–2196. [DOI] [PMC free article] [PubMed] [Google Scholar]
- Taylor HM, Ratliff LF. 1969. Root elongation rates of cotton and peanuts as a function of soil strength and soil water content. Soil Science 108: 113–119. [Google Scholar]
- Topping JF, Lindsey K. 1997. Promoter trap markers differentiate structural and positional components of polar development in Arabidopsis. Plant Cell 9: 1713–1725. [DOI] [PMC free article] [PubMed] [Google Scholar]
- Veen BW. 1982. The influence of mechanical impedance on the growth of maize roots. Plant and Soil 66: 101–109. [Google Scholar]
- Wang F, Chen ZH, Liu X, Shabala L, Yu M, Zhou M, Salih A, Shabala S. 2019. The loss of RBOHD function modulates root adaptive responses to combined hypoxia and salinity stress in Arabidopsis. Environmental and Experimental Botany 158: 125–135. [Google Scholar]
- Whalley WR, Leeds‐Harrison PB, Clark LJ, Gowing DJ. 2005. Use of effective stress to predict the penetrometer resistance of unsaturated agricultural soils. Soil and Tillage Research 84: 18–27. [Google Scholar]
- Whalley WR, Watts CW, Gregory AS, Mooney SJ, Clark LJ, Whitmore AP. 2008. The effect of soil strength on the yield of wheat. Plant and Soil 306: 237–247. [Google Scholar]
- Whitmore AP, Whalley WR. 2009. Physical effects of soil drying on roots and crop growth. Journal of Experimental Botany 60: 2845–2857. [DOI] [PubMed] [Google Scholar]
- Wright M, Adams J, Yang K, McManus P, Jacobson A, Gade A, McLean J, Britt D, Anderson A. 2016. A root‐colonizing pseudomonad lessens stress responses in wheat imposed by CuO nanoparticles. PLoS ONE 11: e0164635. [DOI] [PMC free article] [PubMed] [Google Scholar]
- Wu F, Chi Y, Jiang Z, Xu Y, Xie L, Huang F, Wan D, Ni J, Yuan F, Wu X et al. 2020. Hydrogen peroxide sensor HPCA1 is an LRR receptor kinase in Arabidopsis. Nature 578: 577–581. [DOI] [PubMed] [Google Scholar]
- Wu G, Lewis DR, Spalding EP. 2007. Mutations in Arabidopsis multidrug resistance‐like ABC transporters separate the roles of acropetal and basipetal auxin transport in lateral root development. Plant Cell 19: 1826–1837. [DOI] [PMC free article] [PubMed] [Google Scholar]
- Xia X‐J, Zhou Y‐H, Shi K, Zhou J, Foyer CH, Yu J‐Q. 2015. Interplay between reactive oxygen species and hormones in the control of plant development and stress tolerance. Journal of Experimental Botany 66: 2839–2856. [DOI] [PubMed] [Google Scholar]
- Xie YJ, Xu S, Han B, Wu MZ, Yuan XX, Han Y, Gu Q, Xu DK, Yang Q, Shen WB. 2011. Evidence of Arabidopsis salt acclimation induced by up‐regulation of HY1 and the regulatory role of RbohD‐derived reactive oxygen species synthesis. The Plant Journal 66: 280–292. [DOI] [PubMed] [Google Scholar]
- Yamamoto C, Sakata Y, Taji T, Baba T, Tanaka S. 2008. Unique ethylene‐regulated touch responses of Arabidopsis thaliana roots to physical hardness. Journal of Plant Research 121: 509–519. [DOI] [PubMed] [Google Scholar]
- Yan J, Wang B, Zhou Y. 2017. A root penetration model of Arabidopsis thaliana in phytagel medium with different strength. Journal of Plant Research 130: 941–950. [DOI] [PubMed] [Google Scholar]
- Yan J, Wang B, Zhou Y, Hao S. 2018. Resistance from agar medium impacts the helical growth of Arabidopsis primary roots. Journal of the Mechanical Behavior of Biomedical Materials 85: 43–50. [DOI] [PubMed] [Google Scholar]
- Young IM, Montagu K, Conroy J, Bengough AG. 1997. Mechanical impedance of root growth directly reduces leaf elongation rates of cereals. New Phytologist 135: 613–619. [Google Scholar]
- Zhang R, Calixto CP, Marquez Y, Venhuizen P, Tzioutziou NA, Guo W, Spensley M, Entizne JC, Lewandowska D, Have ST et al. 2017. A high quality Arabidopsis transcriptome for accurate transcript‐level analysis of alternative splicing. Nucleic Acids Research 45: 5061–5073. [DOI] [PMC free article] [PubMed] [Google Scholar]
Associated Data
This section collects any data citations, data availability statements, or supplementary materials included in this article.
Supplementary Materials
Fig. S1 Barrier systems.
Fig. S2 proCYCB1;2::CYCB1:2:GUS expression reveals cell division in impeded roots.
Fig. S3 Barrier effects on primary root growth.
Fig. S4 Analysis of variation in gene expression between and within sample groups.
Fig. S5 Genes differentially expressed in roots encountering a barrier compared with controls after 6 h and 30 h treatment identified through RNA‐seq.
Fig. S6 Treemap output from REVIGO of genes identified as significantly upregulated and downregulated 6 h after encountering a barrier.
Fig. S7 Treemap output from REVIGO of genes identified as significantly upregulated and downregulated 30 h after encountering a barrier.
Fig. S8 Hormone signalling and metabolic/biosynthesis related GO terms identified by GO analysis of genes differentially expressed in response to a barrier.
Fig. S9 ABA and GA have no clear role in the root impedance response.
Fig. S10 Ethylene‐related gene expression analysis.
Fig. S11 Response of etr1 and ein2 to a barrier.
Fig. S12 Growth of etr1 between 0 and 8 h after barrier placement.
Fig. S13 Growth of wild‐type and ethylene‐sensitive mutant roots after barrier placement.
Fig. S14 KEGG pathway mapping of genes differentially expressed at 6 and 30 h in response to a barrier and identified as being involved in the auxin signalling pathway.
Fig. S15 Confocal imaging of R2D2 in roots responding to a barrier between 0 and 4 h.
Fig. S16 Pathways involved in the root barrier response.
Table S1 Primers used for qRT‐PCR.
Table S2 NADPH‐oxidase genes identified through RNA‐seq that are upregulated during the barrier response at 6 h.
Table S3 List of genes that act as reactive oxygen species (ROS) scavengers identified in the RNA‐seq data of differentially expressed genes in response to a barrier log2FC identified with P‐value < 0.05.
Please note: Wiley Blackwell are not responsible for the content or functionality of any Supporting Information supplied by the authors. Any queries (other than missing material) should be directed to the New Phytologist Central Office.
Data Availability Statement
All materials and data described in this article are available to readers from the corresponding author, upon reasonable request.