

Abstract
Research has made strides in disaggregating health data among racial/ethnic minorities, but less is known about the extent of diversity among Whites. Using logistic regression modeling applied to data on respondents aged 40+ from the 2008 to 2016 American Community Survey, we disaggregated the non-Hispanic White population by ancestry and other racial/ethnic groups (non-Hispanic Black, non-Hispanic Asian, and Hispanic) by common subgroupings and examined heterogeneity in disability. Using logistic regression models predicting six health outcome measures, we compared the spread of coefficients for each of the large racial/ethnic groups and all subgroupings within these large categories. The results revealed that health disparities within the White population are almost as large as disparities within other racial groups. In fact, when Whites were disaggregated by ancestry, mean health appeared to be more varied among Whites than between Whites and members of other racial/ethnic groups in many cases. Compositional changes in the ancestry of Whites, particularly declines in Whites of western European ancestry and increases in Whites of eastern European and Middle Eastern ancestry, contribute to this diversity. Together, these findings challenge the oft-assumed notion that Whites are a homogeneous group and indicate that the aggregate White category obscures substantial intra-ethnic heterogeneity in health.
Keywords: Non-Hispanic Whites, Race/ethnicity, Health disparities, Disability
Introduction
The demographic composition of U.S. racial/ethnic populations is increasingly dynamic due to changing migration flows over the past few decades. Since the 1960s, the proportion of immigrants born in Europe has steadily declined, while the proportion born in Latin America, Africa, and Asia has continued to climb (Waters and Pineau 2015). These newer immigrants are more racially and ethnically diverse than earlier migrants and contribute to growing complexities within U.S. racial/ethnic groups. They are also projected to make up a growing proportion of the older population as the mainly White baby boom generation ages and dies off (Lichter 2013).
In recognition of these trends, studies have increasingly shifted away from relying on broad racial/ethnic categories to focus on sources of health disparities within groups. Studies that disaggregate ethnic subgroups have found considerable variation in the health profiles of groups classified as Hispanic (Almeida et al. 2016; Fenelon et al. 2017; Murillo et al. 2016; Verissimo et al. 2014), Asian (Brown et al. 2016; Cook et al. 2017; Fuller-Thomson et al. 2011; Gee and Ponce 2010; Ro et al. 2015; Yi et al. 2016), and Black (Elo et al. 2011; Hamilton and Hummer 2011; Hamilton 2014; Hamilton and Green 2017; Hendi et al. 2015).
However, compared to research on ethnic minorities, studies that disaggregate the non-Hispanic White population are practically non-existent. A comprehensive review of the literature found that Whites are almost always, if not exclusively, treated as the reference group in analyses with little attention paid to disparities that might exist among them. This approach is problematic for several reasons. First, assumptions about White health are grounded in a framework that defines Whiteness as a system that privileges persons of western European descent while disadvantaging individuals from other origins (Malat et al. 2018). Western Europeans, however, are not the only persons classified as White. Persons who trace their ethnic origins to eastern Europe, North Africa, and the Middle East, including parts of western Asia, are also classified as White and make up an increasing part of the White population as the proportion of western Europeans dwindles (Hixson et al. 2011; Mehta and Elo 2012; Office of Management and Budget 1997). This is an important detail because the migration experiences of these diverse ancestry groups are likely associated with unique exposures and vulnerabilities that translate into health inequities among Whites.
These studies have provided a snapshot of heterogeneity among Whites that calls for more systematic analyses. The current study aims to answer this call using nationally representative data from nine waves of the American Community Survey (ACS) (2008–2016). We use these data to disaggregate the non-Hispanic White population by ancestry and assess racial/ethnic differences in health over the nine-year study period. A key distinction we aim to make is between Whites of western European descent and those of eastern European, other European, Middle Eastern/North African (MENA region), North American, and other origins. These groups represent the major U.S. Census ancestry categories (Office of Management and Budget 1997) and allow us to differentiate the health outcomes of more established western Europeans from those of other White ethnic subgroups. They also allow us to compare the extent of heterogeneity among Whites relative to other large racial/ethnic groups traditionally measured in research on health disparities (non-Hispanic Black, non-Hispanic Asian, Hispanic).
Background
Growing Diversity among U.S. Racial/Ethnic Populations
The U.S. population is composed of increasingly diverse racial/ethnic populations that are typically collapsed into one of five distinct groups: White/Caucasian; Black/African American; Latino/Hispanic; Asian American/Native Hawaiian/Pacific Islander; and Native American/Alaska Native (Waters and Pineau 2015). However, there is significant ethnic heterogeneity within each of these groups, largely driven by historical changes in immigration. Between 1970 and 2015, immigrants jumped from 5 to 14% of the population and shifted from being predominantly European origin (75%) to being Latin American (52%) and Asian (30%) origin. As a result, the ethnic composition of racial groups today is markedly more heterogeneous than ever before. For example, Asian Americans include persons of Chinese, Indian, and Filipino descent, which represents three distinct regions in Asia (East, South, and Southeast Asia, respectively); growing segments of the non-Hispanic Black population comprised immigrants from Africa, South America, and the Caribbean; and the non-Hispanic White population includes persons with ancestries that span four continents (North America, Europe, Africa, and Asia).
The health consequences of such diversity have garnered attention from researchers and policy-makers, alike, because these groups and subsequent generations will shape the future of the U.S. healthcare system. There is also mounting evidence that patterns and explanations traditionally used to describe the health of immigrants vary by race and ethnic origin and are less applicable to some immigrant groups (Brown 2018; Waters and Pineau 2015). For example, the well-established “Hispanic paradox” (the unusual combination of good health despite lower socioeconomic status) does not describe patterns for many other groups who arrive in the U.S. with higher levels of economic and social capital (Akresh and Frank 2008; Mehta and Elo 2012). Even among Hispanics, the pattern is more evident for Mexican immigrants than Cuban and Puerto Rican immigrants, the latter of which experience poorer health outcomes similar to those of U.S.-born Black Americans (Read and Gorman 2006; Rogers et al. 2000; Vega and Amaro 1994). Research on Black Americans likewise finds considerable variability in health by nativity and region of birth, with foreign-born Blacks faring better than U.S.-born Blacks, and among the foreign-born, immigrants from Africa faring better than those from the Caribbean, Latin America, and Europe (Hamilton and Hummer 2011; Hamilton and Green 2017). Importantly, these studies conclude that broad racial categories are limited in their ability to capture the extent of health disparities among ethnic groups.
Understanding Sources of Heterogeneity among Whites
While informative, most research that disaggregates racial/ethnic populations has focused on minorities with little attention paid to internal diversity among Whites. A comprehensive review of the extant literature found no study that systematically disaggregated the health status of ethnic groups classified in the largest racial category of non-Hispanic White. Moreover, non-Hispanic Whites are almost always treated as the reference group in analyses of racial and ethnic inequalities. For example, recent research has examined disparities between Whites and other racial/ethnic groups in areas such as wealth accumulation (Killewald and Bryan 2018), the use of network ties to seek employment (Silva 2018), and health (Brown 2018; Lippert and Damaske 2018; Shandra 2018). In the cases of these studies, as well as reports such as the annual National Healthcare Disparities Report published by the Department of Health and Human Services (AHRQ 2015), Whites are treated as the majority group against which other racial/ethnic groups are compared in order to assess disparities.
However, Whites are far from monolithic and are increasingly composed of immigrants of non-western European descent (Read and Reynolds 2012; Waters and Pineau 2015). In 1980, the majority of all persons (226 million) enumerated in the U.S. Census were of Irish, English, and German ancestry (Farley 1991), and most of the foreign-born population was also of western European descent. Today, those percentages have dropped dramatically, with Irish, English, and German ancestries making up only one-third of the total U.S. population (down from 55%) and one-tenth of the foreign-born population (down from 75%) (U.S. Census Bureau 2015). Western Europeans have also made up a declining proportion of Whites in the U.S., dropping from 72% in 1980 to 53% in 2016 (see Fig. 1). In contrast, eastern Europeans, other Europeans, and individuals from the Middle East/North Africa comprise a fairly stable proportion of Whites, while there has been an increase in individuals classified as “other White” (11% in 1980 versus 21% in 2016) and North American (8% in 1980 versus 15% in 2016).
Fig. 1.
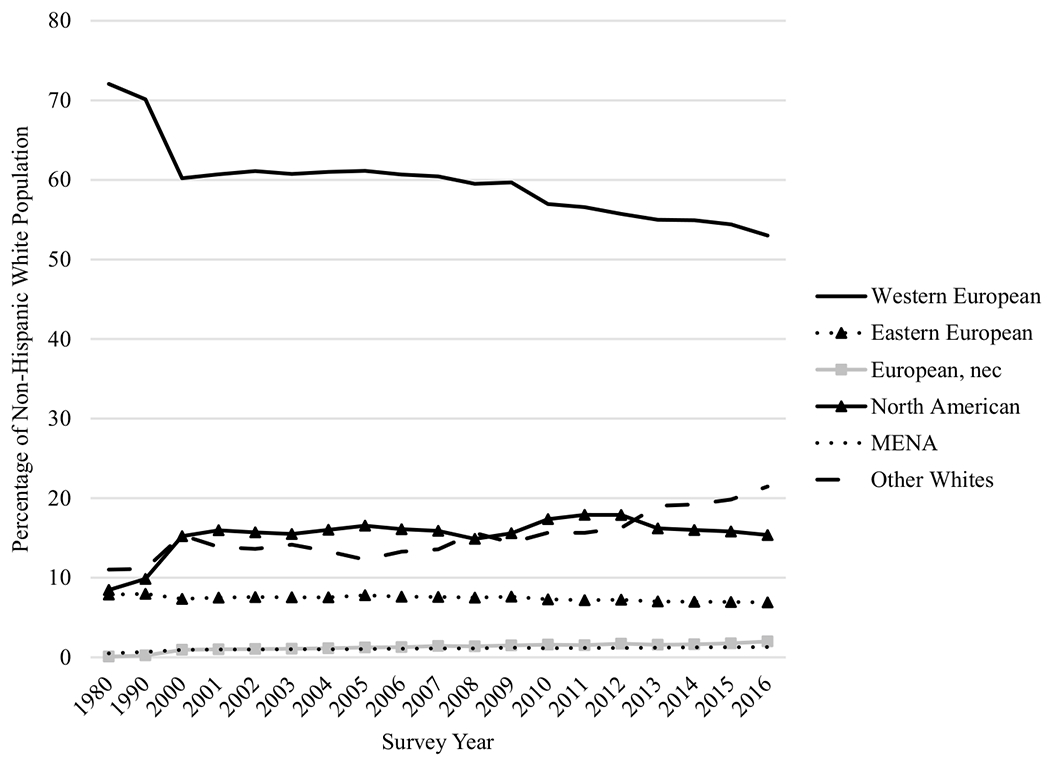
Ancestry among non-Hispanic Whites, ages 18+: American Community Survey (1980–2016) (n = 37,462,836)
Changes in the ethnic composition of Whites are tied to larger socio-political and economic contexts globally (Waters and Pineau 2015). Growth in immigration from eastern Europe and the Middle East and North Africa is particularly noteworthy because the social, economic, and political climates in these regions have resulted in contexts of exit based in civil unrest, which is different from those experienced by western Europeans. For example, the breakdown of the Former Soviet Union (FSU) contributed to a large influx of FSU immigrants in the late 1980s (Mehta and Elo 2012), and political turmoil throughout the Middle East and North Africa has contributed to the Arab1 population in the U.S. doubling in size since 1980 (de la Cruz and Brittingham 2003; Jamal and Naber 2008). The context of reception has also been less welcoming for many of these groups, especially for those of Middle Eastern and North African descent in the post-9/11 era (Bakalian and Bozorgmehr 2009; Jamal and Naber 2008).
A handful of studies have isolated ethnic groups classified as White and found that doing so provides a better understanding of health disparities among Whites. Much of this work has focused on individuals of Middle Eastern and North African descent and found that patterns in health diverge from those of the average White population across a host of outcomes, including cancer (Bergmans et al. 2014), chronic disease diagnoses (Dallo and Kindratt 2016), self-rated health (Read and Reynolds 2012), cognitive health (Ajrouch et al. 2017), and disability (Dallo et al. 2009, 2015; Read et al. 2019). A smaller literature on eastern European immigrants has also found that separating them from the larger White racial category reveals that they have poorer health outcomes than the broader White category. For example, immigrants from the FSU report higher levels of disability than U.S.-born Whites even though they have higher levels of educational attainment (Mehta and Elo 2012).
Both literatures underscore the importance of disability as an indicator of inequality and stratification (Shandra 2018) among more recent immigrant groups. In particular, when a country or region experiences prolonged periods of unrest and instability, it effects whether and what type of work is available, the degree of access to adequate nutrition, clean water, and medical care, as well as increased exposures to toxins and environmental hazards, all of which could compromise mobility and functional health (Levy and Sidel 2013). In the U.S. context, having a disability results in disadvantage along numerous dimensions (Erickson et al. 2018) and has implications for stigma, discrimination, and status attainment (e.g., employment) (Ameri et al. 2017; Green et al. 2005).
While these studies have been informative, no study to date has systematically examined ethnic diversity in health among Whites or the implications of such diversity for U.S. race-based health disparities. Treating Whites as a monolith may mask health disparities not only among them, but also between Whites and other racial groups by averaging over potentially large differences between Whites of different origins. We use a large nationally representative dataset to investigate three related research questions: (1) to what extent is heterogeneity in health among Whites similar to or different from that which exists among other major racial/ethnic groups?; (2) to what extent is there heterogeneity in health among White ethnic subgroups?; and (3) to what extent do compositional differences in social and demographic characteristics contribute to observed health disparities?
Methods
Sample
We use data from the 2008 to 2016 one-year files of the American Community Survey (ACS) Public Use Microdata Sample (PUMS) (Ruggles et al. 2017). Changes to the disability question in the 2008 and subsequent ACS surveys precluded the inclusion of prior years. Each microdata file is a stratified subsample of the full Census that includes 1% of the housing units in the U.S. This dataset is particularly useful because it contains detailed ethnic origin data on groups classified into broad racial/ethnic categories and has relatively large sample sizes. The analysis includes individuals who self-identified as non-Hispanic White, non-Hispanic Black, non-Hispanic Asian, and Hispanic, and aged 40 years and older because health problems generally manifest during midlife (Martin and Schoeni 2014). With sample weights, which we include in our analyses, the data are representative of the U.S. population.
Measures
The dependent variables used in the analyses are based on six questions in the ACS that ask about different types of disability. The questions ask whether respondents have difficulty with each of the following disabilities: physical mobility (walking or climbing stairs); self-care (bathing or dressing); independent living (going outside of the home alone for errands); cognitive function (learning, remembering, concentrating, or making decisions); vision (blind or has serious difficulty seeing even with corrective lenses); and hearing (deaf or has serious difficulty hearing). Responses to these questions (0 = no, 1 = yes) are dichotomized for each of the six measures. We examine the six disabilities separately because they identify different aspects of health and functioning (Altman et al. 2017).
The primary predictors of interest are race and ethnicity. Racial groups included in this study were White, Black or African American, Asian, and other races. For ethnicity, ACS participants indicated whether they were of Hispanic, Latino, or Spanish origin. In some analyses, we include dummy variables for the large racial/ethnic categories commonly used in demographic research on health disparities: non-Hispanic White (reference), non-Hispanic Black, non-Hispanic Asian, and Hispanic. Hereafter, we drop “non-Hispanic” in referring to these groups. In other analyses, we disaggregate each large racial/ethnic group into subgroups based on ancestry or origin. To disaggregate Whites by ancestry, we use an open-ended question that reads, “What is this person’s ancestry or ethnic origin?”2 Ancestry responses for Whites are grouped into six categories based on the Office of Management and Budget’s classification schema: western European; eastern European (including the Soviet Union); other European;3 Middle Eastern and North African (MENA region); North American; and other White (comprised of respondents who provided any other ancestry response [0.63%] or a mixture [2.00%], and respondents who did not report any ancestry [13.55%]). Hereafter, we refer to these groups as western European, eastern European, other European, MENA, North American, and other White. We likewise used U.S. Census classification categories to disaggregate non-Hispanic Blacks (North American, African, West Indian, European, Central/South American, other Blacks); non-Hispanic Asians (Chinese, Filipino, Asian Indian, Vietnamese, Korean, Japanese, other Asian); and Hispanics (Mexican, Puerto Rican, Central American, South American, Cuban, other Hispanic).
We also assess the extent to which compositional differences among racial/ethnic groups contribute to observed health disparities, as research shows that health disparities persist based on demographic, socioeconomic, and immigrant characteristics (Olshansky et al. 2012; Read et al. 2019, 2020; Vierboom et al. 2019). To this end, we include three sets of covariates that capture demographic characteristics, socioeconomic status, and immigrant characteristics. Demographic characteristics include age (in years) and sex (female = 1; male = 0). Marital status is measured with dummy variables for married (reference), separated/divorced, widowed, or never married/single. U.S. region of residence is measured with a dummy variable indicating southern residence (vs. northeastern, Midwestern, or western). Socioeconomic status is measured with three variables. Educational attainment is measured with dummy variables for less than high school (reference), high school degree, some college, and a college degree or more. Poverty status is measured with a ratio of the respondents’ total family income relative to the poverty line, and health insurance status is a dummy variable that compares those with health insurance (reference) to those without. Finally, we include three measures that are known to be associated with health outcomes in immigrant communities. We measure whether respondents are foreign-born or U.S.-born (reference); whether they are non-citizens versus U.S. citizens (reference); and whether they have limited English language proficiency versus those who speak English well/very well (reference).
Analytic Strategy
In order to investigate our research questions, we conduct two sets of analyses. First, we estimate logit models for each of the six health measures described above, with dummy variables for both the large race/ethnicity groups that are commonly used in research on racial disparities (Whites, Blacks, Asians, and Hispanics) and for all race/ethnicity/ancestry subgroups (with western European Whites as the reference; 24 dummy variables). For each outcome, we estimate three models. In the first model, we only include dummy variables for racial groups/subgroups. In the second model, we include age, age squared, and sex. In the third model, we include all additional covariates. The first model reveals the total heterogeneity that exists between racial groups and between racial/ethnic/ancestry subgroups. The second model shows the extent to which age and sex may account for some of this heterogeneity. That is, although age and sex should be weakly correlated with race at best, newer immigrant groups have been highly selected on age and sex, so some of the disparities within and between racial groups may be explained by differences in age and sex composition of the groups. The third model shows the extent to which socioeconomic disparities and other factors may explain heterogeneity in disability.
In our second set of analyses, we focus solely on the six White ancestry groups to address our second research question and determine the extent to which health outcomes of more established western Europeans differ from those of other White ethnic subgroups. Similar to the previous analysis, we estimate logistic regression models for each of the six health measures and present unadjusted and adjusted results. Our analyses involved a large number of models, so when possible, we display results visually.
Results
Table 1 presents sample characteristics for the major racial/ethnic groups and for the six disaggregated White ethnic groups. Given the volume of information, sample statistics for the 18 disaggregated Black, Asian, and Hispanic groups are available on request. As shown in the table, Blacks have higher proportions disabled than Whites (0.56 compared to 0.45, respectively), while Asians and Hispanics have lower proportions disabled (0.28 and 0.39, respectively). Among White ancestry subgroups, other Whites have the highest mean disability (0.60), followed by North Americans (0.52), persons from MENA (0.43), western Europeans (0.40), eastern Europeans (0.39), and other Europeans (0.29). Compositional differences among White ancestry groups are also noteworthy. The North American, MENA, and other White categories stand out in that they are less likely to have completed high school, have higher rates of poverty, and lower rates of health insurance coverage compared to the European groups. The North American and other White categories are also more heavily composed of females and more likely to reside in the South. In terms of nativity status, the eastern European and MENA ancestry groups have larger foreign-born populations (16.2% and 74.2%, respectively), compared to < 5% for all other White subgroups. A greater proportion of persons from MENA also lacked U.S. citizenship (16.6%) and were limited in English language proficiency (16.7%).
Table 1.
Sample characteristics by racial/ethnic and White ancestry group, ages 40+: American Community Survey (2008–2016)
| Major racial/ethnic groups |
White ancestry groups |
|||||||||
|---|---|---|---|---|---|---|---|---|---|---|
| NH White | NH Black | NH Asian | Hispanic | Western European | Eastern European | European, nec | North American | MENA | Other Whites | |
| Disability, mean (sd) | 0.45 (1.1) | 0.56 (1.2) | 0.28 (0.88) | 0.39 (1.0) | 0.40 (0.98) | 0.39 (0.99) | 0.29 (0.87) | 0.52 (1.1) | 0.43 (1.1) | 0.60 (1.2) |
| Disability | ||||||||||
| Physical | 13.3 | 18.2 | 7.5 | 11.5 | 12.2 | 11.6 | 8.2 | 15.5 | 11.8 | 16.6 |
| Self-care | 5.1 | 7.0 | 3.2 | 4.6 | 4.2 | 4.6 | 3.4 | 5.8 | 6.6 | 7.8 |
| Independent living | 8.8 | 11.5 | 6.6 | 7.5 | 7.6 | 8.0 | 5.7 | 10.0 | 9.9 | 12.1 |
| Hearing | 7.6 | 4.4 | 3.9 | 4.8 | 7.5 | 6.7 | 5.0 | 8.2 | 4.9 | 8.5 |
| Vision | 3.7 | 5.8 | 2.5 | 4.5 | 3.3 | 3.1 | 2.3 | 4.5 | 3.2 | 4.8 |
| Cognitive | 6.7 | 9.3 | 4.5 | 6.2 | 5.7 | 5.3 | 4.6 | 8.1 | 6.4 | 9.9 |
| Female | 52.3 | 55.2 | 54.6 | 51.5 | 52.2 | 52.4 | 49.8 | 53.2 | 47.3 | 52.5 |
| Age, mean (sd) | 59.6 (13.0) | 56.5 (12.0) | 56.3 (12.3) | 54.6 (11.9) | 59.8 (12.8) | 60.1 (13.1) | 56.8 (11.6) | 58.8 (12.7) | 57.2 (12.6) | 59.7 (13.7) |
| Marital status | ||||||||||
| Married | 63.5 | 40.3 | 73.9 | 60.0 | 64.6 | 64.8 | 69.9 | 63.0 | 70.2 | 58.5 |
| Separated/divorced | 17.2 | 25.2 | 9.8 | 18.9 | 16.8 | 15.0 | 15.0 | 18.7 | 13.0 | 18.8 |
| Widowed | 10.6 | 11.0 | 8.4 | 7.5 | 10.1 | 10.7 | 5.9 | 10.4 | 8.9 | 12.9 |
| Never married/single | 8.8 | 23.5 | 8.0 | 13.6 | 8.6 | 9.5 | 9.3 | 8.0 | 7.9 | 9.9 |
| Live in South | 35.2 | 57.1 | 20.5 | 37.7 | 30.4 | 19.8 | 34.9 | 52.2 | 21.8 | 43.4 |
| Education | ||||||||||
| <HS | 9.5 | 18.9 | 18.6 | 40.3 | 7.2 | 6.6 | 3.1 | 14.1 | 13.6 | 15.0 |
| HS graduate | 30.7 | 32.3 | 18.5 | 25.6 | 28.2 | 26.6 | 15.4 | 36.7 | 20.5 | 37.3 |
| Some college | 29.2 | 30.6 | 19.4 | 20.7 | 30.9 | 26.5 | 27.1 | 28.2 | 21.3 | 26.1 |
| College degree+ | 30.6 | 18.2 | 43.5 | 13.4 | 33.7 | 40.4 | 54.4 | 21.1 | 44.6 | 21.5 |
| Poverty, mean (sd) | 345.5 (159.8) | 261.6 (169.1) | 341.4 (163.2) | 256.8 (157.2) | 360.2 (154.0) | 365.7 (154.4) | 391.9 (146.6) | 318.6 (162.4) | 321.9 (173.9) | 307.5 (169.3) |
| No health insurance | 7.3 | 14.2 | 12.4 | 26.5 | 6.3 | 6.1 | 5.6 | 9.6 | 13.0 | 9.0 |
| Limited English proficiency | 0.8 | 1.2 | 25.7 | 32.4 | 0.3 | 4.0 | 0.2 | 0.1 | 16.7 | 0.9 |
| Not a U.S. citizen | 1.5 | 3.9 | 25.4 | 32.4 | 1.2 | 4.0 | 0.8 | 0.8 | 16.6 | 1.3 |
| Foreign-born | 5.7 | 11.5 | 87.5 | 59.8 | 4.4 | 16.2 | 3.5 | 2.2 | 74.2 | 4.8 |
| n | 10,920,735 | 1,349,266 | 620,522 | 1,258,441 | 6,348,000 | 779,900 | 160,401 | 1,780,650 | 89,489 | 1,762,295 |
Sample sizes are unweighted. Estimates are weighted
sd standard deviation, NH non-Hispanic, nec not elsewhere classified, MENA Middle East and North Africa, HS high school, Poverty percent of poverty threshold
In our first set of models, we estimated overall racial differences in each of the six health outcome measures described above (Table 2). Figure 2 displays the results of these logit models graphically. The figure shows the magnitude of the coefficients for dummy variables representing each large racial/ethnic group for Model 1 (no covariates; the unconditional model) and Model 3 (all covariates) for all outcomes. The detailed results can be found in Table 2. The figure reveals a fairly consistent and typical pattern. Whites are the reference group in the models, and their implied coefficient is denoted with a horizontal reference line at 0. In almost every model, Blacks evidence a higher probability of poor health, while Asians and Hispanics evidence a lower probability of poor health than Whites. The key exceptions include for the independent living and cognitive difficulty measures, where Hispanics evidence worse health than Whites in the unconditional model, and for the vision measure, where Asians evidence worse health than Whites. In the fully conditional models (Model 3), gross racial differences tend to be smaller, suggesting that demographic and socioeconomic factors explain a portion of the racial disparity in health. The general pattern remains, however, with a few exceptions. For the self-care, vision, and cognitive difficulty outcomes, once covariates are included, Blacks evidence a much lower probability of poor health than Whites. All in all, however, the results shown in Fig. 2 are consistent with typical analyses that investigate differences in health across broad racial categories.
Table 2.
Results of logistic regression models for six health outcomes among major racial/ethnic groups: American Community Survey (2008–2016) (n = 14,148,964)
| Physical disability |
Self-care disability |
Independent living disability |
|||||||
|---|---|---|---|---|---|---|---|---|---|
| Model 1 Coef (SE) |
Model 2 Coef (SE) |
Model 3 Coef (SE) |
Model 1 Coef (SE) |
Model 2 Coef (SE) |
Model 3 Coef (SE) |
Model 1 Coef (SE) |
Model 2 Coef (SE) |
Model 3 Coef (SE) |
|
| NH White (ref) | |||||||||
| NH Black | 0.37 (0.003)*** | 0.63 (0.003)*** | 0.20 (0.003)*** | 0.33 (0.004)*** | 0.61 (0.005)*** | 0.14 (0.01)*** | 0.30 (0.004)*** | 0.59 (0.004)*** | 0.08 (0.004)*** |
| NH Asian | − 0.64 (0.01)*** | − 0.47 (0.01)*** | − 0.14 (0.01)*** | − 0.47 (0.01)*** | − 0.25 (0.01)*** | − 0.16 (0.01)*** | − 0.31 (0.01)*** | − 0.09 (0.01)*** | 0.06 (0.01)*** |
| Hispanic | − 0.17 (0.004)*** | 0.16 (0.004)*** | − 0.05 (0.005)*** | − 0.12 (0.01)*** | 0.24 (0.01)*** | − 0.11 (0.01)*** | − 0.17 (0.004)*** | 0.18 (0.005)*** | −0.20 (0.01)*** |
| Constant | − 1.87 (0.001)*** | − 4.35 (0.02)*** | − 3.30 (0.02)*** | − 2.92 (0.002)*** | − 2.82 (0.03)*** | − 1.38 (0.03)*** | − 2.34 (0.001)*** | − 1.15 (0.03)*** | 0.22 (0.03)*** |
| Pseudo R2 | 0.0052 | 0.1117 | 0.1788 | 0.0029 | 0.1209 | 0.1889 | 0.0025 | 0.1381 | 0.2125 |
| BIC | 1.01E+09 | 9.02E+08 | 8.34E+08 | 5.23E+08 | 4.61E+08 | 4.25E+08 | 7.68E+08 | 6.63E+08 | 6.06E+08 |
| Hearing disability |
Vision disability |
Cognitive disability |
|||||||
| Model 1 Coef (SE) |
Model 2 Coef (SE) |
Model 3 Coef (SE) |
Model 1 Coef (SE) |
Model 2 Coef (SE) |
Model 3 Coef (SE) |
Model 1 Coef (SE) |
Model 2 Coef (SE) |
Model 3 Coef (SE) |
|
|
| |||||||||
| NH White (ref) | |||||||||
| NH Black | − 0.58 (0.01)*** | − 0.33 (0.01)*** | − 0.54 (0.01)*** | 0.46 (0.005)*** | 0.66 (0.01)*** | 0.25 (0.01)*** | 0.36 (0.004)*** | 0.51 (0.004)*** | − 0.07 (0.004)*** |
| NH Asian | − 0.72 (0.01)*** | − 0.50 (0.01)*** | − 0.15 (0.01)*** | − 0.43 (0.01)*** | − 0.25 (0.01)*** | − 0.07 (0.01)*** | − 0.43 (0.01)*** | − 0.30 (0.01)*** | − 0.03 (0.01)** |
| Hispanic | − 0.49 (0.01)*** | − 0.115 (0.01)*** | − 0.15 (0.01)*** | 0.21 (0.01)*** | 0.49 (0.019)*** | 0.16 (0.01)*** | − 0.08 (0.005)*** | 0.12 (0.005)*** | − 0.21 (0.01)*** |
| Constant | − 2.49 (0.001)*** | − 4.54 (0.03)*** | − 3.89 (0.03)*** | − 3.26 (0.002)*** | − 3.60 (0.04)*** | − 2.97 (0.04)*** | − 2.63 (0.002)*** | − 0.16 (0.03)*** | 0.86 (0.03)*** |
| Pseudo R2 | 0.0069 | 0.1494 | 0.1634 | 0.0041 | 0.0675 | 0.1093 | 0.0031 | 0.0553 | 0.1506 |
| BIC | 6.36E+08 | 5.44E+08 | 5.36E+08 | 4.29E+08 | 4.01E+08 | 3.83E+08 | 6.41E+08 | 6.07E+08 | 5.46E+08 |
Sample sizes are unweighted. Estimates are weighted
Model 2 adjusts for age, age squared, and sex
Model 3 adds marital status, health insurance, poverty, education, English proficiency, citizenship status, region, and survey year
NH non-Hispanic, NM never married, HS high school, Poverty percent of poverty threshold
p<0.05;
p<0.01;
p<0.001
Fig. 2.
Coefficients from logit models for six health outcomes among major racial groups, ages 40+: American Community Survey (2008–2016)
Note: B=Black, H=Hispanic, and A=Asian. Horizontal dashed line is for Whites. Model 1 is unconditional (race/ethnicity only). Model 3 includes all demographic and socioeconomic covariates. See Table 2 for full results.
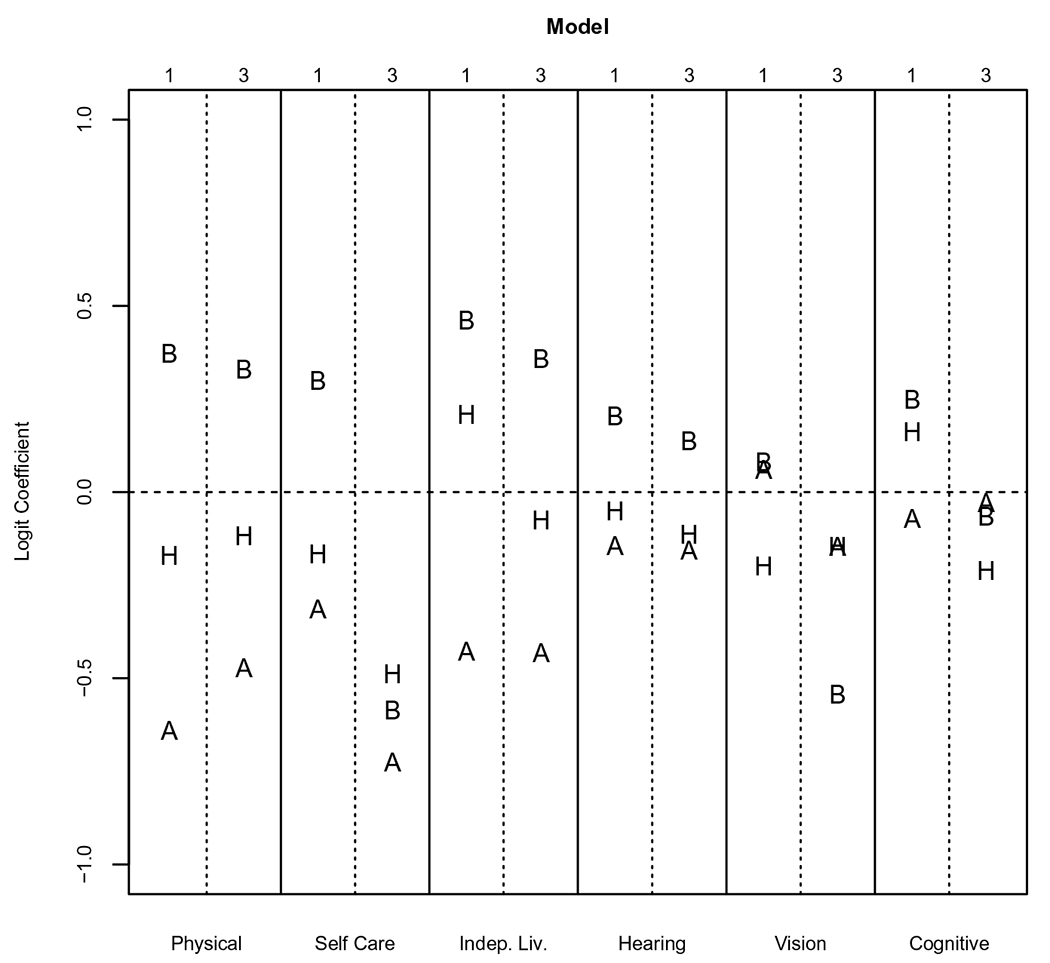
Figure 3 shows how much heterogeneity in racial disparities is missed by using broad racial groupings. In this figure, the magnitude of logit model coefficients for each racial subgroup defined in the previous section are arrayed vertically and denoted with a “W” for White groups, “B” for Black groups, “A” for Asian groups, and “H” for Hispanic groups. Each vertical grouping—separated by solid vertical lines—corresponds to a specific health measure as shown in Fig. 2. The plot in the upper half of the figure shows the results for the unconditional models (Model 1), and the plot in the lower half of the figure shows the results for the models that include all covariates (Model 3). A horizontal reference line is included in each plot at 0, the implied coefficient value for the reference group of western European Whites. Results from the full model can be found in Table 3.
Fig. 3.
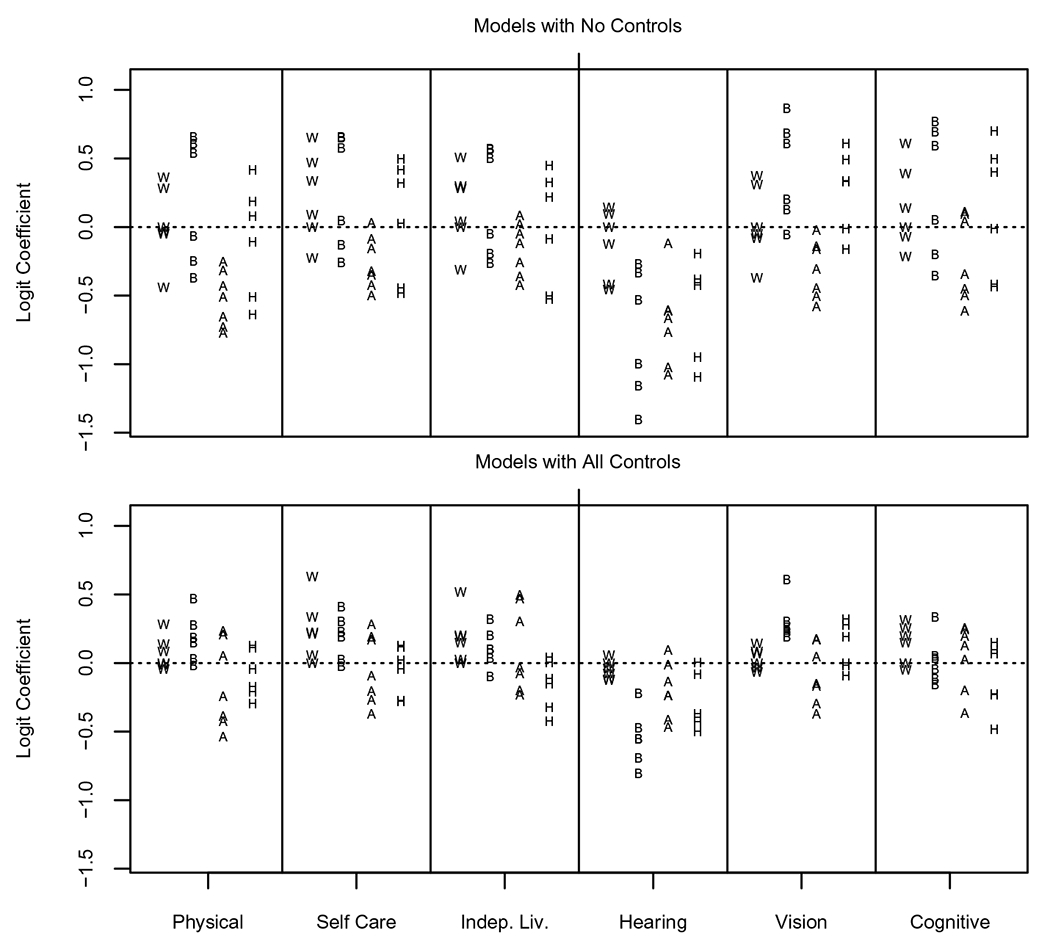
Coefficients from logit models for six health outcomes among racial/ethnic subgroups, ages 40+: American Community Survey (2008–2016)
Note: W=White subgroups, B=Black subgroups, A=Asian subgroups, and H=Hispanic subgroups. See Table 3 for subgroup names and full results.
Table 3.
Logistic regression coefficients and standard errors for six health outcomes among White ancestry and major racial groups (ACS, n = 14,148,964)
| Group (reference) | Variable | Physical disability |
Self-care disability |
||||
|---|---|---|---|---|---|---|---|
| Model 1 | Model 2 | Model 3 | Model 1 | Model 2 | Model 3 | ||
| White (W European) | E European | − 0.05 (0.01)*** | − 0.09 (0.005)*** | − 0.009 (0.005) | 0.09 (0.007)*** | 0.04 (0.01)*** | 0.06 (0.01)*** |
| European, nec | − 0.44 (0.01)*** | − 0.23 (0.01)*** | − 0.04 (0.01)*** | − 0.23 (0.02)*** | 0.04 (0.02)* | 0.21 (0.02)*** | |
| N American | 0.28 (0.003)*** | 0.38 (0.003)*** | 0.14 (0.003)*** | 0.33 (0.005)*** | 0.44 (0.01)*** | 0.23 (0.01)**** | |
| MENA | − 0.03 (0.01)* | 0.14 (0.01)*** | 0.28 (0.02)*** | 0.47 (0.02)*** | 0.67 (0.02)*** | 0.63 (0.02)*** | |
| Other White | 0.37 (0.003)*** | 0.37 (0.003)*** | 0.08 (0.003)*** | 0.65 (0.004)*** | 0.63 (0.004)*** | 0.34 (0.01)*** | |
| Black | N American | 0.54 (0.003)*** | 0.82 (0.004)*** | 0.28 (0.004)*** | 0.58 (0.005)*** | 0.87 (0.01)*** | 0.31 (0.01)*** |
| African | − 0.07 (0.02)*** | 0.39 (0.02)*** | 0.15 (0.02)*** | 0.05 (0.02)* | 0.55 (0.02)*** | 0.19 (0.02)*** | |
| West Indian | − 0.25 (0.02)*** | − 0.008 (0.02) | − 0.02 (0.02) | − 0.13 (0.02)*** | 0.15 (0.024)*** | − 0.02 (0.03) | |
| C/S American | − 0.37 (0.06)*** | − 0.15 (0.06)* | 0.03 (0.06) | − 0.26 (0.10)** | 0.02 (0.10) | 0.03 (0.10) | |
| European | 0.66 (0.03)*** | 0.91 (0.03)*** | 0.47 (0.03)*** | 0.65 (0.04)*** | 0.90 (0.05)*** | 0.41 (0.05)*** | |
| Other Black | 0.61 (0.008)*** | 0.80 (0.008)*** | 0.19 (0.01)*** | 0.66 (0.01)*** | 0.85 (0.01)*** | 0.23 (0.01)*** | |
| Asian | Chinese | − 0.73 (0.01)*** | − 0.62 (0.01)*** | − 0.54 (0.01)*** | − 0.35 (0.02)*** | − 0.19 (0.02)*** | −0.37 (0.02)*** |
| Filipino | − 0.43 (0.01)*** | − 0.27 (0.01)*** | 0.21 (0.01)*** | − 0.32 (0.02)*** | − 0.10 (0.02)*** | 0.19 (0.02)*** | |
| Asian Indian | − 0.66 (0.02)*** | − 0.31 (0.02)*** | 0.24 (0.02)*** | − 0.50 (0.03)*** | − 0.075 (0.03)** | 0.29 (0.03)*** | |
| Vietnamese | − 0.51 (0.02)*** | − 0.21 (0.02)*** | − 0.39 (0.02)*** | − 0.16 (0.02)*** | 0.21 (0.024)*** | − 0.20 (0.03)*** | |
| Korean | − 0.77 (0.02)*** | − 0.59 (0.02)*** | − 0.43 (0.02)*** | − 0.43 (0.031)*** | − 0.17 (0.03)*** | − 0.27 (0.03)*** | |
| Japanese | − 0.25 (0.02)*** | − 0.51 (0.02)*** | − 0.25 (0.02)*** | 0.03 (0.03) | − 0.25 (0.03)*** | − 0.09 (0.03)** | |
| Other Asian | − 0.32 (0.02)*** | 0.06 (0.02)*** | 0.05 (0.02)** | − 0.09 (0.02)*** | 0.36 (0.02)*** | 0.17 (0.02)*** | |
| Hispanic | Mexican | − 0.11 (0.005)*** | 0.30 (0.005)*** | − 0.04 (0.01)*** | 0.02 (0.01)** | 0.46 (0.01)*** | 0.02 (0.01)* |
| Puerto Rican | 0.42 (0.009)*** | 0.75 (0.01)*** | 0.13 (0.01)*** | 0.50 (0.01)*** | 0.85 (0.02)*** | 0.12 (0.02)*** | |
| Cuban | 0.08 (0.01)*** | 0.07 (0.01)*** | − 0.17 (0.02)*** | 0.42 (0.02)*** | 0.41 (0.02)*** | − 0.05 (0.02)* | |
| Central American | − 0.51 (0.01)*** | − 0.04 (0.01)** | − 0.21 (0.02)*** | − 0.45 (0.02)*** | 0.07 (0.02)** | − 0.28 (0.03)*** | |
| South American | − 0.64 (0.02)*** | − 0.35 (0.02)*** | − 0.29 (0.02)*** | − 0.48 (0.02)*** | − 0.14 (0.02)*** | − 0.28 (0.03)*** | |
| Other Hispanic | 0.18 (0.01)*** | 0.42 (0.01)*** | 0.11 (0.01)*** | 0.32 (0.02)*** | 0.57 (0.02)*** | 0.13 (0.02)*** | |
| Constant | − 1.98 (0.002)*** | − 4.53 (0.02)*** | − 3.36 (0.02)*** | − 3.12 (0.002)*** | − 3.11 (0.033)*** | − 1.59 (0.03)*** | |
| Pseudo R2 | 0.01 | 0.12 | 0.18 | 0.01 | 0.12 | 0.18 | |
| Group (reference) | Variable | Independent living disability |
Hearing disability |
||||
| Model 1 | Model 2 | Model 3 | Model 1 | Model 2 | Model 3 | ||
|
| |||||||
| White (W European) | E European | 0.04 (0.01)*** | − 0.01 (0.01) | 0.03 (0.01)*** | − 0.13 (0.01)*** | − 0.19 (0.01)*** | − 0.12 (0.01)*** |
| European, nec | − 0.31 (0.01)*** | − 0.05 (0.01)*** | 0.15 (0.01)*** | − 0.42 (0.01)*** | − 0.18 (0.01)*** | − 0.08 (0.01)*** | |
| N American | 0.30 (0.004)*** | 0.42 (0.004)*** | 0.19 (0.004)*** | 0.10 (0.004)*** | 0.20 (0.004)*** | 0.06 (0.004)*** | |
| MENA | 0.28 (0.01)*** | 0.51 (0.02)*** | 0.52 (0.02)*** | − 0.46 (0.02)*** | − 0.34 (0.02)*** | − 0.12 (0.02)*** | |
| Other White | 0.51 (0.003)*** | 0.50 (0.004)*** | 0.20 (0.004)*** | 0.14 (0.004)*** | 0.11 (0.004)*** | − 0.04 (0.004)*** | |
| Black | N American | 0.50 (0.004)*** | 0.81 (0.004)*** | 0.20 (0.01)*** | − 0.53 (0.01)*** | − 0.27 (0.01)*** | − 0.55 (0.01)*** |
| African | − 0.05 (0.02)** | 0.45 (0.02)*** | 0.10 (0.02)*** | − 1.00 (0.03)*** | − 0.51 (0.03)*** | − 0.55 (0.03)*** | |
| West Indian | − 0.19 (0.02)*** | 0.08 (0.02)*** | − 0.10 (0.02)*** | − 1.16 (0.03)*** | − 0.88 (0.03)*** | − 0.69 (0.03)*** | |
| C/S American | − 0.26 (0.07)*** | 0.003 (0.07) | 0.04 (0.07) | − 1.41 (0.12)*** | − 1.13 (0.12)*** | − 0.80 (0.12)*** | |
| European | 0.57 (0.04)*** | 0.84 (0.04)*** | 0.32 (0.04)*** | − 0.27 (0.05)*** | − 0.02 (0.05) | − 0.22 (0.05)*** | |
| Other Black | 0.57 (0.01)*** | 0.78 (0.01)*** | 0.10 (0.01)*** | − 0.33 (0.01)*** | − 0.18 (0.01)*** | − 0.47 (0.01)*** | |
| Asian | Chinese | − 0.26 (0.01)*** | − 0.11 (0.01)*** | − 0.23 (0.02)*** | − 0.77 (0.02)*** | − 0.64 (0.02)*** | − 0.41 (0.02)*** |
| Filipino | − 0.12 (0.01)*** | 0.10 (0.01)*** | 0.47 (0.02)*** | − 0.61 (0.02)*** | − 0.34 (0.02)*** | 0.09 (0.02)*** | |
| Asian Indian | − 0.36 (0.02)*** | 0.07 (0.02)*** | 0.50 (0.02)*** | − 1.08 (0.03)*** | − 0.71 (0.03)*** | − 0.24 (0.03)*** | |
| Vietnamese | − 0.05 (0.02)*** | 0.33 (0.02)*** | − 0.08 (0.02)*** | − 0.67 (0.02)*** | − 0.31 (0.03)*** | − 0.24 (0.03)*** | |
| Korean | − 0.42 (0.02)*** | − 0.19 (0.02)*** | − 0.20 (0.03)*** | − 1.02 (0.03)*** | − 0.75 (0.03)*** | − 0.47 (0.03)*** | |
| Japanese | 0.09 (0.02)*** | − 0.22 (0.02)*** | − 0.033 (0.02) | − 0.12 (0.02)*** | − 0.33 (0.02)*** | − 0.14 (0.02)*** | |
| Other Asian | 0.02 (0.02) | 0.47 (0.02)*** | 0.31 (0.03)*** | − 0.61 (0.02)*** | − 0.16 (0.02)*** | −0.01 (0.02) | |
| Hispanic | Mexican | − 0.09 (0.01)*** | 0.34 (0.01)*** | − 0.15 (0.01)*** | − 0.41 (0.01)*** | 0.04 (0.02)*** | − 0.08 (0.01)*** |
| Puerto Rican | 0.45 (0.01)*** | 0.82 (0.01)*** | 0.04 (0.01)** | − 0.38 (0.02)*** | − 0.05 (0.02)** | − 0.40 (0.02)*** | |
| Cuban | 0.33 (0.01)*** | 0.32 (0.02)*** | − 0.12 (0.02)*** | − 0.43 (0.02)*** | − 0.50 (0.02)*** | − 0.50 (0.02)*** | |
| Central American | − 0.51 (0.02)*** | − 0.01 (0.02) | − 0.42 (0.02)*** | − 1.09 (0.02)*** | − 0.50 (0.03)*** | − 0.43 (0.03)*** | |
| South American | − 0.53 (0.02)*** | − 0.20 (0.02)*** | − 0.32 (0.02)*** | − 0.95 (0.02)*** | − 0.58 (0.02)*** | − 0.37 (0.024)*** | |
| Other Hispanic | 0.22 (0.01)*** | 0.47 (0.01)*** | 0.004 (0.02) | − 0.19 (0.02)*** | 0.07 (0.02)*** | 0.003 (0.02) | |
| Constant | − 2.49 (0.002)*** | − 1.36 (0.03)*** | 0.09 (0.03)** | − 2.52 (0.002)*** | − 4.59 (0.03)*** | − 3.87 (0.04)*** | |
| Pseudo R2 | 0.01 | 0.14 | 0.21 | 0.01 | 0.15 | 0.16 | |
| Group (reference) | Variable | Vision disability |
Cognitive disability |
||||
| Model 1 | Model 2 | Model 3 | Model 1 | Model 2 | Model 3 | ||
|
| |||||||
| White (W Europe) | E European | − 0.08 (0.01)*** | − 0.12 (0.01)*** | − 0.07 (0.01)*** | − 0.07 (0.01)*** | − 0.11 (0.01)*** | − 0.05 (0.01)*** |
| European, nec | − 0.37 (0.02)*** | − 0.18 (0.02)*** | − 0.04 (0.02) | − 0.22 (0.02)*** | − 0.06 (0.02)*** | 0.15 (0.02)*** | |
| N American | 0.31 (0.01)*** | 0.37 (0.01)*** | 0.14 (0.01)*** | 0.39 (0.004)*** | 0.45 (0.004)*** | 0.20 (0.004)*** | |
| MENA | − 0.05 (0.03)* | 0.08 (0.03)** | 0.08 (0.03)** | 0.14 (0.02)*** | 0.24 (0.02)*** | 0.31 (0.02)*** | |
| Other White | 0.38 (0.01)*** | 0.34 (0.01)*** | 0.07 (0.01)*** | 0.61 (0.004)*** | 0.58 (0.004)*** | 0.26 (0.004)*** | |
| Black | N American | 0.61 (0.01)*** | 0.82 (0.01)*** | 0.30 (0.01)*** | 0.59 (0.01)*** | 0.75 (0.01)*** | 0.05 (0.01)*** |
| African | 0.20 (0.02)*** | 0.57 (0.02)*** | 0.26 (0.03)*** | 0.06 (0.02)** | 0.32 (0.02)*** | −0.05 (0.02)* | |
| West Indian | 0.13 (0.02)*** | 0.35 (0.02)*** | 0.19 (0.03)*** | − 0.20 (0.02)*** | − 0.04 (0.02)* | − 0.16 (0.02)*** | |
| C/S American | − 0.06 (0.10) | 0.16 (0.10) | 0.22 (0.11)* | − 0.36 (0.09)*** | − 0.20 (0.09)* | − 0.12 (0.09) | |
| European | 0.87 (0.04)*** | 1.05 (0.04)*** | 0.61 (0.05)*** | 0.77 (0.04)*** | 0.91 (0.04)*** | 0.34 (0.04)*** | |
| Other Black | 0.68 (0.01)*** | 0.81 (0.01)*** | 0.24 (0.01)*** | 0.69 (0.01)*** | 0.80 (0.01)*** | 0.03 (0.01)** | |
| Asian | Chinese | − 0.45 (0.02)*** | − 0.32 (0.02)*** | − 0.37 (0.02)*** | − 0.45 (0.02)*** | − 0.36 (0.02)*** | − 0.37 (0.02)*** |
| Filipino | − 0.31 (0.02)*** | − 0.14 (0.02)*** | 0.17 (0.03)*** | −0.34 (0.02)*** | −0.21 (0.02)*** | 0.24 (0.02)*** | |
| Asian Indian | − 0.58 (0.03)*** | −0.27 (0.03)*** | 0.05 (0.03) | − 0.61 (0.02)*** | − 0.38 (0.02)*** | 0.20 (0.03)*** | |
| Vietnamese | − 0.14 (0.03)*** | 0.13 (0.03)*** | − 0.17 (0.03)*** | 0.11 (0.02)*** | 0.32 (0.02)*** | 0.02 (0.02) | |
| Korean | − 0.51 (0.04)*** | − 0.31 (0.04)*** | − 0.30 (0.04)*** | − 0.50 (0.03)*** | − 0.35 (0.03)*** | − 0.20 (0.03)*** | |
| Japanese | − 0.16 (0.03)*** | − 0.35 (0.03)*** | − 0.15 (0.03)*** | 0.04 (0.02) | − 0.13 (0.02)*** | 0.13 (0.03)*** | |
| Other Asian | − 0.02 (0.03) | 0.30 (0.03)*** | 0.18 (0.03)*** | 0.10 (0.02)*** | 0.34 (0.02)*** | 0.25 (0.02)*** | |
| Hispanic | Mexican | 0.33 (0.01)*** | 0.66 (0.01)*** | 0.19 (0.01) *** | − 0.01 (0.01)* | 0.21 (0.01)*** | − 0.23 (0.01)*** |
| Puerto Rican | 0.61 (0.02)*** | 0.87 (0.02)*** | 0.28 (0.02) *** | 0.70 (0.01)*** | 0.90 (0.01)*** | 0.07 (0.01)*** | |
| Cuban | 0.34 (0.02)*** | 0.32 (0.02)*** | − 0.09 (0.02) *** | 0.49 (0.02)*** | 0.48 (0.02)*** | 0.15 (0.02)*** | |
| Central American | − 0.01 (0.02) | 0.39 (0.02)*** | − 0.004 (0.02) | − 0.44 (0.02)*** | − 0.16 (0.02)*** | − 0.483 (0.02)*** | |
| South American | − 0.16 (0.02)*** | 0.11 (0.02)*** | − 0.02 (0.03) | − 0.42 (0.02)*** | − 0.23 (0.02)*** | − 0.22 (0.02)*** | |
| Other Hispanic | 0.49 (0.02)*** | 0.68 (0.02)*** | 0.32 (0.02) *** | 0.40 (0.01)*** | 0.54 (0.01)*** | 0.09 (0.02)*** | |
| Constant | − 3.37 (0.003)*** | − 3.77 (0.04)*** | − 3.03 (0.04) *** | − 2.82 (0.002)*** | − 0.41 (0.03)*** | 0.73 (0.03)*** | |
| Pseudo R2 | 0.001 | 0.07 | 0.12 | 0.01 | 0.06 | 0.15 | |
Model 2 adjusts for age, age squared, and sex
Model 3 adds marital status, health insurance, poverty, education, English proficiency, citizenship status, region, and survey year
W Western, E Eastern, N North, C/S Central and Southern, nec not elsewhere classified, NM never married, HS high school
p<0.05;
p<0.01;
p<0.001
Figure 3 shows a considerable amount of overlap in coefficients for racial subgroups to an extent that it is difficult to make many statements regarding between-race differences in the outcomes. For example, in the upper plot, the largest coefficients for the physical difficulty outcome are for Black subgroups, but coefficients for half of the Black subgroups are smaller than that for the reference group and for those of several other White subgroups. Overall, the plot in the upper half of the figure shows greater within-race differences than between-race differences. The spread of the coefficients, both within and between racial groups, is narrower in the lower plot, indicating that much of the heterogeneity between racial subgroups and between larger racial groups is explained by demographic and socioeconomic disparities within and between groups. Some typical patterns seem apparent, however. For example, coefficients for Asian and Hispanic subgroups tend to fall below the reference line, while coefficients for Black subgroups tend to fall above the reference line for most outcomes. Yet, what is most notable even in the bottom half of the figure is that the spread of coefficients for the racial subgroups within the larger racial groups tends to be more apparent than any differences between the larger groups. Importantly, the spread of coefficients for White ancestry groups appears to be sizeable, even in comparison to the spread of coefficients for other racial subgroups.
Figure 4 presents the results of Fig. 3 as odds ratios, rather than logit coefficients, and restricts the display to White ancestry groups only. The figure shows the relative odds of each White ancestry group reporting having each poor health outcome relative to western Europeans. The most striking finding in the figure is the degree of diversity among White subgroups across the disability outcomes. Relative to western Europeans (denoted by the vertical line representing an odds ratio of 1), MENA, North American, and Whites of other origins consistently report much higher odds of disability for conditions that impact activities of daily living (e.g., bathing, dressing, mobility, etc.). For the self-care outcome, for example, persons from MENA evidence 50% greater odds of disability than western Europeans. In contrast, members of the same ancestry group experience roughly 80% of the odds of western Europeans for hearing impairment. Thus, in general, the figure reveals not only a considerable amount of heterogeneity among the White ancestry groups but also considerable differential heterogeneity with respect to the health outcomes investigated. The results suggest that ignoring heterogeneity within the White population and focusing attention on a single health outcome obscures considerable variation in the health experience of Whites.
Fig. 4.
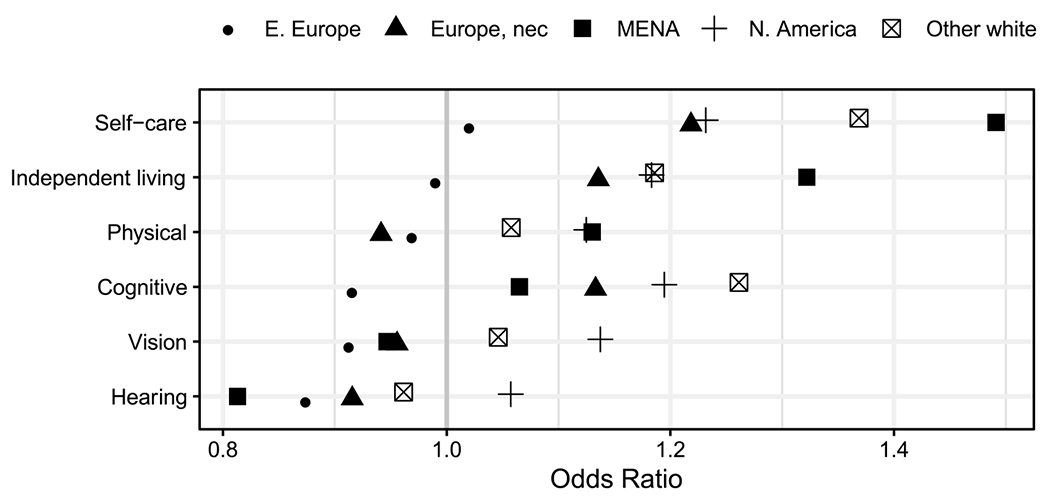
Odds ratios from logit models for six health outcomes among non-Hispanic White groups, ages 40+: American Community Survey (2008–2016)
Discussion and Conclusion
Research on U.S. health disparities has historically relied on Whites as a reference group to measure inequities in well-being between the majority population and racial and ethnic minorities. This is true both in comparisons between Whites and other broad racial/ethnic groups (e.g., Blacks, Hispanics) and in more recent work that has focused on disaggregating heterogeneity within non-White groups (e.g., native-and foreign-born Blacks). Such a strategy ignores several important demographic shifts that make the practice of using Whites as a reference group increasingly problematic. Whites are projected to be in the minority by 2040, which begs the question of appropriate reference category in studies of population health, particularly if health policies are driven by numerically larger minority groups (Coleman 2006; Lichter 2013). The ethnic composition of Whites has also changed dramatically since the 1965 Immigration and Nationality Act and is less monolithic than typically assumed. Thus, examining Whites in the aggregate may mask health inequities not only among them, but also between Whites and other racial/ethnic populations.
This study examined this possibility by comparing heterogeneity in health among Whites relative to other broad racial/ethnic groups and assessing the extent of internal diversity among White ancestry groups. The results challenge the oft-assumed notion that Whites are a homogeneous group. In fact, when Whites were disaggregated by ancestry, mean health appears to be more varied among Whites than between Whites and members of other racial/ethnic groups in many cases. The degree of variability in disability within the White ancestry groups was likewise striking and provides further evidence that the aggregate White category is inadequate for capturing the health profiles of individuals classified as White.
White ancestry groups were also compositionally different in terms of factors known to affect health. Some groups were socioeconomically disadvantaged, while others had high levels of educational attainment and low rates of poverty; some were predominantly composed of U.S.-born citizens with high levels of English language proficiency, while others had more mixed acculturation profiles. The North American, MENA and other White categories were among the most socioeconomically disadvantaged: they had the lowest rates of high school completion, highest rates of poverty, and lowest rates of insurance coverage. In contrast, the western, eastern, and other European categories had higher rates of college completion and lower rates of poverty. Most of the White ancestry groups were composed of U.S.-born citizens, with the exception of eastern Europeans and persons from MENA. A greater proportion of persons from MENA also lacked U.S. citizenship and were limited in English language proficiency. These differences, alone, suggest that characterizing Whites as a monolithic group misses the complexities that exist among them.
The current study is not without limitations. First, there are very few nationally representative datasets that contain information on ethnic diversity among Whites, which limits the potential sources for data disaggregation to the decennial Census, and more recently, the ACS (Read 2013). The ACS includes information on ancestry and nativity, which provides an opportunity to examine ethnic heterogeneity among Whites. However, it does not include information on parents’ ancestry, and thus is limited in terms of analyzing intergenerational change. Second, using U.S. Census data limits the focus of any health-related analyses to measures of disability. It would be informative to see if other outcomes commonly studied in research on race/ethnicity and ancestry, such as self-rated health (Read and Reynolds 2012), operate similarly to disability.
Despite these limitations, our findings call attention to the importance of disaggregating data within a group that is often overlooked in a growing literature on intra-ethnic inequality. The standard and accepted approach in research and policy is to treat Whites in the aggregate, and typically as the reference group to which others are compared. Yet, we found that Whites are far from monolithic, probably in part because they are increasingly composed of immigrants of non-European descent (Read and Reynolds 2012; Waters and Pineau 2015). As such, they represent a group whose health profile deserves greater attention, particularly in light of studies documenting health disparities among groups classified as White, such as Russians and persons from the MENA region (Dallo and Kindratt 2015; Reynolds et al. 2016). Notably, nearly three-fourths of persons reporting a MENA ancestry in our study were immigrants, which has further implications for disability given the conflict and instability in many countries in the sending region.
Progress in disaggregating Whites has been hindered by data limitations because few large-scale data sources contain measures that allow for disaggregation of White ethnic subgroups. Those that do can pose methodological challenges due to small sample sizes and data restrictions. However, there are opportunities that could be better exploited. For example, a growing number of datasets include information on nativity that could be used to disaggregate foreign- and native-born Whites. At minimum, this would help address differences in the White population that is due to migration from non-western European origins. Identifying these and other opportunities will be paramount for improving our understanding of U.S. population health, particularly if the White population continues to diversify in the coming years. The practice of using Whites as the reference group was borne in an era of greater homogeneity in the aggregate category (i.e., mainly western European). Future research should reflect the fact that this may no longer be the case. Indeed, understanding sources of health disparities within broad racial categories—including among Whites—may be of greater utility than measuring gaps between them.
Supplementary Material
Footnotes
Supplementary Information The online version contains supplementary material available at https://doi.org/10.1007/s11113-020-09632-5.
The U.S. Census defines Arabs as persons who trace their ancestry to one of the following 16 countries in the Middle East and North Africa (MENA): Algeria, Bahrain, Egypt, Iraq, Jordan, Kuwait, Lebanon, Libya, Morocco, Oman, Qatar, Saudi Arabia, Syria, Tunisia, United Arab Emirates, and Yemen.
While the ACS includes ancestry variables for respondents’ first and second ancestry responses, we only use the first response in our analyses given the large percentage of unreported ancestries for the second response. In tabulations not shown, 13.55% of respondents do not report a first ancestry, whereas 69.90% of respondents do not report a second ancestry.
Location not specified. Some respondents may be of western or eastern European descent.
References
- AHRQ. (2015). National Healthcare Quality and Disparities Report. Agency for Healthcare Research and Quality: U.S. Department of Health and Human Services. http://www.ahrq.gov/research/findings/nhqrdr/index.html. [Google Scholar]
- Ajrouch KJ, Zahodne LB, & Antonucci TC (2017). Arab American cognitive aging: Opportunities for advancing research on Alzheimer’s disease disparities. Innovation in Aging, 1(3), igx034. [DOI] [PMC free article] [PubMed] [Google Scholar]
- Akresh IR, & Frank R (2008). Health selection among new immigrants. American Journal of Public Health, 98(11), 2058–2064. [DOI] [PMC free article] [PubMed] [Google Scholar]
- Almeida J, Biello KB, Pedraza F, Wintner S, & Viruell-Fuentes E (2016). The association between anti-immigrant policies and perceived discrimination among Latinos in the US: A multilevel analysis. Social Science & Medicine-Population Health, 2, 897–903. [DOI] [PMC free article] [PubMed] [Google Scholar]
- Altman BM, Madans J, & Weeks JD (2017). An evaluation of the American Community Survey indicators of disability. Disability and Health Journal, 10(4), 485–491. [DOI] [PMC free article] [PubMed] [Google Scholar]
- Ameri M, Schur L, Adya M, Bentley S, McKay P, & Kruse D (2017). The disability employment puzzle: A field experiment on employer hiring behavior. ILR Review, 71(2), 329–364. [Google Scholar]
- Bakalian A, & Bozorgmehr M (2009). Backlash 9/11: Middle Eastern and Muslim Americans Respond. Berkeley and Los Angeles: University of California Press. [Google Scholar]
- Bergmans R, Soliman AS, Ruterbusch J, Meza R, Hirko K, Graff J, & Schwartz K (2014). Cancer incidence among Arab Americans in California, Detroit, and New Jersey Seer Registries. American Journal of Public Health, 104(6), e83–e91. [DOI] [PMC free article] [PubMed] [Google Scholar]
- Brown TH (2018). Racial stratification, immigration, and health inequality: A life course-intersectional approach. Social Forces, 96(4), 1507–1540 [Google Scholar]
- Brown SD, Ehrlich SF, Kubo A, Tsai A-L, Hedderson MM, Quesenberry CP Jr., & Ferrara A (2016). Lifestyle behaviors and ethnic identity among diverse women at high risk for type 2 diabetes. Social Science & Medicine, 160, 87–93. [DOI] [PMC free article] [PubMed] [Google Scholar]
- Coleman D (2006). Immigration and ethnic change in low-fertility countries: A third demographic transition. Population and Development Review, 32(3), 401–446. [Google Scholar]
- Cook WK, Tseng W, Tam C, John I, & Lui C (2017). Ethnic-group socioeconomic status as an indicator of community-level disadvantage: A study of overweight/obesity in Asian American adolescents. Social Science & Medicine, 184, 15–22. [DOI] [PMC free article] [PubMed] [Google Scholar]
- Dallo FJ, & Kindratt TB (2015). Disparities in vaccinations and cancer screening among U.S.- and foreign-born Arab and European American non-Hispanic White Women. Women’s Health Issues, 25(1), 56–62. [DOI] [PubMed] [Google Scholar]
- Dallo FJ, & Kindratt TB (2016). Disparities in chronic disease prevalence among non-Hispanic Whites: Heterogeneity among foreign-born Arab and European Americans. Journal of Racial and Ethnic Health Disparities, 3(4), 590–598. [DOI] [PubMed] [Google Scholar]
- Dallo FJ, Snih SA, & Ajrouch KJ (2009). Prevalence of disability among US- and foreign-born Arab Americans: Results from the 2000 US Census. Gerontology, 55(2), 153–161. [DOI] [PubMed] [Google Scholar]
- Dallo FJ, Booza J, & Nguyen ND (2015). Functional limitations and nativity status among older Arab, Asian, Black, Hispanic, and White Americans. Journal of Immigrant and Minority Health, 17(2), 535–542. [DOI] [PMC free article] [PubMed] [Google Scholar]
- de la Cruz GP, & Brittingham A (2003). The Arab population: 2000—Census 2000 brief. Washington, D.C.: U.S. Department of Commerce, Economics and Statistics Administration. https://www.census.gov/prod/2003pubs/c2kbr-23.pdf. [Google Scholar]
- Elo IT, Mehta NK, & Huang C (2011). Disability among native-born and foreign-born Blacks in the United States. Demography, 48(1), 241–265. [DOI] [PMC free article] [PubMed] [Google Scholar]
- Erickson W, Lee CG, & Von Schrader S (2018). 2016 Disability status report: United States. Vol. Ithaca, NY: Cornell University Yang Tan Institute on Employment and Disability. [Google Scholar]
- Farley R (1991). The new census question about ancestry: What did it tell us? Demography, 28(3), 411–429. [PubMed] [Google Scholar]
- Fenelon A, Chinn JJ, & Anderson RN (2017). A comprehensive analysis of the mortality experience of Hispanic subgroups in the United States: Variation by age, country of origin, and nativity. Social Science & Medicine-Population Health, 3, 245–254. [DOI] [PMC free article] [PubMed] [Google Scholar]
- Fuller-Thomson E, Brennenstuhl S, & Hurd M (2011). Comparison of disability rates among older adults in aggregated and separate Asian American/Pacific Islander subpopulations. American Journal of Public Health, 101(1), 94–100. [DOI] [PMC free article] [PubMed] [Google Scholar]
- Gee GC, & Ponce N (2010). Associations between racial discrimination, limited English proficiency, and health-related quality of life among 6 Asian ethnic groups in California. American Journal of Public Health, 100(5), 888–895. [DOI] [PMC free article] [PubMed] [Google Scholar]
- Green SE, Davis C, Karshmer E, Marsh P, & Straight B (2005). Living stigma: The impact of labeling, stereotyping, separation, status loss, and discrimination in the lives of individuals with disabilities and their families. Sociological Inquiry, 75(2), 197–215. [Google Scholar]
- Hamilton TG (2014). Selection, language heritage, and the earnings trajectories of Black immigrants in the United States. Demography, 51(3), 975–1002. [DOI] [PMC free article] [PubMed] [Google Scholar]
- Hamilton TG, & Hummer RA (2011). Immigration and the health of U.S. Black adults: Does country of origin matter? Social Science & Medicine, 73(10), 1551–1560. [DOI] [PubMed] [Google Scholar]
- Hamilton TG, & Green TL (2017). Intergenerational differences in smoking among West Indian, Haitian, Latin American, and African Blacks in the United States. Social Science & Medicine-Population Health, 3, 305–317. [DOI] [PMC free article] [PubMed] [Google Scholar]
- Hendi AS, Mehta NK, & Elo IT (2015). Health among Black children by maternal and child nativity. American Journal of Public Health, 105(4), 703–710. [DOI] [PMC free article] [PubMed] [Google Scholar]
- Hixson L, Hepler BB, & Kim MO (2011) The White population: 2010—2010 Census briefs. Washington, D.C.: US Department of Commerce, Economics and Statistics Administration. http://www.census.gov/prod/cen2010/briefs/c2010br-05.pdf. [Google Scholar]
- Jamal AA, & Naber NC (2008). Race and Arab Americans before and after 9/11: From invisible citizens to visible subjects. Syracuse, NY: Syracuse University Press Inc. [Google Scholar]
- Killewald A, & Bryan B (2018). Falling behind: The role of inter- and intragenerational processes in widening racial and ethnic wealth gaps through early and middle adulthood. Social Forces, 97(2), 705–740. [Google Scholar]
- Levy BS, & Sidel VW (2013). Adverse health consequences of the Iraq War. The Lancet, 381(9870), 949–958. [DOI] [PubMed] [Google Scholar]
- Lichter DT (2013). Integration or fragmentation? Racial diversity and the American future. Demography, 50(2), 359–391. [DOI] [PubMed] [Google Scholar]
- Lippert AM, & Damaske S (2018). Finding jobs, forming families, and stressing out? Work, family, and stress among young adult women in the United States. Social Forces, 98(2), 885–914. [DOI] [PMC free article] [PubMed] [Google Scholar]
- Malat J, Mayorga-Gallo S, & Williams DR (2018). The effects of whiteness on the health of whites in the USA. Social Science & Medicine, 199, 148–156. [DOI] [PubMed] [Google Scholar]
- Martin LG, & Schoeni RF (2014). Trends in disability and related chronic conditions among the forty-and-over population: 1997–2010. Disability and Health Journal, 7(1 Suppl), S4–S14. [DOI] [PMC free article] [PubMed] [Google Scholar]
- Mehta NK, & Elo IT (2012). Migrant selection and the health of U.S. immigrants from the Former Soviet Union. Demography, 49(2), 425–447. [DOI] [PMC free article] [PubMed] [Google Scholar]
- Murillo R, Echeverria S, & Vasquez E (2016). Differences in neighborhood social cohesion and aerobic physical activity by Latino subgroup. Social Science & Medicine-Population Health, 2, 536–541. [DOI] [PMC free article] [PubMed] [Google Scholar]
- Office of Management and Budget. (1997). Revisions to the standards for the classification of federal data on race and ethnicity. Washington, D.C.: Executive Office of the President, Office of Management and Budget (OMB), Office of Information and Regulatory Affairs. https://obamawhitehouse.archives.gov/omb/fedreg_1997standards. [Google Scholar]
- Olshansky SJ, Antonucci T, Berkman L, Binstock RH, Boersch-Supan A, Cacioppo JT, et al. (2012). Differences in life expectancy due to race and educational differences are widening, and many may not catch up. Health Affairs, 31(8), 1803–1813. [DOI] [PubMed] [Google Scholar]
- Read JG (2013). Measuring ethnicity with U.S. Census data: Implications for Mexicans and Arabs. Population Research and Policy Review, 32(4), 611–631. [Google Scholar]
- Read JG, & Gorman BK (2006). Gender inequalities in US adult health: The interplay of race and ethnicity. Social Science & Medicine, 62(5), 1045–1065. [DOI] [PubMed] [Google Scholar]
- Read JG, & Reynolds MM (2012). Gender differences in immigrant health: The case of Mexican and Middle Eastern immigrants. Journal of Health and Social Behavior, 53(1), 99–123. [DOI] [PubMed] [Google Scholar]
- Read JG, Ajrouch KJ, & West JS (2019). Disparities in functional disability among Arab Americans by nativity, immigrant arrival cohort, and country of birth. SSM-Population Health, 7, 100325. [DOI] [PMC free article] [PubMed] [Google Scholar]
- Read JG, West JS, & Kamis C (2020). Immigration and health among non-Hispanic Whites: The impact of arrival cohort and region of birth. Social Science & Medicine, 246, 112754. [DOI] [PubMed] [Google Scholar]
- Reynolds MM, Chernenko A, & Read JG (2016). Region of origin diversity in immigrant health: Moving beyond the Mexican case. Social Science & Medicine, 166, 102–109. [DOI] [PMC free article] [PubMed] [Google Scholar]
- Ro A, Geronimus A, Bound J, Griffith D, & Gee G (2015). Cohort and duration patterns among Asian immigrants: Comparing trends in obesity and self-rated health. Biodemography and Social Biology, 61(1), 65–80. [DOI] [PMC free article] [PubMed] [Google Scholar]
- Rogers RG, Hummer RA, & Nam CB (2000). Living and dying in the USA: Behavioral health, and social differentials in adult mortality. San Diego, CA: Academic Press. [Google Scholar]
- Steven R, Genadek K, Goeken R, Grover J, & Sobek M (2017) Integrated public use microdata series: Version 7.0 [American Community Survey, 2008–2016]. Minneapolis: University of Minnesota. [Google Scholar]
- Shandra CL (2018). Disability as inequality: Social disparities, health disparities, and participation in daily activities. Social Forces, 97(1), 157–192. [Google Scholar]
- Silva F (2018). The Strength of Whites’ Ties: How employers reward the referrals of Black and White jobseekers. Social Forces, 97(2), 741–768. [Google Scholar]
- U.S. Census Bureau. (2015). 5-Year American Community Survey (ACS) 2011–2015. https://factfinder.census.gov/faces/tableservices/jsf/pages/productview.xhtml?pid=ACS_15_5YR_DP02&src=pt.
- Vega WA, & Amaro H (1994). Latino outlook: Good health, uncertain prognosis. Annual Review of Public Health, 15, 39–67. [DOI] [PubMed] [Google Scholar]
- Verissimo AD, Otiniano CE, Grella HA, & Gee GC (2014). Discrimination and substance use disorders among Latinos: The role of gender, nativity, and ethnicity. American Journal of Public Health, 104(8), 1421–1428. [DOI] [PMC free article] [PubMed] [Google Scholar]
- Vierboom YC, Preston SH, & Hendi AS (2019). Rising geographic inequality in mortality in the United States. SSM-Population Health, 9, 100478–100578. [DOI] [PMC free article] [PubMed] [Google Scholar]
- Waters MC, & Pineau MG (Eds.). (2015). The integration of immigrants into American Society. Washington, D.C.: National Academies Press. [Google Scholar]
- Yi SS, Kwon SC, Sacks R, & Trinh-Shevrin C (2016). Commentary: Persistence and health-related consequences of the model minority stereotype for Asian Americans. Ethnicity and Disease, 26(1), 133–138. [DOI] [PMC free article] [PubMed] [Google Scholar]
Associated Data
This section collects any data citations, data availability statements, or supplementary materials included in this article.