

Abstract
The RNA-binding protein FUS mediates phase separation in biomolecular condensates and functions in transcription by clustering with RNA polymerase II. Specific contact residues and interactions modes formed by FUS and the C-terminal heptad repeats of RNA polymerase II (CTD) have been suggested but not probed directly. Here, we show how RGG domains contribute to phase separation with the FUS N-terminal low complexity domain (SYGQ LC) and RNA polymerase II CTD. Using NMR spectroscopy and molecular simulations, we demonstrate that many residue types, not solely arginine-tyrosine pairs, form condensed-phase contacts via several interaction modes including but not only sp2/π and cation-π interactions. In phases also containing RNA polymerase II CTD, many residue types form contacts, including both cation-π and hydrogen-bonding interactions formed by the conserved human CTD lysines. Hence, our data suggest a surprisingly broad array of residue types and modes explain co-phase separation of FUS and RNA polymerase II.
Introduction
The nucleus contains several membraneless organelles, including the nucleolus, heterochromatin, and transcriptional condensates, that form via phase separation of their protein and nucleic acid constituents1–7. Found in nuclear and cytoplasmic condensates, Fused in Sarcoma (FUS) is an RNA-binding protein with roles in RNA metabolism including transcription. FUS is among the FET (FUS, EWS, TAF15) family of proteins that have overlapping functions in RNA processing8–10 and has a multi-domain architecture that facilitates self-association and RNA-binding11–13 – a disordered N-terminal domain of low complexity sequence enriched in serine, tyrosine, glycine, and glutamine residues (SYGQ LC), two folded domains, an RNA recognition motif (RRM) and a zinc-finger, and three arginine-glycine-glycine rich (RGG) domains (Fig. 1A).
Figure 1. Domains outside of the SYGQ-rich low complexity domain contribute to FUS LLPS.
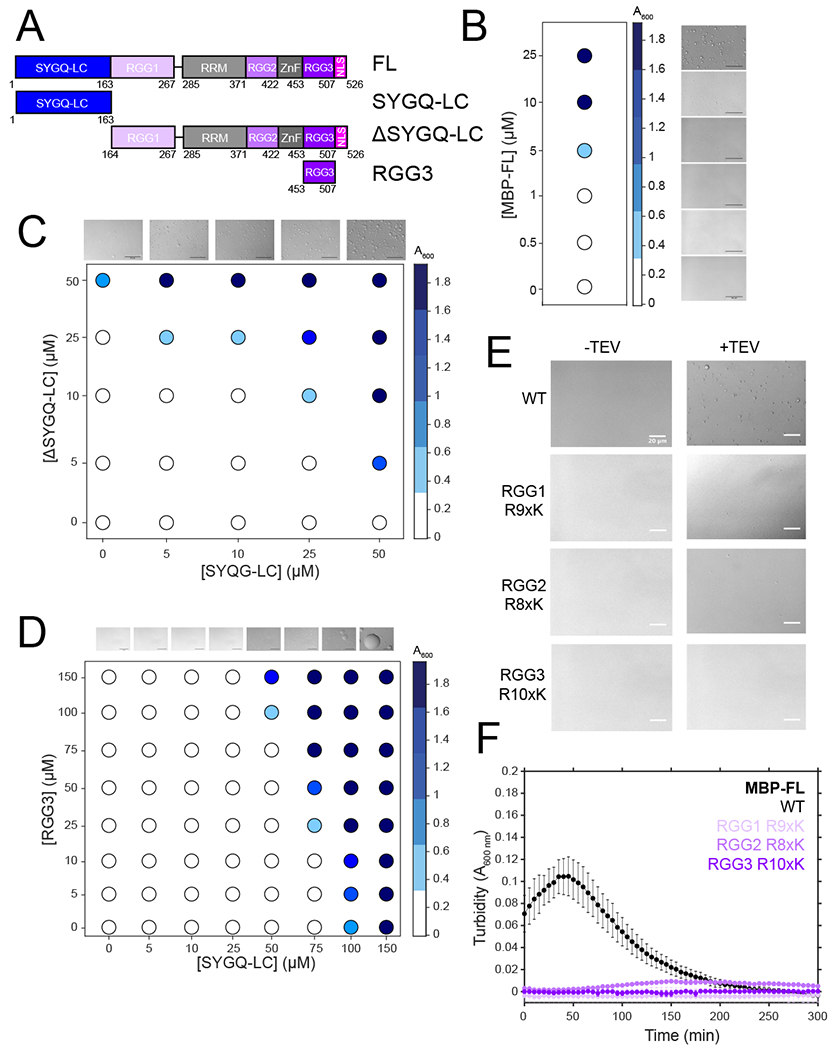
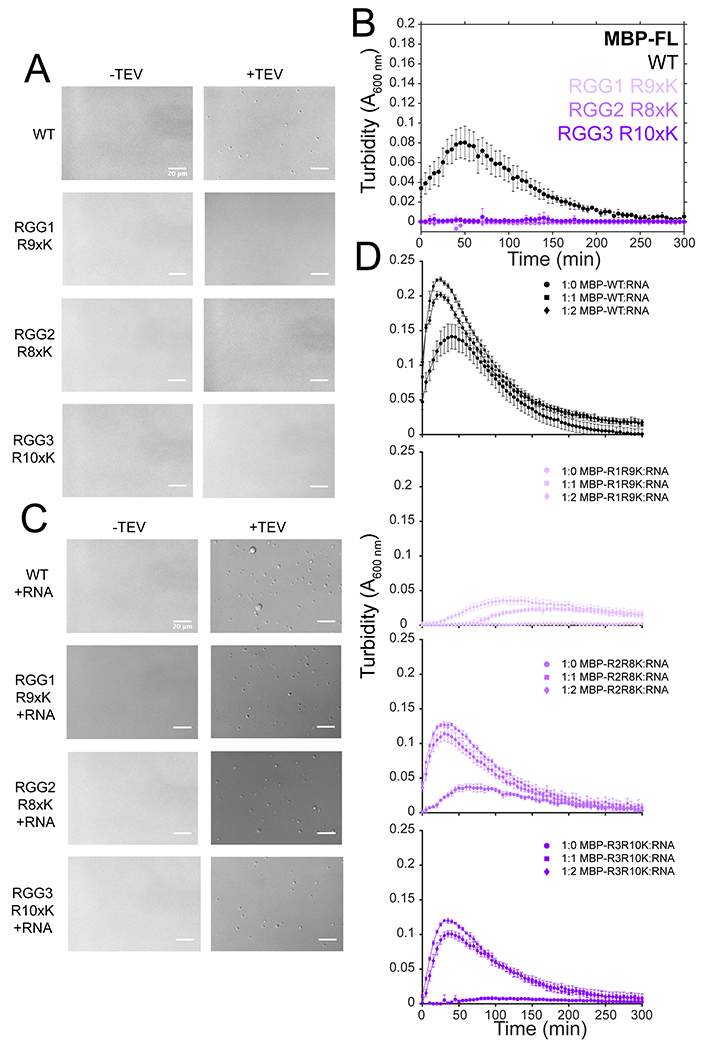
A) Domain architecture of FUS and constructs used in this study. B) Turbidity of varying concentrations of MBP-FUS FL after cleavage of the N-terminal MBP solubility tag by addition of TEV protease, with corresponding DIC micrographs. Scale bars are 50 μm. C) Turbidity of varying concentrations of FUS SYGQ LC and ΔLC with micrographs corresponding to the top row. Filled in circles indicated the presence of turbidity. Scale bar= 50 μm. Data shown are from a single representative dataset. D) Turbidity of varying concentrations of FUS SYGQ LC and RGG3 with micrographs corresponding to the top row. Scale bar=50 μm. Data shown are from a single representative dataset. E) DIC micrographs of 5 μM MBP-FUS FL WT, RGG1 R9xK, RGG2 R8xK, and RGG3 R10xK in the presence and absence of TEV protease in the presence of 150 mM sodium chloride. Scale bars are 20 μm. F) Turbidity of 5 μM MBP-FUS FL WT, RGG1 R9xK, RGG2 R8xK, and RGG3 R10xK in the presence of 150 mM sodium chloride over time. Samples lacking TEV protease were used as blank values. Data are plotted as mean ± s.d. of measurements from n=3 replicates in one representative data set out of three independent experiments. For all micrographs in this figure:data shown are from one representative dataset of two independent assays.
The SYGQ LC domain mediates FUS self-assembly into liquid-like granules, hydrogels, and solid aggregates14–18. Previously, we used solution-state NMR combined with molecular simulation and found contacts stabilizing liquid-liquid phase separation (LLPS) of SYGQ LC involve interactions between all enriched residue types via diverse interaction modes such as hydrophobic, hydrogen bonding, and sp2/π19. Importantly, aromatic residue repeat number and spacing (i.e. the lack of adjacent aromatic residues) are essential determinants of phase separation and aggregation propensity. Solution NMR also showed contacts between aromatic-containing short motifs that have been demonstrated in the dispersed phase (before phase separation) of a related protein20. Aromatic repeats in FUS LC also form contacts with nuclear import proteins like karyopherin β2, which may help prevent FUS aggregation21. Containing distinct SYGQ LC and RGG domains, the contribution of LC/RGG interactions and specifically the contribution of tyrosine and arginine contacts to FUS LLPS and aggregation have been established12,17,22–25,26. However, the molecular details have not been investigated in detail by direct observation of the contacts in condensed phases. NMR has proved a useful tool to evaluate contacts in the Phe/Arg-rich intrinsically disordered N-terminal region of the related germ-granule protein Ddx427. Importantly, nuclear Overhauser experiments (NOE) show that contacts between many other residue pairs (not limited to Phe/Arg) are present within Ddx4 disordered domain condensed phases. Furthermore, the shifts in the phase diagrams of Ddx4 and LAF-1 RGG and an engineered variant of hnRNPA1 LC caused by charge residue scrambling suggest that interactions beyond aromatic-arginine contacts contribute to phase separation28,29. Hence, here we seek to probe the specific contacts between tyrosine, arginine, and the other residues found in the SYGQ LC and RGG domains in FUS LLPS.
FET proteins also regulate transcription. FUS is enriched at transcriptional start sites of thousands of genes and directly interacts with and recruits RNA polymerase II12,30,31. In rare leukemias and sarcomas, fusions of the SYGQ LC domain (and sometimes with addition of RGG1) of FUS to DNA-binding domains of certain transcription factors create potent transcriptional activators 32,33. Assembly of FUS into transcriptional condensates may be required for the clustering of RNA polymerase II4,12,34. Further, the disordered C-terminal tail of RNA polymerase II (RNA polymerase II CTD) is rich in aromatic/polar residues and readily incorporates into phase separated FUS in cells and biochemically14,31,35. Human RNA polymerase II CTD contains 52 heptapeptide repeats with the consensus sequence YSPTSPS and itself undergoes LLPS (with addition of crowding agents)36. Given the importance of LLPS to transcription and potentially to oncogenicity, an understanding of the interactions that contribute to FUS and RNA polymerase II co-partitioning could provide a molecular picture of transcriptional activation and hence may facilitate the development of therapies for FET-associated cancers.
Using direct observation of multi-component condensed phases by NMR spectroscopy, molecular dynamics simulations, and biophysical assays, we tested if a limited or broad set of domains (RGG1, RGG2, or RGG3), contacts (e.g. R and Y) and interaction modes (e.g. cation-π) contribute to full-length FUS LLPS and its co-partitioning with RNA polymerase II CTD. We characterized the intermolecular interactions of two model condensed phases: a two-component phase comprised of the SYGQ LC and RGG3 domains of FUS, and a three-component phase of RNA polymerase II CTD, FUS SYGQ LC, and FUS RGG3. We tested if co-LLPS of RNA polymerase II CTD with FUS requires either the SYQC LC or the RGG domains and the contribution of particular degenerate residues in RNA polymerase II CTD heptads (e.g. lysine) to these interactions. This work highlights the importance of weak, multivalent interactions involving diverse interaction modes that are likely common to many RNA-binding proteins.
Results
RGG domains contribute to FUS LLPS
Several studies suggested that both the SYGQ-rich and RGG domains of FUS contribute to LLPS23–26. We directly tested whether the RGG domains can enhance phase separation of the SYGQ LC, looking for the occurrence of LLPS at concentrations below the LLPS saturation concentration of each component. As a reference, we induced phase separation of full-length FUS by cleavage of an N-terminal maltose binding protein (MBP) solubility tag upon the addition of TEV protease14. At 5 μM, full-length FUS displays increased turbidity, triggered by cleavage of the N-terminal MBP-tag, corresponding to the formation of spherical droplets 19,37 (Fig. 1B). At these concentrations and conditions, neither SYGQ LC nor a construct lacking SYGQ LC (ΔSYGQ LC, Fig. 1A) undergoes LLPS, consistent with contributions from both regions. To test if mixtures of both constructs can enhance phase separation, we varied the concentrations of ΔSYGQ LC and SYGQ LC in trans. The addition of 5 μM ΔSYGQ LC to 50 μM SYGQ LC resulted in increased turbidity due to LLPS (Fig. 1C). Similarly, addition of 5 μM SYGQ LC to 25 μM ΔSYGQ LC resulted in increased turbidity. Although the mixing in trans does not recapitulate LLPS at concentrations similar to full-length (i.e. at 5 μM), these data suggest that the interactions between the SYGQ LC and domains within the ΔSYGQ LC make significant contributions to LLPS of full-length FUS14,23–26, though turbidity may quantitatively reflect differences in droplet size. To test if a single RGG domain is sufficient for stimulating LLPS of the SYGQ LC, we conducted a similar experiment but with the isolated FUS RGG3 domain (453-507) (Fig. 1D). Inclusion of RGG3 induced LLPS at concentrations below the saturation concentration of SYGQ LC alone, albeit not to the same extent as ΔSYGQ LC (Fig. 1D), presumably due to differences in the RGG sequence lengths. These data suggest that the RGG domains contribute to full-length FUS phase separation.
Next, we dissected the contribution of the different RGG domains to phase separation of full-length FUS (Fig. 1A). We mutated the arginines to lysine in RGG1 (164-267, R9xK), RGG2 (372-422, R8xK), or RGG3 (453-507, R10xK) within full-length FUS, as mutations of arginine-to-lysine have previously been shown to reduce phase separation of RGG peptides25,38. Compared to WT, each of the three full-length FUS variants containing arginine-to-lysine mutants displayed reduced droplet formation (Fig. 1E) and reduced turbidity (Fig. 1F). At high salt conditions (1 M NaCl), WT still shows robust phase separation, but LLPS of arginine-to-lysine mutants is further decreased (Extended Data Fig. 1A,B). Because arginine-to-lysine substitution of each of the three RGG domains has a drastic effect on LLPS, we tested if these arginine-to-lysine mutants were competent for LLPS in the presence of RNA. We measured the turbidity of these constructs in the presence of yeast RNA extract shown to stimulate phase separation, possibly by direct electrostatic interactions with RGG/KGG-rich sequences and/or by interactions with the folded RNA-binding domains of FUS14,38–40. In the presence of mass equivalents of RNA, all arginine-to-lysine mutants formed droplets and displayed an increase in turbidity. (Extended Data Fig. 1C,D). Interestingly, RGG1 mutation shows the least phase separation in the presence of RNA (Extended Data Fig. 1D). Taken together, these data suggest that all three RGG domains in FUS are critical for phase separation at physiological concentrations and contribute to LLPS similarly.
Phase-separated RGG3 and LC remain predominantly disordered
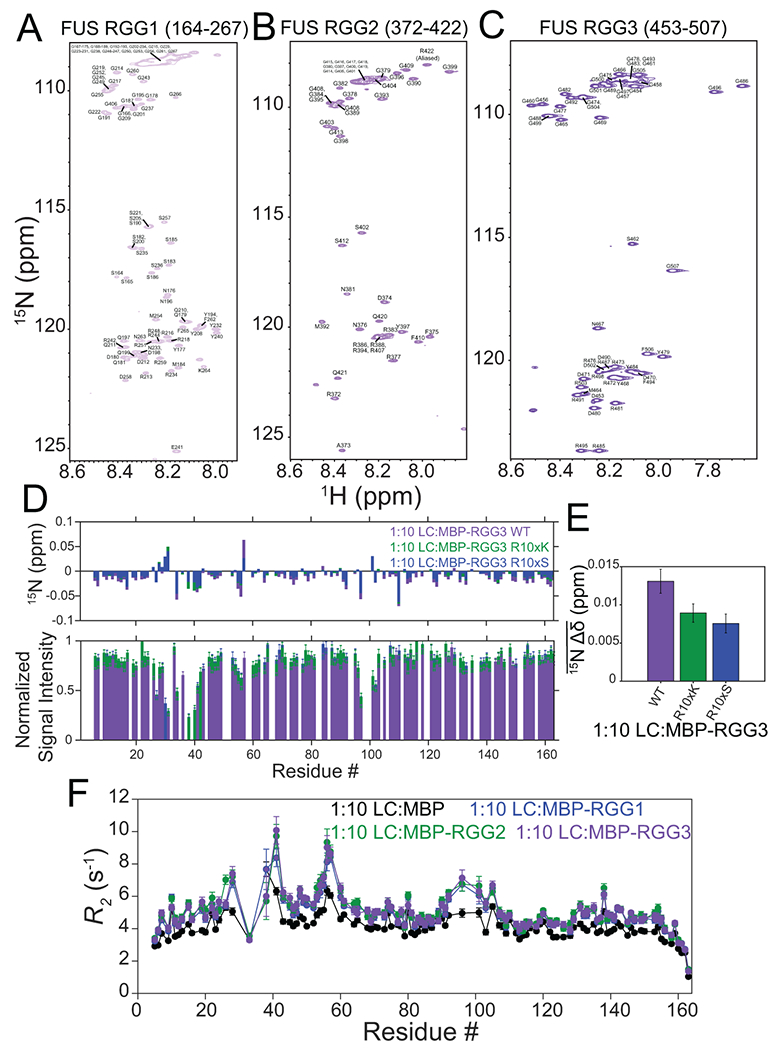
We attempted to probe the interactions between the SYGQ LC and RGG domains without LLPS (in the dispersed phase) using LLPS-discouraging fusion-proteins but found extremely weak interactions (Extended Data Figure 2 and 3, see Supplementary Note), suggesting that contacts mediating LLPS are not tight. Previously, we used NMR to characterize the molecular structure and interactions of the SYGQ LC after LLPS within a condensed phase14,19. Therefore, to probe the structure and molecular interactions between phase separated SYGQ LC and RGG domains, we generated a condensed phase consisting of 2:1 differentially isotopically labeled 13C-labeled SYGQ LC and 15N-RGG3 by mixing the two proteins to induce phase separation and directly centrifuging the sample into an NMR tube to separate the dispersed and condensed phases (Fig. 2A). We selected RGG3 as the representative for RGG-rich domains because of superior resolution (Extended Data Fig. 3A–C). To evaluate changes in the global structure of the RGG3 domain, we compared the 1H-15N HSQC spectra of RGG3 in the dispersed and two-component condensed phase (Fig. 2B). While we observed small 1H and 15N chemical shift perturbations across the entire domain, the global secondary structure of RGG3 remains disordered in the condensed phase (Fig. 2B,C). Chemical shift differences likely reflect the intermolecular interactions within the condensed phase as we observed previously for the SYGQ LC alone14,19,41. In addition, we measured 15N NMR spin relaxation as probes for the local reorientational motions of the backbone of RGG3 within the dispersed and condensed phases (Fig. 2D). Compared to the dispersed phase, R2 is increased, R1 is for the most part decreased, and {1H-}15N heteronuclear NOE ratio (hetNOE) is increased within the condensed phase, consistent with backbone motions that are slowed and more restricted in the condensed phase. However, intermediate values of hetNOE (~0.5) are not consistent with the formation of structure (structurally rigid regions of globular proteins have hetNOE values ~0.9). This observation indicates that RGG3 retains significant nanosecond-timescale reorientational motion (at 850 MHz 1H Larmor frequency field, the hetNOE ratio sharply approaches maximal values with a steep sigmoidal transition near 1 ns). Hence, significant motion is present – in dilute solution the rigid parts of even small globular proteins show maximal hetNOE because molecular tumbling is slower than this 1 ns limit42. The observation that hetNOE near the center of the peptide changes little while R1 and R2 values change significantly suggest that, like for disordered proteins in the dispersed phase, reorientational motions occur via several modes and with a range of timescales43. The observation that R2 is highest and R1 the lowest in the region spanning 475-495 may be due to the RGG repeats in this region, unlike the region from 453-474 that contains nearly half glycine residues, known for their flexibility, and no arginine residues. As observed previously for FUS SYGQ LC19, R1 and hetNOE values largely do not show “bell-shaped” profiles observed for disordered proteins in the dispersed phase (Fig. 2D, Extended Data Fig. 4) perhaps because the chain ends in the condensed phase are constrained by the surrounding protein density. To determine if the addition of the RGG3 domain resulted in changes in secondary structure of SYGQ LC, we compared the 1H-13C HSQC of the two-component condensed phase with a condensed phase containing the SYGQ LC alone (Fig. 2E)19. The resonances corresponding to the aliphatic and aromatic regions of the spectrum match, showing the key features of disorder. Together the data show that RGG3 and SYGQ LC remain predominantly disordered and dynamic within the liquid condensed phase.
Figure 2. The RGG3 and SYGQ LC remain disordered in a two-component condensed phase.

A) A two-component phase consisting of 2:1 13C-labeled SYGQ LC and 15N-labeled RGG3 was made by inducing phase separation of the two components and centrifuging the sample to create a liquid condensed phase within an NMR tube. B) 1H-15N HSQC of the two-component condensed phase overlaid with a spectrum of dispersed phase (100 μM) RGG3. Asterisks denote resonances arising from natural isotopic abundance glutamine side chains within the SYGQ LC. C) Chemical shift perturbations of RGG3 in the condensed phase relative to the dispersed phase. Certain resonances are not included due to lack of resolution or signal broadening. D) 15N spin relaxation values comparing local reorientational motions of RGG3 in the condensed (purple) and dispersed (orange) phases. Data are plotted as mean ± propagated best-fit parameter confidence interval equal to one s.d. in one out of two independent experiments. E) 1H-13C HSQC of the two-component condensed phase overlaid with a condensed phase of the SYGQ LC alone from prior work19. Asterisks correspond to resonances from the initiator methionine present only within the protein construct used in this study.
Contacts between many residue types contribute to FUS LLPS
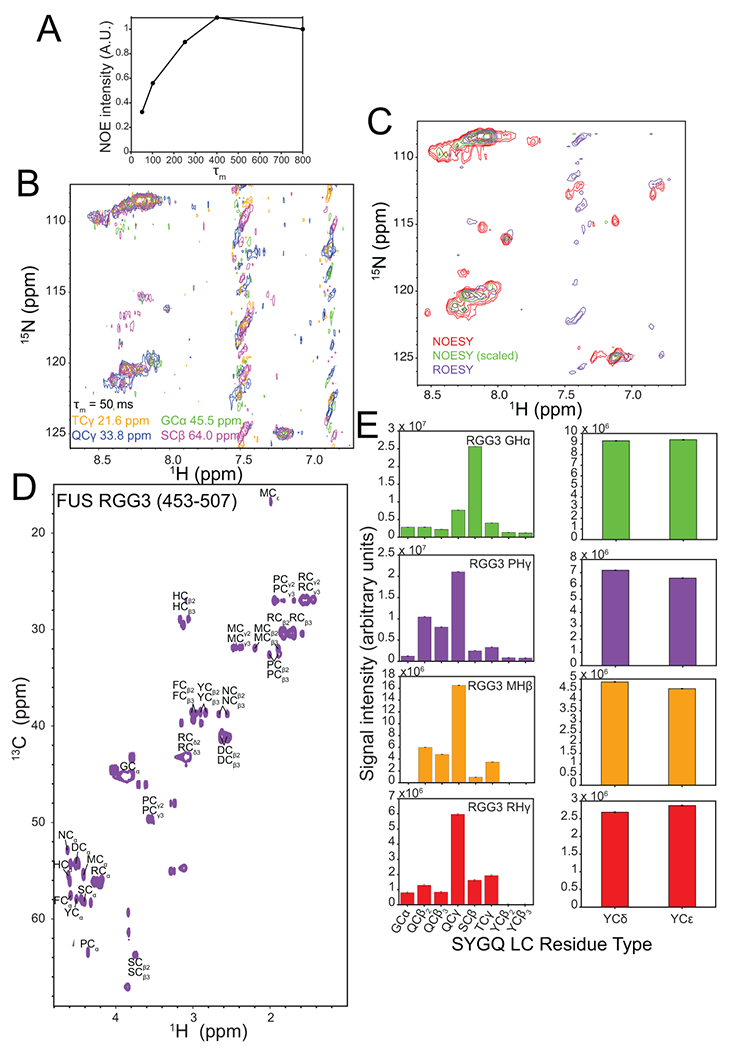
Previously we showed that within a condensed phase containing only the SYGQ LC many residues types (not only Y but for example Q) contribute to interactions using hydrophobic, hydrogen bonding and sp2/π interaction modes stabilizing LLPS19. Here, we characterized intermolecular contacts present in the two-component condensed phase containing 13C-labeled SYGQ LC and 15N-labeled RGG3 domain of FUS using 1H-1H NOE NMR experiments (specifically 13C-HSQC-NOESY-15N-HSQC experiment) (Fig. 3). As also suggested by weak chemical shift perturbations before LLPS (Extended Data Figure 2 and 3), contacts between RGG3 and SYGQ LC are not localized to a specific region of RGG3 as NOEs to all resolved residues are present (Fig. 3A). Likewise, NOEs from all residue types enriched in SYGQ LC are found. We quantified the NOE intensity for the glycine backbone region and arginine side chains of RGG3 with different residue types in the SYGQ LC (Fig. 3B). While signal intensities may not quantitatively report on the strength or frequency of contacts due to the differential relaxation properties of various positions, the observation of NOEs between all major residue types within the SYGQ LC and RGG3 strongly suggest the interactions are distributed across many residue types within the condensed phase and are not concentrated only on certain amino acids (e.g. only arginine and tyrosine). Despite significant fast motions present (Fig. 2D) that should suppress this potential artifact, we sought to address the possibility that the many observed NOEs between multiple residue type pairs arises in part due to spin diffusion (transferring magnetization indirectly, e.g. NOEs appears from residue A to residue C due to mutual contact with residue B without direct proximity of A and C). We observed the same NOE pattern (albeit with lower signal intensity) with a shorter NOE mixing time to decrease potential contribution of spin diffusion (Extended Data Fig. 5A–B), suggesting that these NOEs do not arise primarily from spin diffusion. Similarly, we also observed rotating frame NOEs (ROEs) across all residue types in RGG3 (Extended Data Fig. 5C), although we were limited to ROE experiments of a single 2D plane due in part to decreased signal-to-noise from fast transverse relaxation. Because ROE effectively suppresses multiple magnetization transfer (ROE spin diffusion results in negative, not positive, contributions to observed enhancements), spin diffusion cannot explain observed ROEs44. (Through-bond ROE artifacts cannot explain ROEs to all RGG residue types as these artifactual transfers do not cross peptide bonds.) Hence, these data further suggest that the observed NOEs correspond to direct proximity of many distinct pairs of residue types.
Figure 3. Interactions between SYGQ-LC and RGG3 in the condensed phase are involve multiple residue pairs.
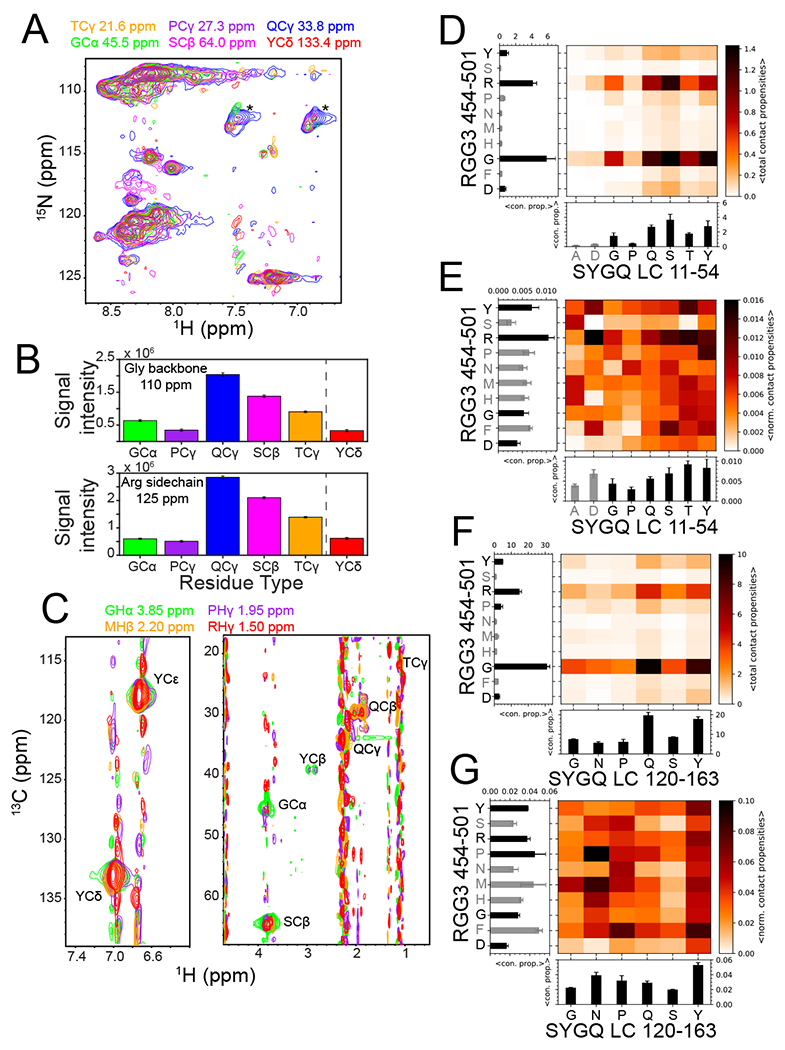
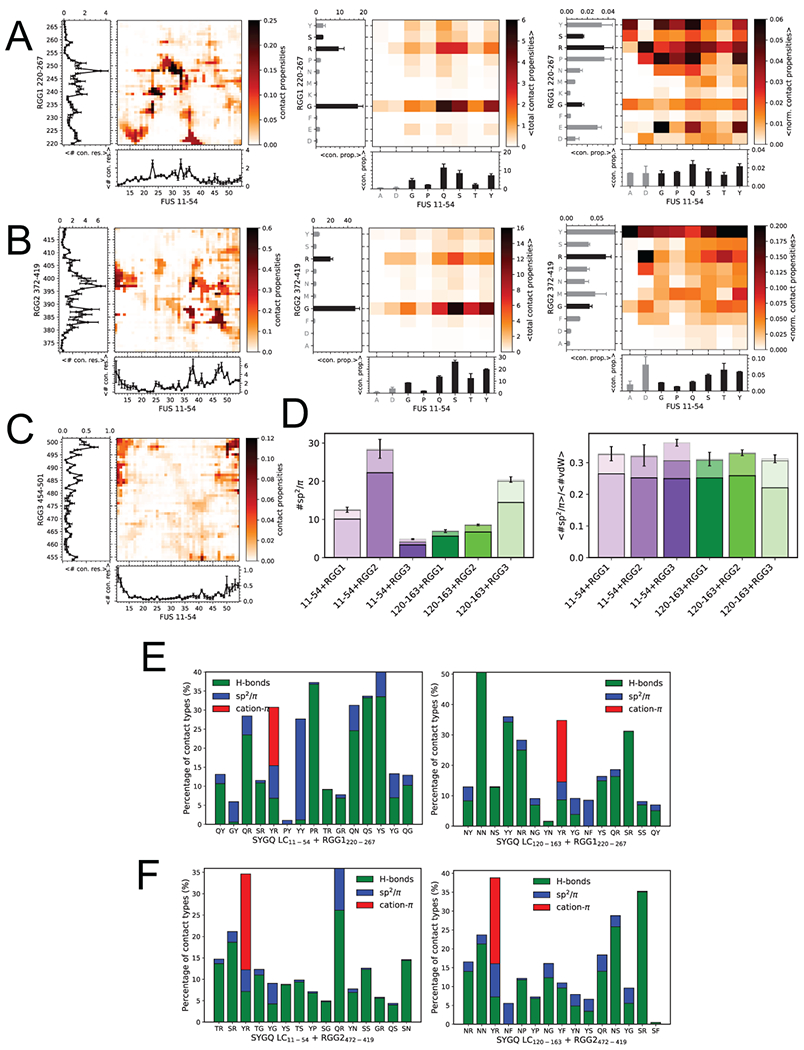
A) 2D-planes from a 13C-HSQC-NOESY-15N-HSQC experiment demonstrating intermolecular NOEs and hence interactions between the 15N-attached backbone and side chain positions in 15N FUS RGG3 with the indicated residue positions within the 13C SYGQ-LC. Asterisks denote (artifactual) intramolecular NOEs at natural isotopic abundance 15N glutamine side chain positions within the 13C-enriched SYGQ LC. B) NOE signal intensity of the glycine backbone region and the arginine side chain region of FUS RGG3 for the indicated SYGQ LC residue types. Tyrosine signal intensity was quantified from a separate experiment centered on the aromatic side chain resonances. Intensity data are plotted as mean ± s.d. of baseline noise for each plane as estimate of uncertainty from one experiment. C) 2D-planes for the indicated 12C-attached resonances from FUS RGG in 12C-filtered, 13C-edited NOESY-HSQC experiments demonstrating interactions with 13C-attached residue positions within FUS SYGQ LC. D,F) Total intermolecular contact propensities between two residue types from two-chain simulations of the representative fragments (D) Mean of total contact propensities SYGQ LC11-54 or (F) SYGQ LC120-163 and RGG3454-501 binned by residue type (from one simulation with n=16 independent replicas using PTWTE method) with 1d plots of mean ± s.e.m. of total contact propensities (with any residue type) for each residue type plotted. Gray bars represent residue types that occur less than three times in the sequence. E,G) Average intermolecular contact propensities from two-chain simulations of (E) SYGQ LC11-54 or (G) SYGQ LC120-163 and RGG3 normalized by occurrence within the sequence. See above for statistics details.
To gain additional information about residue types within the RGG3 domain in contact with residues within the SYGQ LC, we conducted 3D 12C-filtered, 13C-edited NOESY-HSQC experiments (Fig. 3C), probing the interactions between both sidechains and backbone. We chose to analyze in detail regions within the 1H-13C HSQC spectra of RGG3 in the dispersed phase that did not have significant 1H signal overlap with other residue types (Extended Data Fig. 5D). NOEs were present between the glycine, proline, methionine and arginine within RGG3 and threonine, glutamine, tyrosine, glycine, and serines residues within the SYGQ LC (Fig. 3C; Extended Data Fig. 5E).
To gain insight into the modes of interaction that are important for FUS SYGQ LC and RGG domains, we characterized the interactions between FUS SYGQ LC and RGG domain 44-residue fragments (see Methods) using two chain all-atom simulations, as in our previous work (Extended Data Fig. 4 and see supplementary note)19. For all three RGG domains, arginine and glycine have the highest contact propensities with the SYGQ LC, likely because these two residue types are the most abundant (Fig. 3D; Extended Data Fig. 6A,B). Importantly, in the SYGQ LC, several residue types, not just tyrosine, but also in particular glutamine, serine, glycine, and threonine mediate contacts with RGG3 residues, including arginine. To further understand the contribution of specific residue types, we normalized the contact propensities by the amino acid abundance within each sequence. After normalizing, arginine residues remain a hotspot for interactions within the RGG domains along with aromatic residues; however, the contacts involve all residue types within the two domains (Fig. 3E; Extended Data Fig. 6A,B). Similar contacts are observed for the 120-163 fragment of the SYGQ LC (Fig. 3F,G). Additionally, the contacts are distributed across the SYGQ LC and RGG domains (Extended Data Fig. 6A–C), as much as we can ascertain within the challenge of sampling a large inter-residue contacts configuration space. These data are consistent with experimental NOEs present between most residue types, suggesting that all residues can participate in the interaction between the SYGQ LC and RGG domains in the condensed phase.
To characterize the interaction modes between residue pairs in the simulated SYGQ LC and RGG domains beyond non-specific van der Waals (vdW) interactions between all pairs, we classified the total interactions (vdW contacts) into hydrogen bonding, sp2/π, and/or cation-π interactions. All three interactions modes are represented in contacts between the SYGQ LC and all three RGG domains (Fig. 4A). We note that the sp2/π interactions calculated based on Vernon et al. may only account for planar stacking of the sp2/π groups; therefore, we also used a broader definition without orientational restrictions to include other possible sp2/π geometries (e.g. perpendicular stacking) – the overall trend for the interactions remains the same (Extended Data Fig. 6D). To test if results depend on choice of simulated fragment, we compared the interactions of SYGQ LC120-163 with each FUS RGG domain and found a similar distribution of interactions modes (Fig. 4A,B). We note that RGG2 has highest number of interactions with the compositionally representative fragment SYGQ LC11-54, while RGG3 has the most contacts with our previously studied fragment SYGQ LC120-163 (Fig. 4A), suggesting that certain regions of FUS may interact more favorably. However, if we normalize the hydrogen bonds, sp2/π and cation-π interactions by the total number of contacts within each dataset, we find that the relative contribution of each interaction mode is the same regardless of the SYGQ LC fragment used (Fig. 4B). Therefore, these data suggest that all three RGG domains interact with the SYGQ LC via similar interaction modes. Finally, we characterized the contribution of the interaction modes between residue pairs within the SYGQ LC and RGG3 domain. We find that, for residue pairs in vdW contact, the most frequent of these interaction modes involves hydrogen bonding interactions (Fig. 4C,D; Extended Data Fig. 6E,F). Interestingly, contacts involving glycine or serine show significant hydrogen bonding in addition to the previously suggested backbone sp2/π interactions45,46. Importantly, the interactions between tyrosines in the SYGQ LC and arginines within the RGG3 domain involve all three interaction modes. We note that the agreement of current all-atom models to study IDPs with the available experimental data from NMR, SAXS, FRET provides confidence in their ability to capture structural and dynamical properties of these proteins reasonably well47–49. On the other hand, these models have not been tested for their ability to provide insight on the precise balance between different interaction modes (especially π-π, cation-π). Further, the definitions of these contacts we adopted45 may require additional refinement based on input from quantum calculations. Therefore, the percentage of each interaction type should be treated with caution and should not be interpreted as providing insight on the relative energetic contribution of each mode. Taken together, while cation-π interactions between arginine and tyrosine have been proposed as the major contributor SYGQ LC and RGG-rich sequences, glycine and other residue types within the RGG-rich sequences also contribute through hydrogen bonds and sp2/π interactions as well as non-specific vdW contacts.
Figure 4. Diverse interaction modes contribute to FUS SYGQ LC and RGG3 interactions within the condensed phase.
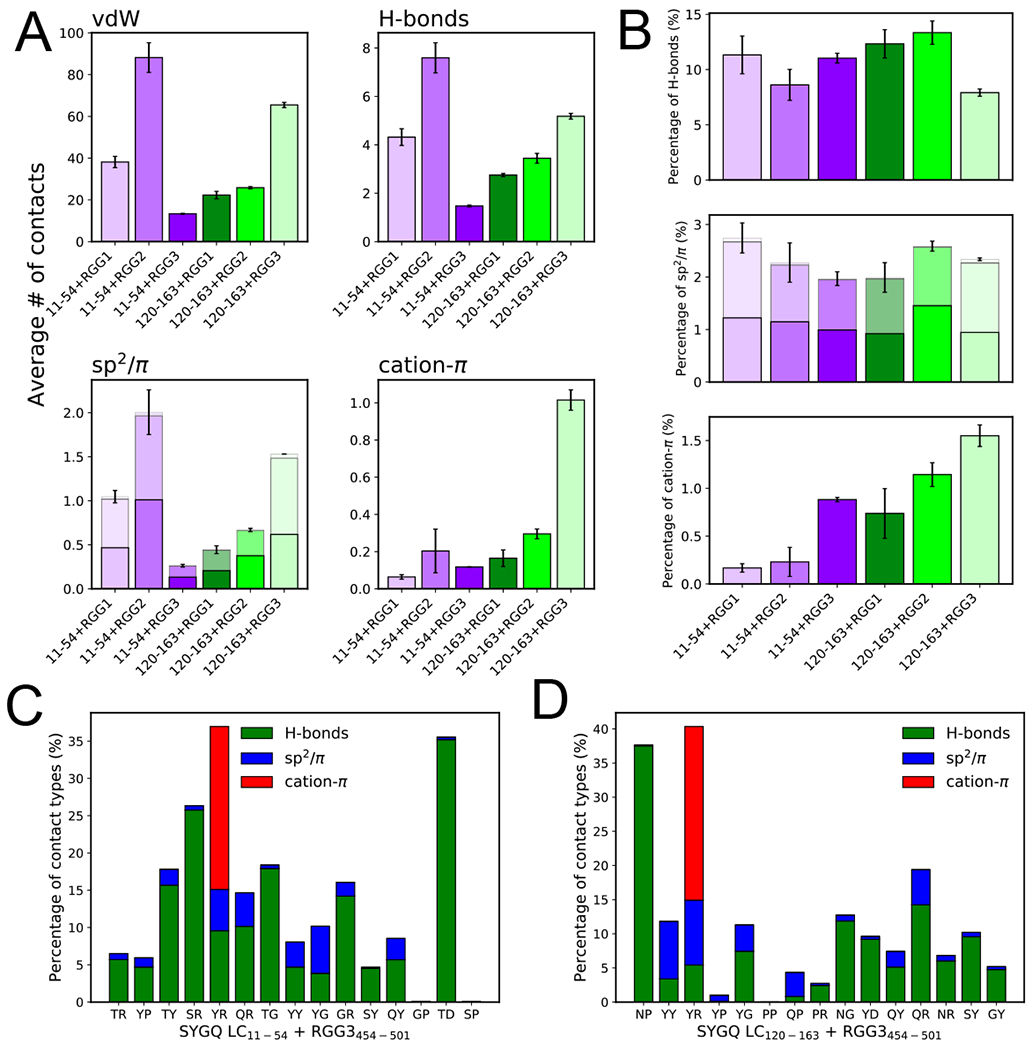
A) Average number of intermolecular van der Waals contacts, hydrogen bonds, sp2/π, and cation-π interactions from two-chain simulations of SYGQ LC11-54 or SYGQ LC120-163 and RGG1, RGG2 or RGG3. For sp2/π contacts the data are binned for π-π (top, lightest), sp2-π (middle, lighter) and sp2-sp2 (bottom) contacts. Data are plotted as mean ± s.e.m of n=5 equal divisions of the total data set from one PTWTE simulation with n=16 independent replicas. B) Percentage of hydrogen bond, sp2/π, and cation-π interactions out of the total intermolecular contacts from two-chain simulations of SYGQ LC11-54 or SYGQ LC120-163 and RGG1, RGG2 or RGG3. See (A) for sp2/π shading definition and statistics information. C-D) The percentage of hydrogen bonds, sp2/π, and cation-π contacts out of the total van der Waals interactions for interacting amino acid type pairs. Data are shown only for top fifteen interacting amino acid type pairs normalized for their frequency and selected from residue types occurring more than 2 times in the respective sequence (see Figure 3E,G) in order of highest to lowest contact frequency (left to right) SYGQ LC11-54 or SYGQ LC120-163 with RGG3454-501.
FUS contacts with the C-terminal tail of RNA polymerase II
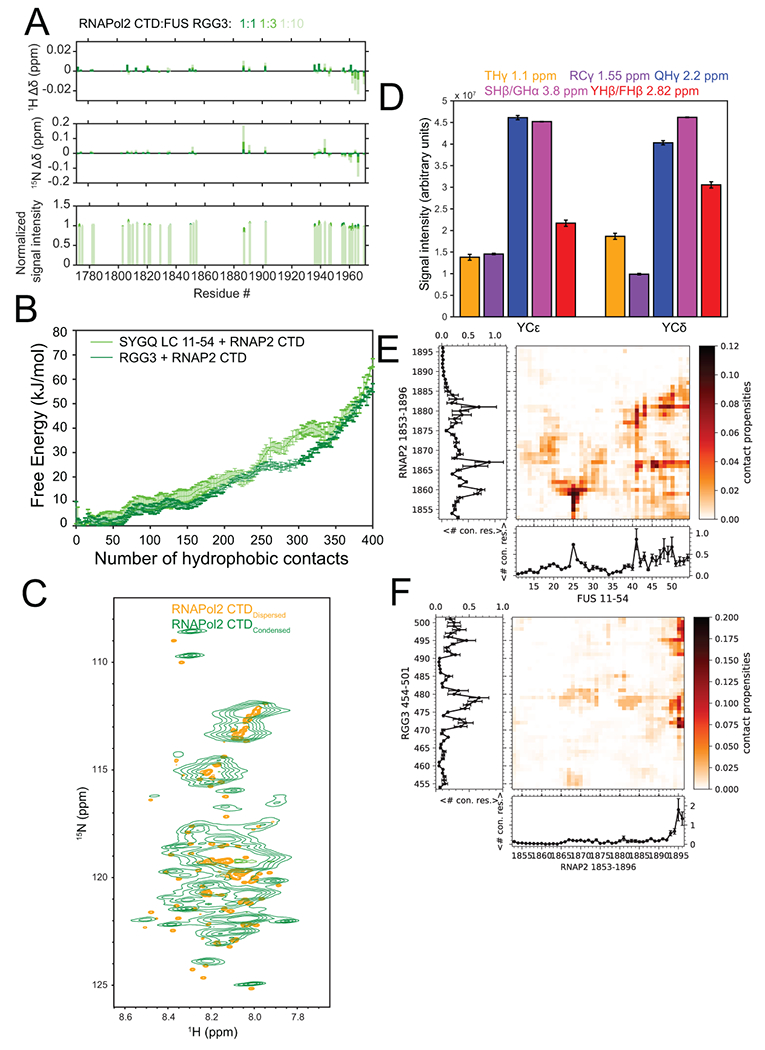
Previous studies demonstrated that the degenerate repeat half of the C-terminal tail of RNA polymerase II (CTD) interacts with and partitions into FET protein liquid-like phases and interacts with fibrillar FET LC hydrogels14,31,50. Arginine residues within TAF15 are important for mediating co-partitioning of TAF15 and RNA polymerase34, yet the molecular details of these interactions are poorly understood. We hypothesized that the degenerate repeats 27-52 of RNA polymerase II interact not only with FUS SYGQ LC but also with the arginine-rich domains within FUS. First, we tested whether GFP-tagged RNA polymerase II CTD (GFP-CTD) co-partitioned into droplets formed by FUS domains (Fig. 5). GFP-CTD co-partitioned into liquid droplets formed by both full-length (Fig. 5A) and SYGQ LC (Fig. 5B) as previously reported14 and into droplets formed by ΔSYGQ LC alone (Fig. 5D). Therefore, the SYGQ LC is sufficient but not necessary for co-partitioning RNA polymerase II CTD into FUS condensed phases, consistent with direct interactions between RNA polymerase II CTD and several FUS domains. To test the effect of RNA polymerase II CTD on phase separation of the SYGQ LC and RGG3 domain, we quantified turbidity of FUS SYGQ LC or RGG3 below the saturation concentration for phase separation in the presence of increasing concentrations of RNA polymerase II CTD. Addition of RNA polymerase II CTD to SYGQ LC or RGG3 was sufficient to increase turbidity (Fig. 5C,E), consistent with LLPS. Turbidity was further increased by addition of RNA polymerase II CTD in excess of SYGQ LC and RGG3. We also detected small NMR chemical shift and intensity differences when RNA polymerase II CTD and RGG3 are combined (Extended Data Fig. 7A). We conducted all-atom simulations with RNA polymerase II CTD1853-1896 and FUS SYGQ LC11-54 and RGG3 fragments and analyzed the free energy surface as a function of total contacts. Both the pairs of protein fragments have free energy minima at non-zero contacts, suggesting that both the SYGQ and RGG3 interact with RNA polymerase II CTD in simulations consistent with the experimental data (Extended Data Fig. 7B). Taken together, these data suggest that the C-terminal heptads of RNA polymerase II can interact with the RGG domains within FUS in addition to the SYGQ LC to promote co-phase separation.
Figure 5. RGG domains interact with RNA polymerase II C-terminal heptad tail.
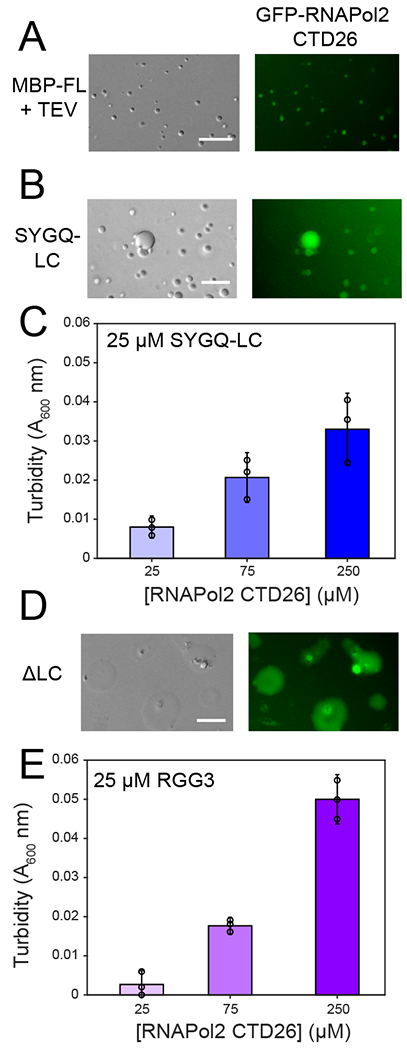
A) Recruitment of GFP-CTD26 into droplets formed by 5 μM MBP-FUS FL after cleavage of the N-terminal MBP solubility tag by addition of TEV protease. For all panels in this figure, micrographs are from one representative experiment repeated two times. B) Recruitment of GFP-RNAPol II CTD26 into droplets formed by 300 μM SYGQ-LC. C) Turbidity of 25 μM SYGQ-LC in the presence of increasing concentrations of untagged RNA polymerase II CTD. The data subtract turbidity values of control SYGQ-LC alone. Data are plotted as mean ± s.d. from n=3 replicates in one representative data set out of two independent experiments. D) Recruitment of GFP-CTD26 into droplets formed by 50 μM ΔSYGQ LC. E) Turbidity of 25 μM RGG3 in the presence of increasing concentrations of untagged RNA polymerase II CTD. The data subtract turbidity values of control RGG3 alone. Data are plotted as mean ± s.d. from n=3 replicates in one representative data set out of two independent experiments. For all micrographs in this figure, data shown are from one representative dataset of two experiments.
Lysines in RNA polymerase II CTD form LLPS contacts
We characterized the interactions between FUS and RNA polymerase II CTD in the condensed phase. Though RNA polymerase II CTD has significant tyrosine content, we hypothesized other residues also mediate contacts with FUS because it also has similar polar-residue content as FUS SYGQ LC. We generated a condensed phase sample for NMR spectroscopy containing natural abundance (“HSQC-invisible”) FUS SYGQ LC and RGG3 mixed with 13C,15N-labeled RNA polymerase II CTD (“HSQC-visible”) (Fig. 6A). Within this three-component condensed phase, RNA polymerase II CTD remained disordered (Extended Data Fig. 7C). We measured interactions between the three-components using a series of 3D 12C-filtered, 13C-edited NOESY-HSQC experiments. As neither SYGQ LC nor RGG3 was isotopically enriched within this condensed phase, we identified several residue types effectively unique to each sequence (i.e. arginine in RGG3 and threonine and glutamine in SYGQ LC) in order to determine how each domain of FUS interacts with RNA polymerase II CTD (Fig. 6A). We observed NOEs between all residue types enriched in RNA polymerase II CTD (i.e. serine, tyrosine, proline, and lysine) to threonine and glutamines within SYGQ LC as well as arginines in RGG3 (Fig. 6B,C; Extended Data Fig. 7D). We also observe NOEs arising from residues with 1H resonance overlap in SYGQ LC and RGG3 (namely, serines, glycines and tyrosines) and all residue types enriched in RNA polymerase II CTD.
Figure 6. Lysine residues within RNA polymerase II CTD contribute to interactions with FUS within the condensed phase.
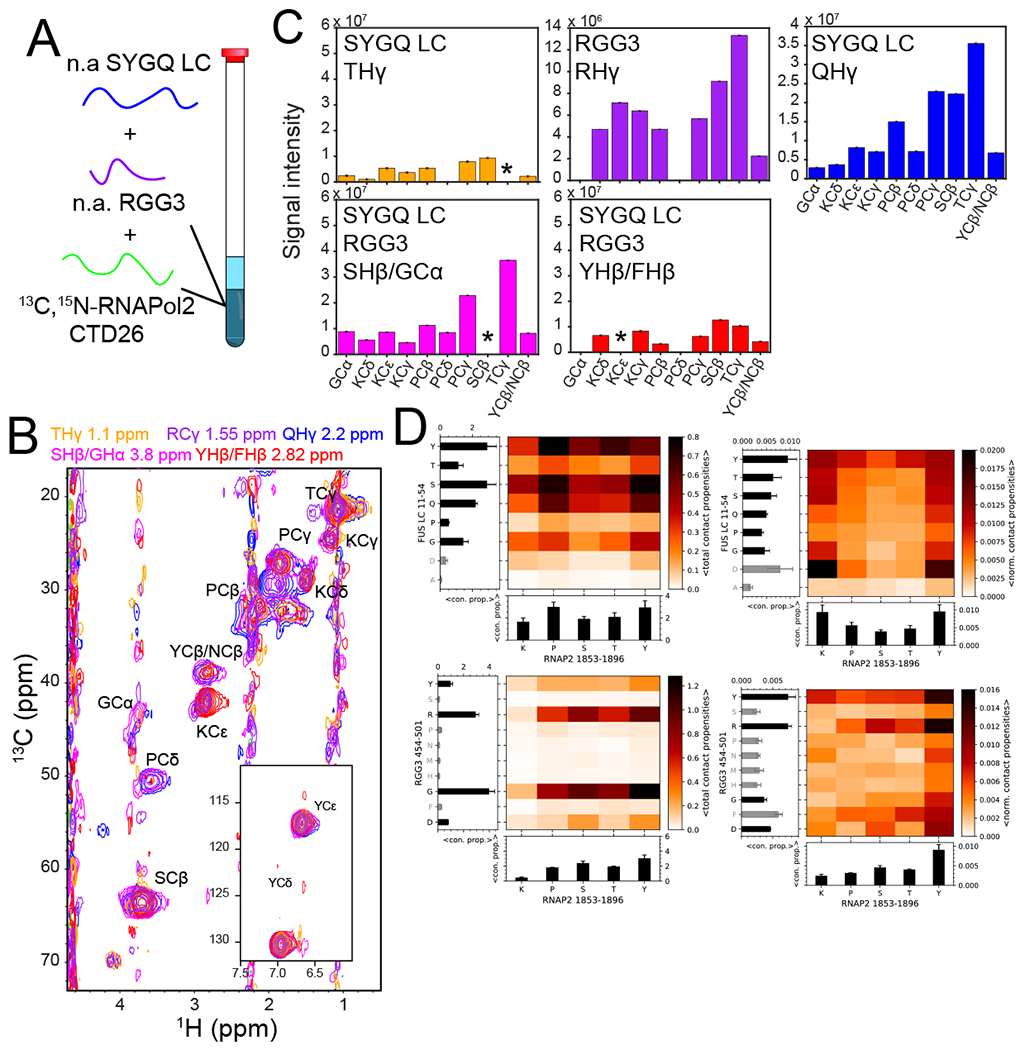
A) A three-component condensed phase made from 1:1:1 natural abundance FUS SYGQ LC and RGG3 and 13C,15N-labeled RNAP2 CTD for NMR measurements. B) 2D-planes for the indicated 12C-attached resonances from FUS SYGQ LC and RGG in a 12C-filtered, 13C-edited NOESY-HSQC experiment demonstrating interactions with 13C-attached residue positions within RNA polymerase Il CTD. Intensity data for one representative experiment are plotted as mean ± standard deviation of baseline noise for each plane as estimate of uncertainty in one representative data set. C) NOE signal intensity of residue types from RNAP2 CTD for the corresponding FUS SYGQ LC and RGG3 residue types. Asterisks represent NOEs where artifacts or overlap to not allow reliable quantification. Intensity data for one representative experiment are plotted as mean ± s.d. of baseline noise for each plane as estimate of uncertainty in one data set. D) Total (left) and normalized (right) intermolecular contact propensities from two-chain simulations of RNAP2 CTD1853-1896 with SYGQ LC11-54 (top) or RGG3 (bottom) binned by residue type. Bar graph data represent the mean ± s.e.m. of contact propensities (with any residue type) for each residue type plotted. Gray bars represent residue types that occur less than three times in the sequence.
To probe the contribution of particular residue types to the interactions between RNA polymerase II CTD and FUS SYGQ LC or RGG3, we analyzed the contact propensities between residue pairs within two-chain all-atom simulations. The interactions between RNA polymerase II CTD1853-1896 and FUS SYGQ LC11-54 involve all enriched residue types (Fig. 6D, left); however, the normalized contact propensities indicate that lysines and tyrosines within RNA polymerase II CTD1853-1896 are hotspots for interactions with FUS SYGQ LC11-54 (Fig. 6D, top right). In contrast, the interactions between RNA polymerase II CTD1853-1896 and FUS RGG3 are dominated by arginine and aromatic residue contacts (Fig. 6D, bottom right). Both pairs exhibit contacts that are relatively distributed across the protein fragments used except for some enhancement over two to three adjacent residues (Extended Data Fig. 7E,F). Given the extreme length of simulations needed for convergence of simulated ensembles to reliably quantify interactions at the level of each residue51, we focused instead on interactions between each residue type, which represents information averaged over many occurrences of these residues within the sequence.
Finally, we characterized the contribution in the simulations of the interaction modes between residue pairs in FUS SYGQ LC or RGG3 with RNA polymerase II CTD. In both datasets we find that the contacts between residue pairs show significant presence of hydrogen bonding interactions (Fig. 7A) though contacts between tyrosine residues in FUS SYGQ LC and lysine residues in RNA polymerase II CTD show significant cation-π interactions. Conversely, in both datasets, other pairs involving glycine or lysine interact by hydrogen bonding interactions rather than sp2/π. Although we noted the caveats of molecular simulation approaches above, our analysis of the interaction modes formed between residue pairs in multiple systems suggests that hydrogen bond interactions may be more important for LLPS, in general, than currently appreciated in the literature.
Figure 7. Interaction modes and impact of CTD lysine residues on RNA polymerase II CTD and FUS domain interactions.
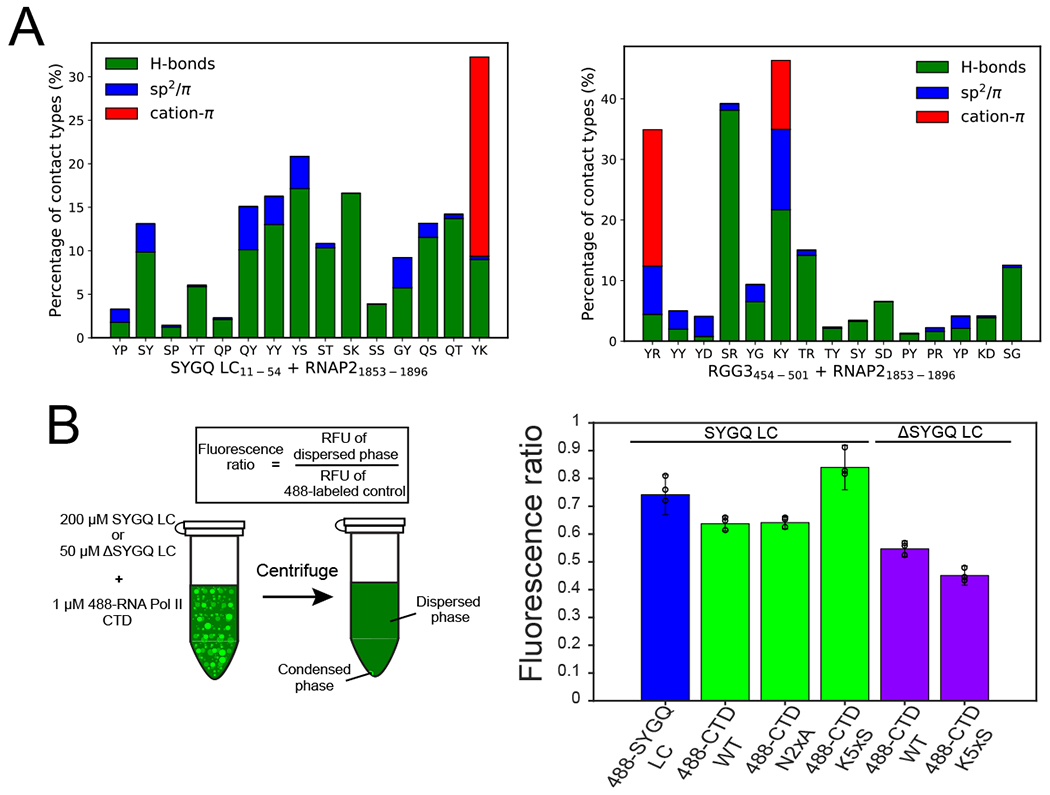
A) Comparison of the dominant interaction modes between residues within SYGQ LC11-54 and RNAP21853-1896 (left) or RGG454-501 and RNAP21853-1896 (right) in decreasing order of normalized contact frequency among residue types present 3 or more times in the sequences. B) Quantification of partitioning of AlexaFluor labeled RNA polymerase II CTD variants (or positive control SYGQ LC, left) into either FUS SYGQ LC or ΔSYGQ LC droplets. Data are plotted as mean ± s.d. of measurements from n=3 replicates in one representative data set out of two independent experiments.
Because we observed that lysine residues within RNA polymerase II CTD formed frequent contacts by both experiment (i.e. NOEs) and molecular simulations (Fig. 6D), we tested the importance of lysine residues for partitioning into SYGQ LC or ΔSYGQ LC condensates. To this end, we induced phase separation of either SYGQ LC or ΔSYGQ LC in the presence of 1 μM AlexaFluor 488-labeled RNA polymerase II CTD WT or a mutant in which five lysines are mutated to serine (K5xS), centrifuged the reactions, and quantified the remaining fluorescence intensity in the supernatants. The fluorescence intensity of the fluorescently-labeled RNA polymerase II CTD variants alone (negative control) was used to normalize the data to control for potential differences in the extent of fluorophore labeling. As a positive control, the partitioning of 488-labeled SYGQ LC into SYGQ droplets was measured to demonstrate that quantification of fluorescence intensity of the supernatant remaining after centrifugation measures extent of partitioning (Fig. 7B). We observed that WT RNA polymerase II CTD partitioned into FUS SYGQ and ΔSYGQ LC droplets as expected. In the case of the SYGQ LC, the lysine-to-serine variant (K5xS) RNA polymerase II CTD, but not the N2xA variant with two asparagine-to-alanine substitutions, displayed higher fluorescence in the supernatant, suggesting that loss of lysines impairs partitioning into SYGQ LC droplets. In contrast, loss of lysine in RNA polymerase II CTD promoted greater partitioning into ΔSYGQ LC droplets as lower fluorescence was observed in the supernatant. This increase in the partitioning of the lysine-to-serine variant into ΔSYGQ LC droplets (predicted net charge +17.5) may be due to the increased negative charge associated with the loss of lysine residues (from −4 to −9 predicted net charge). Thus, experimental and simulation data suggest that lysine residues play a role in determining the interactions and phase partitioning of RNA polymerase II CTD with FUS.
Discussion
RGG-motifs are present in many proteins that undergo LLPS including Ddx4, hnRNPA2, FMRP and FUS paralogs TAF15 and EWS46,52–54. RGG domains are considered interaction hubs as they can mediate self-interactions, bind nucleic acids, and mediate heterotypic interactions with other disordered and folded protein partners. Our data are consistent with previous biochemical studies showing RGG domains contribute to FUS LLPS and aggregation23–25. Yet, despite extensive study of FUS LLPS, a mechanistic understanding of multi-domain mediated LLPS has remained open. Here, we probed how RGG domains play a significant role in FUS LLPS, interact weakly with the SYGQ LC, and contribute to inter-domain interactions with RNA polymerase II CTD.
Solution-state NMR is the leading technique to characterize the structural and dynamic properties of intrinsically disordered protein LLPS41,55, though solid state NMR plays an important role in characterizing gel-like states56. Characterization of LLPS-prone proteins is especially challenging given the limitations with sample preparation/characteristics and applicability of various NMR methods. Yet, NOE-based NMR spectroscopy visualizes the transient interactions important for LLPS as seen for single-component condensed phases of FUS, elastin-like peptides and Ddx419,27,57. Intramolecular interactions in the dispersed phase of hnRNPA1 mimicking important interactions for LLPS have been probed using NOE experiments20; however, differences between contacts formed in the dispersed and condensed phases and limitations of sample concentration and signal-to-noise may preclude this method for every system, particularly those involving multiple components. Therefore, we directly measured the interactions between the SYGQ LC, RGG3 and RNA polymerase II CTD within the condensed phase. Though Kim and coworkers showed particular interaction regions within CAPRIN1 in a CAPRIN1-phosphorylated FMRP condensed phase58, the interactions observed here between FUS SYGQ LC, RGG3 and RNA polymerase II CTD appear distributed across the chains, similar to the interactions formed between SYGQ LC domains19. Future efforts with additional approaches may help reveal subtle sequence-region preferences59.
Cation-π interactions between arginine and tyrosine (and phenylalanine) are often assumed to be the major driving force of FUS and other disordered domain LLPS based on studies mutating all instances of several residue types23,25,26,52,58. However, mutagenic studies replacing single residue types cannot directly probe which residue pairs form interactions, much less tease apart synergistic contacts. Here, we demonstrate that other residue types and interaction modes also make contributions to FUS LLPS (Fig. 3,4,8). In all-atom simulations, we analyzed the contribution of various contact modes, including hydrogen bonding and π-interactions, on FUS SYGQ LC and RGG LLPS. Several studies have suggested that the number or positioning of key residues may make larger contributions to LLPS than the bulk of the sequence, suggesting a pecking order among interactions that induce LLPS20,28,60. While we did not evaluate the interactions on an individual residue position level, our data are consistent with the view that certain residue types, including tyrosine and arginine, form primary interactions essential for robust physiological LLPS, stemming at least in part from the additive effect of multiple potential interaction modes; however, these residues do not interact only with each other. In fact, many residue types, such as serine and glycine, that are limited in potential interaction modes but enriched in the sequence, form interactions that also contribute to LLPS. In this way, it is difficult to precisely assign a relative weight for individual residues and interaction modes. These results are consistent with previous NMR work demonstrating tyrosine residues in FUS LC and phenylalanine and arginine residues in Ddx4 make contacts with many residue types within the condensed phases19,27. Addressing the relative contribution of SYGQ LC-LC, RGG-RGG and SYGQ LC-RGG interactions to phase separation within full-length FUS, as well as the effect of RNA on these interactions will be important next steps to understanding LLPS of FUS.
Figure 8. Multiple residue types and interaction modes contribute to multi-component condensed phases of FET proteins and RNA polymerase II.

The interactions between FUS and RNA polymerase II CTD that stabilized LLPS involve hydrogen bonding, salt bridges, π-π stacking as well as cation-π interaction modes.
Previous computational work on protein LLPS mostly used coarse-grained models, which provide important information on the sequence-dependent LLPS behavior of proteins61,62, but cannot provide guidance on the underlying interactions. Recent studies have used atomistic simulation data to obtain insights into the prevalence of different interactions modes within the folded protein structures45 or interactions between short disordered peptides63,64. Here, we use Amber99SBws-STQ force field (with water model used in its design, tip4p/2005) due to its ability to capture NMR-validated conformational properties of disordered proteins with or without transiently populated secondary structure elements combined with a correction for helical bias observed in three residue-types (Ser, Thr, and Gln) present in low-complexity sequences including FUS LC65. Recent papers discuss how these models provide molecular details of IDP structure and dynamics on par or better than other existing all-atom force fields66,67. Further work is needed to establish if these force fields also capture the relative importance of different interactions modes, as significant questions remain68.
Biomolecular condensates are complex mixtures of components. RNA polymerase II CTD is recruited to SYGQ LC liquid condensates and hydrogels14,31. The degenerate half of RNA polymerase II CTD is enriched in lysines. Lysine-rich sequences are enriched in liquid condensates called P bodies and are important for tau LLPS40,69,70. Previous studies reported that the lysine residues partially mediate incorporation of RNA polymerase II CTD into TAF15 hydrogels31,50; we find that lysine residues within RNA polymerase II CTD are also important for co-partitioning into SYGQ LC liquid condensates (Fig. 7). While there are some parallels between the arginine-rich RGG3 domain and lysine-rich RNA polymerase II CTD, arginine-tyrosine pairs can form cation-π, sp2/π and hydrogen bonding interactions simultaneously, while lysine is limited to cation-π, hydrogen bonding and salt bridge interactions in this context (Fig. 4; Fig. 7). Indeed, co-occurrence of all three interaction modes between arginine-tyrosine pairs may contribute to the role of these residues as interaction hotspots. Finally, SYGQ LC is not required for co-partitioning of RNA polymerase II CTD into FUS liquid condensates and RGG domains contribute to the interaction with RNA polymerase II CTD (Fig. 5). Other arginine-rich proteins have been shown to associate with RNA polymerase II CTD such as the splicing factors SRSF1/SRSF271. Arginine and aspartate residues within TAF15 are important for RNA polymerase clustering34. Residue charge may contribute to the interaction between the RGG domains and RNA polymerase II CTD, as mutation of lysines in RNA polymerase II CTD increased partitioning into RGG-rich droplets (Fig. 7B). Hence, phosphorylation of RNA polymerase II CTD may alter the balance of interactions with FET SYGQ LC and RGG domains, potentially leading to changes in RNA polymerase II and FET protein co-localization associated with the stages in transcription30,34,36,71,72.
Methods
Protein Expression and Purification
Constructs were expressed in BL21 Star (DE3) cells (Life Technologies). Briefly, cultures (1L) were grown to an optical density of 0.7-0.9, induced with 1 mM isopropyl-β-D-1-thiogalactopyranoside (IPTG) for 4 hrs at 37°C, harvested by centrifugation, and stored at −80°C. Isotopically labeled protein was expressed in M9 media supplemented with 15N-ammonium chloride or 13C-glucose as the sole nitrogen and carbon sources, respectively.
pTHMT FUS 1-526 (Addgene #98651).
Purification of MBP-FUS FL and variants were carried out as previously reported19,37. Cell pellets were resuspended in 20 mM sodium phosphate 1M NaCl 10 mM imidazole pH 7.4 and an EDTA-free protease inhibitor tablet (Roche), lysed using an Emulsiflex C3 (Avestin). The lysate was cleared by centrifugation at 20,000 rpm for 50 min at 4°C, filtered using a 0.2 μm syringe filter, and loaded onto a HisTrap HP 5 mL column. The protein was eluted with a gradient from 10-300 mM imidazole in 20 mM sodium phosphate 1M NaCl pH 7.4. Fractions containing MBP-FUS FL were loaded onto a HiLoad 26/600 Superdex 200 pg column equilibrated in 20 mM sodium phosphate 1M NaCl pH 7.4. Fractions with minimal degradation products were determined with a gel, concentrated using a centrifugation filter with a 10 kDa cutoff (Amicon, Millipore), and flash frozen in 25% glycerol for storage at −80°C.
RP1B FUS 1-163 (Addgene 127192).
Cell pellets were resuspended in 20 mM sodium phosphate 300 mM NaCl 10 mM imidazole pH 7.4 and lysed using an Emulsiflex C3 (Avestin). The lysate was cleared by centrifugation at 20,000 rpm for 50 min at 4°C and the insoluble fraction was resuspended in 8M urea 20 mM sodium phosphate 300 mM NaCl 10 mM imidazole pH 7.4 before centrifugation at 20,000 rpm for 50 min at 4°C. The insoluble fraction was filtered using a 0.2 μm syringe filter and loaded onto a HisTrap HP 5 mL column. The protein was eluted with a gradient from 10-300 mM imidazole in 8M urea 20 mM sodium phosphate 300 mM NaCl pH 7.4. Fractions containing FUS LC were spin concentrated using a centrifugal filter with a 3 kDa cutoff, diluted to ~1M urea with 20 mM sodium phosphate pH 7.4, and incubated rocking over night with in-house TEV protease at room temperature. The TEV reaction was stopped by addition of urea to 8M, and NaCl was added to 300 mM and imidazole was added to 10 mM. The solution was filtered using a 0.2 μm syringe filter, loaded onto a HisTrap HP 5 mL column. The flow-through was collected, buffer exchanged into 20 mM CAPS pH 11.0 using a centrifugal filter with a 3 kDa cutoff, and flash frozen for storage at −80°C. FUS LC variants were purified similarly to wild-type.
pTHMT RGG1 (164-267), pTHMT RGG2 (372-422), pTHMT RGG3 (453-507) WT and variants, pJ411 FUS ΔSYGQ (164-526).
Cell pellets were resuspended in 20 mM sodium phosphate 1M NaCl 10 mM imidazole pH 7.4 and an EDTA-free protease inhibitor tablet (Roche), lysed using an Emulsiflex C3 (Avestin). The lysate was cleared by centrifugation at 20,000 rpm for 50 min at 4°C, filtered using a 0.2 μm syringe filter, and loaded onto a HisTrap HP 5 mL column. The protein was eluted with a gradient from 10-300 mM imidazole in 20 mM sodium phosphate 1M NaCl pH 7.4. In-house TEV was added to the fractions containing the protein and the reaction was dialyzed into 20 mM sodium phosphate 300 mM NaCl pH 7.4 overnight at room temperature. The dialyzed protein was loaded onto a HiLoad 26/600 Superdex 75 pg column equilibrated in 20 mM sodium phosphate 300 mM NaCl pH 7.4. For experiments where the MBP-tag was retained, the protein was immediately loaded onto a HiLoad 26/600 Superdex 200 pg column equilibrated in 20 mM sodium phosphate 300 mM NaCl pH 7.4. The proteins were concentrated using a centrifugal filter with a 3 kDa cutoff and flash frozen for storage at −80°C. The proteins were buffer exchanged into 20 mM sodium phosphate 1M NaCl pH 7.4 or 50 mM MES/Bis-Tris 1M NaCl pH 5.5 to prevent phase separation where high concentration stocks were required (<1 mM) or 50 mM MES/Bis-Tris 150 mM NaCl pH 5.5 for NMR experiments. For two- and three-component condensed phase NMR experiments, purified RGG3 was buffer exchanged into 8M urea 50 mM MES 150 mM NaCl pH 3.4 (untitrated).
pJ411 RNAP CTD27-52 (Addgene #98678).
The protein was purified as previously described50. For three-component condensed phase NMR experiments, the protein was buffer exchanged into 8M urea 50 mM MES 150 mM NaCl pH 3.4 (untitrated) before storage at −80°C. RNAP CTD27-52 variants were purified similarly to wild-type.
GFP-RNAP CTD.
The protein was purified as previously described14.
Fluorescent labeling.
For experiments with FUS LC and variants, the proteins were diluted to ~1 mg/mL in 100 mM sodium phosphate 150 mM NaCl pH 6.5 and incubated with DyLight 488 NHS ester dissolved in DMF for 16 hr at 4°C. Excess label was removed by desalting samples twice with 2 mL 7000 MWCO Zeba spin desalting columns. RNAP CTD27-52 and variants with an engineered cysteine site (S1966C) were labeled with AlexaFluor 488 maleimide as previously described50.
Turbidity Measurements
Turbidity measurements of MBP-FUS FL and FUS SYGQ LC in the presence of FUS ΔSYGQ or FUS RGG3 at varying concentrations were conducted in 20 mM sodium phosphate 150 mM NaCl pH 7.4. The absorbance at 600 nm was measured in a 70 μL micro-cuvette using a NanoDrop 2000c. After measurement, the samples were immediately imaged using DIC microscopy.
Turbidity was used to evaluate phase separation of 5 μM MBP-FUS FL and variants in the presence of 0.0075 mg/mL in-house TEV protease (~0.3 mg/mL in 50 mM Tris 1 mM EDTA 5 mM DTT pH 7.5 50% glycerol 0.1% Triton-X-100) in 20 mM sodium phosphate pH 7.4 with the appropriate salt concentration. For experiments with RNA, mass equivalents of desalted torula yeast RNA extract in 20 mM sodium phosphate 150 mM NaCl pH 7.4 was added to the reactions. Turbidity experiments were performed in a 96-well clear plate (Costar) with 100 μL samples sealed with optical adhesive film to prevent evaporation (MicroAmp, ThermoFisher). The absorbance at 600 nm was monitored over time using a Cytation 5 Cell Imaging Multi-Mode Reader (BioTek) at 5 min time intervals for up to 12 hr with mixing. To normalize the data, the turbidity of a no TEV control (replaced with TEV storage buffer) for each condition was subtracted from the turbidity of the experimental conditions. Experiments were conducted in triplicate and averaged.
Turbidity of 25 μM FUS SYGQ or 25 μM RGG3 in the presence of varying concentrations of RNAP CTD27-52 in 20 mM sodium phosphate 150 mM NaCl pH 7.4 was measured in a 96-well clear plate (Costar) sealed with optical adhesive film to prevent evaporation (MicroAmp, ThermoFisher). The absorbance at 600 nm was measured using a Cytation 5 Cell Imaging Multi-Mode Reader (BioTek). To normalize the data, a turbidity of a sample containing solely 25 μM FUS SYGQ or 25 μM RGG3 was subtracted from the turbidity of the experimental conditions. Experiments were conducted in triplicate and averaged.
Phase separation quantification by fluorescence
To quantify partitioning, 1 μM fluorescently labeled RNAP CTD27-52 was mixed with phase separated 200 μM FUS SYGQ at room temperature. For experiments with FUS ΔSYGQ LC, 1 μM fluorescently labeled RNAP CTD27-52 was mixed with phase separated 50 μM FUS SYGQ at 4°C. The reactions were centrifuged at 14,000g for ten minutes to pellet the condensed phase, and the supernatant was transferred to a 96-well clear plate (Costar) which was subsequently sealed with optical adhesive film (MicroAmp, ThermoFisher). The relative fluorescence units were measured using a Cytation 5 Cell Imaging Multi-Mode Reader (BioTek) with absorbance set to 493 nm and emission set to 519 nm. To normalize the data, the relative fluorescence units of the experimental conditions were divided by the relative fluorescence units of a sample containing only 1 μM fluorescently labeled protein.
Fluorescence and DIC microscopy
To evaluate GFP-RNAP CTD localization, samples were prepared by adding 0.3 μM GFP-CTD to phase separated 300 μM FUS SYGQ in 50 mM MES/Bis-Tris 150 mM NaCl pH 5.5, 50 μM FUS ΔSYGQ in 20 mM sodium phosphate 150 mM NaCl pH 7.4, or 5 μM MBP-FUS FL with 0.015 mg/mL TEV protease in 20 mM sodium phosphate 150 mM NaCl pH 7.4. Samples containing MBP-FUS FL were incubated with TEV protease for 20 min prior to addition of GFP-RNAP CTD.
Samples were spotted onto a glass coverslip and droplet formation was evaluated by imaging with differential interference contrast or using the FITC channel for fluorescence on an Axiovert 200M microscopy (Zeiss). For experiments with 5 μM MBP-FUS FL and variants, the samples were incubated with 0.01 mg/mL in-house TEV protease for 20 min before visualization.
NMR Sample Preparation and NMR Spectroscopy
NMR experiments were recorded at 850 MHz using a Bruker Avance III spectrometer with HCN TCl z-gradient cryoprobes using Topspin 3.5. All experiments were carried out at 25°C in 50 mM MES/Bis-Tris, 150 mM NaCl pH 5.5 unless otherwise noted. All experiments were processed using NMRPipe v10 software package73 and then visualized using NMRFAM-Sparky 1.3 74.
Triple resonance assignment experiments were conducted on 13C,15N-labeled FUS RGG1, RGG2 or RGG3 in 50 mM MES pH 5.5 10% D2Ο at 25°C. 2D 1H-15N HSQC, 2D 1H-13C HSQC, 3D CBCA(CO)NH, 3D HNCACB, 3D HNCO, 3D HN(CA)CO, and 3D HN(CA)NNH were used to achieve sequence specific backbone assignments. Certain regions of the RGG sequences, namely long stretches of glycine repeats, could not be assigned due to severe overlap. Assignment completeness of 65% was achieved for RGG1, 65% for RGG2 and 97% for RGG3. Assignments for RNA polymerase II CTD were transferred from previously published assignments to the 50 mM MES 150 mM NaCl pH 5.5 10% D2Ο at 25°C conditions by overlaying 1H-15N HSQC experiments of wild-type and alanine mutants in both MES and Tris buffers50.
NMR titrations of 15N-labeled FUS SYGQ LC with natural abundance MBP-RGGs or 15N-labeled FUS RGGs with natural abundance MBP-LC were conducted by making individual samples containing 1:0, 1:1, 1:3, or 1:10 of each component. Chemical shifts and intensity ratios were normalized by subtracting the 15N chemical shift values and dividing the signal intensity of the 1:0 condition from all other datasets (except where noted). The same approach was used for addition of natural abundance FUS RGG3 (without an MBP-tag) into 15N RNA polymerase II CTD in the above CTD NMR conditions.
To generate a condensed phase containing 2:1 13C-labeled SYGQ LC and 15N-labeled RGG3, 13C-labeled SYGQ LC and 15N-labeled RGG3 were diluted to 666 μM and 333 μM, respectively, into 50 mM MES 150 mM NaCl pH 3.4 (untitrated) with 10% D2O for a total volume of 1 mL. To generate a condensed phase containing 1:1:1 13C,15N-labeled RNA polymerase II CTD, natural abundance FUS SYGQ LC, and natural abundance FUS RGG3, the proteins were diluted to 333 μM each into 50 mM MES 150 mM NaCl pH 3.4 (untitrated) with 10% D2O for a total volume of 1 mL. Upon dilution, samples immediately phase-separated. The reactions were incubated on ice and centrifuged into a 3 mm NMR tube at 3310 rpm for 10 min at a time at 0-2°C. This process was repeated until the condensed phase reach sufficient volume to fill the NMR coil volume (approximately four to five 1 mL reactions of 1 mM protein). The final samples contained 0.4 M residual urea from the RGG3 and RNA polymerase CTD storage buffer.
Motions of the backbone in the condensed phase were measured at 850 MHz using standard pulse sequences (hsqct1etf3gpsitc3d, hsqct2etf3gpsitc3d, hsqcnoef3gpsi). Delays of 16.5, 264.4, 181.8, 33.1, 115.7, 82.6, 165.3 ms for R2 and 100, 1000, 200, 800, 300, 600, 400 ms for R1 experiments and using an interscan delay of 2.5 s or 1.2 s, respectively. (1H)15N heteronuclear NOE experiments were made up of interleaved sequences with and without proton saturation, with a recycle delay of 5 s (greater than 7 × 15N T1, which is in most cases longer than 1H T1).
Intermolecular NOE-based experiments were recorded on two-component or three-component condensed phase samples. For two-component samples containing 2:1 13C-labeled SYGQ LC and 15N-labeled RGG3, 4D 13C/15N edited 1H-13C-HSQC-NOESY-1H-15N-HSQC (hsqcnoesyhsqccngp4d) experiments were recorded with a mixing time of 250 ms or 100 ms (test experiments for NOE build up curves were performed at 50, 100, 250, 400, and 800 ms) and with 58, 2, 58 and 2048 total points with sweep widths of 56, 10.5, 20, and 10.5 ppm centered at 42, 4.7, 117, and 4.7 ppm for aliphatic regions in the F1 dimension or sweep widths of 150, 10.5, 20, and 10.5 ppm centered at 75, 4.7, 117, and 4.7 ppm for aromatic regions in the F1 dimension. (Note, the indirect 1H dimension was not incremented/collected, resulting in an effective 3D experiment.) For all samples, 3D 13C,15N-filtered/edited NOESY-1H-13C-HSQC (noesyhsqcgpwgx13d) experiments were also recorded with a mixing time of 100 ms or 50 ms and with 128, 60, and 3072 total points with sweep widths of 9, 56, and 10.5 ppm centered at 4.7, 42, and 4.7 ppm for aliphatic regions in the F2 dimension or sweep widths of 9, 56, and 10.5 ppm centered at 4.7, 110, and 4.7 ppm for aromatic regions in the F2 dimension. A 13C/15N edited 1H-13C-HSQC-ROESY-1H-15N-HSQC was created by modifying the corresponding Bruker NOESY sequence (i.e. hsqcnoesyhsqccngp4d) to include adiabatic ramps and spin lock as previously proposed75 and performed with 5 kHz spin lock / mixing for 20 ms.
Simulation Details and analysis
For all-atom simulations, we chose fragments from each domain that were forty-four residues long to allow for sufficient conformational sampling within reasonable timescales (Extended Data Fig. 4). We selected a fragment best representing the amino acid distribution of the SYGQ LC (11-54) within the full SYGQ LC domain in addition to the portion that we previously used which lacks some of the less abundant residue types (120-163) (Extended Data Fig. 4A)19. Similarly, the fragments for RGG1, RGG2 and RGG3 were chosen such that they were the most representative of each RGG sequence. We note that in experiments, the length of the sequences for the SYGQ LC and RGG domains are non-equivalent; therefore, the simulations allow us to compare the interactions between similar length fragments. All-atom simulations were conducted on systems containing FUS SYGQ LC11-54 or SYGQ LC120-163with RGG1220-267, RGG2372-419, RGG3454-501 or RNA polymerase II CTD1853-1896 and RGG3454-501 with RNA polymerase II CTD1853-1896. Simulations were conducted using GROMACS 4.6.7 software package with PLUMED 2.4 plugin76. We used the Amber99SBws-STQ force field with improved residue-specific dihedral corrections65, tip4p/2005 water, and improved salt parameters from Luo and Roux77,78. Simulations were conducted using parallel tempering in the well-tempered ensemble (PT-WTE) with 16 temperature replicas from 300 K to 500 K, each with a metadynamic bias on the potential energy to enhance exchange between adjacent replicas79–81. Single chain simulations were conducted using this PT-WTE scheme, while two chain simulations were conducted using this scheme coupled with a well-tempered metadynamics (WT-MetaD) bias on the interchain vdW contacts between heavy nonpolar atoms (i.e. |q| < 0.25) as we have previously done to improve sampling binding/unbinding events82.
Initial configurations for two-chain simulations of each chain in each replica were randomly generated by CHARMM 46 tool83. Two chains were initially placed 10 Å apart (between any two atomic positions) and solvated in explicit water and ~100 mM NaCl with box size = 8.0 nm. Each replica was equilibrated for 100 ps in NVT and then NPT simulations with parallel tempering for thermal equilibrium. Production simulations were performed for 200 ns, with the first 50 ns discarded as equilibrations, and the last 150 ns used for analysis.
The simulations were analyzed at 300 K as in the experiments. For two-chain simulations, we calculated the free energy surface of the two-chain systems from the metadynamics bias using the built-in function (sum_hills) in PLUMED v2.7.2, and an alternative time-independent method from Tiwary and Parrinello84, then subtract the difference between the two results to generate uncertainties for free energy values. Contact propensities in all-atom two-chain PT-WTE simulations were reweighted based on free energy surface. VdW contacts were considered as any two heavy atoms being within 6 Å of each other. Hydrogen bonds were considered as a donor atom and an acceptor atom being within 3 Å and the donor-hydrogen-acceptor angle being larger than 120°. Sp2/π interactions were calculated as presented by Vernon et al.45 and considered as any two sp2-hybridized groups having at least two pairs of atoms being within 4.9 Å and the angle between the normal axes of the two sp2-planes being less than 60°. Cation-π interactions were considered as a cationic atom being within 7 Å of the center of an aromatic ring and less than 60° from the normal axis of the π face. Salt bridges are considered as a cationic atom and an anionic atom being within 6 Å of each other. Uncertainties in contact propensities were calculated using block error with N = 2 blocks (75 ns each) with reweighting, calculated using the following formula, where the variance (squared of error) is equal to:
where wi is the weights of block i, xi is the contact propensity calculated within block i, is the weighted average contact propensity.
Calculation of NMR spin relaxation parameters from simulated trajectories was performed as previously51,85. Briefly, constant temperature molecular dynamics simulations for each monomer using the same run parameters as above (without enhanced sampling), also in NVT ensemble (T=300 K) were performed, with 12 independent MD simulations for 12 randomly selected initial configurations from the equilibrium ensemble (see above). Each independent simulation is run for 200 ns, yielding a total of 2.4 μs simulation time. Results from dynamics trajectories are presented as mean averaged over 12 independent simulations, and uncertainties are the standard error of the mean calculated from the deviation between 12 simulations.
Extended Data
Extended Data Fig. 1. RGG lysine variants are still capable of LLPS.
A) DIC micrographs of 5 μM MBP-FUS FL WT, RGG1 R9xK, RGG2 R8xK, and RGG3 R10xK after cleavage of the N-terminal MBP solubility tag by addition of TEV protease (left) or in the absence of TEV protease (right) in buffer containing 1 M sodium chloride. Scale bars are 20 μm. B) Turbidity over time of 5 μM MBP-FUS FL WT, RGG1 R9xK, RGG2 R8xK, and RGG3 R10xK after cleavage of the N-terminal MBP solubility tag by addition of TEV protease in buffer containing 1 M sodium chloride over time. The data are blanked to samples lacking TEV protease. Data are plotted as mean ± s.d of measurements from n=3 replicates in one representative data set out of two independent experiments. C) DIC micrographs of 5 μM MBP-FUS FL WT, RGG1 R9xK, RGG2 R8xK, and RGG3 R10xK after cleavage of the N-terminal MBP solubility tag by addition of TEV protease (left) or in the absence of TEV protease (right) in the presence of 1:1 mass equivalents of total yeast RNA. Scale bars are 20 μm. D) Turbidity of 5 μM MBP-FUS FL WT, RGG1 R9xK, RGG2 R8xK, and RGG3 R10xK in the presence of 1:0, 1:1 and 1:2 total yeast RNA over time. The data are blanked to samples lacking TEV protease. Data are plotted as mean mean ± s.d. of measurements from n=3 replicates in one representative data set out of two independent experiments.
Extended Data Fig. 2. The RGG domains weakly interact with the SYGQ LC.
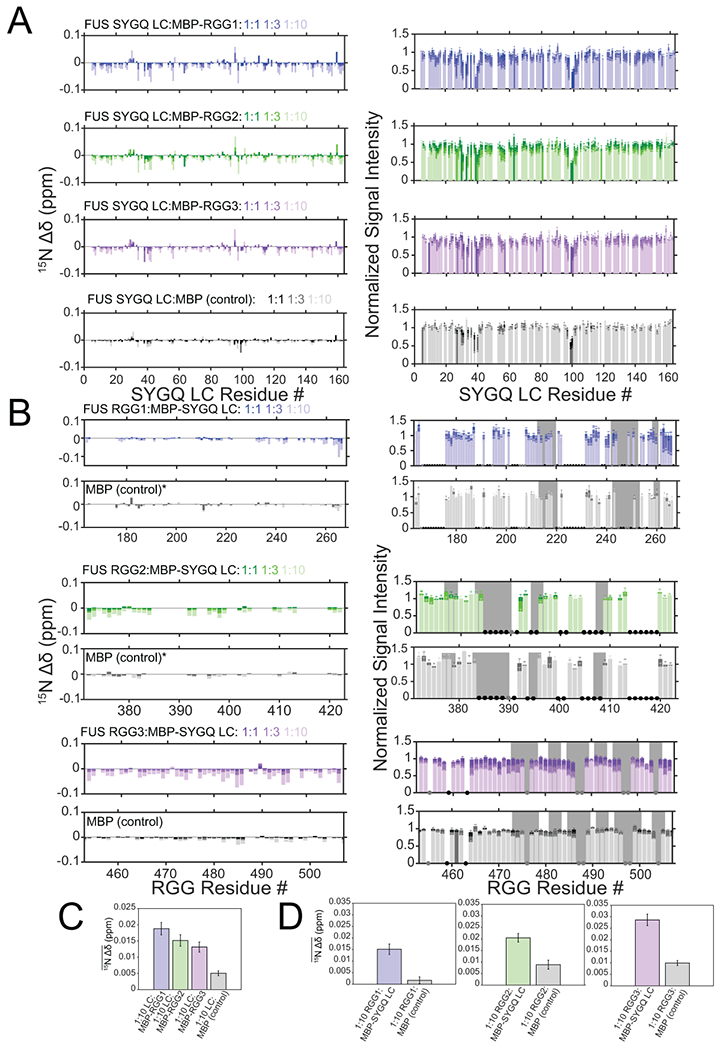
A) 15N chemical shift perturbations and intensity differences of the SYGQ LC in the presence of increasing concentrations of MBP-RGG1, MBP-RGG2, MBP-RGG3 or MBP alone (negative control). Intensity data are normalized to a SYGQ LC alone control and are plotted as mean mean ± s.d. of baseline noise for each spectrum as estimate of uncertainty in one representative data set out of two independent experiments. B) 15N chemical shift perturbations and intensity differences of RGG1, RGG2, or RGG3 with increasing concentrations of MBP-SYGQ LC. The data are relative to RGG1, RGG2 or RGG3 alone controls. The asterisks for the RGG1 and RGG2 titrations with MBP indicate where the data are normalized to the 1:1 condition. Gray bars represent RGG motifs. Black dots correspond to resonances that are unassigned, while gray dots represent resonances that are assigned but not resolved due to overlap. Intensity data are plotted as mean ± s.d. of baseline noise for each spectrum as estimate of uncertainty in one representative data set. C) Average 15N chemical shift perturbations across all positions in SYGQ LC in the presence of ten times excess MBP-RGG1, MBP-RGG2, MBP-RGG3 or MBP alone (negative control) (full data points presented in A). Data are plotted as mean ± s.e.m. in one representative data set out of two independent experiments. D) Average 15N chemical shift perturbations across all positions in RGG1, RGG2 or RGG3 in the presence of ten times excess MBP-SYGQ LC or MBP alone (negative control) (full data points presented in B). Data are plotted as mean ± s.e.m. in one representative data set out of two independent experiments.
Extended Data Fig. 3. Assigned spectra of FUS RGG domains and impact of RGG mutations on weak interactions with SYGQ LC.
A-C) Assigned 1H-15N HSQC spectra of FUS RGG1, RGG2 or RGG3 in the dispersed phase. D) 15N chemical shift perturbations and intensity differences of 30 μM SYGQ LC in the presence of 300 μM of MBP-RGG3 WT, R10xK or R10xS. Intensity data are normalized to a SYGQ LC alone control and are plotted as mean ± s.d. of baseline noise for each spectrum as estimate of uncertainty in one representative data set. E) Average 15N chemical shift perturbations of SYGQ LC in the presence of ten times excess MBP-RGG3 WT, R10xK or R10xS (full data points presented in D). Data are plotted as mean ± s.e.m. in one representative data set. F) 15N transverse relaxation rate constant values for SYGQ LC in the presence of ten times excess of MBP (negative control), MBP-RGG1, MBP-RGG2 or MBP-RGG3. Data are plotted as mean ± propagated best-fit parameter confidence interval equal to 1 s.d in one representative data set.
Extended Data Fig. 4. Composition of fragments used for all-atom simulations.
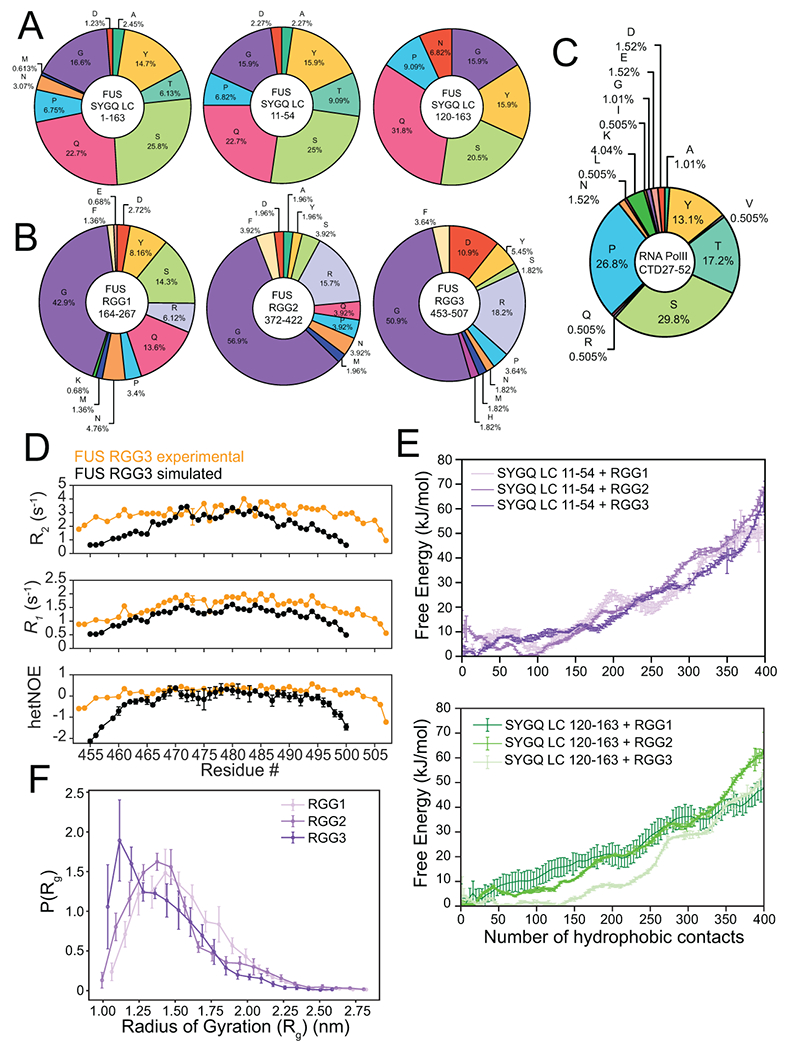
A) Amino acid content of the SYGQ LC and fragments 11-54 and 120-163 used for all-atom simulations. B) Amino acid content of the FUS RGG domains. Fragments used for all-atom simulations (RGG1 220-267, RGG2 372-419 and RGG3 454–501) contain similar amino acid compositions to their experimental counterparts. C) Amino acid content of RNA polymerase C-terminal tail heptads 27-52. D) 15N spin relaxation parameters for FUS RGG3 in the dispersed phase from experiment and simulations. The segments used for simulations are shorter, explaining the discrepancies at the termini. Experimental data are plotted as mean ± propagated best-fit parameter confidence interval equal to 1 s.d in one representative data set of two independent experiments. Simulated data are plotted as mean ± s.e.m of n=12 independent trajectories launched from randomly selected equilibrated ensemble members. E) Free energy landscape as a function of van der Waals contacts formed between hydrophobic atoms in FUS 11-54 or FUS 120-163 and RGG1, RGG2 or RGG3 from simulations. The use of different 44-amino acid fragments of FUS LC in the simulations produces differences in the energy landscapes, suggesting that the amino acid variation between the fragments used can have an impact on the number of contacts. Data are plotted as mean ± s.e.m of n=5 equal divisions of the total data set from one data set with n=16 independent replicas using PTWTE. F) Radius of gyration distribution of three different 44-residue long RGG fragments in single-chain simulations. The differences in compaction within the simulation system reflects the differences in amino acid composition of each RGG fragment. Data are plotted as mean ± s.e.m of n=5 equal divisions of the total data set as in (E).
Extended Data Fig. 5. NOEs within a two-component condensed phase containing FUS SYGQ LC and RGG3.
A) NOE build-up curve (NOE intensity vs mixing time, τm) from 4D HSQC-NOESY-HSQC experiments. No diagonal peaks are present in these HSQC-NOESY-HSQC spectra, so data were collected as one-dimensional experiments and presented here as integration over the resonance envelope. Each experiment was performed once. B) 2D-planes from a 13C-HSQC-NOESY-15N-HSQC experiment recorded with a NOESY mixing time of 50 ms. C) Intermolecular ROEs from SYGQ LC are observed for arginine and other residue types including glycine in the 2-component condensed phase. 2D-projection from a 4D HSQC-NOESY-HSQC (250 ms mixing time; unscaled and scaled to match ROE) and HSQC-ROESY-HSQC (5 kHz spin lock / mixing for 20 ms). ROESY spin lock mixing time was limited due to more rapid transverse relaxation rate as compared to the NOESY mixing time, as the magnetization is longitudinal during the NOE transfer but transverse during the spin-locked ROE transfer. Experiments performed once. D) 1H-13C HSQC of FUS RGG3 in the dispersed phase. E) NOE signal intensity quantification from a 12C-filtered, 13C-edited NOESY-HSQC experiment presented in Figure 3C. Intensity data for one representative experiment are plotted as mean ± s.d. of baseline noise for each plane as estimate of uncertainty in one representative data set.
Extended Data Fig. 6. Contacts between FUS SYGQ LC and RGG domains.
A) Total intermolecular contact propensities from two-chain simulations of SYGQ LC11-54 and RGG1220-267 binned by residue position (left), binned by residue type (center), and binned by residue type and normalized by residue frequency (right). Plots represent the total number of contacts for a particular residue position. Bars represent the total number of contacts for a particular residue type. Residues colored in gray occur in the sequence less than three times. (For A,B,C: Data are plotted as mean ± s.e.m of (left) n=5 equal divisions of the total 16 replica PTWTE data set, (middle) total contact propensities, or (right) normalized total contact propensities from one representative data set out of two independent experiments.) B) Inter-residue contact propensities from two-chain simulations of SYGQ LC11-54 and RGG2372-419 binned by residue position (left), binned by residue type (center), and binned by residue type and normalized by residue frequency (right). Curved plots represent the total contact propensities for each residue. Bars represent the total number of contacts for a particular residue type. Gray bars represent residue types that occur less than three times in the sequence. C) Inter-residue contact propensities from two-chain simulations of SYGQ LC11-54 and RGG3454-501 binned by residue position. Plots represent the total contact propensities for each residue. Corresponding residue typed binned and frequency normalized plots matching middle and right plots, respectively, for B and C) are presented in main text Figure 3 D,E. D) Total sp2/π interactions (left) and normalized by all VdW contacts (right) where all geometries are included (only distance-based definition) in two-chain simulations of SYGQ LC11-54 or SYGQ LC120-163 with RGG1, RGG2 or RGG3. The data are binned for π-π (top, lightest), sp2-π (middle, lighter) and sp2-sp2 (bottom) contacts. Data are plotted as mean ± s.e.m of n=5 equal divisions of the total data set. E,F) Top fifteen interacting amino acid pairs in order of highest to lowest contact frequency (left to right) SYGQ LC11-54 or SYGQ LC120-163 with RGG1 or RGG2. The fraction of pairs showing hydrogen bonds, sp2/π, and cation-π contacts out of the total pairs with van der Waals interactions is indicated.
Extended Data Fig. 7. Contacts within a three-component phase containing FUS SYGQ LC and RGG3 and RNAP2 CTD.
A) Chemical shift perturbations and signal intensity changes for 15N-RNA polymerase II CTD in the presence of increasing concentrations of FUS RGG3. Intensity data are plotted as mean ± s.d. of baseline noise for each spectrum as estimate of uncertainty in one representative data set. B) Free energy landscape of van der Waals contacts between hydrophobic atoms between RNAP2 CTD and FUS SYGQ LC or RGG3 from two-chain simulations. Data are plotted as mean ± s.e.m of n=5 equal divisions of the total data set from one representative data set. C) 1H-15N HSQC of RNA polymerase II CTD in the dispersed (orange) and condensed (green) phases. D) NOE signal intensity quantification from a 12C-filtered, 13C-edited NOESY-HSQC experiment presented in Figure 6B. Intensity data are plotted as mean ± s.d. of baseline noise for each plane as estimate of uncertainty in one representative data set out of two independent experiments. Inter-residue contact propensities from two-chain simulations of RNAP2 CTD1853-1896 and E) FUS SYGQ LC11-54 or F) RGG3 binned by residue position. Plots represent the total number of contacts for a particular residue position. Data are plotted as mean ± s.e.m of n=5 equal divisions of the total data set from one representative data set.
Supplementary Material
Acknowledgements
We thank Mandar Naik for helpful advice and assistance with NMR spectroscopy and Veronica Ryan for helpful discussions. We thank Jinfa Ying for creating the HSQC-ROESY-HSCQ experiment. Research was supported in part by NIGMS R01GM118530 (to N.L.F.), NIGMS R01GM120537 (to J.M.), Human Frontier Science Program RGP0045/2018 (to N.L.F). A.C.M. was supported in part by NIGMS training grant to the MCB graduate program at Brown University (T32GM007601) and NSF graduate fellowship (1644760, to A.C.M.). Use of the high-performance computing capabilities of the Extreme Science and Engineering Discovery Environment (XSEDE), which is supported by the NSF grant TG-MCB-120014, is gratefully acknowledged. The content is solely the responsibility of the authors and does not necessarily represent the official views of the funding agencies.
Footnotes
Competing interests statement
N.L.F. is a member of the Scientific Advisory Board of Dewpoint Therapeutics LLC. A.C.M. is currently employed by Genentech. The authors declare no other competing interests.
Code Availability
Simulation software described in Methods section are publicly available and can be found at http://www.gromacs.org/ for the atomistic resolution simulations.
Statistics.
Details of the statistics including number of observations are indicated in the figure legends.
Data Availability
Chemical shift assignments for the RGG domains can be accessed using the BMRB accession 51067, 51068, 51069. Raw NMR data files can be found at https://doi.org/10.6084/m9.figshare.16598861. All other data are available from the corresponding author upon reasonable request.
References
- 1.Brangwynne CP, Mitchison TJ & Hyman AA Active liquid-like behavior of nucleoli determines their size and shape in Xenopus laevis oocytes. Proc. Natl. Acad. Sci 108, 4334–4339 (2011). [DOI] [PMC free article] [PubMed] [Google Scholar]
- 2.Feric M et al. Coexisting Liquid Phases Underlie Nucleolar Subcompartments. Cell 1–12 (2016). doi: 10.1016/j.cell.2016.04.047 [DOI] [PMC free article] [PubMed] [Google Scholar]
- 3.Strom AR et al. Phase separation drives heterochromatin domain formation. Nature 547, 241–245 (2017). [DOI] [PMC free article] [PubMed] [Google Scholar]
- 4.Chong S et al. Imaging dynamic and selective low-complexity domain interactions that control gene transcription. Science (80-. ). 361, (2018). [DOI] [PMC free article] [PubMed] [Google Scholar]
- 5.Boija A et al. Transcription Factors Activate Genes through the Phase-Separation Capacity of Their Activation Domains. Cell 175, 1842–1855.e16 (2018). [DOI] [PMC free article] [PubMed] [Google Scholar]
- 6.Cho WK et al. Mediator and RNA polymerase II clusters associate in transcription-dependent condensates. Science (80-. ). 361, 412–415 (2018). [DOI] [PMC free article] [PubMed] [Google Scholar]
- 7.Sabari BR et al. Coactivator condensation at super-enhancers links phase separation and gene control. Science (80-. ). 361, eaar3958 (2018). [DOI] [PMC free article] [PubMed] [Google Scholar]
- 8.Svetoni F, Frisone P & Paronetto MP Role of FET proteins in neurodegenerative disorders. RNA Biology 13, 1089–1102 (2016). [DOI] [PMC free article] [PubMed] [Google Scholar]
- 9.Hoell JI et al. RNA targets of wild-type and mutant FET family proteins. Nat. Struct. Mol. Biol 18, 1428–1431 (2011). [DOI] [PMC free article] [PubMed] [Google Scholar]
- 10.Kapeli K et al. Distinct and shared functions of ALS-associated proteins TDP-43, FUS and TAF15 revealed by multisystem analyses. Nat. Commun 7, (2016). [DOI] [PMC free article] [PubMed] [Google Scholar]
- 11.Loughlin FE et al. The Solution Structure of FUS Bound to RNA Reveals a Bipartite Mode of RNA Recognition with Both Sequence and Shape Specificity. Mol. Cell 73, 490–504.e6 (2019). [DOI] [PubMed] [Google Scholar]
- 12.Schwartz JC, Wang X, Podell ER & Cech TR RNA Seeds Higher-Order Assembly of FUS Protein. Cell Rep. 5, 918–925 (2013). [DOI] [PMC free article] [PubMed] [Google Scholar]
- 13.Shelkovnikova TA, Robinson HK, Southcombe JA, Ninkina N & Buchman VL Multistep process of FUS aggregation in the cell cytoplasm involves RNA-dependent and RNA-independent mechanisms. Hum. Mol. Genet 23, 5211–5226 (2014). [DOI] [PMC free article] [PubMed] [Google Scholar]
- 14.Burke KA, Janke AM, Rhine CL & Fawzi NL Residue-by-Residue View of In Vitro FUS Granules that Bind the C-Terminal Domain of RNA Polymerase II. Mol. Cell 60, 231–241 (2015). [DOI] [PMC free article] [PubMed] [Google Scholar]
- 15.Kato M et al. Cell-free formation of RNA granules: Low complexity sequence domains form dynamic fibers within hydrogels. Cell 149, 753–767 (2012). [DOI] [PMC free article] [PubMed] [Google Scholar]
- 16.Murakami T et al. ALS/FTD Mutation-Induced Phase Transition of FUS Liquid Droplets and Reversible Hydrogels into Irreversible Hydrogels Impairs RNP Granule Function. Neuron 88, 678–690 (2015). [DOI] [PMC free article] [PubMed] [Google Scholar]
- 17.Sun Z et al. Molecular determinants and genetic modifiers of aggregation and toxicity for the als disease protein fus/tls. PLoS Biol. 9, e1000614 (2011). [DOI] [PMC free article] [PubMed] [Google Scholar]
- 18.Patel A et al. A Liquid-to-Solid Phase Transition of the ALS Protein FUS Accelerated by Disease Mutation. Cell 162, 1066–1077 (2015). [DOI] [PubMed] [Google Scholar]
- 19.Murthy AC et al. Molecular interactions underlying liquid–liquid phase separation of the FUS low-complexity domain. Nat. Struct. Mol. Biol 26, 637–648 (2019). [DOI] [PMC free article] [PubMed] [Google Scholar]
- 20.Martin EW et al. Valence and patterning of aromatic residues determine the phase behavior of prion-like domains. Science (80-. ). 367, 694–699 (2020). [DOI] [PMC free article] [PubMed] [Google Scholar]
- 21.Yoshizawa T et al. Nuclear Import Receptor Inhibits Phase Separation of FUS through Binding to Multiple Sites. Cell 173, 693–705 (2018). [DOI] [PMC free article] [PubMed] [Google Scholar]
- 22.Kang J, Lim L, Lu Y & Song J A unified mechanism for LLPS of ALS/FTLD-causing FUS as well as its modulation by ATP and oligonucleic acids. PLOS Biol. 17, e3000327 (2019). [DOI] [PMC free article] [PubMed] [Google Scholar]
- 23.Qamar S et al. FUS Phase Separation Is Modulated by a Molecular Chaperone and Methylation of Arginine Cation-π Interactions. Cell 173, 720–734.e15 (2018). [DOI] [PMC free article] [PubMed] [Google Scholar]
- 24.Bogaert E et al. Molecular Dissection of FUS Points at Synergistic Effect of Low-Complexity Domains in Toxicity. Cell Rep. 24, 529–537.e4 (2018). [DOI] [PMC free article] [PubMed] [Google Scholar]
- 25.Hofweber M et al. Phase Separation of FUS Is Suppressed by Its Nuclear Import Receptor and Arginine Methylation. Cell 173, 706–719.e13 (2018). [DOI] [PubMed] [Google Scholar]
- 26.Wang J et al. A Molecular Grammar Governing the Driving Forces for Phase Separation of Prion-like RNA Binding Proteins. Cell 174, 688–699.e16 (2018). [DOI] [PMC free article] [PubMed] [Google Scholar]
- 27.Brady JP et al. Structural and hydrodynamic properties of an intrinsically disordered region of a germ cell-specific protein on phase separation. Proc. Natl. Acad. Sci. U. S. A 114, E8194–E8203 (2017). [DOI] [PMC free article] [PubMed] [Google Scholar]
- 28.Schuster BS et al. Identifying sequence perturbations to an intrinsically disordered protein that determine its phase-separation behavior. Proc. Natl. Acad. Sci. U. S. A 117, 11421–11431 (2020). [DOI] [PMC free article] [PubMed] [Google Scholar]
- 29.Bremer A et al. Deciphering how naturally occurring sequence features impact the phase behaviors of disordered prion-like domains. bioRxiv 2021.01.01.425046 (2021). doi: 10.1101/2021.01.01.425046 [DOI] [PMC free article] [PubMed] [Google Scholar]
- 30.Schwartz JC et al. FUS binds the CTD of RNA polymerase II and regulates its phosphorylation at Ser2. Genes Dev. 26, 2690–2695 (2012). [DOI] [PMC free article] [PubMed] [Google Scholar]
- 31.Kwon I et al. Phosphorylation-regulated binding of RNA polymerase II to fibrous polymers of low-complexity domains. Cell 155, 1049 (2013). [DOI] [PMC free article] [PubMed] [Google Scholar]
- 32.Zinszner H, Albalat R & Ron D A novel effector domain from the RNA-binding protein TLS or EWS is required for oncogenic transformation by CHOP. Genes Dev. 8, 2513–2526 (1994). [DOI] [PubMed] [Google Scholar]
- 33.Ichikawa H, Shimizu K, Hayashi Y & Ohki M An RNA-binding protein gene, TLS/FUS, is fused to ERG in human myeloid leukemia with t(16;21) chromosomal translocation. Cancer Res. 54, 2865–8 (1994). [PubMed] [Google Scholar]
- 34.Wei M-T, Chang Y-C, Shimobayashi SF, Shin Y, Strom AR & Brangwynne CP Nucleated transcriptional condensates amplify gene expression. Nature Cell Biology 22, 1187–1196 (2020). [DOI] [PubMed] [Google Scholar]
- 35.Lu F, Portz B & Gilmour DS The C-Terminal Domain of RNA Polymerase II Is a Multivalent Targeting Sequence that Supports Drosophila Development with Only Consensus Heptads. Mol. Cell 73, 1232–1242 (2019). [DOI] [PMC free article] [PubMed] [Google Scholar]
- 36.Boehning M et al. RNA polymerase II clustering through carboxy-terminal domain phase separation. Nat. Struct. Mol. Biol 25, 833–840 (2018). [DOI] [PubMed] [Google Scholar]
- 37.Monahan Z et al. Phosphorylation of the FUS low-complexity domain disrupts phase separation, aggregation, and toxicity. EMBO J. 36, 2951–2967 (2017). [DOI] [PMC free article] [PubMed] [Google Scholar]
- 38.Alshareedah I et al. Interplay Between Short-range Attraction and Long-range Repulsion Controls Reentrant Liquid Condensation of Ribonucleoprotein-RNA Complexes. J. Am. Chem. Soc jacs.9b03689 (2019). doi: 10.1021/jacs.9b03689 [DOI] [PMC free article] [PubMed] [Google Scholar]
- 39.Banerjee PR, Milin AN, Moosa MM, Onuchic PL & Deniz AA Reentrant Phase Transition Drives Dynamic Substructure Formation in Ribonucleoprotein Droplets. Angew. Chemie - Int. Ed 56, 11354–11359 (2017). [DOI] [PMC free article] [PubMed] [Google Scholar]
- 40.Ukmar-Godec T et al. Lysine/RNA-interactions drive and regulate biomolecular condensation. Nat. Commun 10, 2909 (2019). [DOI] [PMC free article] [PubMed] [Google Scholar]
- 41.Murthy AC & Fawzi NL The (un)structural biology of biomolecular liquid-liquid phase separation using NMR spectroscopy. J. Biol. Chem jbc.REV119.009847 (2020). doi: 10.1074/jbc.rev119.009847 [DOI] [PMC free article] [PubMed] [Google Scholar]
- 42.Kay LE, Torchia DA & Bax A Backbone Dynamics of Proteins As Studied by 15N Inverse Detected Heteronuclear NMR Spectroscopy: Application to Staphylococcal Nuclease. Biochemistry 28, 8972–8979 (1989). [DOI] [PubMed] [Google Scholar]
- 43.Fawzi NL, Ying J, Torchia DA & Clore GM Kinetics of amyloid β monomer-to-oligomer exchange by NMR relaxation. J. Am. Chem. Soc 132, 9948–9951 (2010). [DOI] [PMC free article] [PubMed] [Google Scholar]
- 44.Neuhaus D; Williamson MP The Nuclear Overhauser Effect in Structural and Conformational Analysis. (WILEY-VCH, New York, 2000). [Google Scholar]
- 45.Vernon RM et al. Pi-Pi contacts are an overlooked protein feature relevant to phase separation. Elife 7, (2018). [DOI] [PMC free article] [PubMed] [Google Scholar]
- 46.Chong PA, Vernon RM & Forman-Kay JD RGG/RG Motif Regions in RNA Binding and Phase Separation. Journal of Molecular Biology 430, 4650–4665 (2018). [DOI] [PubMed] [Google Scholar]
- 47.Zerze GH, Best RB & Mittal J Sequence- and Temperature-Dependent Properties of Unfolded and Disordered Proteins from Atomistic Simulations. J. Phys. Chem. B 119, 14622–14630 (2015). [DOI] [PMC free article] [PubMed] [Google Scholar]
- 48.Kjaergaard M et al. Temperature-dependent structural changes in intrinsically disordered proteins: Formation of α–helices or loss of polyproline II? Protein Sci. 19, 1555–1564 (2010). [DOI] [PMC free article] [PubMed] [Google Scholar]
- 49.Wuttke R et al. Temperature-dependent solvation modulates the dimensions of disordered proteins. Proc. Natl. Acad. Sci 111, 5213–5218 (2014). [DOI] [PMC free article] [PubMed] [Google Scholar]
- 50.Janke AM et al. Lysines in the RNA Polymerase II C-Terminal Domain Contribute to TAF15 Fibril Recruitment. Biochemistry 57, 2549–2563 (2018). [DOI] [PMC free article] [PubMed] [Google Scholar]
- 51.Fawzi L, et al N. Structure and Dynamics of the Aβ21–30 Peptide from the Interplay of NMR Experiments and Molecular Simulations. J. Am. Chem. Soc 130, 6145–6158 (2008). [DOI] [PMC free article] [PubMed] [Google Scholar]
- 52.Nott TJ et al. Phase Transition of a Disordered Nuage Protein Generates Environmentally Responsive Membraneless Organelles. Mol. Cell 57, 936–947 (2015). [DOI] [PMC free article] [PubMed] [Google Scholar]
- 53.Tsang B et al. Phosphoregulated FMRP phase separation models activity-dependent translation through bidirectional control of mRNA granule formation. Proc. Natl. Acad. Sci 116, 4218–4227 (2019). [DOI] [PMC free article] [PubMed] [Google Scholar]
- 54.Ryan VH et al. Mechanistic View of hnRNPA2 Low-Complexity Domain Structure, Interactions, and Phase Separation Altered by Mutation and Arginine Methylation. Mol. Cell 69, 465–479.e7 (2018). [DOI] [PMC free article] [PubMed] [Google Scholar]
- 55.Gibbs EB, Cook EC & Showalter SA Application of NMR to studies of intrinsically disordered proteins. Arch. Biochem. Biophys 628, 57–70 (2017). [DOI] [PubMed] [Google Scholar]
- 56.Gibbs E, Perrone B, Hassan A, Kümmerle R & Kriwacki R NPM1 Exhibits Structural and Dynamic Heterogeneity upon Phase Separation with the p14ARF Tumor Suppressor. J. Magn. Reson 310, 106646 (2020). [DOI] [PMC free article] [PubMed] [Google Scholar]
- 57.Reichheld SE, Muiznieks LD, Keeley FW & Sharpe S Direct observation of structure and dynamics during phase separation of an elastomeric protein. Proc. Natl. Acad. Sci 114, E4408–E4415 (2017). [DOI] [PMC free article] [PubMed] [Google Scholar]
- 58.Kim TH et al. Phospho-dependent phase separation of FMRP and CAPRIN1 recapitulates regulation of translation and deadenylation. Science (80-. ). 365, 825–829 (2019). [DOI] [PubMed] [Google Scholar]
- 59.Kim TH et al. Interaction hot spots for phase separation revealed by NMR studies of a CAPRIN1 condensed phase. Proc. Natl. Acad. Sci. U. S. A 118, (2021). [DOI] [PMC free article] [PubMed] [Google Scholar]
- 60.Wong LE, Kim TH, Muhandiram DR, Forman-Kay JD & Kay LE NMR Experiments for Studies of Dilute and Condensed Protein Phases: Application to the Phase-Separating Protein CAPRIN1. J. Am. Chem. Soc 142, 2471–2489 (2020). [DOI] [PubMed] [Google Scholar]
- 61.Dignon GL, Zheng W, Kim YC, Best RB & Mittal J Sequence determinants of protein phase behavior from a coarse-grained model. PLoS Comput. Biol 14, e1005941 (2018). [DOI] [PMC free article] [PubMed] [Google Scholar]
- 62.Das S, Lin YH, Vernon RM, Forman-Kay JD & Chan HS Comparative roles of charge, π, and hydrophobic interactions in sequence-dependent phase separation of intrinsically disordered proteins. Proc. Natl. Acad. Sci. U. S. A 117, 28795–28805 (2020). [DOI] [PMC free article] [PubMed] [Google Scholar]
- 63.Paloni M, Bailly R, Ciandrini L & Barducci A Unraveling Molecular Interactions in Liquid-Liquid Phase Separation of Disordered Proteins by Atomistic Simulations. J. Phys. Chem. B 124, 9009–9016 (2020). [DOI] [PubMed] [Google Scholar]
- 64.Vitalis A & Pappu RV ABSINTH: A new continuum solvation model for simulations of polypeptides in aqueous solutions. J. Comput. Chem 30, 673–699 (2009). [DOI] [PMC free article] [PubMed] [Google Scholar]
- 65.Tang WS, Fawzi NL & Mittal J Refining All-Atom Protein Force Fields for Polar-Rich, Prion-like, Low-Complexity Intrinsically Disordered Proteins. J. Phys. Chem. B 124, 9505–9512 (2020). [DOI] [PMC free article] [PubMed] [Google Scholar]
- 66.Zerze GH, Zheng W, Best RB & Mittal J Evolution of All-Atom Protein Force Fields to Improve Local and Global Properties. J. Phys. Chem. Lett 10, 2227–2234 (2019). [DOI] [PMC free article] [PubMed] [Google Scholar]
- 67.Shea J-E, Best RB & Mittal J Physics-based computational and theoretical approaches to intrinsically disordered proteins. Curr. Opin. Struct. Biol 67, (2021). [DOI] [PMC free article] [PubMed] [Google Scholar]
- 68.Turupcu A, Tirado-Rives J & Jorgensen WL Explicit Representation of Cation−π Interactions in Force Fields with 1/r4 Nonbonded Terms. J. Chem. Theory Comput 16, 7184–7194 (2020). [DOI] [PMC free article] [PubMed] [Google Scholar]
- 69.Ambadipudi S, Biernat J, Riedel D, Mandelkow E & Zweckstetter M Liquid-liquid phase separation of the microtubule-binding repeats of the Alzheimer-related protein Tau. Nat. Commun 8, 275 (2017). [DOI] [PMC free article] [PubMed] [Google Scholar]
- 70.Ambadipudi S, Reddy JG, Biernat J, Mandelkow E & Zweckstetter M Residue-specific identification of liquid phase separation hot spots of the Alzheimer’s disease-related protein Tau. Chem. Sci 10, 6503–6507 (2019). [DOI] [PMC free article] [PubMed] [Google Scholar]
- 71.Guo YE et al. Pol II phosphorylation regulates a switch between transcriptional and splicing condensates. Nature 572, 543–548 (2019). [DOI] [PMC free article] [PubMed] [Google Scholar]
- 72.Lu H et al. Phase-separation mechanism for C-terminal hyperphosphorylation of RNA polymerase II. Nature 558, 318–323 (2018). [DOI] [PMC free article] [PubMed] [Google Scholar]
- 73.Delaglio F et al. NMRPipe: A multidimensional spectral processing system based on UNIX pipes. J. Biomol. NMR 6, 277–293 (1995). [DOI] [PubMed] [Google Scholar]
- 74.Lee W, Tonelli M & Markley JL NMRFAM-SPARKY: Enhanced software for biomolecular NMR spectroscopy. Bioinformatics 31, 1325–1327 (2015). [DOI] [PMC free article] [PubMed] [Google Scholar]
- 75.Thiele CM, Petzold K & Schleucher J EASY ROESY: Reliable cross-peak integration in adiabatic symmetrized ROESY. Chem. - A Eur. J 15, 585–588 (2009). [DOI] [PubMed] [Google Scholar]
- 76.Hess B, Kutzner C, Van Der Spoel D & Lindahl E GRGMACS 4: Algorithms for highly efficient, load-balanced, and scalable molecular simulation. J. Chem. Theory Comput 4, 435–447 (2008). [DOI] [PubMed] [Google Scholar]
- 77.Abascal JLF & Vega C A general purpose model for the condensed phases of water: TIP4P/2005. J. Chem. Phys 123, 234505 (2005). [DOI] [PubMed] [Google Scholar]
- 78.Luo Y & Roux B Simulation of osmotic pressure in concentrated aqueous salt solutions. J. Phys. Chem. Lett 1, 183–189 (2010). [Google Scholar]
- 79.Sugita Y & Okamoto Y Replica-exchange molecular dynamics method for protein folding. Chem. Phys. Lett 314, 141–151 (1999). [Google Scholar]
- 80.Bonomi M & Parrinello M Enhanced sampling in the well-tempered ensemble. Phys. Rev. Lett 104, 1–4 (2010). [DOI] [PubMed] [Google Scholar]
- 81.Barducci A, Bussi G & Parrinello M Well-tempered metadynamics: A smoothly converging and tunable free-energy method. Phys. Rev. Lett 100, (2008). [DOI] [PubMed] [Google Scholar]
- 82.Dignon GL, Zheng W, Best RB, Kim YC & Mittal J Relation between single-molecule properties and phase behavior of intrinsically disordered proteins. Proc. Natl. Acad. Sci 115, 9929–9934 (2018). [DOI] [PMC free article] [PubMed] [Google Scholar]
- 83.Brooks BR et al. CHARMM: The biomolecular simulation program. J. Comput. Chem 30, 1545–1614 (2009). [DOI] [PMC free article] [PubMed] [Google Scholar]
- 84.Tiwary P & Parrinello M A time-independent free energy estimator for metadynamics. J. Phys. Chem. B 119, 736–742 (2015). [DOI] [PubMed] [Google Scholar]
Associated Data
This section collects any data citations, data availability statements, or supplementary materials included in this article.
Supplementary Materials
Data Availability Statement
Chemical shift assignments for the RGG domains can be accessed using the BMRB accession 51067, 51068, 51069. Raw NMR data files can be found at https://doi.org/10.6084/m9.figshare.16598861. All other data are available from the corresponding author upon reasonable request.