

Abstract
While many diseases of aging have been linked to the immunological system, immune metrics capable of identifying the most at-risk individuals are lacking. From the blood immunome of 1,001 individuals aged 8–96 years, we developed a deep-learning method based on patterns of systemic age-related inflammation. The resulting inflammatory clock of aging (iAge) tracked with multimorbidity, immunosenescence, frailty and cardiovascular aging, and is also associated with exceptional longevity in centenarians. The strongest contributor to iAge was the chemokine CXCL9, which was involved in cardiac aging, adverse cardiac remodeling and poor vascular function. Furthermore, aging endothelial cells in human and mice show loss of function, cellular senescence and hallmark phenotypes of arterial stiffness, all of which are reversed by silencing CXCL9. In conclusion, we identify a key role of CXCL9 in age-related chronic inflammation and derive a metric for multimorbidity that can be utilized for the early detection of age-related clinical phenotypes.
The important role of the immune system in the maintenance of human health and protection against infections has been recognized for over a hundred years. However, it was only in the past few decades that it has become apparent that inflammatory components of the immune system are often chronically elevated in aged individuals and associated with an increased incidence of cancer, cardiovascular disease, neurodegenerative disorders and others1–3. From these observations, it has been postulated that inflammation plays a critical role in regulating physiological aging4,5. Furthermore, the well-established nine hallmarks of aging6: (1) genomic instability, (2) shortening telomere length, (3) epigenetic modifications, (4) loss of proteostasis, (5) deregulated nutrient sensing, (6) mitochondrial dysfunction, (7) cellular senescence, (8) stem cell exhaustion and (9) altered intracellular communication, have all been shown to be linked to sustained systemic inflammation7–16.
Contrary to the acute response, which is typically triggered by infection, chronic and systemic inflammation is thought to be triggered by physical, chemical or metabolic stimuli (‘sterile’ agents) such as those released by damaged cells and environmental insults, generally termed ‘damage-associated molecular patterns’ (DAMPs). This type of inflammation is associated with aging and is characterized by being low-grade and persistent, ultimately leading to collateral damage to tissues and organs1,17. Despite the importance of this type of inflammatory reaction, there are currently no standard biomarkers to characterize a chronic inflammatory state and studies have generally yielded conflicting results18,19.
Recent work from our group identified a cellular composite metric for immune aging (IMM-AGE), which was strongly associated with all-cause mortality16. Here, we have extended our studies to focus on soluble immune biomarkers and define the relationship between systemic chronic inflammation and disease. We set out to establish a broad survey of immunity in over 1,000 individuals (the Stanford 1000 Immunomes Project (1KIP)), wherein biological samples from 1,001 individuals were obtained between 2007 and 2016 and comprehensively measured in a single facility, the Stanford Human Immune Monitoring Center (HIMC). At this center, peripheral blood specimens were processed and analyzed using multiple technological platforms for gene expression, serum cytokine level, cell subset composition, cellular responses to multiple stimuli and seropositivity to cytomegalovirus (CMV) infection. For 902 individuals, a comprehensive health assessment using a 53-feature clinical questionnaire was also obtained.
Given the well-established importance of chronic inflammation for many human diseases and the lack of standard measures20, we used deep-learning methods on blood immune biomarkers to construct a metric for age-related chronic inflammation (iAge). iAge predicts important aging phenotypes and provides insights into the mechanisms leading to vascular aging. In addition, this metric was associated with exceptional longevity and with all-cause mortality in the Framingham Heart Study. We demonstrate that the most robust contributor to iAge, the interferon (IFN)-related chemokine CXCL9, was associated with an upregulation of multiple inflammatory pathway genes, downregulation of proliferation pathways and endothelial cellular senescence. Moreover, CXCL9 suppressed vascular function in aortic tissue from mice and correlated with subclinical cardiac remodeling and arterial stiffness in a validation study of healthy older adults.
Therefore, we have identified a metric for systemic chronic age-related sterile inflammation which tracks with multiple disease phenotypes in multiple cohorts and thus, could be used as a metric for healthy versus unhealthy aging. Our results also demonstrate a link between inflammatory molecules of the immune system and vascular biology.
Results
Study design of the Stanford 1000 Immunomes project.
Between 2007 and 2016, blood samples were drawn from ambulatory participants (n = 1,001) (339 males and 662 females) aged 8 to 96 years (Extended Data Figs. 1 and 2) who had been recruited at Stanford University (Stanford 1KIP) for a longitudinal study of aging and vaccination5,21–29 and for an independent study of chronic fatigue syndrome30. Only healthy controls were included (Methods). For all samples of the Stanford 1KIP, deep immune phenotyping was conducted at the Stanford HIMC, where peripheral blood specimens were processed and analyzed using rigorously standardized procedures31. Serum samples were obtained and used for protein content determination (including a total of 50 cytokines, chemokines and growth factors) (n = 1,001) and to assess CMV status (n = 748), a major determinant of immune system variation22,25. Peripheral blood mononuclear cells (PBMCs) or whole-blood samples were used for the determination of gene expression (n = 397), cellular phenotypes and frequencies (n = 935) and for investigation of in vitro cellular responses to a variety of cytokine stimulations (n = 818). Extended clinical report forms were collected from 902 out of 1,001 individuals, of which 299 were males and 603 were females (Extended Data Fig. 1). A total of 37 additional older adults (19 centenarians and 18 control participants) from Bologna, Italy, were included and screened for serum proteins to derive iAge on these extremely long-lived humans.
Deep-learning analysis of circulating immune biomarkers.
Given the increasingly recognized effect of systemic chronic inflammation in the development of a wide variety of diseases associated with aging, especially in cardiovascular disease5,32, we set out to construct a metric for age-related chronic inflammation that could summarize an individual’s inflammatory burden. We undertook an unbiased approach to compactly represent the nonlinear structure of the cytokine network. To do so, we developed a deep-learning method called guided auto-encoder (GAE). The GAE method is a type of deep neural network that utilizes nonlinear equations and effectively eliminates noise and redundancy in data, yet retaining the most relevant biological information from circulating immune protein data.
To test the robustness and quality of the GAE method, we compared the accuracy of GAE against other widely used dimensionality reduction methods that use linear equations, such as the Elastic Net, Gradient Boosting Decision Tree (GBDT) and principal-component analysis (PCA), as well as those involving nonlinear equations, such as plain auto-encoders and neural networks (Extended Data Fig. 3a–c). We employed fivefold cross validation and measured the predictive performances of each method on the test set. Overall, the GAE method utilized (a two-layer fully connected neural network with five nodes in each layer) outperformed other methods in predicting chronological age (cAge) (P < 0.05) with the exception of the classic neural network (P = 0.54) (Extended Data Fig. 3b). The average reconstruction errors on the test set for prediction of age and circulating immune protein data were 15.2 years and 0.26 (normalized), respectively. These results indicate that the phenomenon of low-grade chronic inflammation in aging humans is best modeled using nonlinear methods, which take into account network structure and redundancy in immunological protein biomarkers. This metric for chronic inflammation accurately predicts cAge in the population (Fig. 1a) using the total inflammatory burden as measured by the level of circulating immune proteins (Extended Data Fig. 4).
Fig. 1 |. The inflammatory clock of aging tracks with multimorbidity, frailty and exceptional longevity.
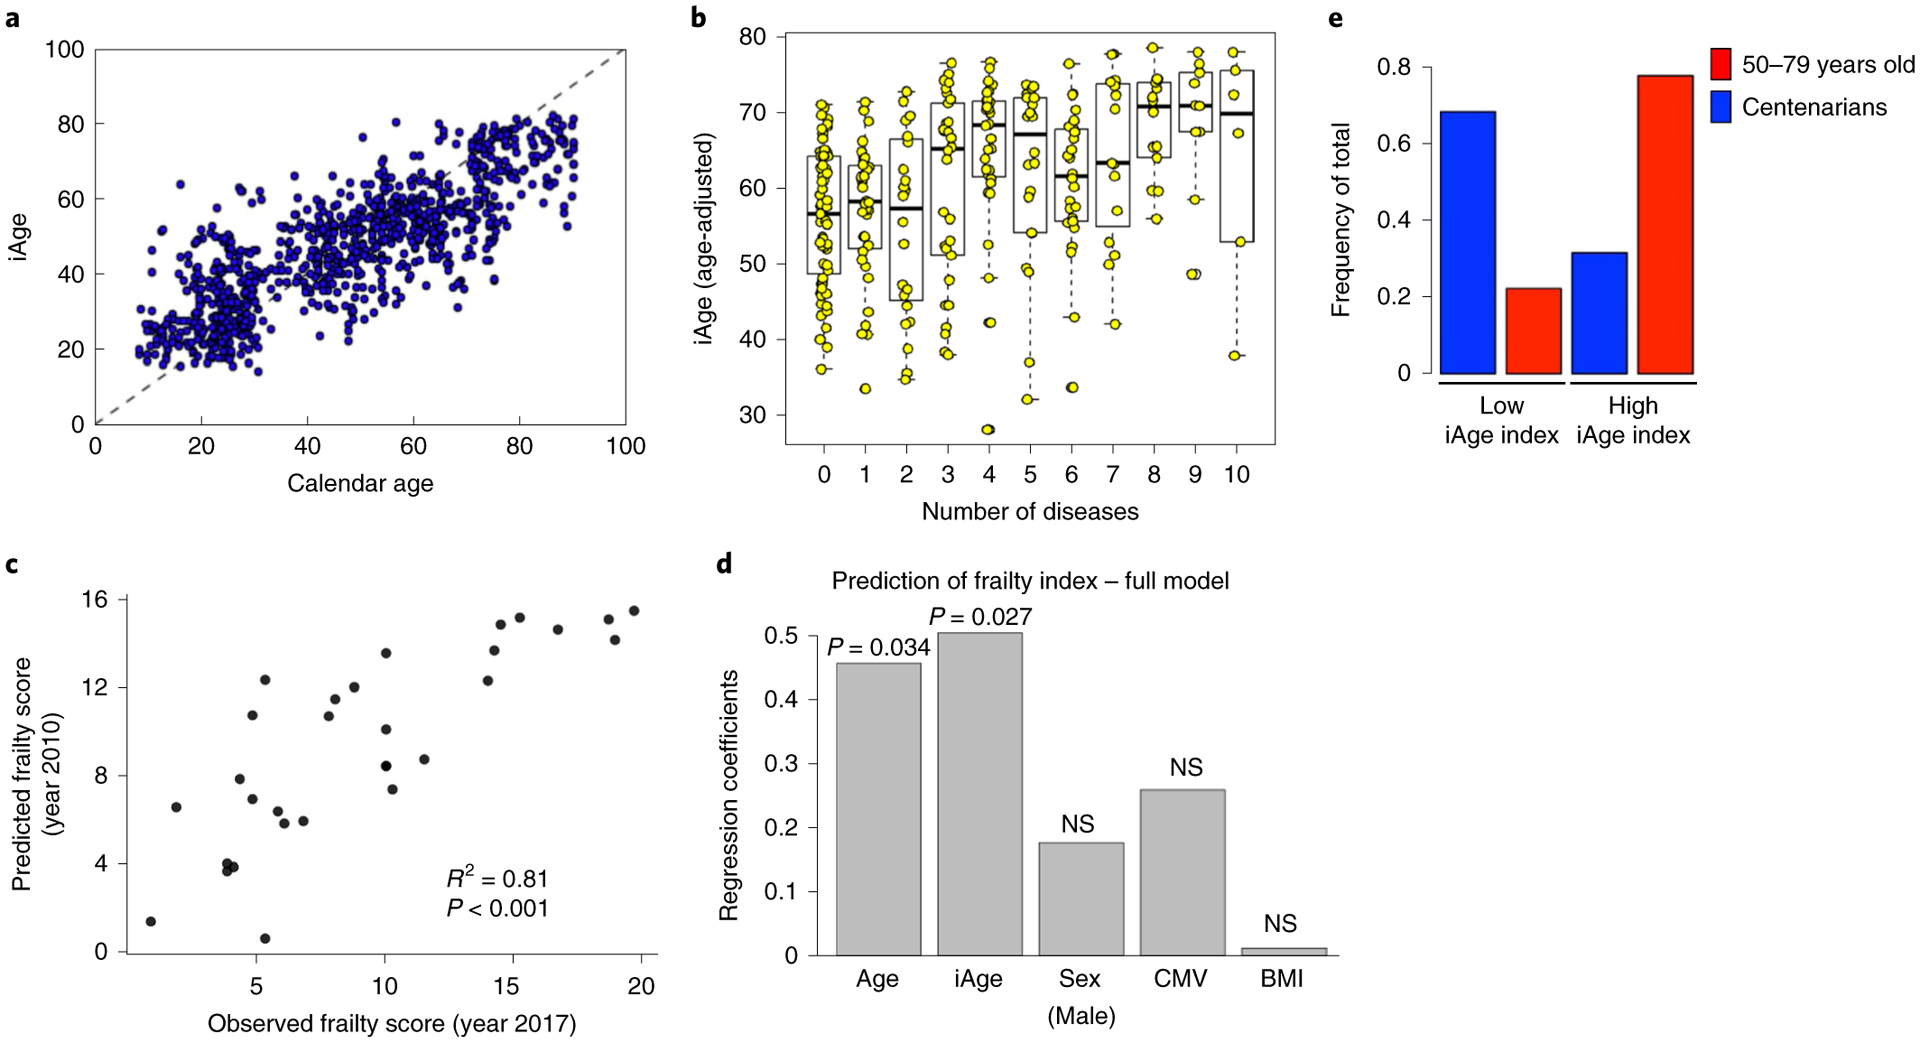
a, Using a GAE method on 50 circulating immune proteins, we derived iAge to predict cAge. Ten age-related disease items were selected to characterize the clinical significance of iAge. The items analyzed included different diseases and physiological systems: cancer, cardiovascular, respiratory, gastrointestinal, urologic, neurologic, endocrine–metabolic, musculoskeletal, genital–reproductive and psychiatric. All these disease features were binary. b, After adjusting for covariates, iAge was significantly correlated with multimorbidity in the older population analyzed (>60 years old, n = 285) (boxes represent 25th and 75th percentiles around the median (line); whiskers represent 1.5× interquartile range). c, For a subset of older adults (n = 29), frailty was assessed in 2017 using a modified frailty score (Methods). iAge measured in 2010 predicted the frailty score 7 years in advance. d, We applied linear regression where predicted frailty scores from 2010 were regressed onto observed frailty scores from 2017. Correlation coefficient (R2) and P value of F-test of overall significance are reported. iAge was shown to be better than calendar age (P < 0.05 by likelihood ratio test for model comparison). P values are derived from univariate linear regression and inferential statistics where the P value for the independent variable tests the null hypothesis that the variable has no correlation with the dependent variable. NS, not significant. e, Comparison of the inflammatory index (rank cAge minus rank iAge) was computed between a healthy group of older adults (n = 18, age range 50–79 years) and centenarian participants (n = 19, age range 99–107 years). Centenarians were over-represented in individuals with low iAge index (protective phenotype), whereas the control older adults group were over-represented in individuals with high iAge index.
iAge predicts multimorbidity and frailty.
To gain further insights into the effect of age-related chronic inflammation on age-related pathology, we computed a regression analysis between the total number of age-related diseases (multimorbidity) and iAge. Multimorbidity is the number one priority for global health research and has become the gold standard in aging research as it represents the accumulation of physiological damage in an individual33. The items analyzed included different diseases of different physiological systems: cancer, cardiovascular, respiratory, gastrointestinal, urologic, neurologic, endocrine–metabolic, musculoskeletal, genital–reproductive and psychiatric dysfunctions. All these disease features were binary. For these analyses, we controlled for age, body mass index (BMI), sex, CMV and high cholesterol (also a binary category), because of the reported effect of each of these variables in the etiology of age-related pathologies. We observed a significant correlation between iAge and multimorbidity in the older adults in this study (>60 years old) (n = 285, P < 0.01) (Fig. 1b). This highlights the key role of iAge in the accumulation of physiological damage during aging.
Next, we envisioned an unbiased approach to select predictors of multimorbidity based on available data for a total of 902 Stanford 1KIP participants while controlling for the age effect. To do so, we used a shrinkage method for variable selection by cross validation, called Elastic Net, which has been increasingly used in immunology, aging and other medical fields over the past years34. We applied differential penalties for each potential predictor such that the machine-learning procedure would ‘force’ age to be selected, while imposing a stringent penalty to all other features so that the variables selected do not correlate with age (Extended Data Fig. 5a). The mean absolute error (MAE) for prediction of multimorbidity was 0.41 (Extended Data Fig. 5b). The top features with the largest coefficients included iAge, high cholesterol and BMI (Extended Data Fig. 5c). In addition, immune parameters such as total CD8+ T cells, plasmablasts, transitional B cells such as IgD+CD27− and IgD−CD27− B cells (negative predictors), effector CD8+ T cells, total lymphocytes, monocytes and central memory T cells (positive predictors) were predictive of multimorbidity (Extended Data Fig. 5d). Collectively, these results show that the inflammatory clock is a metric for overall health linked to multiple diseases associated with aging.
To longitudinally assess the importance of iAge in age-related functional deterioration, we calculated iAge in a subgroup of 29 older adults in 2010 and a frailty score including the time-up-and-go test35 was measured in 2017 for the same participants. Using a linear regression model where frailty score in 2017 was regressed onto iAge calculated in 2010 and controlled for cAge, sex, BMI and CMV status, we found that iAge from 2010 was predictive of frailty score in 2017 (R2 = 0.81, P < 0.001; Fig. 1c). Notably, the contribution of iAge to frailty score was significantly stronger than that of calendar age (Fig. 1d).
Lower inflammatory clock index in centenarians.
Next, we explored the relationship between inflammatory age and exceptional longevity. We computed an inflammatory index in an additional cohort of 37 individuals, 18 of which were 50–79 years old and 19 were centenarians, except for 1 individual who was 99 years old at the time of blood extraction. To do so, we first ranked both cohorts in terms of cAge and iAge. For each participant, we then computed the difference of their cAge rank and iAge rank and used this difference (iAge index) to stratify participants into high and low, if they were above or below the population rank mean, respectively. Last, we calculated enrichment for exceptional longevity in the low iAge index group (individuals with most protective phenotypes) by hypergeometric test. Sixty-eight percent (13 out of 19) centenarians were in the low rank group (P = 0.028), whereas only 31% (6 out of 19) were in the high rank group. In contrast, there were 77% (14 out of 18) of controls in the high rank versus 23% in the low rank group (Fig. 1e), which indicates that regardless of cAge, centenarians have a protective iAge index phenotype. This indicates that iAge is associated with exceptional longevity.
To further validate the clinical implication of the iAge score, we leveraged data from the Framingham Heart Study36, a longitudinal cohort tracking thousands of individuals for decades. As there were no sufficient proteomics data to directly estimate iAge in the cohort, we derived a gene expression signature of iAge using available data from 397 participants in our study and performed an enrichment analysis of the derived gene signature on each sample in the Framingham Heart Study (Methods). We observed that the iAge gene signature was significantly associated with all-cause mortality following adjustment to multiple covariates associated with mortality, including age, sex, smoking, cholesterol levels, blood pressure, diabetes and existence of a cardiovascular disease (P = 0.02, Cox proportional hazards model, n = 2,290).
iAge is correlated with immunosenescence.
Canonical acute inflammation proteins such as C-reactive protein and interleukin (IL)-6 have been associated with immunosenescence in previous studies37,38, but the relationship with systemic chronic inflammation (SCI) has not yet been established. To investigate this link, we first used the frequency of naive CD8+ T cells, which are well-known markers for immunosenescence, and estimated the contribution of iAge after controlling for Age, CMV and sex by a multiple regression model. Not surprisingly, age was the strongest contributor to changes in naive CD8+ T cells followed by iAge, CMV (negative contributors) and sex (frequency of total CD8+ T cells in females was 24% versus 30% in males; Fig. 2a).
Fig. 2 |. The inflammatory clock of aging correlates with immunosenescence.
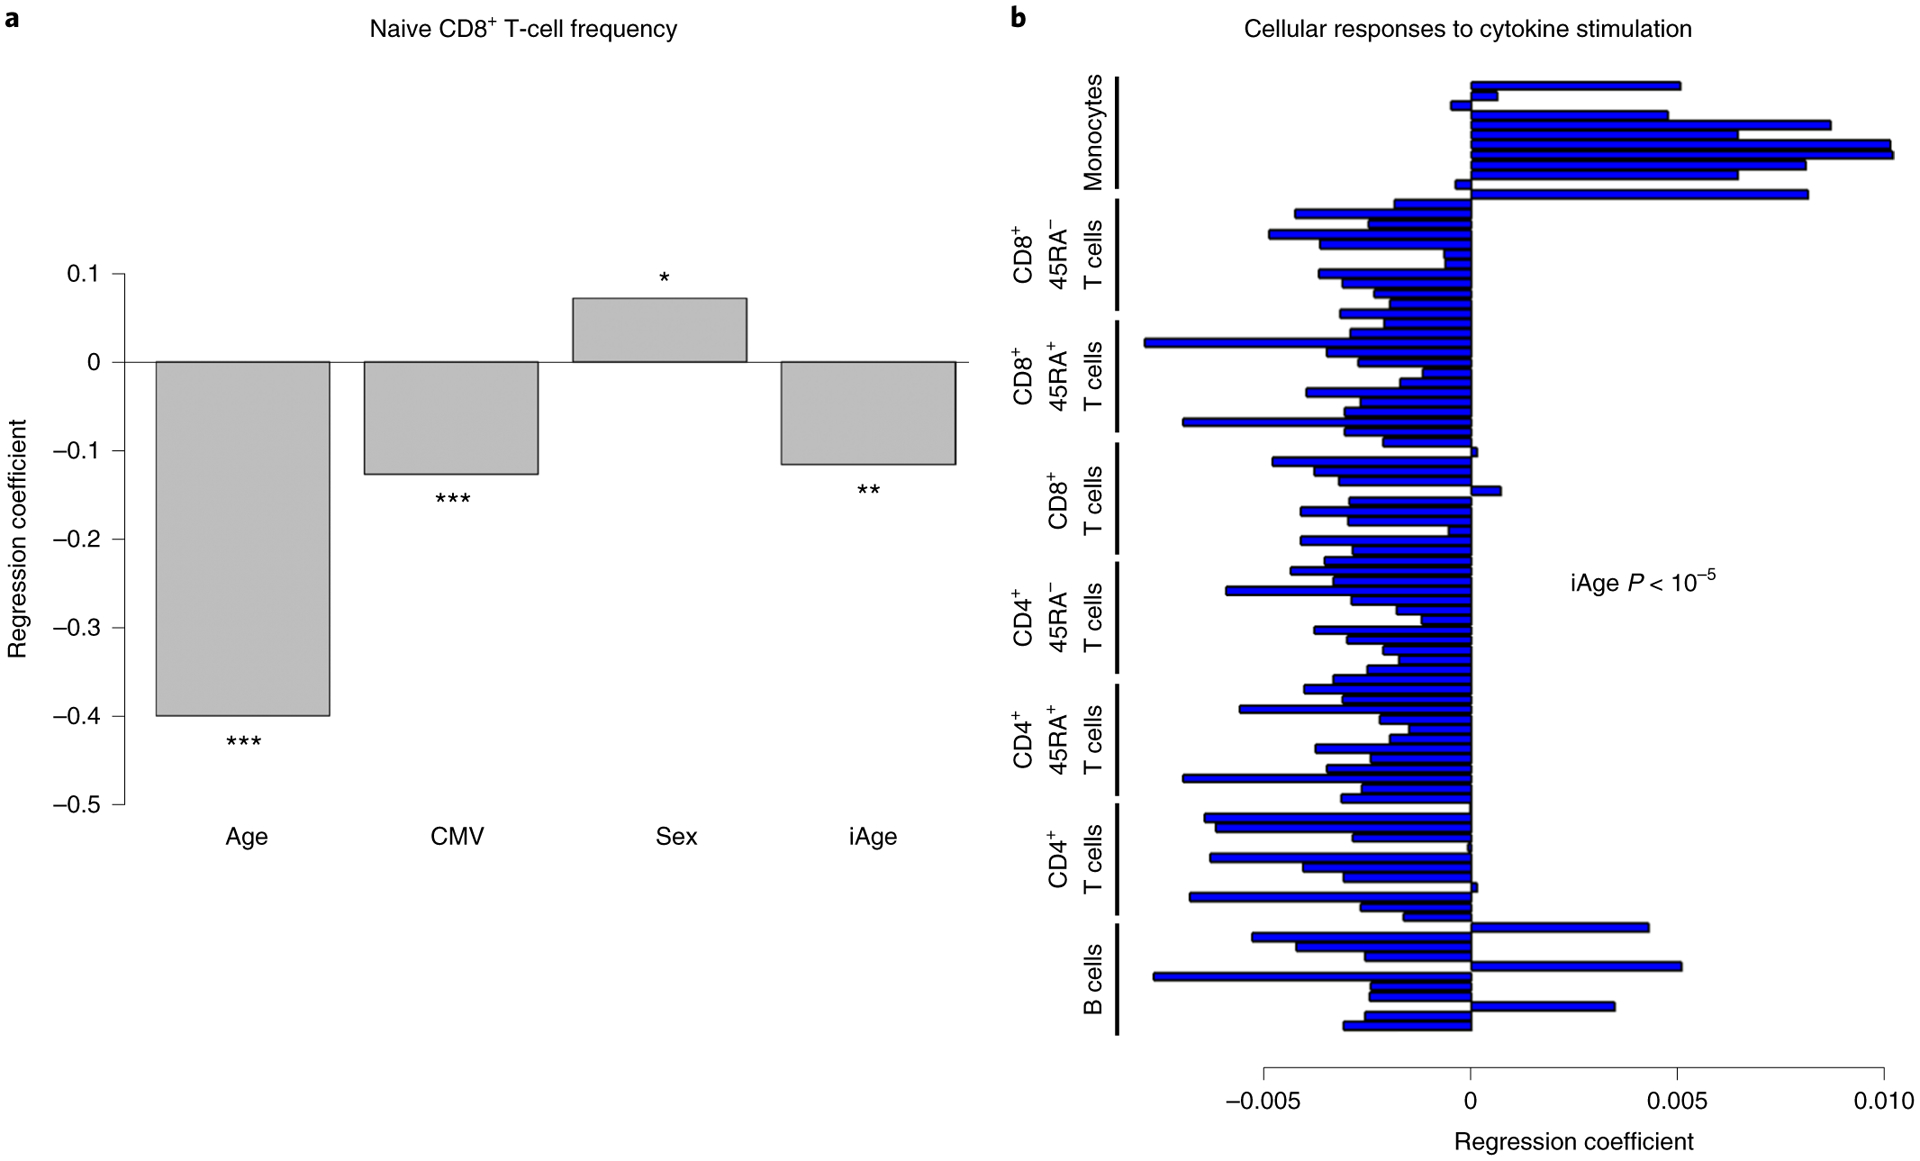
a, A hallmark of immunosenescence (naive CD8+ T cells) was used to examine the potential contribution of iAge to this condition. In a multiple regression model, iAge was significantly correlated with the frequency of naive CD8+ T cells to a similar extent to CMV positivity. cAge was the strongest contributor (P < 10−15), followed by CMV (P < 10−5), iAge (P < 10−3) and sex (P = 0.012). ***P <0.001, **P < 0.01, *P < 0.05. P values are derived from hypothesis testing, where the null hypothesis is that the variable has no correlation with the dependent variable. b, The activation of multiple intracellular pathways was measured using the phosphoflow method in B cells, CD4+ T cells (CD45RA+ and CD45RA− subsets), CD8+ T cells (CD45RA+ and CD45RA− subsets) and in monocytes. In this method, PBMCs are plated ex vivo and activated with a variety of cytokine stimuli to measure phosphorylation events in STAT proteins (specifically STAT1, STAT3 and STAT5). iAge is consistently negatively correlated with B-cell and T-cell responses to cytokine stimuli and positively correlated with monocyte responses (P < 10−5 by self-contained test of modified Fisher’s combined probability).
To examine the effect of iAge in the immune response, we used a well-established multiplexed assay of phosphorylated STAT molecules in PBMCs following different stimulations in vitro39,40. PBMCs were stimulated with the cytokines IFN-α, IL-6, IL-10 and IL-2 and subsequently stained with antibodies specific for phosphorylated forms of STAT proteins. The fold increase of phospho-STAT1, phospho-STAT3 and phospho-STAT5 was calculated from a variety of immune cells of 818 individuals, totaling 96 conditions. We conducted multiple regression analysis controlling age, CMV and sex (Methods). Notably, there was a general decrease of B-cell and T-cell responses to stimuli and an overall potentiation of monocyte response associated with increasing iAge (combined P < 10−5; Fig. 2b). These results demonstrate that iAge correlates with an established biomarker of immune senescence (naive CD8+ T-cell frequency) and with PBMC signaling responses in vitro.
CXCL9 is an important component of iAge and correlates with cardiovascular aging in healthy adults.
To isolate the factors contributing the most to iAge, we computed the most variable Jacobians (first-order partial derivative of iAge). We found both positive and negative contributors to iAge (Fig. 3a), where the top 15 most variable Jacobians were CXCL9, EOTAXIN, Mip-1α, LEPTIN, IL-1β, IL-5, IFN-α and IL-4 (positive contributors) and TNF-related apoptosis-inducing ligand (TRAIL), IFN-γ, CXCL1, IL-2, transforming growth factor (TGF)-α, plasminogen activator inhibitor (PAI)-1 and leukemia inhibitory factor (LIF) (negative contributors). Notably, canonical markers of acute infection such as IL-6 and tumor necrosis factor-α were not major contributors to iAge, indicating that, except for IL-1β, infection-driven inflammatory markers of the acute inflammatory response do not contribute to age-related chronic inflammation. Given that the most positive contributor to iAge was CXCL9, we compared CXCL9 levels between different age groups and found significant increases in this protein with age (P < 10−15, by one-way analysis of variance (ANOVA) test) starting at the age of 60 years (Fig. 3b and Extended Data Fig. 6). Taken together, these results suggest that CXCL9 is an important factor in age-related chronic inflammation.
Fig. 3 |. CXCL9 is a major contributor to iAge.
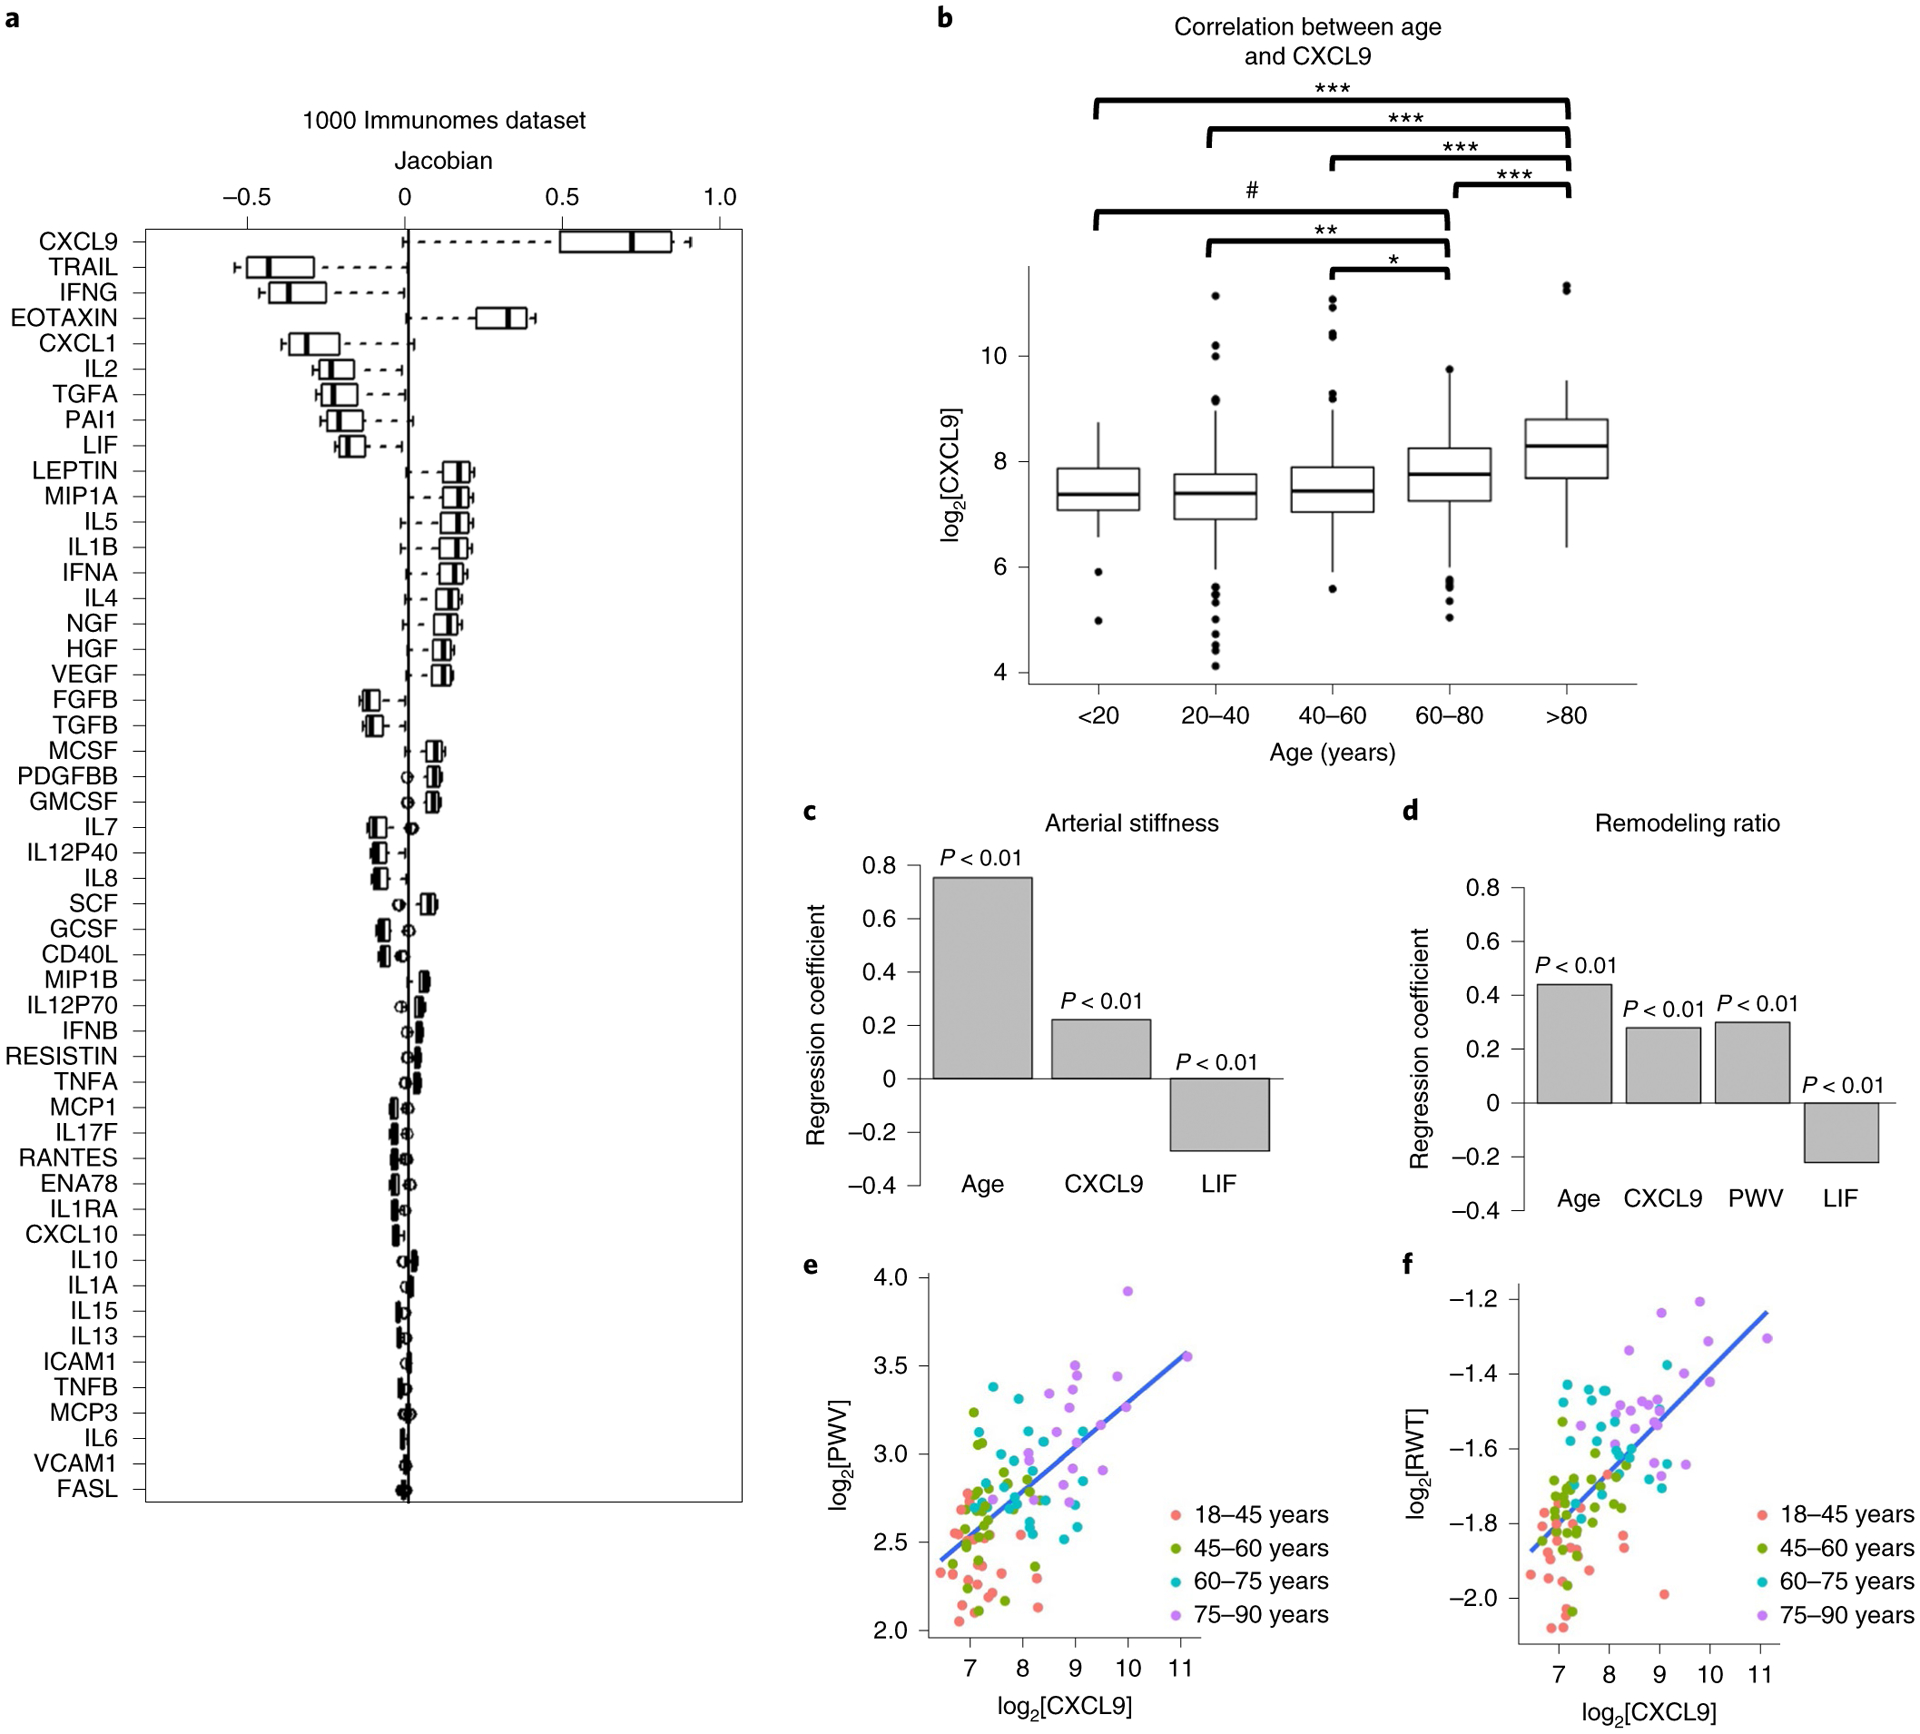
a, Decomposition of the inflammatory score was conducted by estimating the most variable Jacobians (first-order partial derivative of the inflammatory clock). Boxes represent 25th and 75th percentiles around the median (line); whiskers represent 1.5× interquartile range. Both positive and negative contributors to the inflammatory clock are observed. b, The top 15 most variable Jacobians were CXCL9, EOTAXIN, Mip-1α, LEPTIN, IL-1β, IL-5, IFN-α and IL-4 (positive contributors), and TRAIL, IFN-γ, CXCL1, IL-2, TGF-α, PAI-1 and LIF (negative contributors). Significant differences in the levels of CXCL9 were observed between age groups (P < 0.001, by one-way ANOVA). The pairwise differences between groups were evaluated with the Tukey’s honest significant differences test. Significant differences were shown for older age groups (60–80 years and >80 years) and younger age groups (<20 years, 20–40 years, 40–60 years). ***P < 0.001; **P < 0.01; *P < 0.05; #P < 0.1. Exact P values for each pairwise comparisons are as follows: <20 versus 20–40, 0.72; <20 versus 40–60, 0.99; <20 versus 60–80, 0.09; <20 versus >80, 0; 20–40 versus 40–60, 0.13; 20–40 versus 60–80, 3.5 × 10⁻⁶; 20–40 versus >80, 0; 40–60 versus 60–80, 0.023; 40–60 versus >80, 0; 60–80 versus >80, 7.7 × 10⁻⁶. Boxes represent 25th and 75th percentiles around the median (line); whiskers denote 1.5× interquartile range. c,d, In a validation study, 97 healthy adults (aged 25–90 years) well matched for cardiovascular risk factors were selected from a total of 151 recruited participants. Cardiovascular age was estimated using aortic PWV and RWT. Using multiple linear regression analysis after adjusting for age, sex, BMI, heart rate, systolic blood pressure, fasting glucose and total cholesterol to HDL ratio, positive correlations were obtained between CXCL9 and PWV (R = 0.22) and RWT (R = 0.3) (P < 0.01), and negative correlations were observed between LIF and PWV (R = −0.27) (c) and RWT (R = −0.22) (d). P values are derived from hypothesis testing, where the null hypothesis is that the variable has no correlation with the dependent variable. e,f, Direct comparisons between CXCL9 and the two cardiovascular aging phenotypes (PWV (e) and RWT (f)) are depicted. No other variable included in the models had high co-linearity as suggested by variance inflation factors (VIF) <3 for each factor.
To validate these results and investigate the previously reported role CXCL9 in cardiovascular aging41–44, we conducted a follow-up study in an independent cohort of 97 extremely healthy adults (aged 25–90 years) matched for cardiovascular risk factors (including conserved levels of high-sensitivity C-reactive protein; Supplementary Table 1), selected from a total of 151 recruited participants using strict selection criteria (Methods). In this healthy cohort, inflammation markers were measured using a 48-plex cytokine panel and only 6 out of 48 circulating immune proteins were significantly correlated with age (P < 0.05). Among these, CXCL9 was again the largest contributor to age-related inflammation (Extended Data Fig. 7), supporting the findings observed in the 1KIP cohort. In addition, IL-11Rα, CXCL10 and hepatocyte growth factor (HGF) increased with age, whereas CXCL1 and LIF decreased (Extended Data Fig. 7). These changes were in the same direction as those observed in the 1KIP cohort.
Individuals in the validation cohort were subjected to cardiovascular assessment, including pulse wave velocity (PWV) testing, a measure of vascular stiffness and relative wall thickness (RWT), a surrogate measure of cardiac remodeling (Methods). We then performed multiple regression hierarchical analysis using the six selected inflammatory markers associated with aging in this cohort and cardiovascular measurements (PWV and RWT) controlling for age, sex, BMI, heart rate, systolic blood pressure, fasting glucose and total cholesterol to high-density lipoprotein (HDL) ratio. At P < 0.01, we found a modest positive correlation between CXCL9 and PWV (R = 0.22) and RWT (R = 0.3) (Fig. 3c–f). We also found a negative correlation between LIF and PWV (R = −0.27) and RWT (R = −0.22).
As high RWT indicates concentric cardiac remodeling and elevated PWV is reflective of organ damage and predicts future cardiovascular events and all-cause mortality better than conventional cardiovascular disease risk factors45–47, taken together, these results show that soluble blood markers CXCL9 and LIF could be used as early biomarkers to assess cardiovascular disease risk in otherwise healthy individuals.
CXCL9 increases with age in human blood endothelial cells.
Long-standing evidence has suggested a role for the endothelium in the etiology of hypertension and arterial stiffness48,49. More recent work has also shown that advanced signs of cardiovascular aging such as tissue remodeling and cardiac hypertrophy are often preceded and may be initiated by the malfunctioning of aged endothelia50–52. We explored the potential contribution of CXCL9 toward cardiovascular aging through endothelial cells. First, we assessed levels of CXCL9 in young and old individuals by isolating their blood endothelial progenitor cells (BECs) (Extended Data Fig. 8a). Quantitative PCR analysis of BECs from young and old individuals showed a significant increase in CXCL9 levels in older compared to younger subjects (Fig. 4b). Furthermore, a comprehensive characterization of BECs from both cohorts showed impairment of endothelial function in older individuals when compared to younger individuals. To measure endothelial function, we examined the endothelial cells’ (ECs) ability to form networks of tubular structures53,54, produce nitric oxide (NO)55 and incorporate acetylated low-density lipoprotein (Ac-LDL)56; together, the assays robustly assess the health of ECs. Comparing ECs from older and younger individuals, we found that BECs from older patients showed reduced capacity to form networks of tubular structures (Extended Data Fig. 8b and Fig. 4b), reduced capacity to produce NO (Fig. 4c) and a reduced capacity to incorporate Ac-LDL (Fig. 4d).
Fig. 4 |. CXCL9 is an important regulator of endothelial cell aging.
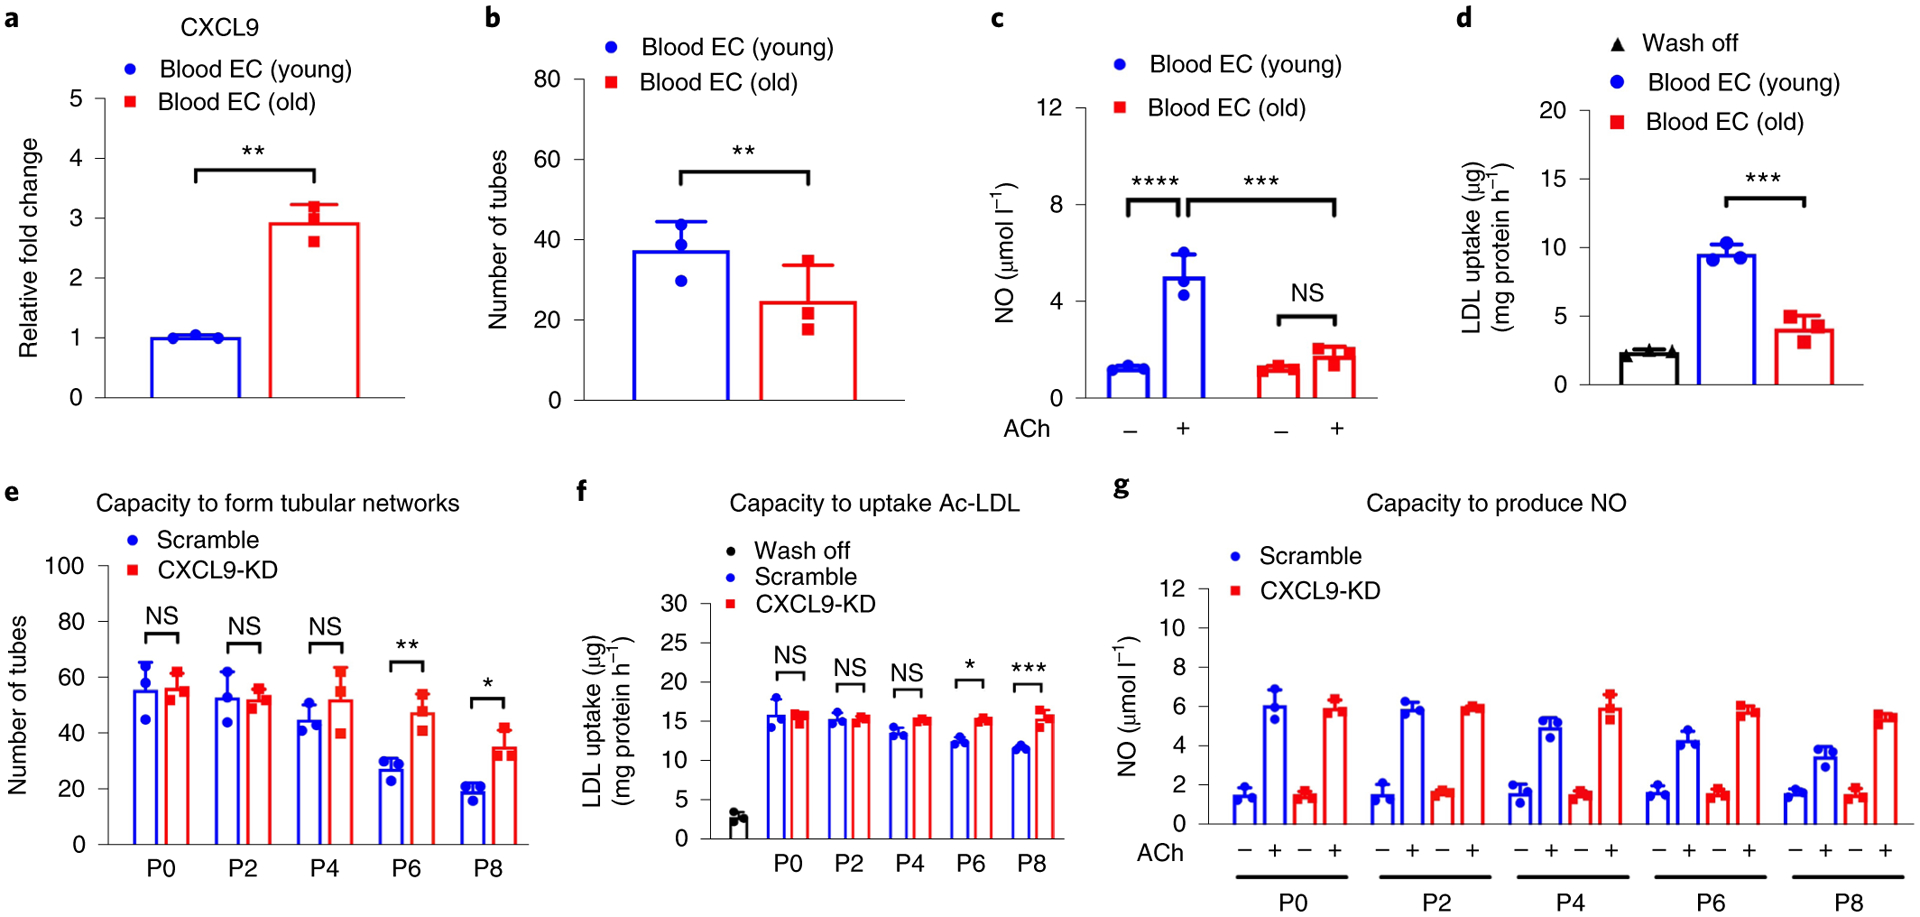
a, Quantitative PCR data show increased expression of CXCL9 in BECs of older individuals compared to younger individuals (P = 0.0075). b, Significant differences in tube formation capacity are observed in BECs from older and younger individuals (P = 0.0323). c, Quantification of NO production shows impaired capacity of BECs from older individuals to produce NO when compared to younger individuals in response to acetylcholine (Ach) (adjusted P value (Padj) of BECs (young) versus BECs (old), P <0.0001; Padj value of BECs (young) Ach versus BECs (old) Ach, 0.0002). d, Quantification of LDL uptake show impaired capacity of BECs from older individuals to uptake Ac-LDL when compared to younger individuals (Padj = 0.0002). e–g, Quantification of number of tubes, LDL uptake and NO production in response to Ach in Scramble and CXCL9-KD iPSC-ECs shows a significant improvement in aging phenotypes in ECs at passage 6 and 8 with silencing of the CXCL9 gene. Padj values for P6 (Scramble) versus P6 (CXCL9 shRNA) = 0.008 (e); P8 (Scramble) versus P8 (CXCL9 shRNA) = 0.0475. Padj values for P6 (Scramble) versus P6 (CXCL9 shRNA) = 0.044; P8 (Scramble) versus P8 (CXCL9 shRNA) = 0.001 (f). Padj values for P6 (Scramble) Ach versus P6 (CXCL9-KD) Ach = 0.0116; P8 (Scramble) Ach versus P8 (CXCL9-KD) Ach = 0.0001 (g). Scramble are hiPSCs infected with lentivirus carrying nonsense-sequence shRNA. CXCL9-KD are hiPSCs infected with lentivirus carrying sequence-specific shRNA to knockdown expression of CXCL9. All data are represented as mean ± s.e.m., n = 3, *P < 0.05, **P < 0.01, ***P < 0.001; ****P < 0.0001; NS, not significant. Statistical analyses were performed using Student’s t-test or one-way ANOVA corrected with the Bonferroni method.
Similar experiments were conducted in mice. Aortas from young (3–4 months) and old mice (2 years) were excised, digested and cultured in EC medium (Extended Data Figure 8c). Once confluent, ECs from both young and old mice were assessed for CXCL9 expression and function. As expected, ECs isolated from old mice showed higher levels of CXCL9 (Extended Data Fig. 8d), while at the same time showed impaired EC function as evident by decreased tube formation (Extended Data Fig. 8e,f). These results demonstrate a concomitant increase in CXCL9 in the endothelia and EC dysfunction associated with aging both in humans and mice.
Inhibition of CXCL9 rescues endothelial cell dysfunction.
Next, we investigated how the increase in CXCL9 in older ECs is related to endothelial dysfunction. In these experiments, we used a well-established model for endothelial aging57,58 by generating human induced pluripotent stem cells (hiPSCs) from fibroblasts obtained from five independent human donors59 and subsequently differentiated them into endothelial cells (hiPSC-ECs)60. The CXCL9 receptor, Gαi protein-coupled protein CXCR3, was expressed in ECs but not in cardiomyocytes (Extended Data Fig. 9). We used lentiviral infection of CXCL9 sequence-specific short hairpin (sh)RNA to knockdown expression of CXCL9 in hiPSCs (CXCL9-KD). As a control, we also infected hiPSCs with nonsense-sequence shRNA (Scramble) and subsequently, both cultures were differentiated to ECs. CXCL9 expression, as analyzed by quantitative PCR, was reduced by ~75% in CXCL9-KD hiPSC-ECs compared to Scramble hiPSC-ECs (not shown). CXCL9-KD and Scramble hiPSC-ECs were serially cultured to passage 8 in a time-course experiment to mimic cellular aging.
We then investigated the functional impact of the observed phenotype in a model for angiogenesis by measuring EC capacity to form networks of tubular structures54, the production of NO and uptake of Ac-LDL. iPSC-ECs at passage 8 showed significantly impaired tube formation when compared to early passages of iPSC-ECs, including passage 0 and 2. As early as passage 4, ECs lose their capacity to form tubes, which can be partially restored when CXCL9 is knocked down (Fig. 4e and Extended Data Fig. 10). Next, we assessed the capacity of these early- or late-passaged iPSC-ECs to produce NO or uptake acetylated LDL. Late-passaged iPSC-ECs failed to produce NO in response to acetylcholine or uptake Ac-LDL respectively, when compared to early passages of iPSC-ECs (Fig. 4f,g).
Notably, the knockdown of CXCL9 (CXCL9-KD) in iPSC-ECs rescued the EC dysfunction in late passages of iPSC-ECs (P6 and P8), suggesting an important role of CXCL9 and the EC phenotype. It is also noteworthy that when comparing tube formation, NO production and uptake of Ac-LDL in Scramble at passage 0 versus CXCL9-KD at passage 8, there is a statistically significant difference in all three metrics (P < 0.01). This suggests that while knockdown of CXCL9 rescues endothelial dysfunction by passage 8, it cannot restore EC function completely to the level of healthy ECs at passage 0. Altogether, these results are consistent with previous findings showing age-dependent endothelial dysfunction, fewer T cells and impaired vasodilation with advanced age in animal models, and requirement of angiogenesis in migration and proliferation of ECs61. Taken together these results demonstrate that CXCL9 has a profound effect in the cardiovascular system and indicates a new role for this chemokine in angiogenesis and EC function during cardiovascular aging.
CXCL9 governs inflammation and proliferation in aged EC.
In a time-course experiment where CXCL9-KD and Scramble hiPSC-ECs were serially cultured to passage 8, RNA was also extracted at every other passage for bulk RNA-sequencing (RNA-seq) transcriptome analysis (Methods). We observed a time-dependent increase in CXCL9 transcript levels up to ~fourfold at passage 8 compared to cells obtained from cultures at day 0 and a substantial reduction of CXCL9 expression in CXCL9-KD hiPSC-ECs (Fig. 5a). Fast gene set enrichment analysis (FGSEA) in aged cells revealed upregulation of genes in hallmark inflammatory pathways and downregulation of genes in hallmark cell proliferation pathways (Fig. 5b). This profile is indicative of an early cellular senescence phenotype62–66. CXCL9-KD showed a complete reversal of this early cellular senescence phenotype with upregulation of proliferative pathways and downregulation of inflammatory pathways when compared to Scramble hiPSC-ECs (Fig. 5c–e). Examples of these inflammatory and proliferation hallmark pathways include the IFN-γ response and E2F targets, respectively (Fig. 5d (Scramble) and Fig. 5e (CXCL9-KD)). Such functional impact of increased inflammation and decreased proliferation in endothelial aged cells could contribute to the impaired tube formation and endothelial dysfunction observed in the experiments described previously.
Fig. 5 |. Early cellular senescence and loss of angiogenesis capacity in iPSC-derived aging endothelia is reversed by silencing CXCL9.
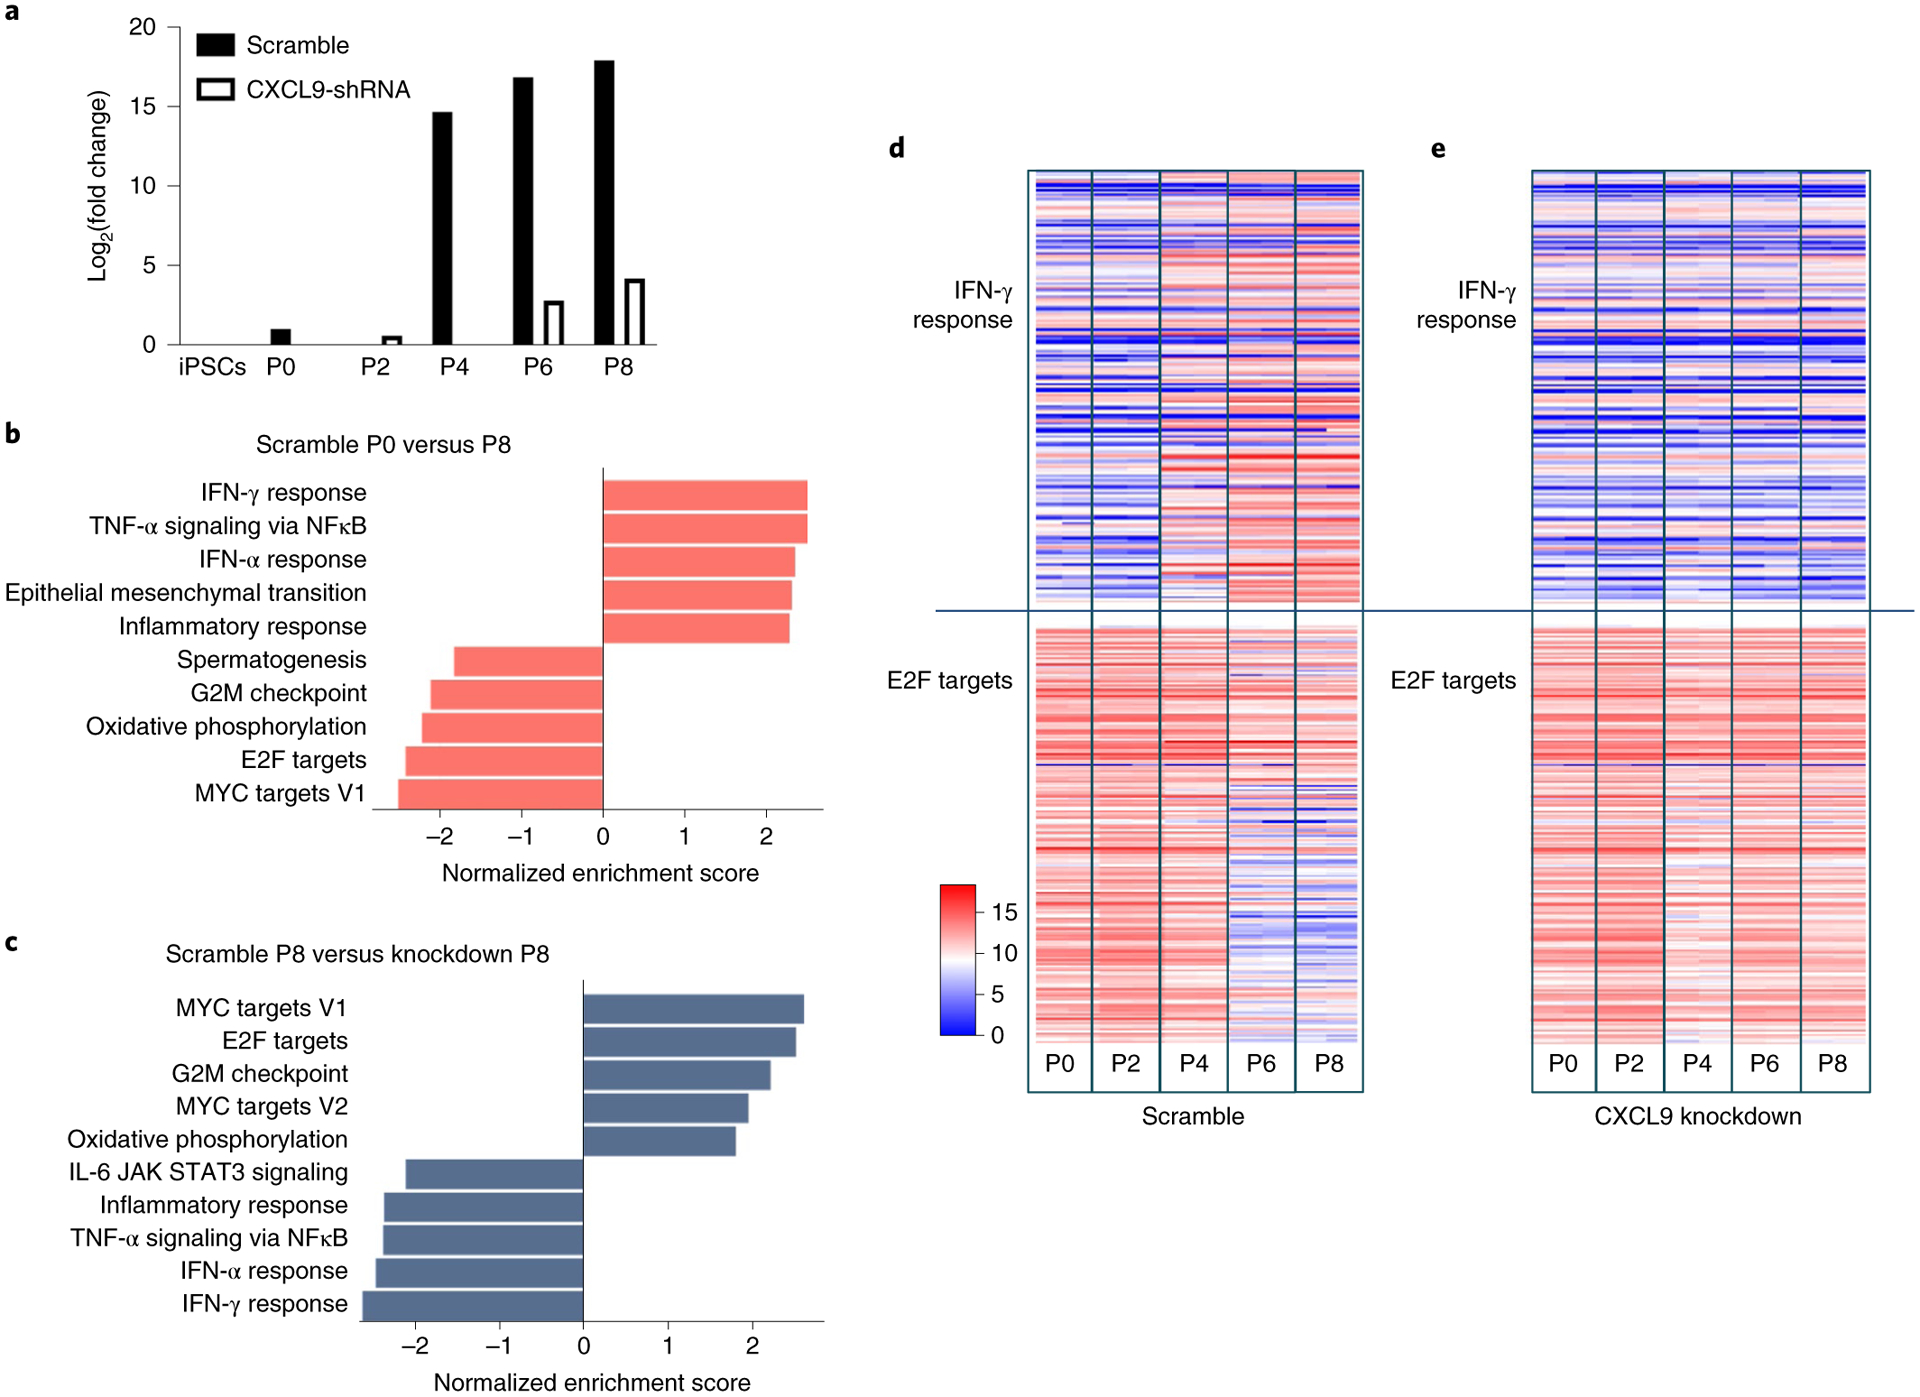
a, Pathway enrichment analysis and tube network formation of Scramble versus CXCL9-KD were analyzed. hiPSCs infected with lentivirus carrying nonsense-sequence shRNA (Scramble) and hiPSCs infected with lentivirus carrying sequence-specific shRNA to knockdown expression of CXCL9 (CXCL9-KD) were both induced to ECs (Methods). RNA-seq analysis was conducted on cells at passage 0, 2, 4, 6 and 8 for both conditions. CXCL9 messenger RNA in Scramble was highly upregulated as early as passage 4, whereas CXCL9 mRNA expression in CXCL9-KD did not significantly change with in vitro cellular aging. b, Pathway enrichment comparing Scramble at passage 0 and passage 8. Upregulated inflammatory pathways and downregulated proliferation pathways are depicted (P8 versus P0). c, Comparing Scramble at P8 with CXCL9-KD at P8 shows that silencing of CXCL9 leads to a complete reversal of the early EC senescence phenotype. An example of inflammatory pathway (IFN-γ) and an example of proliferation pathway (E2F targets) is shown in d. d, Relative expression of genes in the hallmark pathways for Scramble at passage 0, 2, 4, 6 and 8 (S0, S2, S4, S6 and S8) are shown. e, Example of inflammatory pathway (IFN-γ) and an example of proliferation pathway (E2F targets) for CXCL9-KD at passage 0, 2, 4, 6 and 8 (KD0, KD2, KD4, KD6 and KD8) are shown. ***P < 0.001; **P < 0.01; *P < 0.05.
CXCL9 impairs vascular function and contributes to arterial stiffness.
To further explore the role of CXCL9 in cardiovascular aging in our in vitro EC aging model, we focused on molecules that are related to a surrogate of cardiovascular risk, arterial stiffness. EC dysfunction has been shown to strongly affect arterial stiffness via cellular adhesion molecules (CAMs), matrix metalloproteinases (MMPs) and collagen molecules (COLs)67–71. We compared gene expression levels of all CAM genes (n = 13), MMP genes (n = 12) and COL genes (n = 23) in Scramble hiPSC-ECs at passage 0 versus passage 8. We found a substantial upregulation of CAM, MMP and COL genes related to arterial stiffness at passage 8 (Fig. 6a). Except for some COL genes, this vascular stiffness gene profile is reversed in CXCL9-KD cells, which suggests that silencing of this single gene can restore the EC phenotype (Fig. 6b).
Fig. 6 |. CXCL9 promotes a vascular stiffness gene expression signature in the aging endothelium and impairs endothelial function.
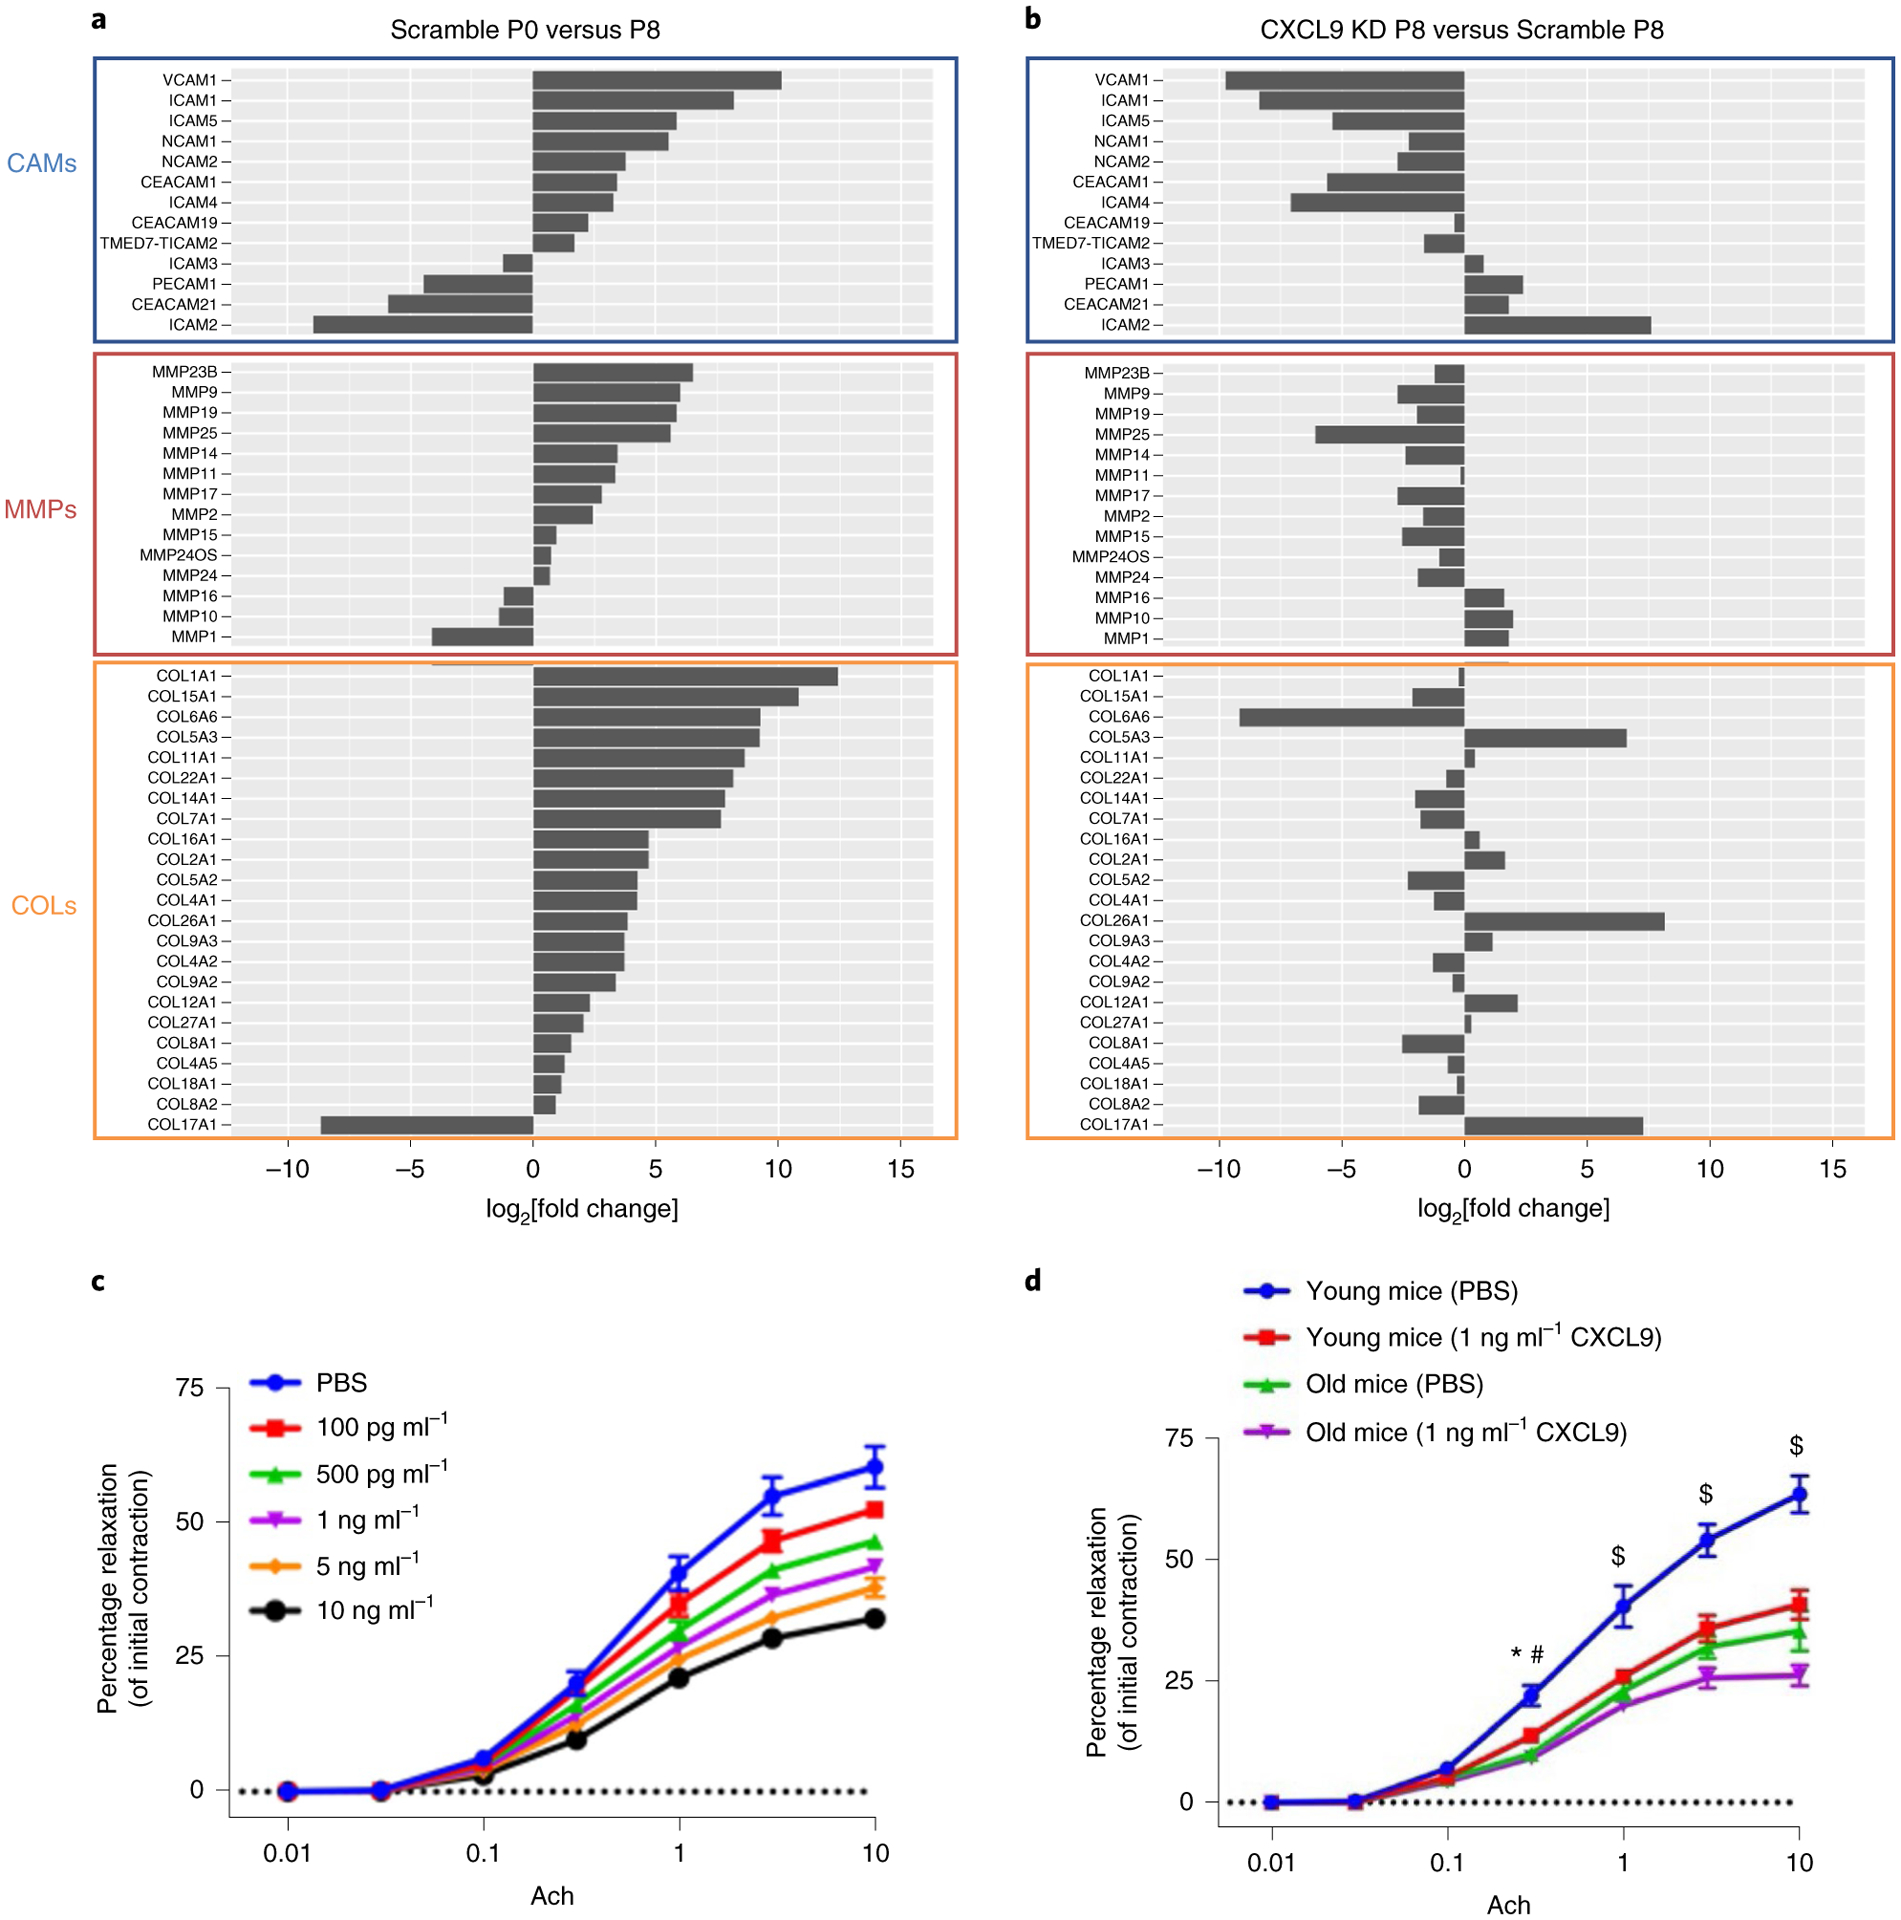
The expression levels of hallmark vascular stiffness genes—CAMs, MMPs and COLs—were analyzed in Scramble and CXCL9-KD aging cells. a, CAMs, MMPs and COLs are highly expressed in Scramble passage 8 compared to passage 0. b, Knockdown of CXCL9 completely restores the expression of CAMs and MMPs, but not COLs. c, Line graph of percent relaxation of mouse thoracic aortic sections incubated with increasing concentrations of CXCL9 shows impaired vascular reactivity to acetylcholine, suggesting that CXCL9 dampens vascular function. d, A similar trend is observed when CXCL9 is given to either young or old mice. CXCL9 disrupts the relaxation supposedly induced by acetylcholine. All data are represented as mean ± s.e.m., n = 3, *Padj value of young mice (PBS) versus young mice (CXCL9) = 0.0237; #Padj value of young mice (PBS) versus old mice (PBS) = 0.0003, $Padj value of young mice (PBS) versus young mice (CXCL9) < 0.0001. Statistical analyses were performed using two-way ANOVA followed by a Bonferroni post hoc test; n = 3 (three separate segments of aortas).
As genes related to arterial stiffness are upregulated in Scramble passage 8 but their expression is largely attenuated in CXCL9-KD, we hypothesized that there might be a causal effect between arterial stiffness and increase expression of CXCL9. To test this, we incubated mouse thoracic aortic sections with increasing concentrations of recombinant mouse CXCL9 and assessed cellular contractibility by incubating vessels with the prostaglandin agonist U46619 and measured relaxation curves by isometric myography72. As shown in Fig. 6c, a dose-dependent effect of CXCL9 is observed on vasorelaxation in treated aortas versus controls, which validates our findings of the effect of CXCL9 on the arterial stiffness gene expression phenotypes. The same experiment was conducted in young versus old mice using only one dose of CXCL9 (1 ng ml−1). As seen in Fig. 6d, aortic rings excised from old mice showed impaired vascular relaxation when compared to young mice in response to acetylcholine. However, aortic rings from both young and old mice when incubated with CXCL9 exhibited impaired vascular relaxation. These results demonstrate a central role for CXCL9 in vascular dysfunction, which likely contributes to arterial stiffness and premature aging in vivo.
Age-related elevation in CXCL9 leads to endothelial cell senescence.
The lack of angiogenesis, impaired production of NO and dysfunctional uptake of Ac-LDL indirectly suggested a cellular senescence phenotype that could be rescued by knocking down CXCL9 as iPSC-EC is passaged. To directly explore the role of CXCL9 in cellular senescence, we assessed the proliferation rate and cellular senescence markers in Scramble and CXCL9-KD iPSC-ECs at different passages. First, we assessed the kinetic profile of iPSC-ECs from Scramble and CXCL9-KD cells every 24 h for up to 4 d. Briefly, equal numbers of Scramble and CXCL9-KD iPSC-ECs from passage 0 and passage 8 were seeded in a 96-well plate and cells were quantified using a Cytation five-cell imaging multimode reader, where individual cells were counted every 24 h by imaging 4′,6-diamidino-2-phenylindole (DAPI)-positive cells. As seen in Fig. 7a, the kinetic profile of iPSC-EC proliferation over 4 d showed a significant increase in the proliferation rate in P0 iPSC-ECs when compared to P8 iPSC-ECs. Notably, when CXCL9 was inhibited in P8 iPSC-ECs (CXCL9-KD), the proliferation rate showed a significant increase when compared to Scramble-treated cells.
Fig. 7 |. CXCL9 regulates endothelial cell senescence and capillary network formation in vivo.
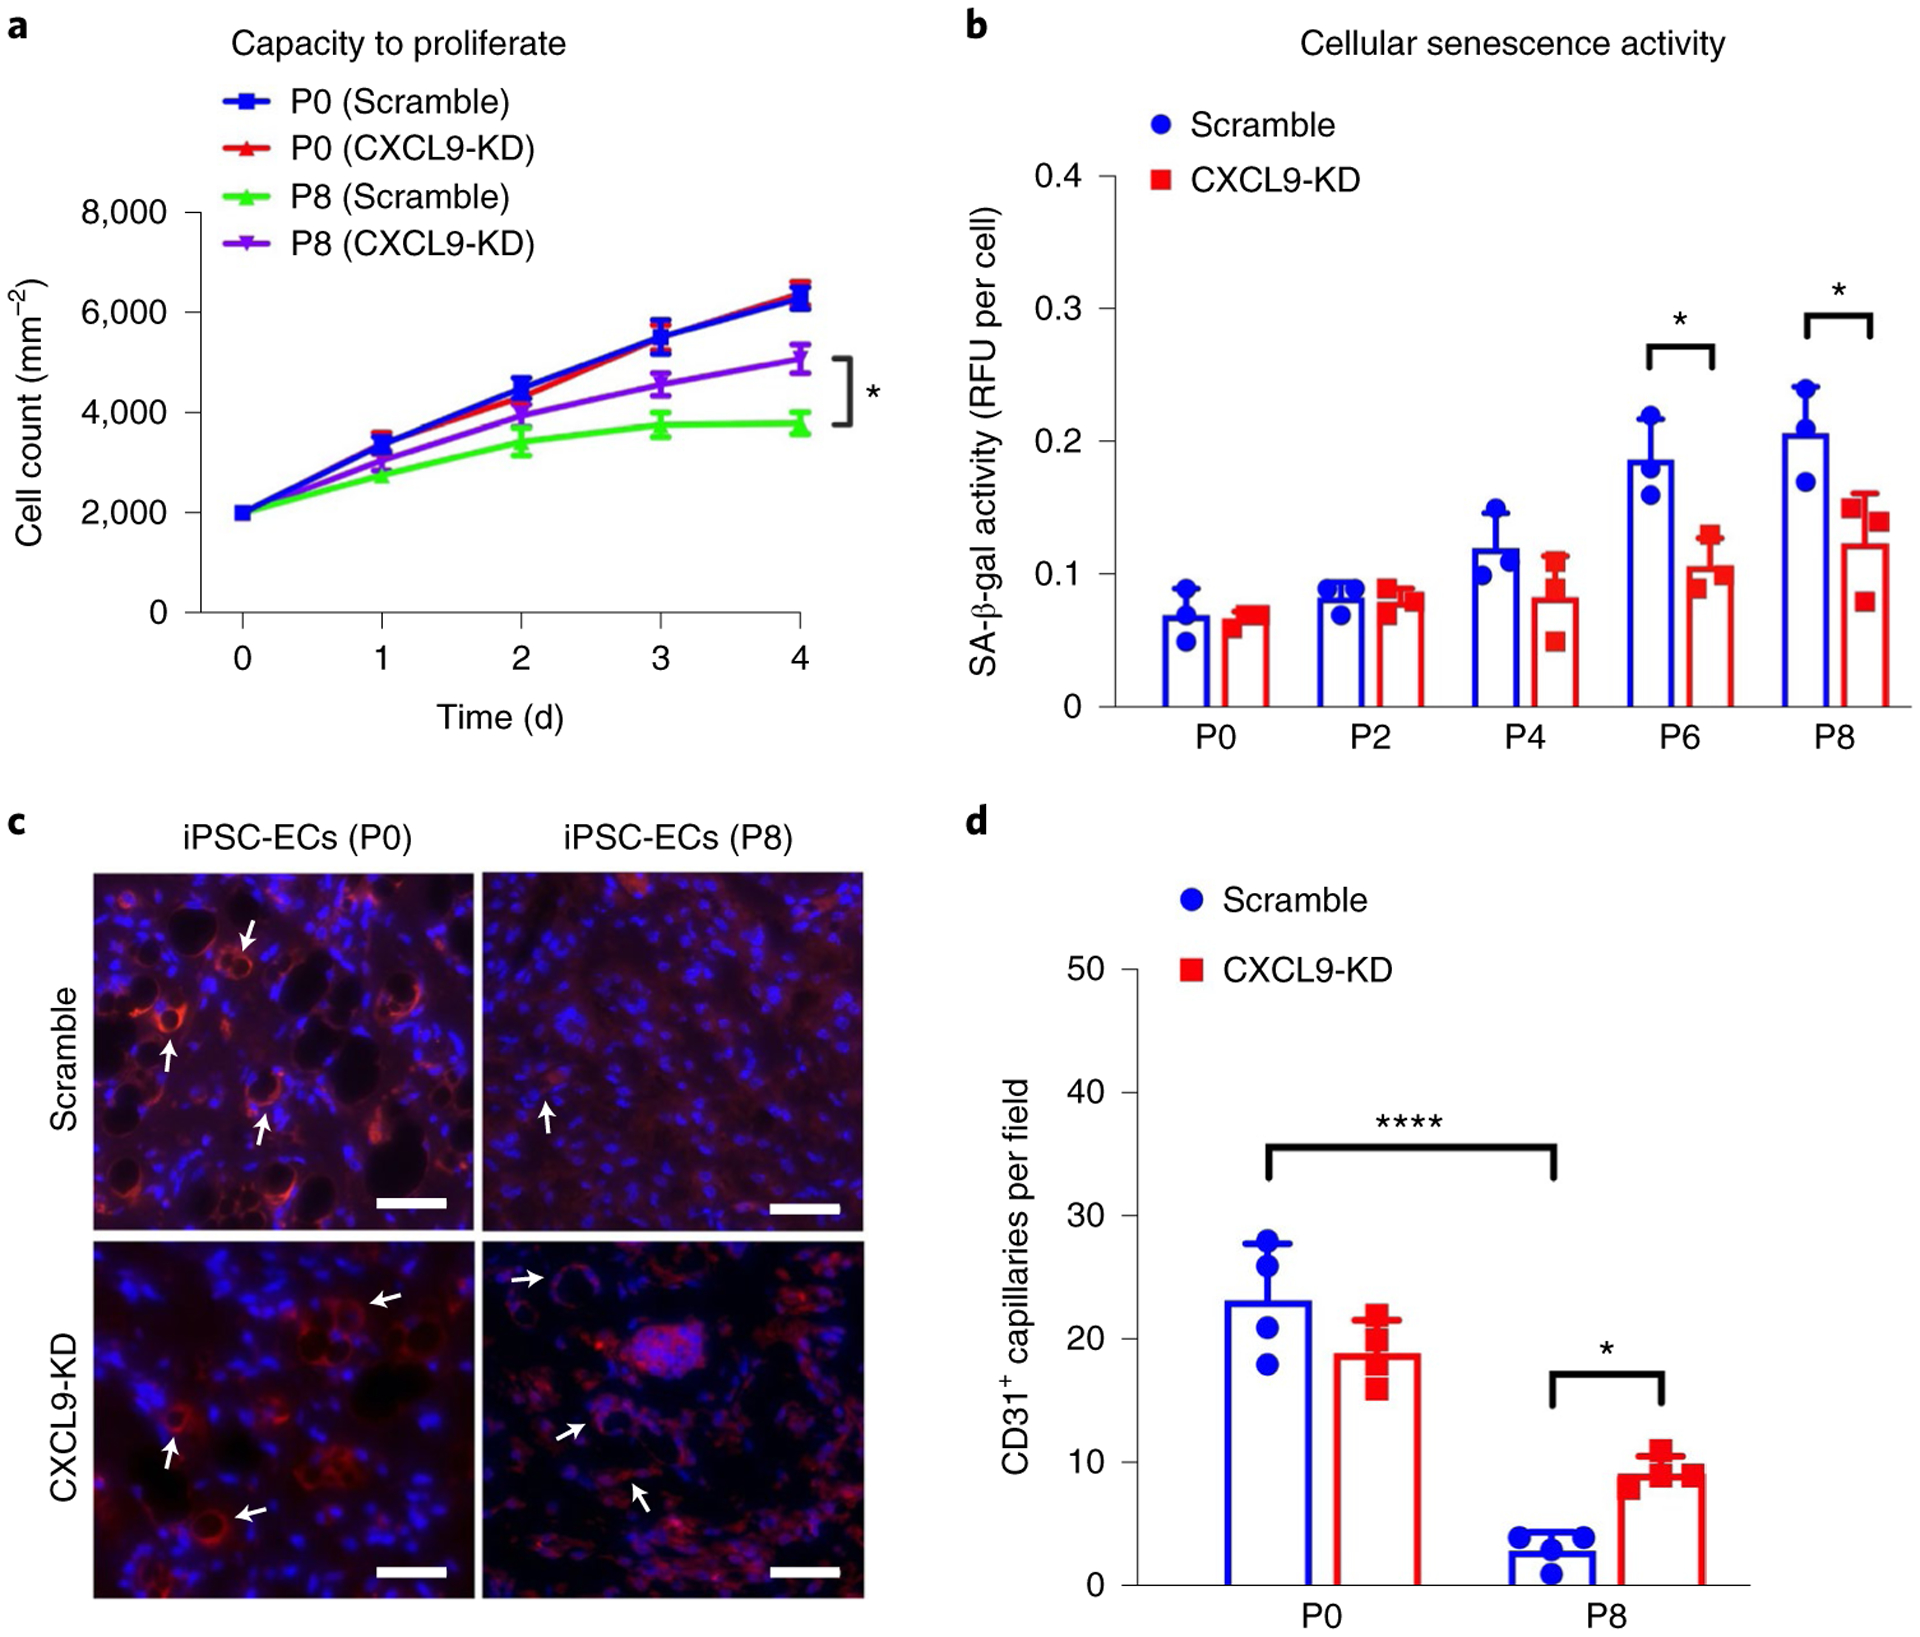
a, Growth curves over 4 d show recovery of cell proliferation in CXCL9-KD iPSC-ECs in later passages when compared to Scramble iPSC-ECs (Padj value of P8 Scramble (day 4) versus P8 CXCL9-KD (day 4) = 0.0232). b, Cellular senescence activity assay shows restoration of SA-β-gal activity in CXCL9-KD iPSC-ECs at later passages when compared to Scramble iPSC-ECs (Padj value of P6 (Scramble) versus P6 (CXCL9 shRNA) = 0.0406; Padj value of P8 (Scramble) versus P8 (CXCL9 shRNA) = 0.0278). c, Representative immunohistochemical images showing CD31+ human capillaries from serially passaged Scramble and CXCL9-KD iPSC-ECs. Arrows denote CD31 staining on iPSC-EC indicating capillary formation. d, Quantification of CD31+ capillaries show improved capacity of late passaged CXCL9-KD iPSC-ECs to form in vivo capillary networks (Padj value of P0 (Scramble) versus P8 (Scramble) <0.0001; Padj value of P8 (Scramble) versus P8 (CXCL9 shRNA) = 0.0487). All data are represented as mean ± s.e.m., n = 3, *P < 0.05, ****P < 0.001. Statistical analyses were performed using one-way ANOVA corrected with the Bonferroni method. Scale bars, 100 μm.
Next, we assessed the senescence-associated β-galactosidase (SA-β-gal) activity in Scramble or CXCL9-KD iPSC-ECs at different passages to determine cellular senescence in these cells. Cell lysates were collected and SA-β-gal activity measured using a standard fluorometric substrate. As expected, Scramble iPSC-ECs showed a passage-dependent increase in SA-β-gal activity, suggesting an increase in cellular senescence. However, in CXCL9-KD iPSC-ECs the SA-β-gal activity at later passages was significantly reduced when compared to Scramble, suggesting a direct link between CXCL9 expression and cellular senescence (Fig. 7b).
Finally, we examined the capacity of Scramble and CXCL9-KD iPSC-ECs to form capillaries in vivo when injected subcutaneously in immunodeficient mice73. Early and late-passaged iPSC-ECs from both Scramble and CXCL9-KD groups were placed in Matrigel and injected subcutaneously into the lower abdominal region of SCID mice. Following 2 weeks, Matrigel plugs were excised, fixed and stained for human CD31. As seen in Fig. 7c, immunohistochemical images showed formation of capillaries in Scramble and CXCL9-KD iPSC-ECs at P0; however, P8 (late passaged) Scramble iPSC-ECs failed to show sprouting in vivo (Fig. 7c,d). In contrast, P8 CXCL9-KD iPSC-ECs showed significantly improved in vivo angiogenesis, suggesting a critical role of CXCL9 in EC senescence.
Discussion
In this study, we conducted extensive immune monitoring in a large cohort of 1,001 individuals to identify immune biomarkers of aging and establish reference values for age-related systemic chronic inflammation. We used artificial intelligence to create a compact representation of these biomarkers and derived an ‘inflammatory clock’ of aging, which takes into account the nonlinear relationship and redundancy of the cytokine network. This metric tracked with multiple aging phenotypes in the general population and thus, has strong potential for translational medicine, as it could be used as a diagnostic tool for identifying those at risk for both noncommunicable and infectious diseases.
Our nonlinear GAE method was optimal for the identification of iAge and its contributors. As with other deep-learning methods, GAE is capable of capturing complex relationships between analytes. Similar methods striving to extract signatures of aging have been described in different systems ranging from genome-wide association studies to proteomics. We summarize a few notable aging clocks in Supplementary Table 3. In brief, an epigenetic clock using markers measuring DNA methylation on CpG sites has been used to calculate an epigenetic age that was able to predict all-cause mortality74,75. It has also been associated with age-related diseases such as frailty, Alzheimer’s disease, Parkinson’s disease and cancer. Other clocks such as transcriptomic and microRNA clocks have also been shown to successfully capture aspects of the aging process that are different from epigenetic clocks. Instead of being associated with all-cause mortality or disease, transcriptomic clocks are associated with IL-6, albumin, lipids and glucose levels76. There have also been attempts to derive proteomic clocks and metabolomic clocks77–82 of clinical relevance; however, iAge allows for new discoveries in the immune system. iAge derived from immunological cytokines gives us an insight into the salient cytokines that are related to aging and disease. A notable difference compared to other clocks is that iAge is clearly actionable as shown by our experiments in CXCL9 where we can reverse aging phenotypes. More practical approaches range from altering a person’s exposomes (lifestyle) and or the use of interventions to target CXCL9 and other biomarkers described here.
Recent advancements in deep learning beyond traditional machine-learning methods have provided enormous opportunities to model biological age. Some of the most popular deep-learning architectures used to estimate biological age have been recurrent neural networks (RNNs), convolutional neural networks (CNNs), generative adversarial networks (GANs) and deep artificial neural networks (ANNs). RNNs have been used on face attributes and physical activities to estimate biological age83. Although the modality is not in the realm of biological markers, RNNs have potential to garner results in biological data that require positional relationships such as epigenetic age. CNNs and GANs have both been used to abstract facial attributes to predict chronological age84,85. GANs and CNNs are exceptional in abstracting images to distill useful information. Future applications of GANs and CNNs can be applied in other biological images such as magnetic resonance imaging; however, for now, these models are proof of concepts that they can accurately estimate cAge; they might not necessarily predict the health or lifespan of individuals. The deep-learning models that have been applied to modality used in this paper are the deep ANNs. ANNs have been applied to blood biochemistry markers and cell counts to derive biological age86,87. The results showed that such clocks are able to predict all-cause mortality, potentially finding biomarkers to intervene and steer individuals toward a healthier life.
Some of the limitations of biological clocks in general is that they do not directly provide the mechanism by which they work. While it is possible to infer causality between aging and molecular biomarkers especially in the context of longitudinal or time-series data, individual biomarkers selected from biological aging clocks need to be experimentally tested to elucidate the underlying mechanism, as we have done in this study. Our GAE algorithm, a deep-learning method that efficiently deals with the network structure and nonlinear behavior of the inflammatory response, can extract high-level complex abstractions as ‘data representations’ using nonlinear functions and is well suited for the analysis of complex systems where most behaviors are nonlinear, context-dependent and organized in a distributed hierarchical fashion88. In our case, this method outperformed other commonly used linear modeling methods such as Elastic Net and PCA and also other nonlinear approaches such as plain auto-encoder89 (Extended Data Fig. 3b). The correlation between chronological age and iAge was 0.78 (P < 10−16) (Fig. 1a), which is lower than that of the recently reported ‘proteomic age’ metric (R = 0.92)90. However, in contrast with proteomic age, which did not report disease associations, we find that iAge tracks with multiple diseases and immunosenescence. In particular, we find a strong association between elevated iAge and poor acute ex vivo immune responses, which is consistent with previous reports showing that high levels of baseline inflammatory markers correlate with weaker responses to hepatitis B and herpes zoster vaccine formulations15,91. Similarly, inflammatory markers have been shown to be, at least in part, responsible for a reduced JAK–STAT response to cytokine stimulations in various leukocyte populations in our previous studies of aging28. Despite the proven utility of cytokine stimulation assays used in our study with respect to an individual’s overall immune competence5,24,25, one limitation of the assay relates to the stimuli used here which may not completely mirror the physiological stimuli that act on specific immune cell subsets in vivo. For example, while the stimuli we used strongly activate the memory compartment of bulk CD8+ and CD4+ T cells, these act relatively weakly on naive T cells. Additional cell subsets that are poorly activated by the cytokines used in our study are type 1 helper T cells CD4+ T cells that can be activated by IL-12 and IL-18 or type 17 helper CD4+ T cells, which respond to other cytokine stimulations such as IL-1β or IL-18 in concert with IL-23 to produce type 17 helper T-cell-associated cytokines.
Recent findings from our group16,28 placed the immune system in the center of aging phenotypes. Similar to our previous findings, our inflammatory clock metric specifically hones in on the crucial role that the immune system and SCI play in the accumulation of diseases of aging, with a focus on cardiovascular aging. Unlike other metrics of ‘biological’ age, which do not offer a clinically relevant metric92, we demonstrate that iAge predicts multimorbidity and mortality and therefore can be used as a biological surrogate of age-related health versus disease. iAge is directly associated with multiple disease phenotypes, including cardiovascular aging, frailty, immune decline and exceptional longevity. In our recent work16, we combined cellular phenotypes to describe subject- and population-level immune aging phenotypes (IMM-AGE), which correlated with iAge. This suggests that future research should leverage both immune-age scores to propose a unified metric that reflects multiple aspects of immune aging, thus potentially providing a better clinical predictive value.
A major contributor to the inflammatory clock, CXCL9, was validated as an indicator of cardiovascular pathology independently of age. CXCL9 is a T-cell chemoattractant induced by IFN-γ and is mostly produced by neutrophils, macrophages and ECs. Despite previous data showing that CXCL9 and other CXCR3 ligands are significantly elevated in hypertension and in patients with left ventricular dysfunction41, we find that CXCL9 is mainly produced by aged endothelium and predicts subclinical levels of cardiovascular aging in nominally healthy individuals. Some studies in humans have found CXCL9 to increase with age93–98 and an age-dependent profile has also been observed in Chagas disease99 and atopic dermatitis100. Notably, CXCL9 has also been shown to be associated with falls in the older population101,102, which parallels our results predicting frailty. At least two sources of CXCL9-mediated inflammation can ensue with aging based on our findings; one that is age-intrinsic and observed in aging ECs and one that is independent of age (likely as a response to cumulative exposure to environmental insults) and found in the validation cohort of 97 apparently healthy adults. Notably, we did not find any significant correlation between known disease risk factors reported in the study (BMI, smoking, dyslipidemia) and levels of CXCL9 gene or protein expression. We thus hypothesize that one root cause of CXCL9 overproduction is cellular aging per se, which can trigger metabolic dysfunction (as shown in many previous studies of aging) with production of DAMPs. Examples of these include adenosine, adenine and N4-acetylcytidine as demonstrated in our previous longitudinal studies of aging5. These DAMPs can then act through the inflammasome machinery, such as NLRC4, to regulate multiple inflammatory signals, including IL-1β and CXCL9 (ref. 103).
Our data also place the endothelium as a central player in cardiovascular aging, consistent with previous findings104 and they also suggest that ECs may be one source of inflammation, but it is also possible that cardiomyocytes play a role as in models of acute myocardial infarction there is activation of the inflammasome NLRP3 in these cells105,106. As ECs but not cardiomyocytes expressed the CXCL9 receptor, CXCR3 (Extended Data Fig. 9), we hypothesize that this chemokine acts both in a paracrine fashion (when it is produced by macrophages to attract T cells to the site of injury) and in an autocrine fashion (when it is produced by the endothelium) creating a positive feedback loop. In this model, increasing doses of CXCL9 and expression of its receptor in these cells leads to cumulative deterioration of endothelial function in aging. Moreover, silencing of CXCL9 in ECs resulted in a reversal of the high inflammation/low proliferation early senescence phenotype, which suggests by tackling CXCL9 it may be possible to delay onset of EC senescence. It is also notable that IFN-γ, a direct agonist to CXCL9, did not increase in expression in our cellular aging RNA-seq experiment, suggesting that there are triggers of CXCL9 (other than IFN-γ) that play a role in cellular senescence in the endothelium that are currently unknown. However, in our 1KIP study, IFN-γ was in fact the second-most important negative contributor to iAge, which could be explained by the cell-priming effect of cytokines, where the effect of a first cytokine alters the response to a different one107–109. In a more recent and refined version of this model (the high baseline-low output model for chronic inflammation and the acute response) we show that sustained levels of inflammatory mediators lead to nonfunctional constitutive phosphorylation of signaling pathways with saturation of phosphorylation sites in signaling proteins (such as the JAK–STAT system), which results in a lowered δ phosphorylation in response to acute stimuli and subsequent dampening of the immune response to infections or vaccination28.
In conclusion, by applying artificial intelligence methods to deep immune monitoring of human blood we generate an inflammatory clock of aging, which can be used as a companion diagnostic to inform physicians about patient’s inflammatory burden and overall health status, especially in those with chronic diseases. Furthermore, our immune metric for human health can identify within healthy older adults with no clinical or laboratory evidence of cardiovascular disease, those at risk for early cardiovascular aging. Lastly, we demonstrate that CXCL9 is a master regulator of vascular function and cellular senescence, which indicates that therapies targeting CXCL9 could be used to prevent age-related deterioration of the vascular system and other physiological systems as well.
Methods
Ethics declaration.
ClinicalTrials.gov identifiers for the vaccine studies are NCT01827462, NCT02133781, NCT03020498, NCT03020537, NCT01987349, NCT03022396, NCT03022422, NCT03022435, NCT03023176 and NCT02141581. This study was conducted in accordance with current relevant ethical regulations on human participant research. Written informed consent was obtained from all the study cohorts used and the study protocol was approved by the Stanford University Administrative Panels on Human Subjects in Medical Research, Institutional Review Board.
The Stanford 1000 Immunomes study cohort.
The Stanford 1KIP consists of 1,001 ambulatory individuals (339 males and 662 females) recruited at Stanford University between the years 2007 and 2016 for various studies of aging and vaccination (n = 605)5,21–29 and for an independent study of chronic fatigue syndrome30, from which we utilized data from the control set of participants only (n = 397). The current study uses blood samples collected before vaccination and where results of the flu vaccine trial have been published24.
Aging and vaccination study cohort.
Study participants were enrolled in an influenza vaccine study at the Stanford-LPCH Vaccine Program between 2007 and 2016. Baseline samples were obtained from all individuals before vaccination with influenza vaccine. The protocol for this study was approved by the Institutional Review Board of the Research Compliance Office at Stanford University. Informed consent was obtained from all participants. All individuals were ambulatory. At the time of initial enrollment volunteers had no acute systemic or serious concurrent illness, no history of immunodeficiency, nor any known or suspected impairment of immunologic function, including clinically observed liver disease, diabetes mellitus treated with insulin, moderate to severe renal disease, blood pressure >150/95 at screening, chronic hepatitis B or C or recent or current use of immunosuppressive medication. In addition, on each annual vaccination day, none of the volunteers had been recipients or donors of blood or blood products within the past 6 months and 6 weeks, respectively and none showed any signs of febrile illness on the day of baseline blood draw. Peripheral blood samples were obtained from venipuncture and mononuclear cells were separated and stored at the Stanford Clinical and Translational Research Unit. Whole blood was used for gene expression analysis. Serum was separated by centrifugation of clotted blood and stored at −80 °C before CMV serology, cytokine and chemokine determination.
Chronic Fatigue Syndrome Study cohort.
Study participants were recruited from Northern California from 2 March 2010 to 1 September 2011. Their peripheral blood was drawn between 8:30 am and 3:30 pm on the day of enrollment. Samples were collected at baseline for each participant (no exercise before blood sampling). In addition, as each patient with myalgic encephalomyelitis (ME)/chronic fatigue syndrome (CFS) was being recruited into the study, two corresponding, age and sex-matched controls, were contemporaneously enrolled until the target sample size of 200 patients and 400 controls was obtained. This approach resulted in patients and controls being intercalated in their time of entry into the study. Eight milliliters of blood were drawn into a red-topped serum tube (Thermo Fisher Scientific) by the Clinical and Translational Research Unit’s phlebotomy team. Serum was obtained by allowing blood to clot for 40 min. Once clotted, the blood tube was centrifuged in a refrigerated (4 °C) centrifuge (Allegra X-15R, Beckman Coulter) at 2,000g for 15 min. Serum was isolated and mixed thoroughly in a tube using a 2-ml sterile, serological pipette (Thermo Fisher Scientific) to obtain a homogenous solution before dispensing to storage tubes. Serum was distributed into aliquots per the Stanford HIMC (http://iti.stanford.edu/himc.html) aliquot guidelines and frozen at −80 °C. For the day of the cytokine assay, matched sets of patients with ME/CFS and healthy controls were mixed in all plates to reduce confounding case status with plate artifacts. In summary, patients with ME/CFS and controls were treated identically in terms of recruitment and serum handling protocols. To be included in the CFS Study, participants had to be 14 years of age or older, reside in Northern California and provide written informed consent and Health Insurance Portability and Accountability Act of 1996 authorization as required by the Stanford University Institutional Review Board (protocol nos. 18068 and 18155). Only healthy controls were used for this study.
Validation cohort and centenarians.
A total of 37 individuals were enrolled by two Italian study centers (Bologna and Florence) and surrounding areas. The group of centenarians consisted of 19 individuals (10 men, mean age 102.8 ± 2.3 years and 9 women, mean age 103.7 ± 2.6 years) and the group of controls consisted of 18 individuals (9 men, mean age 64.8 ± 7.9 years and 9 women, mean age 67.1 ± 7.3 years). The lists of individuals recruited here were obtained by the Office of Vital Statistics. All participants signed informed consent before undergoing the questionnaires (functional and cognitive status, depression, self-perceived health), measurements (anthropometric measures, blood pressure, physical performance) and blood sampling. History of past and current diseases was accurately collected by checking the participants’ medical documentation and addressing major age-related pathologies. The current use of medication (including inspection of drugs by the interviewer) was recorded. The study protocol was approved by the Ethical Committee of Sant’Orsola-Malpighi University Hospital. Overnight fasting blood samples were obtained in the morning. Plasma was obtained within 2 h from venipuncture by centrifugation at 2,000g for 20 min at 4 °C, rapidly frozen and stored at −80 °C.
Cardiovascular Study cohort.
After approval by Stanford’s Institutional Review Board, 151 individuals participating in the National Institute of Health sponsored 5 U19 AI05086 Study and Stanford Cardiovascular Institute Aging Study were screened for inclusion in this study. The screening process included a comprehensive health questionnaire, including the London School of Hygiene cardiovascular questionnaire. Exclusion criteria included history of acute or chronic illness such as atherosclerosis, systemic hypertension, diabetes mellitus or dementia, familial history of early cardiovascular disease (<55 years old), on nonsteroidal anti-inflammatory drugs or on inhaled steroids on a regular basis, history of malignancies, history of surgery within the last year, history of atopic skin disease, history of infection within the last 3 months, including upper respiratory infections or urinary infections and history of vaccination within the past 3 months. Patients older than 80 years who had a previous history of mild systemic hypertension but with normal blood pressure at the time of the visit (blood pressure <140/90 mm Hg) were not excluded from the study. On the basis of the inclusion and exclusion criteria, 97 individuals were included in the study. We divided the patients into four groups according to pre-specified age boundaries (25–44, 45–59, 60–74 and 75–90 years old).
Human iPSC generation and culture.
Protocols for isolation and use of patient blood were approved by the Stanford University Human Subjects Research Institutional Review Board. The iPSCs were generated using the OSKM CytoTune-iPS 2.0 Sendai Reprogramming kit viral particle factors (Life Technologies). Colonies that resembled human embryonic stem cell-like morphology were picked and seeded at one colony per 12-well plate well (Matrigel coated) in E8 medium supplemented with 10 μM Y27632. iPSCs used for this study were at passage 20–25. Details regarding the characterization of human iPSCs have been previously published110.
Human iPSC differentiation to endothelial cells.
Human iPSCs (hiPSCs) were seeded on Matrigel plates and grown in hiPSC medium for 4 d to 75–80% confluency. Differentiation to ECs was initiated by treating the hiPSCs with 6 μM CHIR99021 in RPMI-B27 without insulin medium (Life Technologies) for 2 d, followed by another treatment of 2 μM CHIR99021 in RPMI-B27 without insulin medium for 2 d. Following these treatments, differentiating hiPSCs were subjected to endothelial medium EGM2 (Lonza) supplemented with 50 ng ml−1 vascular endothelial growth factor (VEGF), 20 ng ml−1 BMP4 and 20 ng ml−1 basic fibroblast growth factor for 7 d, with the medium being changed every 2 d. On day 12, induced ECs were isolated using magnetic-activated cell sorting (MACS), where cells were first dispersed by trypsin, then incubated with CD144 antibody and finally passed through a MACS column containing CD144-conjugated magnetic microbeads (Miltenyi Biotec). The sorted cells were then seeded on 0.2% gelatin-coated plates and maintained in EGM2 medium supplemented with 10 μM SB431542 (TGF-β inhibitor). hiPSC-ECs were passaged on confluence and maintained in EGM2 medium.
In vitro monolayer cardiomyocyte differentiation of human iPCSs.
To induce cardiomyocyte differentiation, approximately 1 × 10⁵ undifferentiated hiPCSs were seeded in each well of Matrigel-coated six-well plates and cultured in differentiation medium111,112. Glucose-free MEM-α supplemented with fetal bovine serum (FBS) and lactate was employed to enrich cells to 98.0% α-actinin-positive at 37 °C, 20% O2 and 5% CO2 in a humidified incubator with a change of medium every 48 h and cells were passaged once they reached 80–90% confluence. The hiPSC-induced cardiomyocytes were treated immediately after enrichment.
Cell lines.
Human umbilical vein ECs were purchased from Lonza and cultured in EGM2 medium (Lonza) with changes of the medium every 2 d. Human fibroblasts were purchased from ScienCell Research Lab and cultured in Dulbecco’s modified Eagle’s medium (Gibco), supplemented with 20% FBS and 1% filter-sterilized penicillin–streptomycin.59.
Cardiovascular phenotyping.
Cardiovascular age was assessed using three parameters: (1) aortic PWV, a measure of vascular stiffness; (2) RWT, a measure of ventricular remodeling and (3) early diastolic mitral annular velocities (e′), a measure of ventricular relaxation. In addition, we measured the ratio of early mitral inflow velocity (E) to e′, a surrogate marker of end-diastolic filling pressures113,114.
Aortic PWV was calculated as the ratio of the pulse wave distance (in meters) to the transit time (in seconds). A 9.0-MHz Philips linear array probe was used to assess the carotid arteries (main common, bulb and internal carotid artery) and proximal femoral arteries. Pulse wave distance (D) was measured as the distance from the sternal notch to the femoral artery (xdirect) from which we subtracted the distance from the sternal notch to proximal descending aorta (D = xdirect − xnotch−aorta). The intersecting tangent method was used to measure the time from a reference echocardiograph signal and the foot of the pulse wave. Heart rate had to be within 2 b.p.m. between the carotid and femoral signal. All Doppler signals were recorded at 150 mm s−1. Inter-observer variability was calculated on 50 samples in our laboratory and the intraclass correlation coefficient was 0.94 for PWV measured by two independent observers (independent measures of path length and transit time).
Echocardiographs were performed using the Philips IE33 system according to recommendations115. All studies were interpreted by one physician (F.H.) who was blinded to age as well as clinical and biological data. All parameters were measured in triplicate and averaged. Ventricular dimensions and wall thickness were measured using M-mode derived measures; we excluded the septal band from the measurement of the septum and chordates from the measurements of the posterior wall. RWT was calculated as the sum of the septal and posterior wall divided by left ventricular internal dimensions. Ventricular mass was estimated using the American Society of Echocardiography’s recommended formula based on modeling the left ventricle as a prolate ellipse115. Left ventricular ejection fraction was estimated using the Simpson biplane method. The tissue Doppler e′ velocity represents an average of the septal and lateral annulus113,114. Inter-observer variability was calculated on 50 samples; the intraclass correlation in our laboratory is 0.93 for left ventricle mass measurements.
Induced human pluripotent stem cell-derived cardiomyocytes and endothelial cells.
We derived iPSCs from five healthy individuals and cell lines passed common assessments for pluripotency such as expression of pluripotent markers (Oct4 and Nanog) and genomic stability such as karyotyping. These iPSCs were differentiated into cardiomyocytes to purities of >85% and ECs to purities of >90%. iPSC cardiomyocytes were differentiated on day 30 and iPSC-ECs were differentiated on day 14. Both types of cells expressed mature cell markers such as PECAM1 for ECs and MYH6 for cardiomyocytes.
Real-time PCR.
To analyze gene expression of CXCR3, RNA was isolated using a RNeasy Plus kit (QIAGEN), complementary DNA was produced using a High-Capacity RNA-to-cDNA kit (Life Technologies) and real-time PCR was performed using TaqMan Gene Expression Assays, TaqMan Gene Expression Master Mix and a StepOnePlusTM Real-Time PCR System (Life Technologies). All PCR reactions were performed in triplicate, normalized to the GAPDH endogenous control gene and assessed using the comparative Ct method.
To analyze the gene expression pattern for CXCL9, RNA was extracted using a QIAGEN RNA isolation kit (QIAGEN 74104) and cDNA was synthesized using qScript cDNA SuperMix (QuantaBio). Real-time PCR was performed using TaqMan Gene
We used expression assays (GAPDH, Hs02758991_g1, CXCL9, Hs00171065_m1), TaqMan Master Mix using a 7900HT Real-Time PCR System (Thermo Fisher Scientific). All PCR reactions were performed in triplicate, normalized to the GAPDH housekeeping gene and assessed using the ΔΔCt relative quantification method.
RNA sequencing.
To understand the gene expression landscape in aging iPSC-ECs, we performed bulk RNA-seq on iPSC-ECs at different passages including P0, P2, P4, P6 and P8 iPSC-ECs. Similarly, to confirm our findings that aging ECs express elevated levels of CXCL9 and its downstream effects, we included CXCL9-KD hiPSC-ECs for RNA sequencing. Briefly, Scramble or CXCL9-KD hiPSCs were differentiated to ECs using our established protocol and once sorted, iPSC-ECs were collected at these specific passages for RNA extraction. Total RNA was extracted using an RNeasy mini kit (QIAGEN) and shipped to Novogene for RNA sequencing, where RNA samples were converted into individual cDNA libraries (250–300-bp insert cDNA library). TruSeq methods used single reads of 50 base lengths sequenced at 20–30 million read depths with the use of the Illumina Platform PE150. Trimmed sequences were generated as FASTQ outputs and mapped to the human reference genome (hg38) using HISAT2 and raw counts of transcripts were obtained using featureCounts. The counts were further imported to R-studio as input for normalization and differential expressed gene analysis using DESeq2. The R package, FGSEA, was used to conduct pathway enrichments using Hallmark gene sets from the Broad Institute’s MSigDB collections116.
Vascular tube-like formation.
The functions of the generated hiPSC-ECs were characterized in angiogenic assays and compared to hiPSCs. The generated hiPSC-EC were assessed for their ability to form tube-like structures by seeding 1 × 10⁴ cells in wells coated with Matrigel (Corning Matrigel Matrix) containing EGM2 medium supplemented with 50 ng ml−1 VEGF and incubated for 16–24 h.
Isometric tension recordings.
Mouse thoracic aortas were carefully dissected and the vessels were transferred to a dish with ice-cold Krebs solution (in mmol l−1, 133 NaCl, 4.6 KCl, 2.5 CaCl2,16.3 NaHCO3, 1.75 Na2HPO4, 0.6 MgSO4, 10 glucose). The vessels were cut into small rings and mounted on an isometric wire myograph chambers (Danish Myo Technology) and subjected to a normalization protocol. Following normalization, vessels were incubated with either PBS or different concentrations of recombinant mouse CXCL9 protein (R&D systems, catalog no. 492-MM) for 3–4 h. A concentration-dependent contraction curve was created by the cumulative application of the prostaglandin agonist U46619. Subsequently, concentration-dependent relaxation curves of acetylcholine were conducted on these vessels and percentage relaxation was calculated for each dose.
CXCL9 knockdown.
Gene knockdown experiments were performed using the GIPZ CXCL9 shRNA Viral Particle Starter kit (Dharmacon) containing a pool of select shRNA. These included V3LHS_368350 (TAGACATGTTTGAACTCCA), V3LHS_409682 (AGTTATATACTGTCTACCT) and V3LHS_409683 (AGAAGAACAAAGACAATCA). The multiplicity of infection of CXCL9 shRNA was assessed after 72 h of infection by puromycin selection and green fluorescent protein analysis according to the manufacturer’s instructions. iPSCs were transfected with CXCL9 shRNA lentivirus at a multiplicity of infection >0.9 and knockdown efficiency was measured by real-time PCR with reverse transcription.
Whole-blood gene expression.
Five hundred nanograms of high-quality total RNA was used for the Illumina gene expression microarray (HumanHT-12 BeadChip, v4) experiment. The Illumina Direct Hyb labeling method performs 3′-based gene expression measurements through reverse transcription and in vitro transcription techniques that incorporate biotin-labeled nucleotides into nascent products. Labeled cRNA products are hybridized onto bead arrays, washed and stained with streptavidin-Cy3. Each array on the HumanHT-12 BeadChip targets >25,000 annotated genes with >48,000 probes. Hybridization and scanning was performed using the Illumina BeadArray reader at the Stanford Functional Genomics Facility as described in the Whole-Genome Gene Expression Direct Hybridization Assay Guide (catalog no. BD-901-1002, 11322355 rev. A). Data were extracted using the Illumina BeadStudio for further analysis.
Selecting the most important genes predictive of iAge.
iAges were calculated for our cohort. In that cohort, 397 individuals had gene expression data. We regressed iAge onto gene expression data using a LASSO regression (glmnet R)117 and implemented 100 of such regressions. Due to the stochastic nature of LASSO regression, each implementation produced a slightly different list of genes that were predictive of iAge. For the final list of selected genes, we filtered for genes that were selected 100 out of 100 times from the regressions.
Flow cytometry immunophenotyping.
This assay was performed by the HIMC at Stanford University. PBMCs were thawed in warm medium, washed twice and resuspended at 1 × 10⁷ viable cells ml−1. Then, 50 μl cells per well were stained for 45 min at room temperature with the relevant antibodies (all reagents from BD Biosciences). Cells were washed three times with FACS buffer (PBS supplemented with 2% FBS and 0.1% sodium azide) and resuspended in 200 μl FACS buffer. Then, 100,000 lymphocytes per sample were collected using DIVA 6.0 software on an LSRII flow cytometer (BD Biosciences). Data analysis was performed using FlowJo v.9.3 by gating on live cells based on forward versus side-scatter profiles, then on singlets using forward scatter area versus height, followed by cell subset-specific gating.
Phosphoepitope flow cytometry (cytokine stimulation, pSTAT readouts).
This assay was performed by the HIMC at Stanford University. PBMCs were thawed in warm medium, washed twice and resuspended at 0.5 × 10⁶ viable cells ml−1. Then, 200 μl of cells were plated per well in 96-well deep-well plates. After resting for 1 h at 37 °C, cells were stimulated by adding 50 μl of cytokine (IFN-α, IL-6, IL-10 or IL-2) and incubated at 37 °C for 15 min. PBMCs were then fixed with paraformaldehyde (PFA), permeabilized with methanol and stored at −80 °C overnight. Each well was barcoded using a combination of Pacific Orange and Alexa-750 dyes (Invitrogen) and pooled in tubes. Cells were washed with FACS buffer (PBS supplemented with 2% FBS and 0.1% sodium azide) and stained with the following antibodies (all from BD Biosciences): CD3 Pacific blue, CD4 PerCP-Cy5.5, CD20 PerCp-Cy5.5, CD33 PE-Cy7, CD45RA Qdot 605, pSTAT-1 AlexaFluor488, pSTAT-3 AlexaFluor647 and pSTAT-5 PE. The samples were then washed and resuspended in FACS buffer. Then, 100,000 cells per stimulation condition were collected using DIVA 6.0 software on an LSRII flow cytometer (BD Biosciences). Data analysis was performed using FlowJo v.9.3 by gating on live cells based on forward versus side-scatter profiles, then on singlets using forward scatter area versus height, followed by cell subset-specific gating.
CyTOF immunophenotyping.
This assay was performed in the HIMC at Stanford University. PBMCs were thawed in warm medium, washed twice, resuspended in CyFACS buffer (PBS supplemented with 2% BSA, 2 mM EDTA and 0.1% sodium azide) and viable cells were counted by Vi-cell. Cells were added to a V-bottom microtiter plate at 1.5 × 10⁶ viable cells per well and washed once by pelleting and resuspension in fresh CyFACS buffer. The cells were stained for 60 min on ice with 50 μl of the relevant antibody–polymer conjugate cocktail. All antibodies were from purified unconjugated, carrier-protein-free stocks from BD Biosciences, BioLegend or R&D Systems. The polymer and metal isotopes were from DVS Sciences. The cells were washed twice by pelleting and resuspension with 250 μl FACS buffer. Cells were resuspended in 100 μl PBS buffer containing 2 μg ml−1 live-dead (DOTA-maleimide (Macrocyclics) containing natural-abundance indium). The cells were washed twice by pelleting and resuspension with 250 μl PBS. The cells were resuspended in 100 μl 2% PFA in PBS and placed at 4 °C overnight. The next day, cells were pelleted and washed by resuspension in fresh PBS. Cells were resuspended in 100 μl eBiosciences permeabilization buffer (1× in PBS) and placed on ice for 45 min before washing twice with 250 μl PBS. If intracellular staining was performed, cells were resuspended in 50 μl antibody cocktail in CyFACS for 1 h on ice before washing twice in CyFACS. Cells were resuspended in 100 μl iridium-containing DNA intercalator (1:2,000 dilution in PBS; DVS Sciences) and incubated at room temperature for 20 min. Cells were washed twice in 250 μl MilliQ water and then diluted in a total volume of 700 μl in MilliQ water before injection into the CyTOF (DVS Sciences). Data analysis was performed using FlowJo v.9.3 (CyTOF settings) by gating on intact cells based on iridium isotopes from the intercalator, then on singlets by Ir191 versus cell length, then on live cells (Indium-live-dead minus population), followed by cell subset-specific gating.
Phosphoepitope CyTOF (cytokine stimulation, pSTAT readouts).
This assay was performed by the HIMC at Stanford University. PBMCs were thawed in warm medium, washed twice, counted by Vi-cell and resuspended at 5 × 10⁶ viable cells ml−1. Then, 100 μl of cells were plated per well in 96-well deep-well plates. After resting for 1 h at 37 °C, cells were stimulated by adding 25 μl each of IFN-α, IL-6, IL-10 or IL-2 and incubated at 37 °C for 15 min. Cells were then fixed with PFA, washed twice with CyFACS buffer (PBS supplemented with 2% BSA, 2 mM EDTA and 0.1% sodium azide) and stained for 30 min at room temperature with 20 μl of surface antibody cocktail. Cells were washed twice with cyFACS buffer, permeabilized with 100% methanol and stored at −80 °C overnight. On the next day, cells were washed with cyFACS buffer and resuspended in 20 μl intracellular antibody cocktail in CyFACS buffer for 30 min at room temperature before washing twice in CyFACS buffer. Cells were resuspended in 100 μl iridium-containing DNA intercalator (1:2,000 dilution in 2% PFA in PBS) and incubated at room temperature for 20 min. Cells were washed once with cyFACS buffer and twice with MilliQ water, then were diluted to 7.5 × 10⁵ cells ml−1 in MilliQ water before injection into the CyTOF. Data analysis was performed using FlowJo v.9.3 (CyTOF settings) by gating on intact cells based on the iridium isotopes from the intercalator, then on singlets by Ir191 versus cell length followed by cell subset-specific gating.
Determination of serum immune proteins.
This assay was performed in the HIMC at Stanford University. Human 50- or 51-plex Luminex polystyrene bead kits were purchased from Panomics/Affymetrix and were used according to the manufacturer’s recommendations with modifications as described below. Briefly, samples were mixed with antibody-linked polystyrene beads on 96-well filter-bottom plates and incubated at room temperature for 2 h followed by overnight incubation at 4 °C. Room temperature incubation steps were performed on an orbital shaker at 500–600 r.p.m. Plates were vacuum filtered and washed twice with wash buffer, then incubated with biotinylated detection antibody for 2 h at room temperature. Samples were then filtered and washed twice as above and resuspended in streptavidin-PE. After incubation for 40 min at room temperature, two additional vacuum washes were performed and the samples were resuspended in Reading Buffer. Each sample was measured in duplicate. Plates were read using a Luminex 200 instrument with a lower bound of 100 beads per sample per cytokine. Custom assay control beads by Radix Biosolutions were added to all wells.
SOMAscan assay.
Thirty-seven plasma samples (from 19 centenarians and 18 others aged 50–79 years) from two different cohorts (PRIN06 and PRIN09) were used in this study. Samples were stored at −80 °C and sent on dry ice to SomaLogic. The SOMAscan platform was used to quantify levels of plasma proteins118. Briefly, this platform is based on modified single-stranded DNA (SOMAmers) that are used to bind to specific protein targets. Data in relative fluorescent units for 1,305 SOMAmer probes were obtained for these samples and no samples or probe data were excluded. PRIN06 and PRIN09 samples were measured in two batches. Datasets were bridged to each other using SomaLogic calibrators.
Quantification and statistical analysis.
Normalization procedures for Luminex assays.
We conducted a three-step normalization procedure. First, we used an internal control (CON-S) that was run on each batch to plate-normalize the data. We considered the regression model
where outcome Yij is the cytokine’s median fluorescence intensity averaged over duplicate wells (aMFI) for the jth participant on the ith plate, x is the design vector of variables of interest with corresponding regression coefficient β, and z is the design vector of nuisance variables of corresponding regression coefficients γ. These may include baseline covariates and random coefficients to model longitudinal data. Covariance among repeated observations within participants (for example, longitudinal aMFI) was modeled via C(Eijk, Eijk′) for k ≠ k′. Parameter β0 is the intercept. This model also adjusts for nonspecific binding c (used CHEX4) (with corresponding regression coefficients α)30. The vector form permits modeling of any nonlinear effects of nonspecific binding on the outcome. For plate effects, we used the indicator-variable vector, p, of plate effects has regression coefficients θ. The variance of regression residual E is allowed to vary among plates, such as Var(Eij) ≠ Var(Ei′j) for i ≠ i′. Together, p′θ and variance Var(Eij) account, respectively, for location and scale effects of plates.
Second, for source normalization of the influenza vaccine studies versus chronic fatigue study, we used a naive correction in which PCA is conducted on all data and the effect of top components is removed by regression analysis on the data source until the batch effect is no longer significant. The mean absolute correlation is then computed as a function of the number of PCA components in batch-corrected versus raw data and heat maps for before and after PCA correction are also shown (Extended Data Fig. 4).
Guided auto-encoder and the inflammatory clock.
When dealing with data with a large number of dimensions and complex network structures, we aimed to find a nonlinear method to summarize the data possibly to a compact representation. This compact representation can be further used for feature extraction, visualization or classification purpose. To obtain an informative representation, we proposed a model called GAE. The method is built based on Auto-Encoder with a combined objective. Auto-encoders use a nonlinear transformation of data and hence, can model complex processes119. One problem with auto-encoders is re-parameterization. With different initialization, it could have different results. Among the different types of visualizations with similar summarization levels, one usually wants a representation that is informative of a specific target. Hence, we can construct a representation with two focuses: (1) the learned compact representation can be recovered from the original data as much as possible (reconstruction loss) and (2) the learned compact representation should be as informative of the desired target as possible (prediction loss). Therefore, we proposed a structure, GAE, which balances the two objectives, to provide an informative representation. We applied GAE to extract an immunology score or inflammatory clock. It is a nonlinear transformation of the cytokine data in a person that both approximates the true age, while preserving the information of cytokine level.
Auto-encoder.
Given the input data vector x, an auto-encoder aims to reconstruct the input data vector x. We consider that an auto-encoder with L encoding layers and L decoding layers has a depth of L and each layer has a fixed number of hidden nodes, m.
For convenience, the input layer is defined as h0(x) = x and the output of the lth hidden layer is defined as hl(x). The number of nodes in layer l is ml. The input into the lth layer of the network is defined as:
where Wl is a real value weight matrix of ml−1 by ml and βl is a vector of length ml-1. The output of lth hidden layer is:
where tanh is the hyperbolic tangent function:
We define the output of the Lth layer hL(x) as the coding layer. The decoding layers are from L + 1 to 2L − 1 layer with the same setting. Finally, a linear output layer is on top of the last decoding layer:
Given data vectors x, we train an auto-encoder and minimize the reconstruction loss on the data:
where i is the range of the number of samples, θ represents all the parameters used in the auto-encoder and λ is the weight decay penalty used for regularization. To optimize objective (1), we used a stochastic optimization method ADAM120.
Guided auto-encoder.
A GAE aims to reduce both reconstruction loss and predictive loss. Given the input x, a side-phenotype y and an auto-encoder fAE, the GAE incorporates a predictive function on the coding layer:
with its own set of parameters wG and βG
Let θ be the set of all parameters of a GAE, the training objective is:
| (2) |
where α is a real value number between 0 and 1, which is called the guidance ratio. An example GAE with depth 2 and width 3 is shown in Supplementary Fig. 1. We use the optimization method ADAM120 to minimize objective. By choosing different guidance ratios, we can reach different levels of balance between prediction loss and reconstruction loss.
Extraction of an inflammatory clock.
To provide a marker summarization of a patient’s immune system health state, we present the inflammatory clock. This is the age of patient that is predictable from the inflammatory state of the immune system. To obtain this quantity, we focused on cytokine measurements. By construction, the inflammatory clock is a nonlinear function of cytokine measurements, but also an estimate of the patient’s true age.
To construct this quantity, we used GAE aimed to compactly represent cytokine measurements and predict side-phenotype chronological age. We identified best code length, among lengths from 1 to 10, using fivefold cross validation. We selected the length of code k, whose performance was not statistically significantly worse than that of longer codes (paired Student’s t-test P value >0.05). Within each fold, we performed nested threefold cross validation to select hyper-parameters (depth, weight decay and guidance ratio).
After obtaining the best code length as 5 (Extended Data Fig. 3a), we used fivefold cross validation to select the best hyper-parameter setting (depth = 2, guidance ratio = 0.2, L2 = 0.001) on all GAEs with a code length of 5. Finally, we trained the GAE on the whole dataset with the selected best hyper-parameter setting and obtained the predictive function as the inflammatory clock predictor. To derive the inflammatory clock index, we computed rank differences between exceptional longevity participants and adult controls. To do so, we first ranked both cohorts in terms of cAge and iAge. For each participant, we then computed the difference of their cAge rank and iAge rank and used this difference (iAge index) to stratify participants into high and low, if they were above or below the population mean, respectively. Any monotonic transformation of cAge or iAge does not affect ranks, hence findings are robust to transformations such as log and exp.
The model to construct iAge utilizes cross-sectional data, where the first instance for each individual record (baseline) is selected. Despite that a number of individuals’ samples were collected in a longitudinal manner between 2007 and 2016 (Supplementary Fig. 1). To assess feature dependency to the iAge metric, a fivefold cross-validation procedure was conducted, which effectively split the dataset 80–20% repeatedly and absolute error was obtained from averaging model error obtained on each of the test sets.
Prediction of multimorbidity using cyclical coordinate descent and correlation with immunosenescence.
We hypothesized that important immune components would emerge from fitting a linear regression model with l1 and l2 penalties, the Elastic Net penalty, a regularization algorithm that uses cyclical coordinate descent in a path-wise fashion. We envisioned an unbiased approach to select predictors of multimorbidity based on available data for all 902 participants while controlling for the age effect. A total of 127 features were included in the prediction model. We assume all of our predictors are standardized to a mean of 0 and s.d. of 1. The result of our fitting procedure is the set of predictor weights β and intercept α for the linear regression model. In practice, penalty weights are set by a data-driven procedure, such as tenfold cross validation. The minimum λ was chosen to yield the lowest MAE with the minimum set of features. We envisioned age-controlled feature selection by imposing a feature-specific penalty. In this procedure feature age is ‘forced in’ the model and the l1 penalty is able to choose from all other features. In practice, we created a vector of size 127 and chose α = 0 for feature age and α = 1 for the remaining 126 features. To investigate the effect of iAge on immunosenescence, multiple regression analysis was conducted using iAge as a predictor variable (controlled by age, sex and CMV) and the frequency of naive CD8+ T cells, as a target variable (a surrogate of immunosenescence). Similarly, the effect of iAge (after controlling for age, sex and CMV) was estimated on a total of 92 cell stimulations. Adjusted P values (by permutation tests) were combined by using a modified Fisher’s combined probability test121.
Estimation of the inflammatory clock in centenarians and older control cohorts.
We first aimed at estimating the minimum set of features required for accurate prediction of the inflammatory clock. To do so, we used the results from our previous analysis in which we investigated the composition of the inflammatory clock based on the first-order partial derivative of the inflammatory clock (Jacobians). We sorted the immune features based on their absolute Jacobian and subsequently generated n − feature set models, each with a different feature number and removed one feature at a time starting from the least to the most important, which is never fully discarded. With the removal of each feature, a P value (two sample Student’s t-test) on the cross-validation errors between the ‘feature set model’ and the ‘all-feature-set model’ is computed. Removal of most features did not significantly affect prediction accuracy (Extended Data Fig. 2). The cross-validation error using only five features (model 1) (EOTAXIN, IFNG, GROA, TRAIL and CXCL9 (which are not removed as they are the last feature)), is not significantly different from the error obtained using all features (model 2), indicating that the inflammatory clock can be estimated with this reduced set, as accurately as by using all 50 features.
As one important immune protein was not measured in the SOMAscan assay (TRAIL), we aimed to build a regression model to predict inflammation, excluding TRAIL, which yields the same accuracy as model 1. Hence, we compared the inflammatory clock prediction accuracy of model 1, to the accuracy of a series of models (TRAIL excluded) including an increasing number of features based on feature contribution to the inflammatory clock, as performed previously. Using Stanford 1KIP data, we found that the prediction accuracy of a model when TRAIL is removed but containing EOTAXIN, MIP-1α, CXCL1, CXCL9, IFN-γ, IL-1β, IL-2, LEPTIN and PAI-1 was not different from that of model 1 (in which TRAIL is included) (by likelihood ratio test, P < 0.01).
We then directly estimated the inflammatory clock as the predicted age of participants in the aging control cohort and centenarians based on standardized coefficients from the previous analysis on the Stanford 1KIP dataset and normalized RTU values for EOTAXIN, MIP-1α, CXCL1, CXCL9, IFN-γ, IL-1β, IL-2, LEPTIN and PAI-1. The inflammatory clock was then used to compute an inflammatory clock index (rank cAge minus rank iAge) in these cohorts.
Enrichment analysis of iAge gene signature on Framingham Heart Study.
The Framingham Heart Study gene expression, phenotypic clinical data and longitudinal survival data were downloaded from dbGap and preprocessed as detailed in Alpert et al.16. The enrichment of the gene signature in the Framingham Heart Study samples was calculated using single-sample gene-set enrichment analysis122. For survival analysis, we calculated a multivariate Cox regression model (n = 2,290) regressing all-cause mortality against the clinical covariates: age, sex, smoking status, diabetes, total cholesterol, HDL cholesterol, blood pressure, a cardiovascular disease status assessed on the date of the eighth exam and the iAge score.
Isolation of blood endothelial cells.
Blood collected from young and old individuals was centrifuged to isolate the buffy coat, which was washed with PBS as described previously60. Following centrifugation, cell pellets were resuspended in blood outgrowth EC medium containing 20% FBS in EGM2 medium and seeded on collagen-coated plates. Medium was changed every 2 d and BECs were characterized once confluent.
Isolation of mouse aortic endothelial cells.
Aortas from young (3–4 months) and old (2 years) mice were dissected, cut and digested using freshly prepared 1 μg ml−1 Liberase solution (R&D) for 30 min. Following digestion, cell pellets were resuspended in EGM2 medium with 5% FBS. Once confluent, ECs were isolated by MACS using CD144-conjugated magnetic beads.
Endothelial functional assays.
Tube formation.
The functions of the generated hiPSC-ECs and blood ECs were characterized in angiogenic assays and compared to hiPSCs. Briefly, cultured iPSC-ECs were dissociated using 1× trypsin and 1 × 10⁴ cells were resuspended in EGM2 medium supplemented with 50 ng ml−1 VEGF. Following this, cells were seeded on 24-well plates, precoated with Matrigel (Corning Matrigel Matrix) for 16–24 h.
Nitric oxide production.
The capacity of iPSC-ECs and blood ECs to produce NO was assessed by measuring the concentration of NO in culture supernatants using a NO detection kit (Molecular Probe) in basal and acetylcholine-stimulated conditions. Briefly, nitrates in culture supernatants were converted into nitrite and the total amount of nitrite was determined by colorimetric Griess reaction. Readings were recorded by measuring the absorbance at 540 nm using a microplate reader.
Ac-LDL uptake.
The capacity of iPSC-ECs and blood ECs to uptake Ac-LDL was assessed using fluorescently labeled LDL. Briefly, cells were incubated in 96-well white clear-bottom cell culture plates for 24 h and fluorescence was measured at Ex/Em = 540/575 nm. Results were calculated using a standard curve according to the manufacturer’s instructions (Biovision). A wash-off step was performed to determine nonspecific fluorescently labeled LDL.
In vivo angiogenesis assay.
The capacity of iPSC-ECs to form functional capillaries in vivo was assessed by injecting 5 × 10⁵ cells mixed in Matrigel to make a final volume of 200 μl. Cells were injected subcutaneously in SCID mice and after 2 weeks, Matrigel plugs were excised for immunohistochemical analysis. Plugs were fixed in 4% PFA, sectioned and stained for human CD31. CD31+ human capillaries were quantified per field using a fluorescent microscope.
Cellular senescence activity assay.
Cellular senescence assay was performed to detect SA-β-gal activity using a fluorometric format (Enzo, catalog no. ENZ-KIT129). Briefly, cell lysates were collected and SA-β-gal activity was measured using a fluorometric substrate. Fluorescence was measured at 360 nm (excitation)/465 nm (emission).
Statistics and reproducibility.
For our experiments, no statistical method was used to predetermine sample size. No data were excluded from the analyses. No randomization or blinding was conducted for this study. Covariates such as age, BMI, detection of CMV and sex were controlled by their inclusion in all regression analysis. For the cardiovascular study the data were interpreted by one physician (F.H.) who was blinded to age as well as clinical and biological data. Blinding was not performed in mice experiments.
Reporting Summary.
Further information on research design is available in the Nature Research Reporting Summary linked to this article.
Extended Data
Extended Data Fig. 1 |. 1000 Immunomes Study design: systematic analysis of immune systems via ‘OMiCS’ approaches.
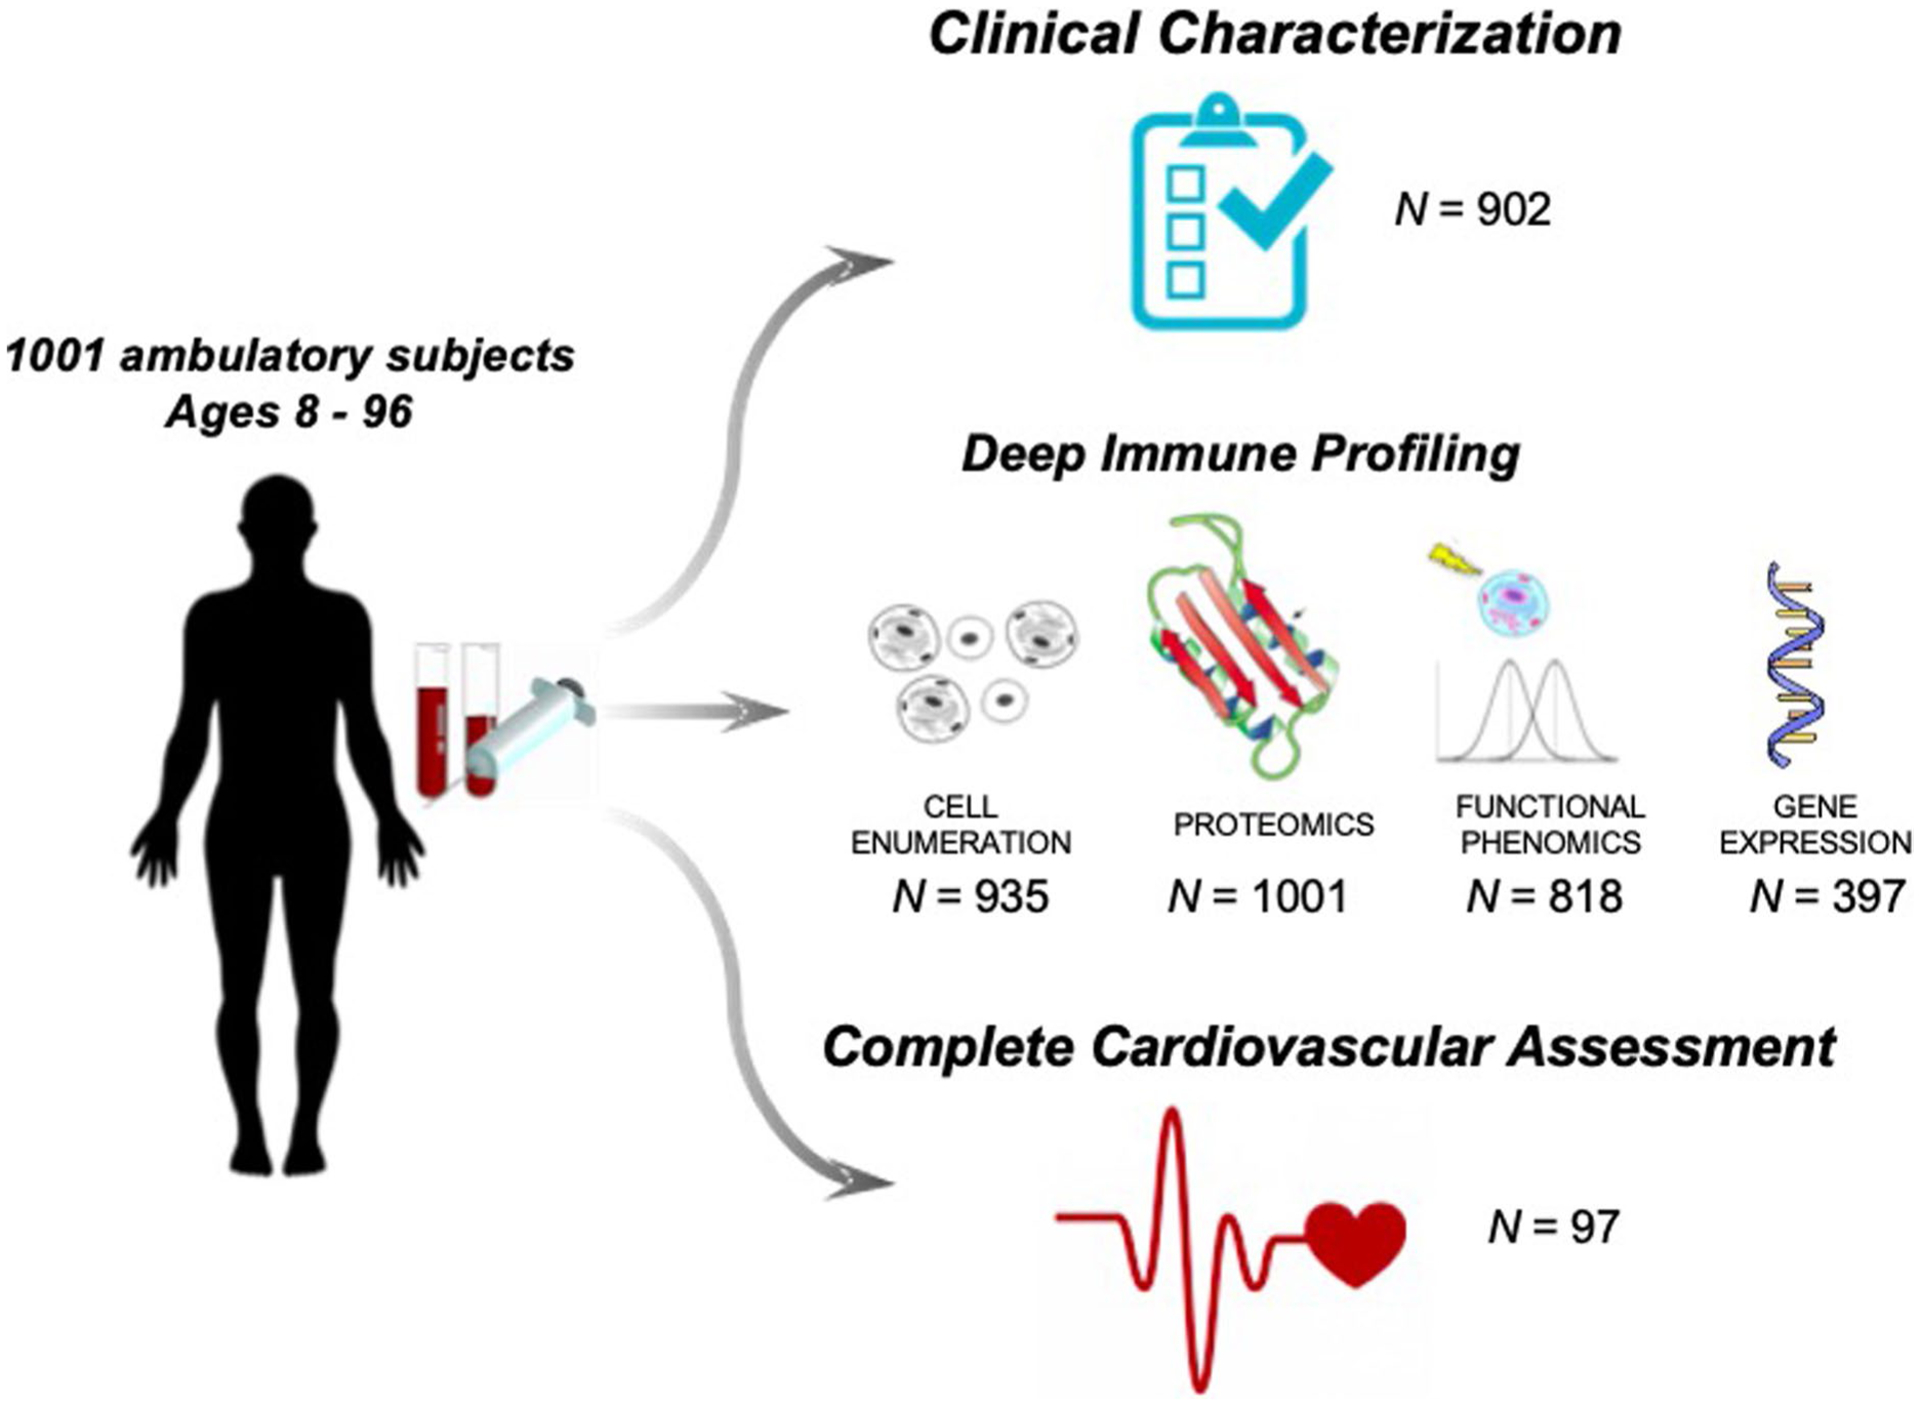
The Stanford 1000 Immunomes Project consist of 1001 ambulatory subjects age 8 to 96 (34% males, 66% females) recruited during the years 2007 to 2016 for a longitudinal study of aging and vaccination, and for an independent study of chronic fatigue syndrome from which only healthy controls were included. For all samples of the Stanford 1KIP, deep immune phenotyping was conducted at the Stanford Human Immune Monitoring Center, where peripheral blood specimens were isolated and analyzed using standard procedures. Peripheral blood samples were obtained by venipuncture and peripheral blood mononuclear cells or whole blood samples were used for determination of cellular phenotypes and frequencies (N = 935) and for investigation of in vitro cellular responses to a variety of cytokine stimulations (N = 818); serum samples were obtained and used for protein content determination (including a total of 50 cytokines, chemokines and growth factors) (N = 1001). Clinical characterization was assessed via clinical questionnaire in a total of 902 subjects who completed the full set of 53 clinical items. From a total of 97 healthy young and older adults, comprehensive cardiovascular phenotyping was also conducted
Extended Data Fig. 2 |.
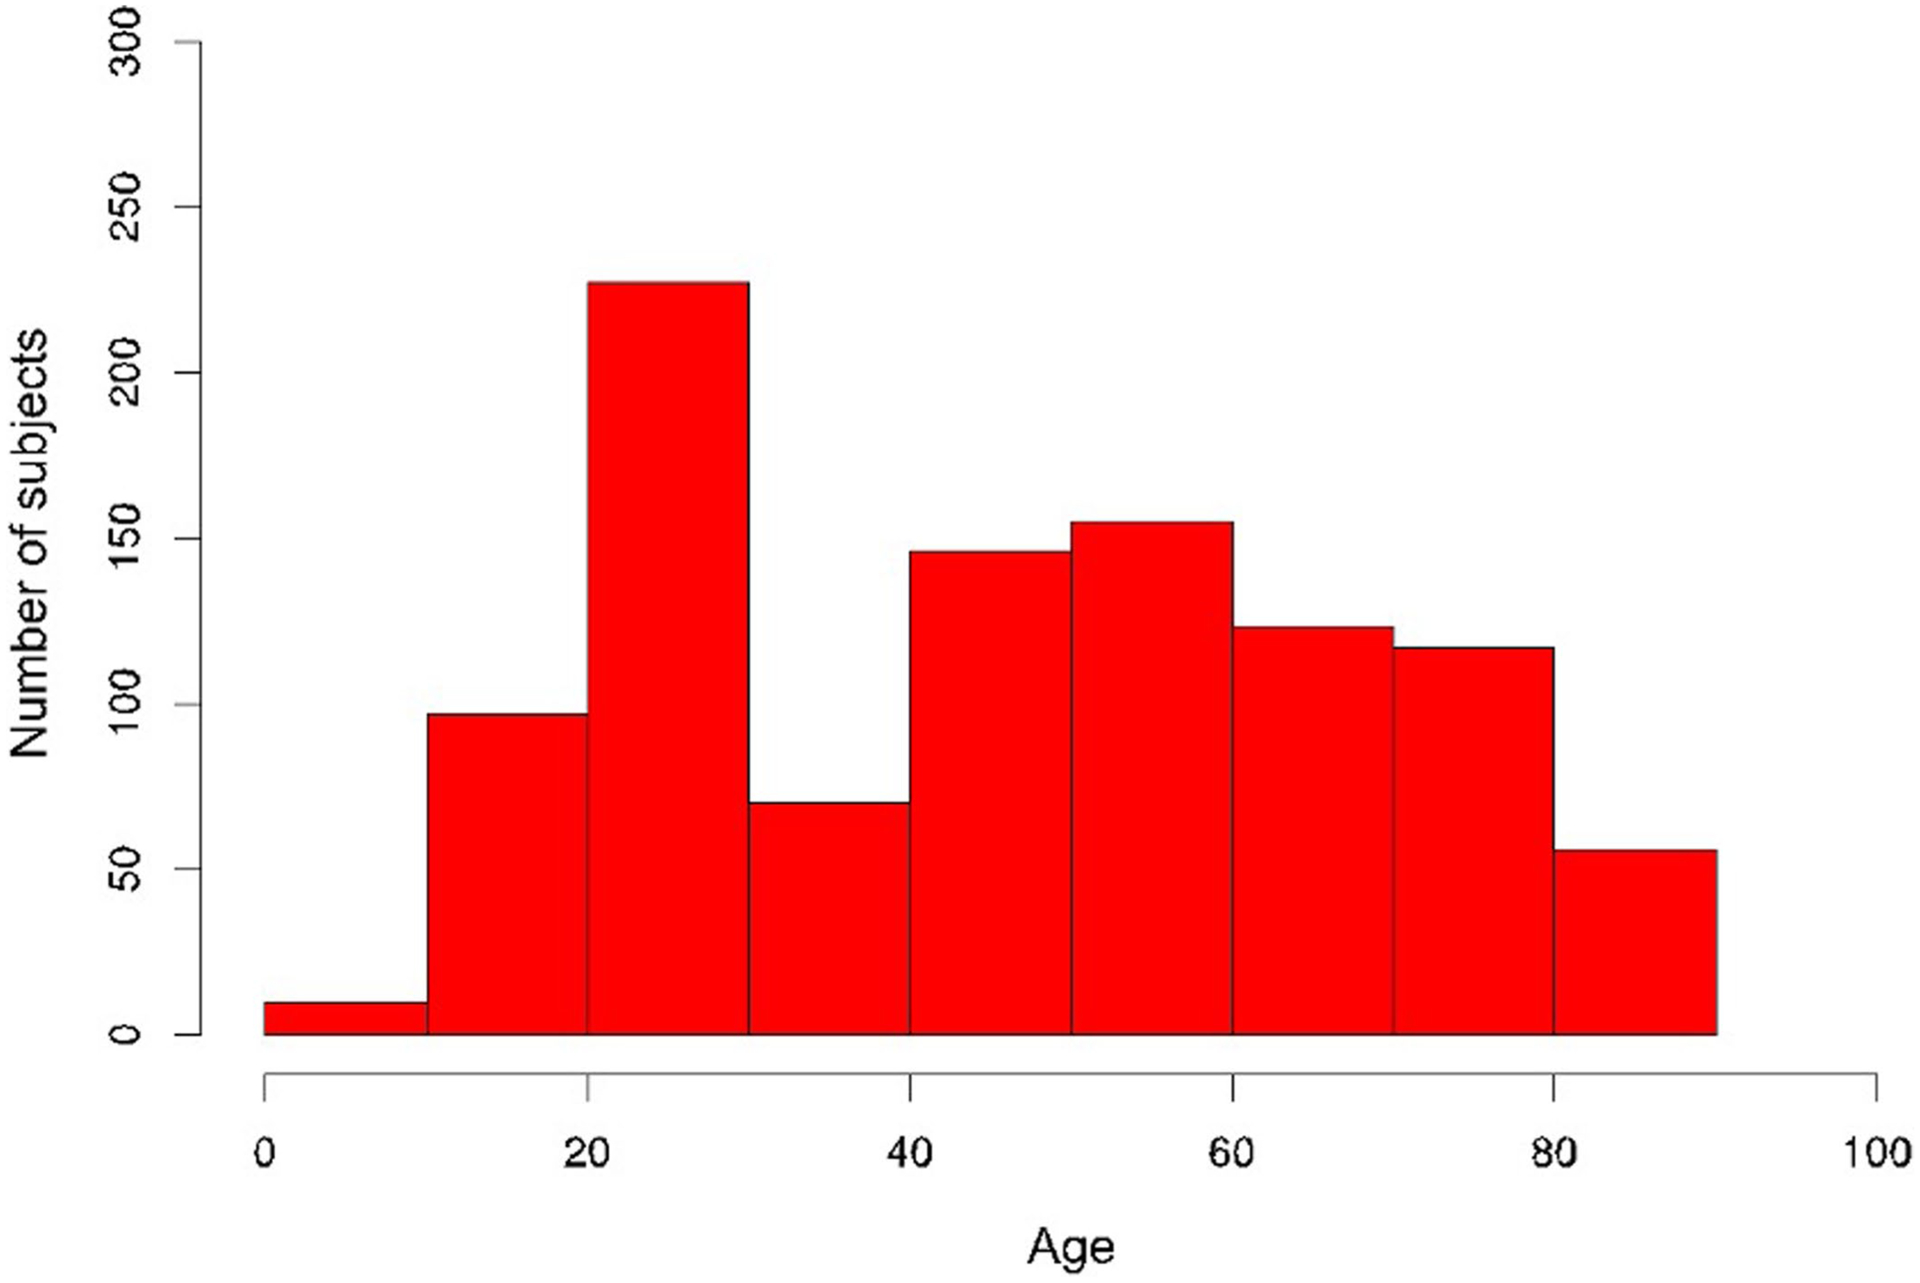
Age distribution of the Stanford 1KIP cohort.
Extended Data Fig. 3 |. Estimation of the GAE code length and accuracy of age prediction.
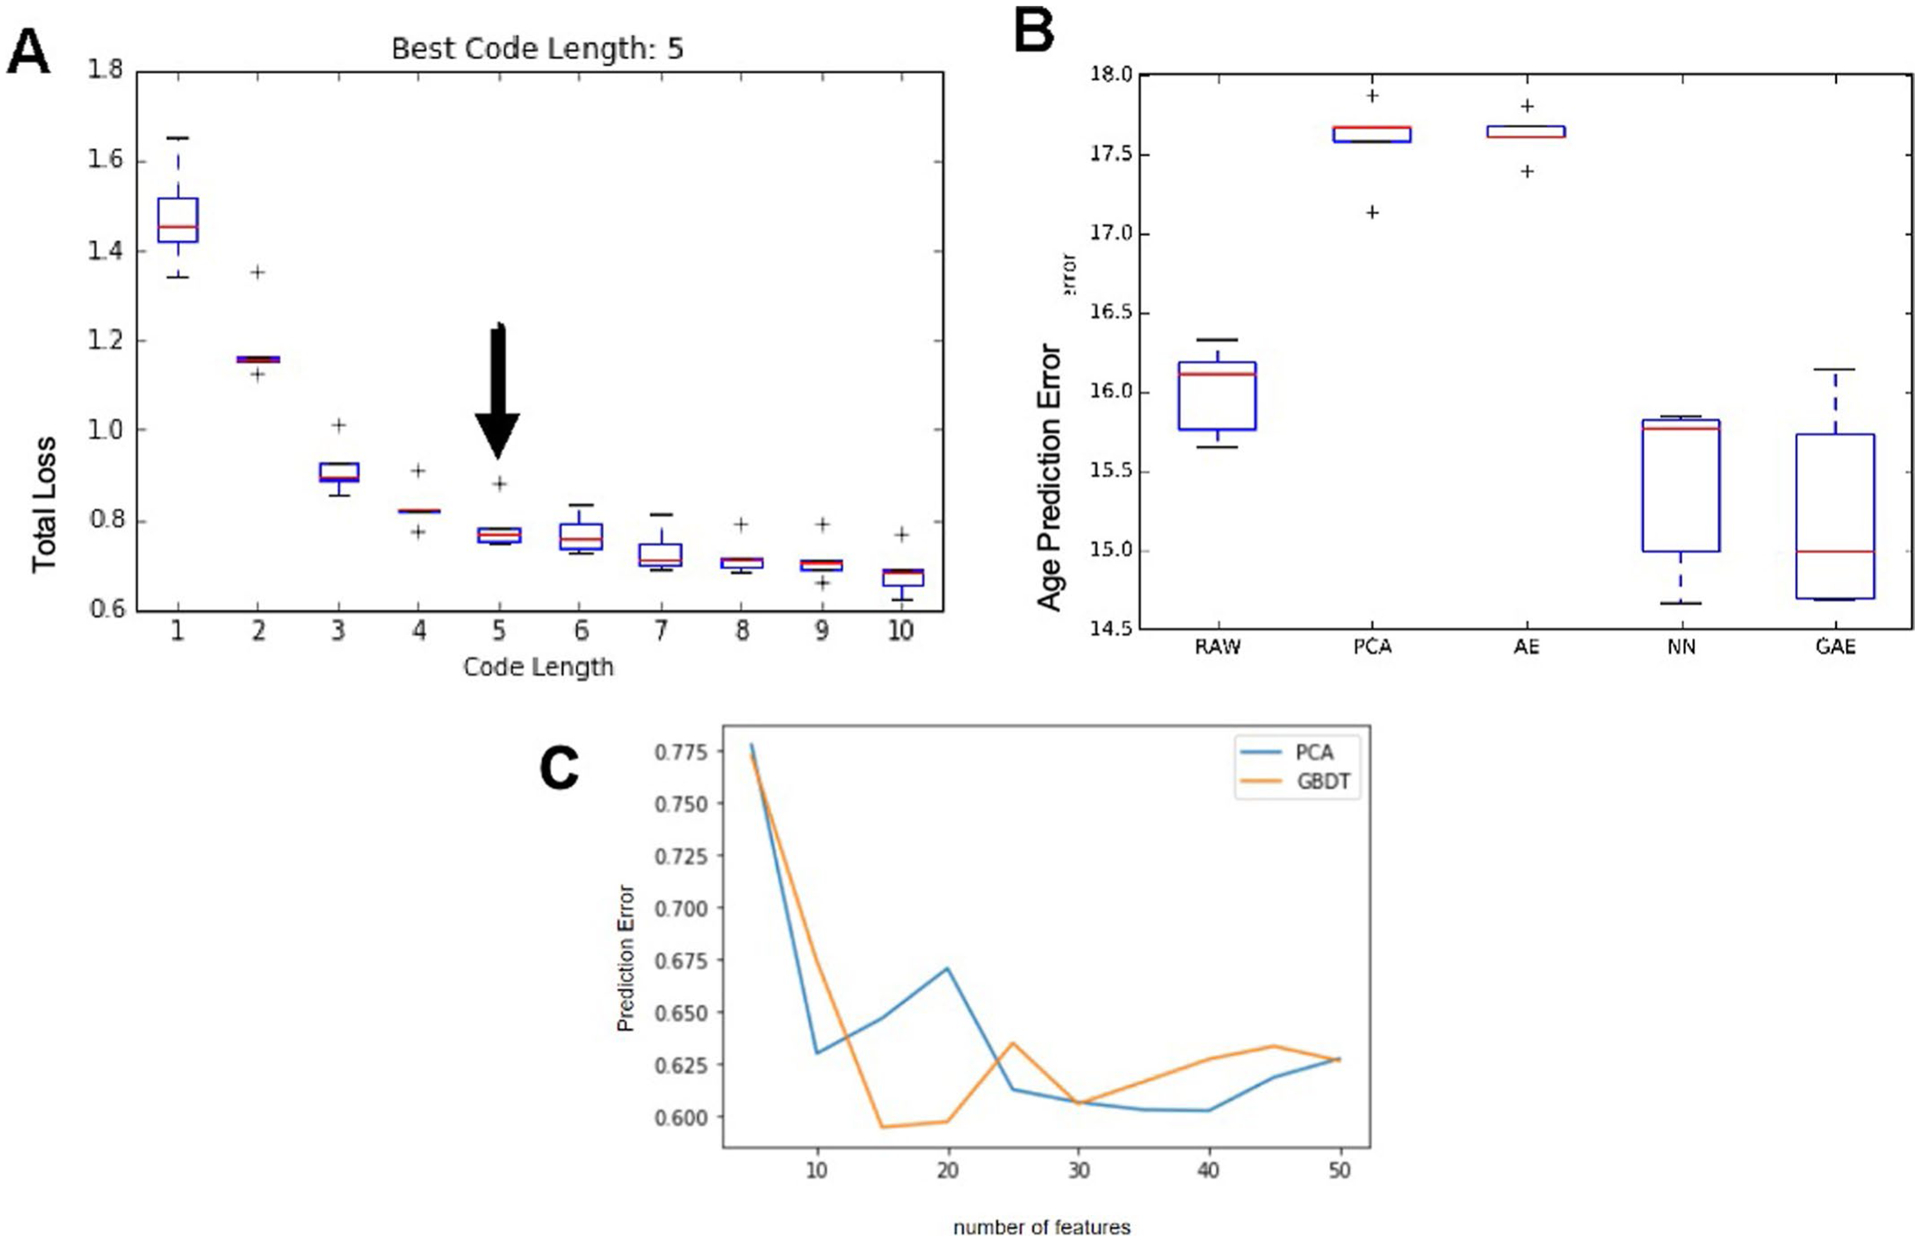
We used 5-fold cross-validation to identify the best code length, among lengths from 1 to 10. We selected the length of code k, whose performance was not statistically significantly worse than that of longer codes (paired t-test p-value > 0.05). Within each fold we performed nested 3-fold cross-validation to select hyper-parameters (depth, weight decay and guidance-ratio). In our experiment, the best code length is 5 (a) as adding one more code (6) does not significantly improve the total loss (p = 0.18). After obtaining the best code length as 5, we used the 5-fold-cross-validation to select the best hyper-parameter setting (depth = 2, guidance-ratio = 0.2, L2 = 0.001) on all GAE with code length 5. Finally, we trained the GAE on the whole dataset with the selected best hyper-parameter setting and obtained the predictive function as the inflammatory clock predictor. GAE was compared to other machine learning methods such as autoencoder, neural networks, PCA, and RAW in (b). For the neural network, 2 fully connected layers with 5 nodes in each layer and tanh activation function were used. For PCA and RAW, we used elastic net to predict age. The GAE method outperforms linear methods for protein data reconstruction and prediction of chronological age (b). In (c), we found that the predictive performance of gradient boosting decision tree (GBDT) has similar performance as PCA. We conclude that GAE is superior to traditional machine learning methods.
Extended Data Fig. 4 |. Elimination of batch effect for serum immune protein data. .

Immune protein data from serum samples were subjected to normalization and batch correction procedures (See Methods) to ensure data from different sources can be combined and used as a whole. a, Spearman correlation between immune protein features and batch ID shows a strong dependency of data source on top 4 components (raw data, green line), which reaches a steady state after component 5. Data normalization and batch correction removes batch effect as indicated by lower mean absolute Spearman correlation between all features and batch id (blue line), which indicates impossibility to distinguish sample source from corrected data. b, Upper panel: immune protein expression heatmap of uncorrected data, Lower panel: immune protein expression heatmap of corrected data. The two batches come from two study cohorts, the Chronic Fatigue Syndrome Study (CFS) and Aging and vaccination study cohort (Flu).
Extended Data Fig. 5 |. iAge predictive of multi-mordity.
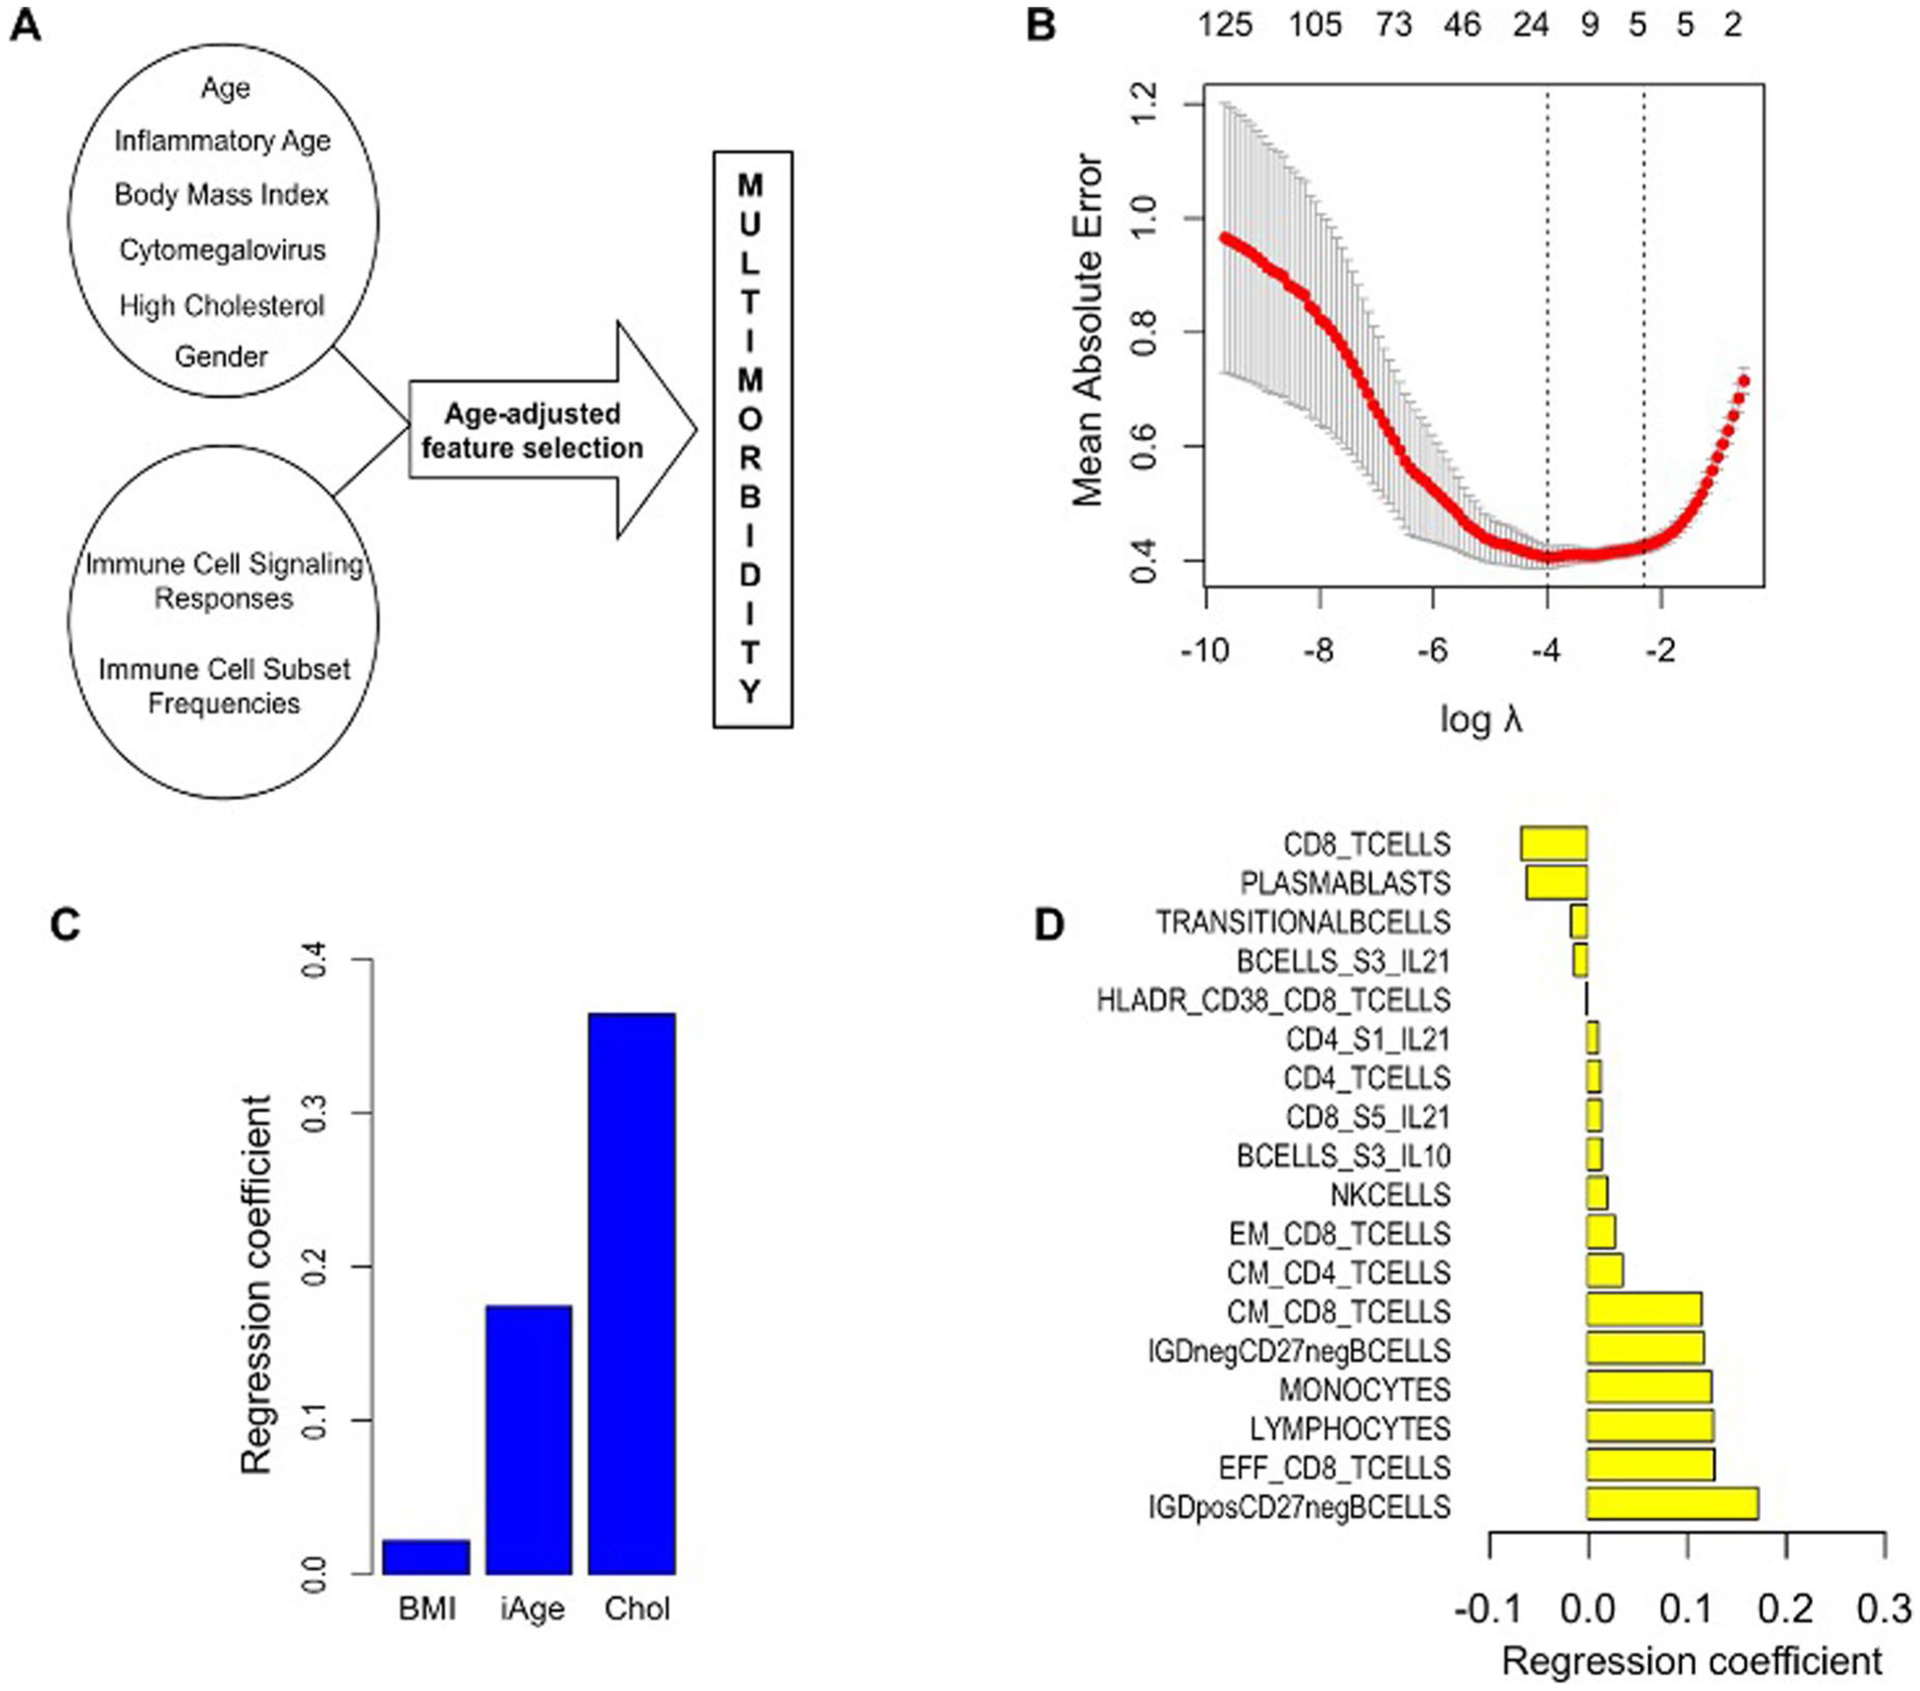
To select for predictors of comorbidity without bias, based on available data for all 902 subjects while controlling for the age effect, age-adjusted cross-validation was performed (a). By applying differential penalty values for each regressor, age variable is ‘forced in’, while imposing a stringent penalty (the lasso penalty) to all other features, so that selected variables do not correlate with age. A Mean Absolute Error (MAE) for the prediction of comorbidity of 0.41 is observed (b). Eighteen features are selected including inflammatory clock, high cholesterol and BMI (c) and immune parameters such as total CD8 (+) T cells, plasmablasts and transitional B cells (negative predictors) and IgD+CD27- and IgD-CD27-B cells, effector CD8 (+) T cells, total lymphocytes and monocytes, and central memory T cells (positive predictors) (d)
Extended Data Fig. 6 |. Univariate Regression between Age and CXCL9.
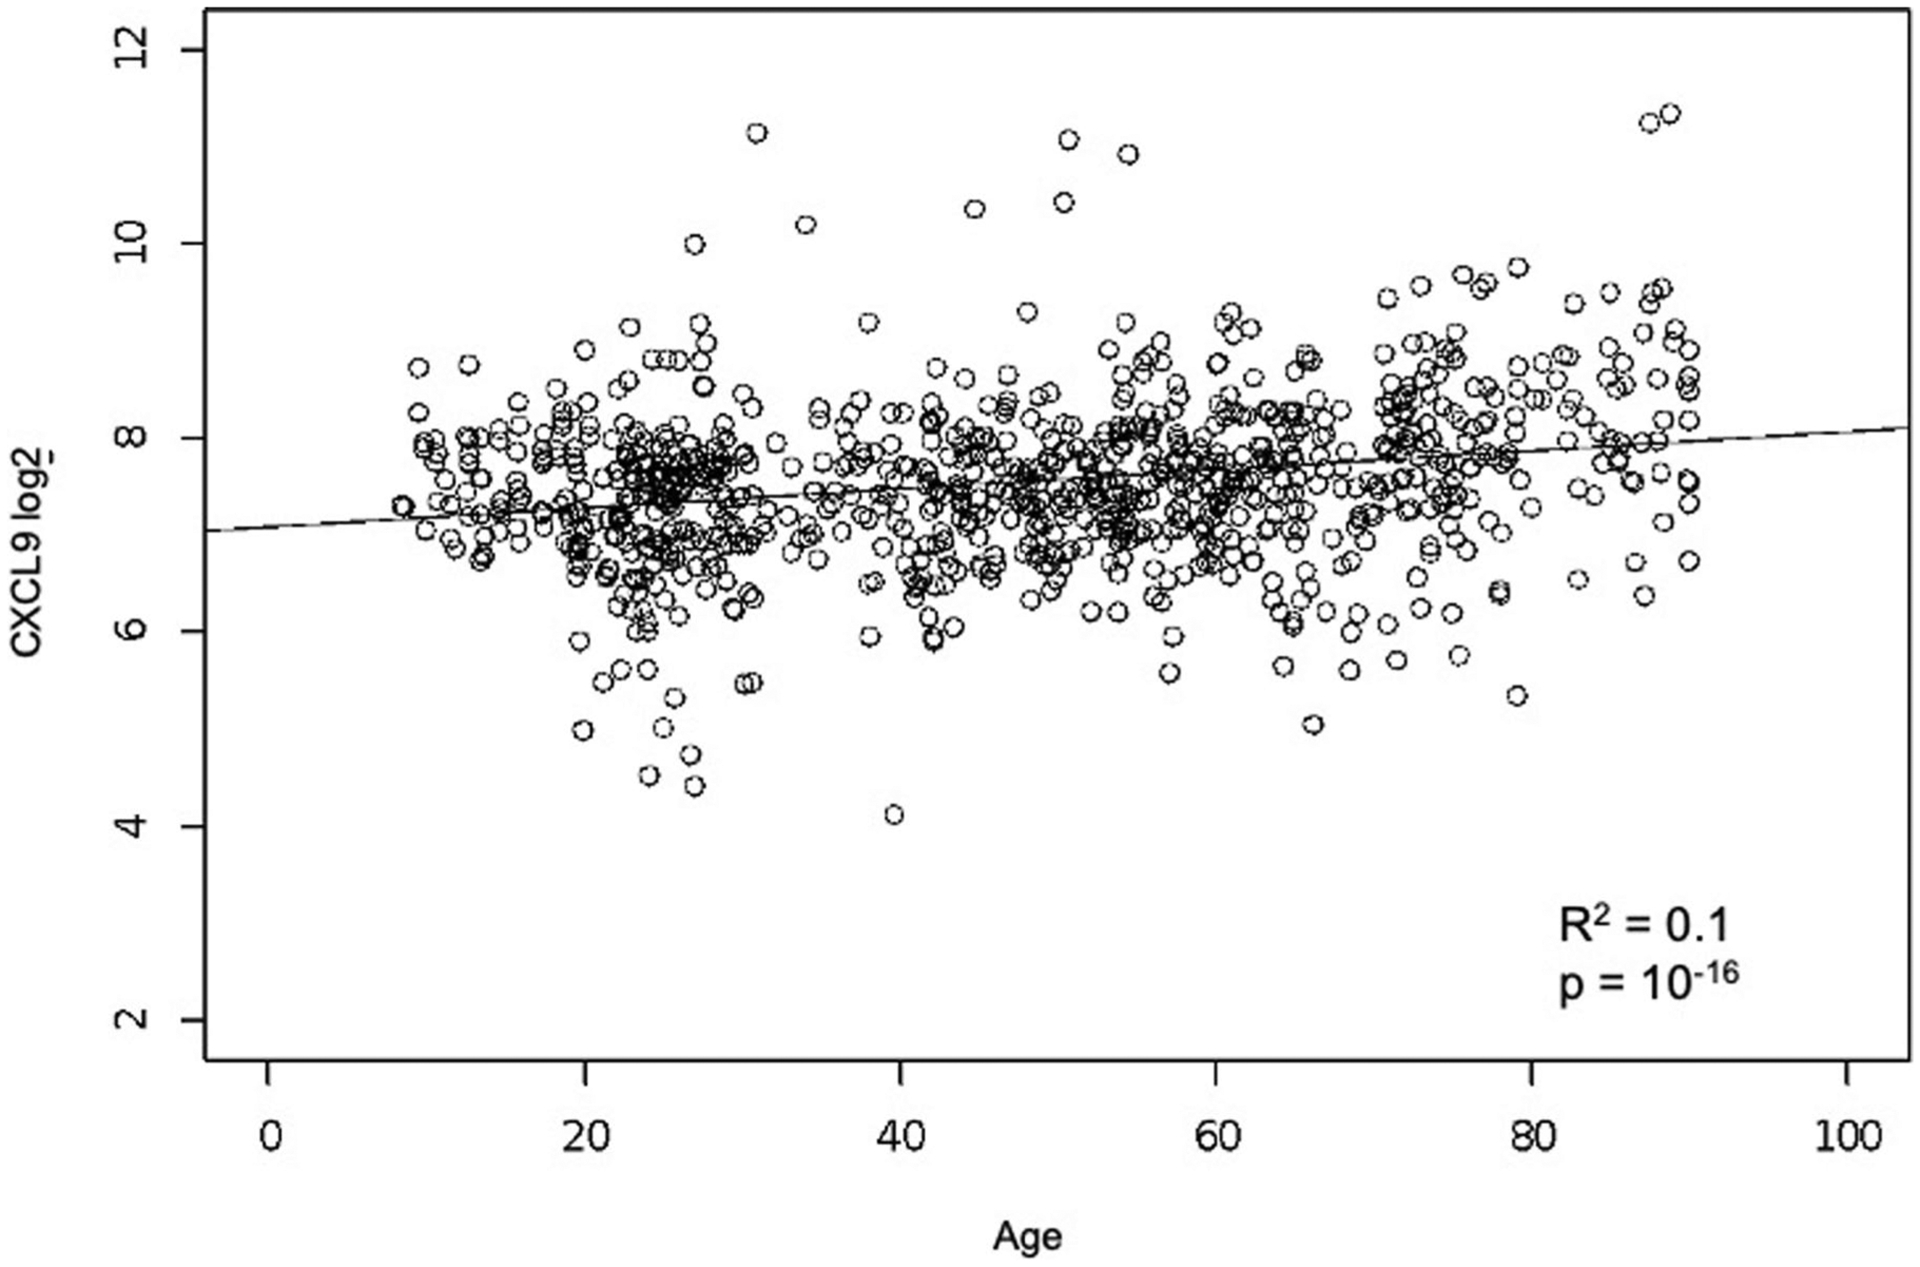
Significant correlation between age and CXCL9 using univariate regression analysis. We used linear regression where CXCL9 were regressed onto age. Correlation coefficient (R2) and p-value of F-test of overall significance are reported.
Extended Data Fig. 7 |. Luminex data for cardiovascular validation cohort.

In a validation study, 97 healthy adults (aged 25–90) well matched for cardiovascular risk factors, were selected from a total of 151 recruited subjects. Immune protein analysis was conducted in samples from these subjects. CXCL9, HGF, CXCL1, and LIF were found to change in the same direction in both the Stanford 1KIP and the validation cohort.
Extended Data Fig. 8 |. Human blood endothelial progenitor cells and mice endothelial cells.

a, Representative images of human blood progenitor endothelial cells from young (left) and old (right) individuals. b, Representative images of capillary-like networks show impaired tube formation by human BECs of old individuals compared to young. To further confirm the potential contribution of CXCL9 in cardiovascular aging, we assessed its expression in young (3–4 month) and old mice (2 yr.) endothelial cells (c). ECs isolated from old mice showed higher levels of CXCL9 (P value = 0.023) (d), while at the same time showed impaired EC function as evident by decreased tube formation (P value = 0.042) (a, f). Figure S8: All data represented as mean ± SEM, n = 3, *P < 0.05. Statistical analyses were performed using Student’s t-test (paired). Scale bar: 50 μm.
Extended Data Fig. 9 |. Expression of CXCR3 RNA in different tissue types.
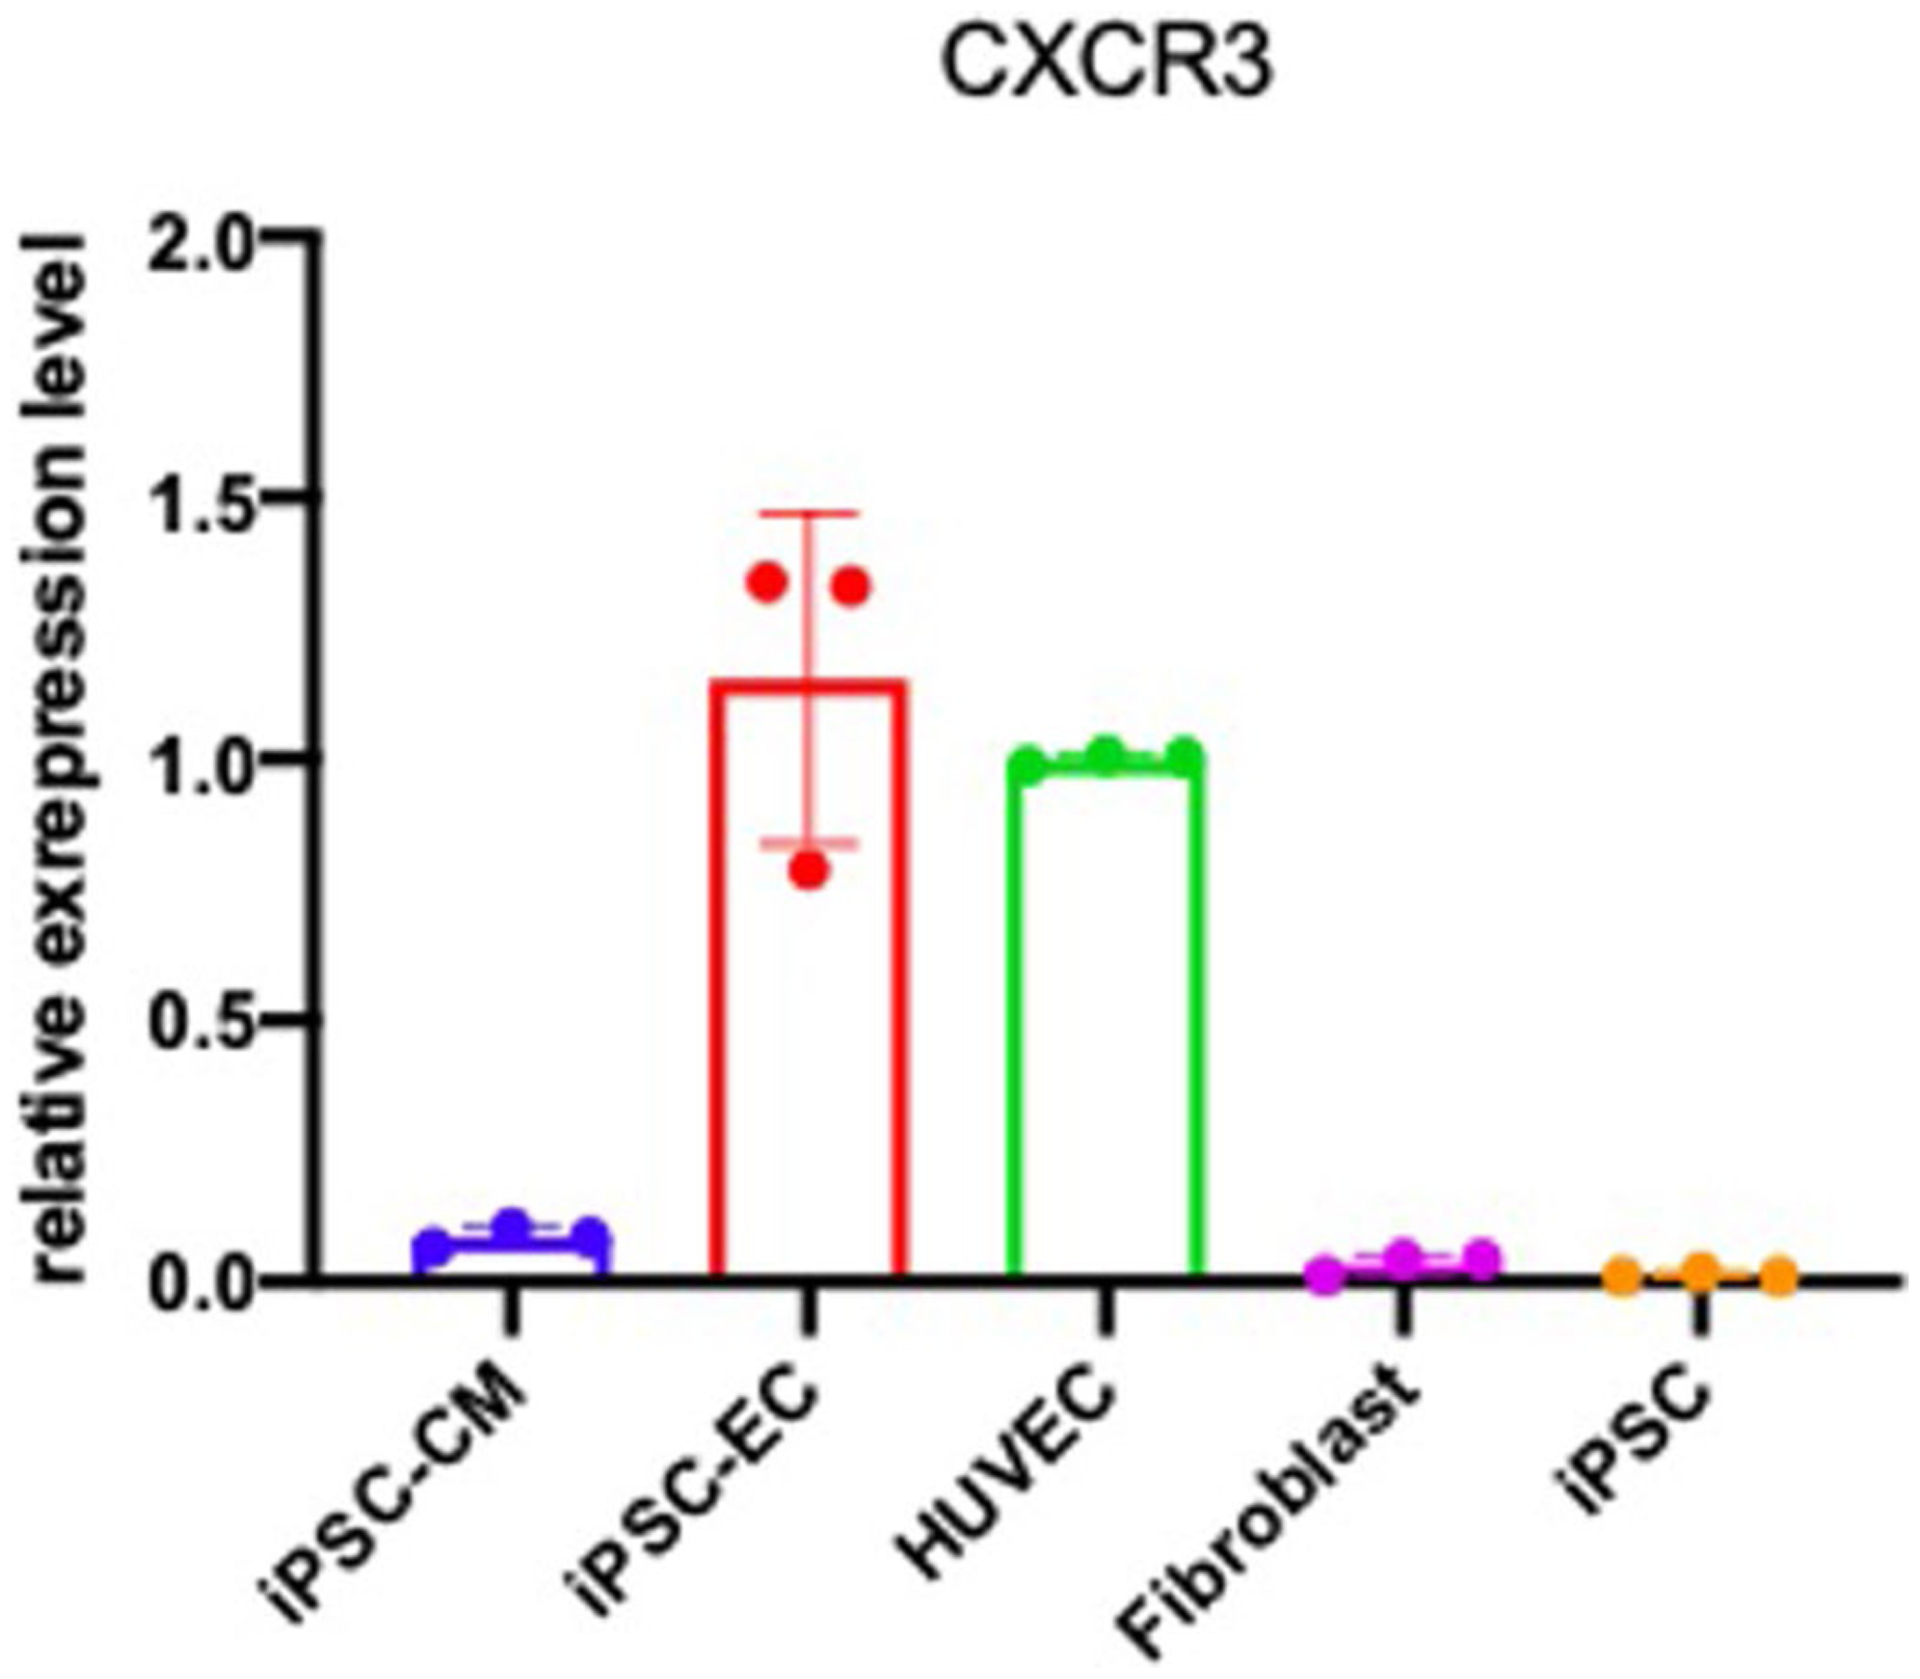
CXCR3 was not expressed in iPSC induced cardiomyocytes (iPSC-CM), Fibroblast, or iPSC. However, it is highly expressed in iPSC induced endothelial cells and Human Umbilical Vein Endothelial Cells (HUVEC). All data represented as mean ± SEM.
Extended Data Fig. 10 |. Validation of the effects of CXCL9 on endothelial function.
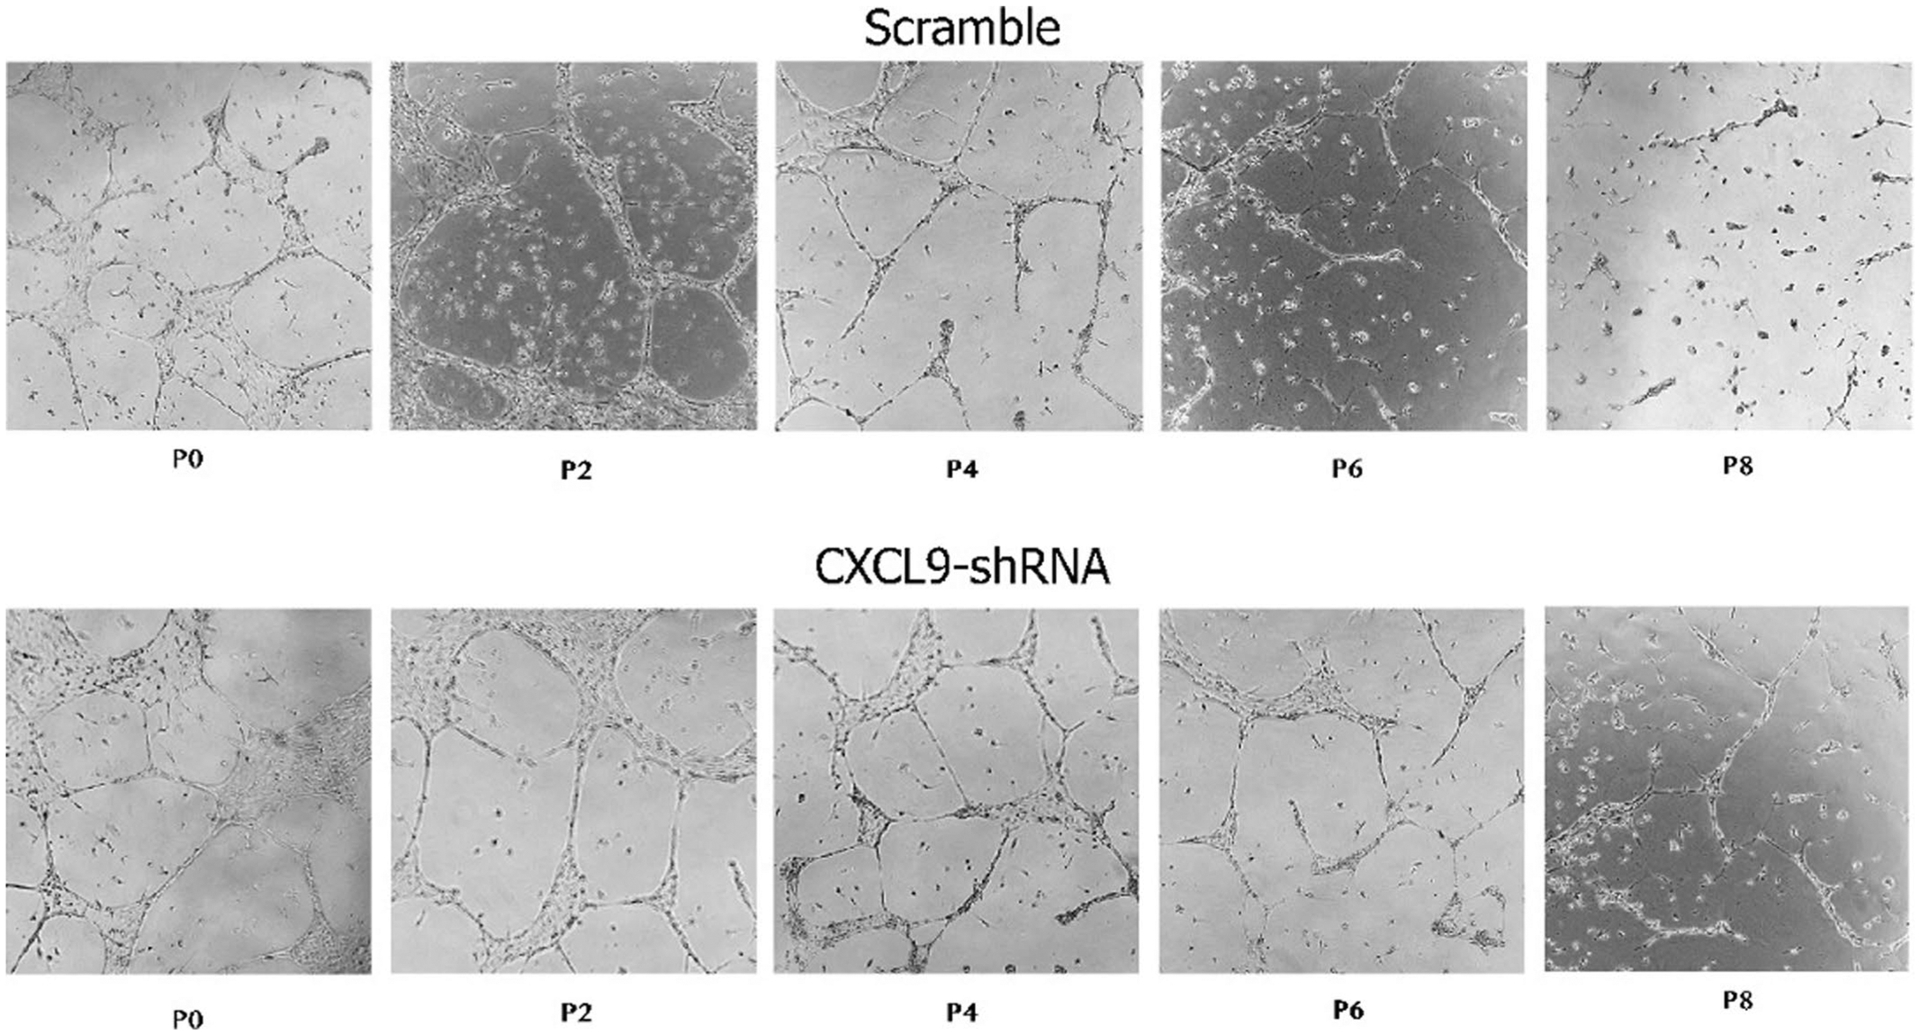
Representative images of capillary-like networks from scramble- and CXCL9-KD hiPSC-ECs show that CXCL9-KD hiPSC-ECs retain their capacity to form tubes even at later passages when compared to scramble that showed impaired tube formation towards later passages of hiPSC-ECs. Scale bar: 50 μm. Experiment was repeated 3 times.
Supplementary Material
Acknowledgements
We thank the study participants for their time and dedication and the staff of the Stanford-LPCH Vaccine Program for recruiting participants and conducting the studies. Support for the conduct of these studies was from The Buck Institute for Research on Aging (to D.F.), the Ellison Foundation, National Institutes of Health (NIH) U19 AI057229, U19 AI090019 (to M.M.D.) and NIH/NCRR CTSA award number UL1 RR025744. This work was also supported by grants to C.F. from the EU Horizon 2020 Project PROPAG-AGEING (grant 634821), the EU JPND ADAGE project, the Ministry of Education and Science of the Russian Federation Agreement (agreement no. 075-15-2020-808). We gratefully acknowledge additional funding support from the NIH K01 HL135455, Stanford TRAM scholar award (N.S.), the Paul F. Glenn Foundation and the NIH Stanford Alzheimer’s Disease Research Center P50AG047366.
Footnotes
Code availability
The code used for the identification of immunotypes and construction of the inflammatory clock has been deposited on GitHub (https://github.com/) and is available under: https://github.com/clingsz/GAE. For the immunological characterization of immunotypes, we used R programming (https://www.r-project.org/). The LASSO and Elastic Net regularized generalized linear models package (glmnet) for R programming can be found at: https://cran.r-project.org/web/packages/glmnet/index.html. Maximum likelihood estimation is a function of the STATS4 R package found at: https://www.rdocumentation.org/packages/stats4/versions/3.4.1.
Competing interests
D.F. and M.M.D. are co-founders of Edifice Health, a company that utilizes iAge. The remaining authors declare no competing interests.
Supplementary information The online version contains supplementary material available at https://doi.org/10.1038/s43587-021-00082-y.
Data availability
The cell subpopulation, immune protein and cell signaling data for the Stanford Aging and Vaccination studies are publicly available on ImmPort Bioinformatics Repository (http://www.immport.org/immport-open/public/home/home) under the following study IDs SDY311 (cytokines, phosphoflow assays and CyTOF surface phenotyping), SDY312 (cytokines, phosphoflow assays and flow cytometry surface phenotyping), SDY314 (flow cytometry surface phenotyping), SDY315 (cytokines, phosphoflow assays and CyTOF surface phenotyping) and SDY478 (cytokines and CyTOF surface phenotyping). The gene expression data utilized in this study to compute gene expression-iAge has been uploaded to the Gene Expression Omnibus under accession number GSE168753. Our study complies in full with the STROBE statement, STARD guidelines and GATHER statement.
References
- 1.Kotas ME & Medzhitov R Homeostasis, inflammation, and disease susceptibility. Cell 160, 816–827 (2015). [DOI] [PMC free article] [PubMed] [Google Scholar]
- 2.Liu F et al. Mechanosignaling through YAP and TAZ drives fibroblast activation and fibrosis. Am. J. Physiol. Lung Cell Mol. Physiol 308, L344–L357 (2015). [DOI] [PMC free article] [PubMed] [Google Scholar]
- 3.Crusz SM & Balkwill FR Inflammation and cancer: advances and new agents. Nat. Rev. Clin. Oncol 12, 584–596 (2015). [DOI] [PubMed] [Google Scholar]
- 4.Franceschi C & Campisi J Chronic inflammation (inflammaging) and its potential contribution to age-associated diseases. J. Gerontol. A Biol. Sci. Med. Sci 69, S4–S9 (2014). [DOI] [PubMed] [Google Scholar]
- 5.Furman D et al. Expression of specific inflammasome gene modules stratifies older individuals into two extreme clinical and immunological states. Nat. Med 23, 174–184 (2017). [DOI] [PMC free article] [PubMed] [Google Scholar]
- 6.López-Otín C, Blasco MA, Partridge L, Serrano M & Kroemer G The hallmarks of aging. Cell 153, 1194–1217 (2013). [DOI] [PMC free article] [PubMed] [Google Scholar]
- 7.Cavadas C, Aveleira CA, Souza GFP & Velloso LA The pathophysiology of defective proteostasis in the hypothalamus — from obesity to ageing. Nat. Rev. Endocrinol 12, 723–733 (2016). [DOI] [PubMed] [Google Scholar]
- 8.Efeyan A, Comb WC & Sabatini DM Nutrient-sensing mechanisms and pathways. Nature 517, 302–310 (2015). [DOI] [PMC free article] [PubMed] [Google Scholar]
- 9.Grivennikov SI, Greten FR & Karin M Immunity, inflammation, and cancer. Cell 140, 883–899 (2010). [DOI] [PMC free article] [PubMed] [Google Scholar]
- 10.Hunter RL et al. Inflammation induces mitochondrial dysfunction and dopaminergic neurodegeneration in the nigrostriatal system. J. Neurochem 100, 1375–1386 (2007). [DOI] [PubMed] [Google Scholar]
- 11.Jurk D et al. Chronic inflammation induces telomere dysfunction and accelerates ageing in mice. Nat. Commun 5, 4172 (2014). [DOI] [PMC free article] [PubMed] [Google Scholar]
- 12.Lasry A & Ben-Neriah Y Senescence-associated inflammatory responses: aging and cancer perspectives. Trends Immunol. 36, 217–228 (2015). [DOI] [PubMed] [Google Scholar]
- 13.Nathan C & Cunningham-Bussel A Beyond oxidative stress: an immunologist’s guide to reactive oxygen species. Nat. Rev. Immunol 13, 349–361 (2013). [DOI] [PMC free article] [PubMed] [Google Scholar]
- 14.Oh J, Lee YD & Wagers AJ Stem cell aging: mechanisms, regulators and therapeutic opportunities. Nat. Med 20, 870–880 (2014). [DOI] [PMC free article] [PubMed] [Google Scholar]
- 15.Thevaranjan N et al. Age-associated microbial dysbiosis promotes intestinal permeability, systemic inflammation, and macrophage dysfunction. Cell Host Microbe 21, 455–466 (2017). [DOI] [PMC free article] [PubMed] [Google Scholar]
- 16.Alpert A et al. A clinically meaningful metric of immune age derived from high-dimensional longitudinal monitoring. Nat. Med 25, 487–495 (2019). [DOI] [PMC free article] [PubMed] [Google Scholar]
- 17.Goldberg EL & Dixit VD Drivers of age-related inflammation and strategies for healthspan extension. Immunol. Rev 265, 63–74 (2015). [DOI] [PMC free article] [PubMed] [Google Scholar]
- 18.Franceschi C, Garagnani P, Vitale G, Capri M & Salvioli S Inflammaging and garb-aging. Trends Endocrinol. Metab 28, 199–212 (2017). [DOI] [PubMed] [Google Scholar]
- 19.Morrisette-Thomas V et al. Inflamm-aging does not simply reflect increases in pro-inflammatory markers. Mechanisms Ageing Dev. 139, 49–57 (2014). [DOI] [PMC free article] [PubMed] [Google Scholar]
- 20.Furman D et al. Chronic inflammation in the etiology of disease across the life span. Nat. Med 25, 1822–1832 (2019). [DOI] [PMC free article] [PubMed] [Google Scholar]
- 21.Blazkova J et al. Multicenter systems analysis of human blood reveals immature neutrophils in males and during pregnancy. J. Immunol 198, 2479–2488 (2017). [DOI] [PMC free article] [PubMed] [Google Scholar]
- 22.Brodin P et al. Variation in the human immune system is largely driven by non-heritable influences. Cell 160, 37–47 (2015). [DOI] [PMC free article] [PubMed] [Google Scholar]
- 23.Furman D et al. Systems analysis of sex differences reveals an immunosuppressive role for testosterone in the response to influenza vaccination. Proc. Natl Acad. Sci. USA 111, 869–874 (2014). [DOI] [PMC free article] [PubMed] [Google Scholar]
- 24.Furman D et al. Apoptosis and other immune biomarkers predict influenza vaccine responsiveness. Mol. Syst. Biol 9, 659 (2013). [DOI] [PMC free article] [PubMed] [Google Scholar]
- 25.Furman D et al. Cytomegalovirus infection enhances the immune response to influenza. Sci. Transl. Med 7, 281ra43 (2015). [DOI] [PMC free article] [PubMed] [Google Scholar]
- 26.Price JV et al. Characterization of influenza vaccine immunogenicity using influenza antigen microarrays. PLoS ONE 8, e64555 (2013). [DOI] [PMC free article] [PubMed] [Google Scholar]
- 27.Roskin KM et al. IgH sequences in common variable immune deficiency reveal altered B cell development and selection. Sci. Transl. Med 7, 302ra135 (2015). [DOI] [PMC free article] [PubMed] [Google Scholar]
- 28.Shen-Orr Shai S et al. Defective signaling in the JAK–STAT pathway tracks with chronic inflammation and cardiovascular risk in aging humans. Cell Syst. 3, 374–384 (2016). [DOI] [PMC free article] [PubMed] [Google Scholar]
- 29.Wang C et al. Effects of aging, cytomegalovirus infection, and EBV infection on human B cell repertoires. J. Immunol 192, 603–611 (2014). [DOI] [PMC free article] [PubMed] [Google Scholar]
- 30.Montoya JG et al. Cytokine signature associated with disease severity in chronic fatigue syndrome patients. Proc. Natl Acad. Sci. USA 114, E7150–E7158 (2017). [DOI] [PMC free article] [PubMed] [Google Scholar]
- 31.Maecker HT et al. New tools for classification and monitoring of autoimmune diseases. Nat. Rev. Rheumatol 8, 317–328 (2012). [DOI] [PMC free article] [PubMed] [Google Scholar]
- 32.Ridker PM et al. Antiinflammatory therapy with canakinumab for atherosclerotic disease. N. Engl. J. Med 377, 1119–1131 (2017). [DOI] [PubMed] [Google Scholar]
- 33.Barnett K et al. Epidemiology of multimorbidity and implications for health care, research, and medical education: a cross-sectional study. Lancet 380, 37–43 (2012). [DOI] [PubMed] [Google Scholar]
- 34.Zou H & Hastie T Regularization and variable selection via the Elastic Net. J. R. Stat. Soc. B Stat. Methodol 67, 301–320 (2005). [Google Scholar]
- 35.Rockwood K, Rockwood MR & Mitnitski A Physiological redundancy in older adults in relation to the change with age in the slope of a frailty index. J. Am. Geriatr. Soc 58, 318–323 (2010). [DOI] [PubMed] [Google Scholar]
- 36.Mahmood SS, Levy D, Vasan RS & Wang TJ The Framingham Heart Study and the epidemiology of cardiovascular disease: a historical perspective. Lancet 383, 999–1008 (2014). [DOI] [PMC free article] [PubMed] [Google Scholar]
- 37.Bertsch T et al. C-reactive protein and the acute phase reaction in geriatric patients. Z. Gerontologie Geriatr 48, 595–600 (2015). [DOI] [PubMed] [Google Scholar]
- 38.Scheller J, Chalaris A, Schmidt-Arras D & Rose-John S The pro- and anti-inflammatory properties of the cytokine interleukin-6. Biochim. Biophys. Acta 1813, 878–888 (2011). [DOI] [PubMed] [Google Scholar]
- 39.Krutzik PO, Irish JM, Nolan GP & Perez OD Analysis of protein phosphorylation and cellular signaling events by flow cytometry: techniques and clinical applications. Clin. Immunol 110, 206–221 (2004). [DOI] [PubMed] [Google Scholar]
- 40.Kisseleva T, Bhattacharya S, Braunstein J & Schindler CW Signaling through the JAK/STAT pathway, recent advances and future challenges. Gene 285, 1–24 (2002). [DOI] [PubMed] [Google Scholar]
- 41.Altara R et al. Left ventricular dysfunction and CXCR3 ligands in hypertension: from animal experiments to a population-based pilot study. PLoS ONE 10, e0141394 (2015). [DOI] [PMC free article] [PubMed] [Google Scholar]
- 42.Altara R et al. CXCL10 is a circulating inflammatory marker in patients with advanced heart failure: a pilot study. J. Cardiovasc. Transl. Res 9, 302–314 (2016). [DOI] [PubMed] [Google Scholar]
- 43.Altara R, Mallat Z, Booz GW & Zouein FA The CXCL10/CXCR3 axis and cardiac inflammation: implications for immunotherapy to treat infectious and noninfectious diseases of the heart. J. Immunol. Res 2016, 4396368 (2016). [DOI] [PMC free article] [PubMed] [Google Scholar]
- 44.Hardison JL, Wrightsman RA, Carpenter PM, Lane TE & Manning JE The chemokines CXCL9 and CXCL10 promote a protective immune response but do not contribute to cardiac inflammation following infection with Trypanosoma cruzi. Infect. Immun 74, 125–134 (2006). [DOI] [PMC free article] [PubMed] [Google Scholar]
- 45.Vlachopoulos C, Aznaouridis K & Stefanadis C Prediction of cardiovascular events and all-cause mortality with arterial stiffness: a systematic review and meta-analysis. J. Am. Coll. Cardiol 55, 1318–1327 (2010). [DOI] [PubMed] [Google Scholar]
- 46.Ben-Shlomo Y et al. Aortic pulse wave velocity improves cardiovascular event prediction: an individual participant meta-analysis of prospective observational data from 17,635 subjects. J. Am. Coll. Cardiol 63, 636–646 (2014). [DOI] [PMC free article] [PubMed] [Google Scholar]
- 47.Chirinos JA Large artery stiffness, microvascular function, and cardiovascular risk. Circ. Cardiovasc Imaging 9, e005903 (2016). [DOI] [PMC free article] [PubMed] [Google Scholar]
- 48.Figueiredo VN et al. Vascular stiffness and endothelial dysfunction: correlations at different levels of blood pressure. Blood Press. 21, 31–38 (2012). [DOI] [PubMed] [Google Scholar]
- 49.Vanhoutte PM, Feletou M & Taddei S Endothelium-dependent contractions in hypertension. Br. J. Pharmacol 144, 449–458 (2005). [DOI] [PMC free article] [PubMed] [Google Scholar]
- 50.Castellon X & Bogdanova V Chronic inflammatory diseases and endothelial dysfunction. Aging Dis. 7, 81–89 (2016). [DOI] [PMC free article] [PubMed] [Google Scholar]
- 51.Harvey A, Montezano AC & Touyz RM Vascular biology of ageing: implications in hypertension. J. Mol. Cell Cardiol 83, 112–121 (2015). [DOI] [PMC free article] [PubMed] [Google Scholar]
- 52.Kamo T, Akazawa H & Komuro I Cardiac nonmyocytes in the hub of cardiac hypertrophy. Circ. Res 117, 89–98 (2015). [DOI] [PubMed] [Google Scholar]
- 53.Arnaoutova I & Kleinman HK In vitro angiogenesis: endothelial cell tube formation on gelled basement membrane extract. Nat. Protoc 5, 628–635 (2010). [DOI] [PubMed] [Google Scholar]
- 54.Mukai N et al. A comparison of the tube forming potentials of early and late endothelial progenitor cells Exp. Cell. Res 314, 430–440 (2008). [DOI] [PubMed] [Google Scholar]
- 55.Tousoulis D, Kampoli AM, Tentolouris C, Papageorgiou N & Stefanadis C The role of nitric oxide on endothelial function. Curr. Vasc. Pharmacol 10, 4–18 (2012). [DOI] [PubMed] [Google Scholar]
- 56.Voyta JC, Via DP, Butterfield CE & Zetter BR Identification and isolation of endothelial cells based on their increased uptake of acetylated low-density lipoprotein. J. Cell Biol 99, 2034–2040 (1984). [DOI] [PMC free article] [PubMed] [Google Scholar]
- 57.Boisen L, Drasbek KR, Pedersen AS & Kristensen P Evaluation of endothelial cell culture as a model system of vascular ageing. Exp. Gerontol 45, 779–787 (2010). [DOI] [PubMed] [Google Scholar]
- 58.Brandes RP, Fleming I & Busse R Endothelial aging. Cardiovascular Res. 66, 286–294 (2005). [DOI] [PubMed] [Google Scholar]
- 59.Takahashi K & Yamanaka S Induction of pluripotent stem cells from mouse embryonic and adult fibroblast cultures by defined factors. Cell 126, 663–676 (2006). [DOI] [PubMed] [Google Scholar]
- 60.Sayed N et al. Clinical trial in a dish using iPSCs shows lovastatin improves endothelial dysfunction and cellular cross-talk in LMNA cardiomyopathy. Sci. Transl. Med 12, eaax9276 (2020). [DOI] [PMC free article] [PubMed] [Google Scholar]
- 61.Rivard A et al. Age-Dependent Impairment of Angiogenesis. Circulation 99, 111–120 (1999). [DOI] [PubMed] [Google Scholar]
- 62.Minamino T & Komuro I Vascular cell senescence: contribution to atherosclerosis. Circ. Res 100, 15–26 (2007). [DOI] [PubMed] [Google Scholar]
- 63.Yin H & Pickering JG Cellular senescence and vascular disease: novel routes to better understanding and therapy. Can. J. Cardiol 32, 612–623 (2016). [DOI] [PubMed] [Google Scholar]
- 64.Uryga AK & Bennett MR Ageing induced vascular smooth muscle cell senescence in atherosclerosis. J. Physiol 594, 2115–2124 (2016). [DOI] [PMC free article] [PubMed] [Google Scholar]
- 65.Jia G, Aroor AR, Jia C & Sowers JR Endothelial cell senescence in aging-related vascular dysfunction. Biochim. Biophys. Acta, Mol. Basis Dis 1865, 1802–1809 (2019). [DOI] [PubMed] [Google Scholar]
- 66.Stojanovic SD, Fiedler J, Bauersachs J, Thum T & Sedding DG Senescence-induced inflammation: an important player and key therapeutic target in atherosclerosis. Eur. Heart J 41, 2983–2996 (2020). [DOI] [PMC free article] [PubMed] [Google Scholar]
- 67.Zieman SJ, Melenovsky V & Kass DA Mechanisms, pathophysiology, and therapy of arterial stiffness. Arter. Thromb. Vasc. Biol 25, 932–943 (2005). [DOI] [PubMed] [Google Scholar]
- 68.Kohn JC, Lampi MC & Reinhart-King CA Age-related vascular stiffening: causes and consequences. Front. Genet 6, 112 (2015). [DOI] [PMC free article] [PubMed] [Google Scholar]
- 69.Lu P, Takai K, Weaver VM & Werb Z Extracellular matrix degradation and remodeling in development and disease. Cold Spring Harb. Perspect. Biol 3, a005082 (2011). [DOI] [PMC free article] [PubMed] [Google Scholar]
- 70.Kuzuya M et al. Glycation cross-links inhibit matrix metalloproteinase-2 activation in vascular smooth muscle cells cultured on collagen lattice. Diabetologia 44, 433–436 (2001). [DOI] [PubMed] [Google Scholar]
- 71.González-Amaro R, Diaz-González F & Sánchez-Madrid F Adhesion molecules in inflammatory diseases. Drugs 56, 977–988 (1998). [DOI] [PubMed] [Google Scholar]
- 72.Khanamiri S et al. Marked vascular dysfunction in a case of peripartum cardiomyopathy. J. Vasc. Res 56, 11–15 (2019). [DOI] [PMC free article] [PubMed] [Google Scholar]
- 73.Sayed N et al. Transdifferentiation of human fibroblasts to endothelial cells: role of innate immunity. Circulation 131, 300–309 (2015). [DOI] [PMC free article] [PubMed] [Google Scholar]
- 74.Hannum G et al. Genome-wide methylation profiles reveal quantitative views of human aging rates. Mol. Cell 49, 359–367 (2013). [DOI] [PMC free article] [PubMed] [Google Scholar]
- 75.Horvath S DNA methylation age of human tissues and cell types. Genome Biol. 14, R115 (2013). [DOI] [PMC free article] [PubMed] [Google Scholar]
- 76.Holly AC et al. Towards a gene expression biomarker set for human biological age. Aging Cell 12, 324–326 (2013). [DOI] [PMC free article] [PubMed] [Google Scholar]
- 77.Ishikawa M et al. Plasma and serum lipidomics of healthy white adults shows characteristic profiles by subjects’ gender and age. PLoS ONE 9, e91806 (2014). [DOI] [PMC free article] [PubMed] [Google Scholar]
- 78.Yu Z et al. Human serum metabolic profiles are age dependent. Aging Cell. 11, 960–967 (2012). [DOI] [PMC free article] [PubMed] [Google Scholar]
- 79.Menni C et al. Metabolomic markers reveal novel pathways of ageing and early development in human populations. Int J. Epidemiol 42, 1111–1119 (2013). [DOI] [PMC free article] [PubMed] [Google Scholar]
- 80.Hertel J et al. Measuring biological age via metabonomics: the metabolic age score. J. Proteome Res 15, 400–410 (2016). [DOI] [PubMed] [Google Scholar]
- 81.Collino S et al. Metabolic signatures of extreme longevity in northern Italian centenarians reveal a complex remodeling of lipids, amino acids, and gut microbiota metabolism. PLoS ONE 8, e56564 (2013). [DOI] [PMC free article] [PubMed] [Google Scholar]
- 82.Lawton KA et al. Analysis of the adult human plasma metabolome. Pharmacogenomics 9, 383–397 (2008). [DOI] [PubMed] [Google Scholar]
- 83.Rahman SA & Adjeroh DA Deep learning using convolutional LSTM estimates biological age from physical activity. Sci. Rep 9, 11425 (2019). [DOI] [PMC free article] [PubMed] [Google Scholar]
- 84.Tang X, Wang Z, Luo W and Gao S Face aging with identity-preserved conditional generative adversarial networks. Proc. IEEE/CVF Conf. Computer Vision Pattern Recognition 10.1109/CVPR.2018.00828 (2018). [DOI] [Google Scholar]
- 85.Zhang K et al. Fine-grained age estimation in the wild with attention LSTM networks. IEEE Trans. Circuits Systems Video Technol 10.1109/TCSVT.2019.2936410 (2019). [DOI] [Google Scholar]
- 86.Putin E et al. Deep biomarkers of human aging: application of deep neural networks to biomarker development. Aging 8, 1021–1033 (2016). [DOI] [PMC free article] [PubMed] [Google Scholar]
- 87.Mamoshina P et al. Population specific biomarkers of human aging: a big data study using South Korean, Canadian, and Eastern European patient populations. J. Gerontol. A Biol. Sci. Med Sci 73, 1482–1490 (2018). [DOI] [PMC free article] [PubMed] [Google Scholar]
- 88.Subramanian N, Torabi-Parizi P, Gottschalk RA, Germain RN & Dutta B Network representations of immune system complexity. WIREs Syst. Biol. Med 7, 13–38 (2015). [DOI] [PMC free article] [PubMed] [Google Scholar]
- 89.Bengio Y Learning deep architectures for AI. Found. Trends Mach. Learn 2, 1–127 (2009). [Google Scholar]
- 90.Tanaka T et al. Plasma proteomic signature of age in healthy humans. Aging Cell. 17, e12799 (2018). [DOI] [PMC free article] [PubMed] [Google Scholar]
- 91.Fourati S et al. Pre-vaccination inflammation and B-cell signalling predict age-related hyporesponse to hepatitis B vaccination. Nat. Commun 7, 10369 (2016). [DOI] [PMC free article] [PubMed] [Google Scholar]
- 92.Lehallier B et al. Undulating changes in human plasma proteome profiles across the lifespan. Nat. Med 25, 1843–1850 (2019). [DOI] [PMC free article] [PubMed] [Google Scholar]
- 93.Bonfante HL et al. CCL2, CXCL8, CXCL9 and CXCL10 serum levels increase with age but are not altered by treatment with hydroxychloroquine in patients with osteoarthritis of the knees. Int J. Rheum. Dis 20, 1958–1964 (2017). [DOI] [PubMed] [Google Scholar]
- 94.Roubenoff R et al. Monocyte cytokine production in an elderly population: effect of age and inflammation. J. Gerontol. A Biol. Sci. Med Sci 53, M20–M26 (1998). [DOI] [PubMed] [Google Scholar]
- 95.Torres KCL et al. Immune senescence and biomarkers profile of Bambui aged population-based cohort. Exp. Gerontol 103, 47–56 (2018). [DOI] [PubMed] [Google Scholar]
- 96.Shurin GV et al. Dynamic alteration of soluble serum biomarkers in healthy aging. Cytokine 39, 123–129 (2007). [DOI] [PubMed] [Google Scholar]
- 97.Zheng Y et al. Age-related pro-inflammatory and pro-angiogenic changes in human aqueous humor. Int J. Ophthalmol 11, 196–200 (2018). [DOI] [PMC free article] [PubMed] [Google Scholar]
- 98.Sandovici I et al. Ageing is associated with molecular signatures of inflammation and type 2 diabetes in rat pancreatic islets. Diabetologia 59, 502–511 (2016). [DOI] [PMC free article] [PubMed] [Google Scholar]
- 99.de Araujo FF et al. CXCL9 and CXCL10 display an age-dependent profile in Chagas patients: a cohort study of aging in Bambui, Brazil. Infect. Dis. Poverty 9, 51 (2020). [DOI] [PMC free article] [PubMed] [Google Scholar]
- 100.Zhou L et al. Age-specific changes in the molecular phenotype of patients with moderate-to-severe atopic dermatitis. J. Allergy Clin. Immunol 144, 144–156 (2019). [DOI] [PubMed] [Google Scholar]
- 101.Amorim JSC et al. Inflammatory markers and occurrence of falls: Bambui cohort study of aging. Rev. Saude Publica 53, 35 (2019). [DOI] [PMC free article] [PubMed] [Google Scholar]
- 102.Chiu BC et al. Differential effects of ageing on cytokine and chemokine responses during type-1 (mycobacterial) and type-2 (schistosomal) pulmonary granulomatous inflammation in mice. Mech. Ageing Dev 123, 313–326 (2002). [DOI] [PubMed] [Google Scholar]
- 103.Janowski AM et al. NLRC4 suppresses melanoma tumor progression independently of inflammasome activation. J. Clin. Investig 126, 3917–3928 (2016). [DOI] [PMC free article] [PubMed] [Google Scholar]
- 104.Versari D, Daghini E, Virdis A, Ghiadoni L & Taddei S Endothelial dysfunction as a target for prevention of cardiovascular disease. Diabetes Care 32, S314–S321 (2009). [DOI] [PMC free article] [PubMed] [Google Scholar]
- 105.Mezzaroma E et al. The inflammasome promotes adverse cardiac remodeling following acute myocardial infarction in the mouse. Proc. Natl Acad. Sci. USA 108, 19725–19730 (2011). [DOI] [PMC free article] [PubMed] [Google Scholar]
- 106.Nevers T et al. Left ventricular T-cell recruitment contributes to the pathogenesis of heart failure. Circulation Heart Fail. 8, 776–787 (2015). [DOI] [PMC free article] [PubMed] [Google Scholar]
- 107.Rawlings JS, Rosler KM & Harrison DA The JAK/STAT signaling pathway. J. Cell Sci 117, 1281–1283 (2004). [DOI] [PubMed] [Google Scholar]
- 108.Shuai K & Liu B Regulation of gene-activation pathways by PIAS proteins in the immune system. Nat. Rev. Immunol 5, 593–605 (2005). [DOI] [PubMed] [Google Scholar]
- 109.van Boxel-Dezaire AHH, Rani MRS & Stark GR Complex modulation of cell type-specific signaling in response to type I interferons. Immunity 25, 361–372 (2006). [DOI] [PubMed] [Google Scholar]
- 110.Matsa E et al. Transcriptome profiling of patient-specific human iPSC-cardiomyocytes predicts individual drug safety and efficacy responses in vitro. Cell Stem Cell 19, 311–325 (2016). [DOI] [PMC free article] [PubMed] [Google Scholar]
- 111.Gu M et al. Patient-specific iPSC-derived endothelial cells uncover pathways that protect against pulmonary hypertension in BMPR2 mutation carriers. Cell Stem Cell 20, 490–504 (2017). [DOI] [PMC free article] [PubMed] [Google Scholar]
- 112.Lian X et al. Robust cardiomyocyte differentiation from human pluripotent stem cells via temporal modulation of canonical Wnt signaling. Proc. Natl Acad. Sci. USA 109, E1848–E1857 (2012). [DOI] [PMC free article] [PubMed] [Google Scholar]
- 113.Nagueh SF et al. Recommendations for the evaluation of left ventricular diastolic function by echocardiography. Eur. J. Echocardiogr 10, 165–193 (2009). [DOI] [PubMed] [Google Scholar]
- 114.Redfield MM, Jacobsen SJ, Borlaug BA, Rodeheffer RJ & Kass DA Age- and gender-related ventricular-vascular stiffening: a community-based study. Circulation 112, 2254–2262 (2005). [DOI] [PubMed] [Google Scholar]
- 115.Lang RM et al. Chamber Quantification Writing G, American Society of Echocardiography’s G, Standards C and European Association of E. Recommendations for chamber quantification: a report from the American Society of Echocardiography’s Guidelines and Standards Committee and the Chamber Quantification Writing Group, developed in conjunction with the European Association of Echocardiography, a branch of the European Society of Cardiology. J. Am. Soc. Echocardiogr 18, 1440–1463 (2005). [DOI] [PubMed] [Google Scholar]
- 116.Godec J et al. Compendium of immune signatures identifies conserved and species-specific biology in response to inflammation. Immunity 44, 194–206 (2016). [DOI] [PMC free article] [PubMed] [Google Scholar]
- 117.Friedman J, Hastie T & Tibshirani R Regularization paths for generalized linear models via coordinate descent. J. Stat. Softw 33, 1–22 (2010). [PMC free article] [PubMed] [Google Scholar]
- 118.Gold L et al. Aptamer-based multiplexed proteomic technology for biomarker discovery. PLoS ONE 5, e15004 (2010). [DOI] [PMC free article] [PubMed] [Google Scholar]
- 119.Behzadi-Khormouji H et al. Deep learning, reusable and problem-based architectures for detection of consolidation on chest X-ray images. Comput. Methods Prog. Biomed 185, 105162 (2020). [DOI] [PubMed] [Google Scholar]
- 120.Kingma D & Ba JA A method for stochastic optimization. In 3rd International Conference for Learning Representations (2014). [Google Scholar]
- 121.Dai H, Leeder JS & Cui Y A modified generalized Fisher method for combining probabilities from dependent tests. Front. Genet 5, 32 (2014). [DOI] [PMC free article] [PubMed] [Google Scholar]
- 122.Foroutan M et al. Single sample scoring of molecular phenotypes. BMC Bioinf. 19, 404 (2018). [DOI] [PMC free article] [PubMed] [Google Scholar]
Associated Data
This section collects any data citations, data availability statements, or supplementary materials included in this article.
Supplementary Materials
Data Availability Statement
The cell subpopulation, immune protein and cell signaling data for the Stanford Aging and Vaccination studies are publicly available on ImmPort Bioinformatics Repository (http://www.immport.org/immport-open/public/home/home) under the following study IDs SDY311 (cytokines, phosphoflow assays and CyTOF surface phenotyping), SDY312 (cytokines, phosphoflow assays and flow cytometry surface phenotyping), SDY314 (flow cytometry surface phenotyping), SDY315 (cytokines, phosphoflow assays and CyTOF surface phenotyping) and SDY478 (cytokines and CyTOF surface phenotyping). The gene expression data utilized in this study to compute gene expression-iAge has been uploaded to the Gene Expression Omnibus under accession number GSE168753. Our study complies in full with the STROBE statement, STARD guidelines and GATHER statement.