Abstract
Infection of the cornea with HSV results in an immune-inflammatory reaction orchestrated by proinflammatory T cells that is a major cause of human vision impairment. The severity of lesions can be reduced if the representation of inflammatory T cells is changed to increase the presence of T cells with regulatory function. This report shows that inhibiting glutamine metabolism using 6-Diazo-5-oxo-L-norleucine (DON) administered via intraperitoneal (IP) starting 6 days after ocular infection and continued until day 15 significantly reduced the severity of herpetic stromal keratitis lesions. The therapy resulted in reduced neutrophils, macrophages as well proinflammatory CD4 Th1 and Th17 T cells in the cornea, but had no effect on levels of regulatory T cells. A similar change in the representation of inflammatory and regulatory T cells occurred in the trigeminal ganglion (TG) the site where HSV infection establishes latency. Glutamine metabolism was shown to be required for the in-vitro optimal induction of both Th1 and Th17 T cells but not for the induction of Treg that were increased when glutamine metabolism was inhibited. Inhibiting glutamine metabolism also changed the ability of latently infected TG cells from animals previously infected with HSV to reactivate and produce infectious virus.
Keywords: HSV, glutamine, 6-Diazo-5-oxo-L-norleucine, immunometabolism, inflammation control, latency
1. Introduction
Herpes simplex virus (HSV) is a common human pathogen that after infection persists indefinitely in the host in the form of latency [1]. Periodic recurrences can occur and these are particularly troublesome in some locations, such as the eye since they can result in blindness [2]. With chronic ocular lesions, the tissue damage that occurs is largely the consequence of immune reactivity to the infection [2, 3] mediated mainly by neutrophils [4, 5] and some types of macrophages [6, 7]. However the inflammatory reaction is orchestrated by subsets of T cells, particularly CD4+Th1 [8], CD4+ Th17 cells [9] and CD8+ T cells [10, 11]. Moreover, the pro-inflammatory activity of the T cell subsets can be down-modulated by other cell types such as Foxp3+ and IL-10-producing CD4+T cells [12, 13], as well as in some models M2 type macrophages [14]. Consequently, a potential control manoeuvre could be to rebalance the makeup of innate and adaptive constituents of the reaction, but finding a convenient and effective approach to accomplish this objective remains a challenge. One solution to this ‘rebalancing challenge’ could be to exploit the accumulating evidence that cells of the immune system depend differentially on variant pathways to support their metabolic needs [15, 16] and that manipulating metabolic effects serves to expand some cell types and suppress others [17]. For example, previous studies from our laboratory using an infectious disease model demonstrated that manipulating the glucose utilization pathway [18, 55], or changing the dietary input of a short chain fatty acid [19] could change the severity of ocular herpetic lesions. In the present proposal, we investigate if manipulating glutamine metabolism, which some reports show is required for the differentiation of some subsets of T cells [20-24], could also be an approach to control the expression of herpetic ocular disease. The approach could have additional benefits since glutamine metabolism is involved also in the stability of herpesvirus latency [25, 26].
Our results show that inhibiting glutamine metabolism by the daily administration of DON started 6 days after HSV ocular infection significantly reduced the severity of stromal keratitis (SK) lesions and pathological angiogenesis in the corneas of infected mice. The inflammatory responses in the cornea, the TG and the draining lymph nodes (DLN) of treated mice had markedly reduced numbers of inflammatory leucocytes, particularly neutrophils. In addition, their CD4 Th1 and Th17 T cell responses were reduced to a greater extent than were CD4 Treg responses. This rebalanced pattern of responsiveness was also attained when primary responses of different T cell subsets were generated in-vitro from naïve precursors in the presence or absence of glutamine. Thus, cultures in which glutamine was limited, or its use inhibited with DON, generated diminished Th1 and Th17 responses, but the primary Treg responses induced were unaffected or even enhanced by the same protocols. The effect of inhibiting glutamine was also evaluated for its effect on HSV reactivating from latently infected nerve ganglion cultures in-vitro. Under these circumstances, inhibiting glutamine metabolism changed the extent of reactivation from latency and inhibited the time of viral replication. Accordingly, managing the expression of herpetic infections by controlling glutamine metabolism could represent a useful approach worth further consideration for practical therapy. Although the data in the current manuscript showed that inhibition of glutamine metabolism correlated with an attenuated viral immune inflammatory process the effect was likely a global effect on all ongoing immune responses and not specific to the HSV response.
2. Material and methods
2.1. Animals
C57BL/6 and BALB/c mice of 5-6 week of age were acquired from Envigo (US). DO11.10 RAG2−/− mice were formerly procured from Taconic and breeding pairs and were continued in animal house for the continuation of the strain. Pathogen-free facility where food, water, bedding, and instruments were autoclaved was maintained in animal house and all mice were kept there. All the animals were kept and maintained in American Association of Laboratory Animal Science approved facilities at the University of Tennessee, Knoxville, TN. Guiding principle of the Institutional Animal Care and Use Committee, and Association for Research in Vision and Ophthalmology were followed during all the experiments.
2.2. Virus
HSV-1 strain RE and HSV-1 KOS EGFP/RFP (obtained from Paul (Kip) R. Kinchington, University of Pittsburgh) were cultured in Vero cell monolayers (American Type Culture Collection CCL81; Manassas, VA, USA) as per established procedure. The aliquots were stored at −80°C until further used.
2.3. DON administration
C57BL/6 infected mice were treated IP with 200 μl of 0.3 mg/kg dose of DON dissolved in PBS once a day as described in previous studies [27-29], from 6th day post infection (PI) until day 15PI. The same volume of PBS was administered in control group.
2.4. HSV-1 infection and clinical scoring
C57BL/6 mice of 7 week of age were given anaesthesia (1.25 % solution of 2,2,2-Tribromoethanol, ACROS Cat AC421430500), and the level of deep-rooted anaesthesia was determined by tail and toe pinch reflex.HSV-1 infection of corneal tissue was performed via light scarification (checker board formation of 15 scratches on cornea of each individual eye) of corneas with the help of a 27 gauge needle, applying 3 μl drops containing 1X10⁴ plaque-forming units (PFU) of HSV-1 RE in a circular manner. This procedure was followed by closing of the eye lids and mildly rubbing them for 45 sec. The infected mice were observed daily for the progression of lesions. The severity of SK lesions and angiogenesis were measured by slit-lamp bio-microscopy (Kowa Company, Nagoya, Japan) and the experiments were terminated on day 15 PI. The scoring system was as follows: 0, ordinary cornea; +1, mild hazy cornea; +2, cornea with moderate opacity or scarring; +3, severe corneal opacity but iris still visible; +4, cornea turned opaque with ulcer; and +5, corneal rupture and necrotizing keratitis. Angiogenic severity was recorded as described previously [19]. According to this system, a status of 4 for a given quadrant of the circle symbolizes a centripetal growth of 1.5 mm toward the center of the cornea. The score of the four quadrants of the eye were then totalled to obtain the neo-vessel formation index (range, 0 to 16) for individual eyes at a given time point.
2.5. Reagents and antibodies used
IFN-γ (XMG1.2), LY6G (1A8), Foxp3 (FJK-16S), IL-17A (TC11-18H10), CD4 (RM4-5), CD45 (30F11), anti-CD3 (145-2C11), anti-CD28 (37.51), CD11b (M1/70), GolgiPlug (brefeldin A), F4/80 (BM8), and CD16/CD32 (2.4G2) were procured from either eBioscience or BD Biosciences. DON (D2141-5 mg), phorbol myristate acetate (PMA) and ionomycin were acquired from Sigma-Aldrich. L-glutamine was obtained from Gibco (25030-081); RPMI-1640 with and without glutamine (10-041 and 15-041) was obtained from Corning. 0.4% Trypan-blue was obtained from Lonza (17-942E). The Live/dead staining kit was obtained from Life Technologies. Recombinant IL-2 (rIL-2) was from PeproTech and IL-6, IL-12 and TGF-β were from R&D Systems.Anti-IL-4 was from Bio-Legend.
2.6. Preparation of latently infected TG cultures and viral reactivation
For the viral reactivation from latency studies, seven week old BALB/c mice were used. Ocular scarification was done in similar manner as mentioned above and 1X10⁶ PFU of HSV-1 KOS EGFP/RFP was used for infection (kindly provided by Kip Kinchington, University of Pittsburgh). We started DON treatment at day 6 PI, a time when in the system virus is no longer replicating in the eye [30]. Mice were kept for 34-36 days PI before their TGs were used for ex-vivo reactivation studies. The latently infected mice were euthanized and TG were taken out and pooled in 10% RPMI-1640. Collagenase type I (C0130, Sigma) was added at rate of 1.5 mg/ml and TGs were incubated in CO2 chamber for 45 min at 37°C with regular shaking. After incubation, mechanical dissociation of TG was done with the help of 1 ml pipette tips. TG suspensions were then centrifuged and media was replaced by 10% DMEM and 10 U/ml of rIL-2. Suspensions of TGs were added to wells of 48-well flat-bottom plates (1 TG/well). In order to block glutamine metabolism DON (5 μM) was added to the reactivation media. Other wells received 2-Deoxy-d-glucose (2-DG) to block glucose metabolism as described elsewhere [18, 55]. The TG cultures were kept for up to 7 days at 37°C in CO2 chamber and 100 μl samples taken daily to detect and quantify replicating virus and the media replaced.
2.7. Flow cytometric analysis of immune cells
Individual corneas and TGs, from DON treated and untreated group were excised at day 15 PI and suspended in 10% RPMI-1640 media, and subsequently processed with Liberase @ 50 μg/ml (Roche Diagnostics, IN) for 45 min at 37 °C in a 5% CO2 humidified chamber. From the draining lymph nodes (DLN) and spleens, suspensions of single cells were made as mentioned above sans Liberase treatment. Single cell suspension from all above mentioned tissue and lymphoid organs were stimulated with PMA/Iono at 37°C for 4 hrs, followed by fluorochrome labelling of cells with different cell surface and intracellular markers for fluorescence-activated cell sorting (FACS) analyses as described previously [19]. Gating strategies for CD4+ T cells and T cell subsets (Th1, Th17 and Treg) were also presented in Supplementary Fig. 1.
During flow analyses in FlowJo software, all doublet cells were gated out followed by gating of live cells using live/dead staining. Cells were recognized as Th1, Th17 and Treg if they were CD4+IFN-γ+, CD4+IL-17A+, CD4+Foxp3+ respectively. Innate cells such as neutrophils were determined if they were CD45+CD11b+LY6G+ and macrophages were recognised if they were CD45+CD11b+F4/80+. Gating strategies for total innate cells and subsets (neutrophils and macrophages) were also presented in Supplementary Fig. 2.
2.8. In-vitro T cell differentiation
In order to estimate the influence of DON treatment and glutamine metabolism on the initiation of immune cell responses in in-vitro assay, naïve splenocytes from DO11.10 RAG2−/− mice were used as the responder cells described in detail previously [19]. After lysis of RBC and numerous washings, 0.5 X 10⁶ splenocytes were cultivated in 1ml of 10% RPMI-1640 media with rIL-2 (100 U/ml) and TGF- β (0.25 ng/ml) for Treg induction, IL-12 (5 ng/ml) and anti-IL-4 (10 μg/ml) for Th1 induction and IL-6 (30 ng/ml) and TGF-β (1 ng/ml) for Th17 induction. Cells were cultured in 48-well plates bounded with plate-bound anti-CD3/CD28 Ab (1 μg/ml) and were kept for 5 days in a 5% CO2 humidified chamber at 37°C. Inclusion of different concentrations of DON (1, 2.5, and 5 μM) was included in test cultures for the induction of Treg, Th1 and Th17 cells. In a similar manner, some cultures were performed in 10% RPMI-1640 with or without glutamine for the induction of Treg, Th1 and Th17 cells. External glutamine (at 1 and 2 mM) was also added in 10% RPMI with no glutamine for the generation of Treg, Th1 and Th17 cells. After 5 days, all cell cultures were examined by flow cytometry to measure the magnitude of T cells (Treg, Th1 and Th17 cells) after PMA/Iono stimulation that were formed in test and control cultures using Flow cytometric analysis.
2.9. Viral quantification
For the quantification of virus, a plaque assay was used described elsewhere [19]. 100 μl aliquots from each well were titrated (with plain DMEM) and serially diluted on 48 well plates with cultured Vero cells in triplicates. After 90 min incubation at 37°C, the wells of plates were overlaid with a mixture of 2% methylcellulose and 10% DMEM (vol:vol) and the plates were incubated for 4 days at 37°C in a humidified chamber. After four days, the plates were fixed with 10% formalin for one hour and then followed by staining the wells with crystal violet (0.2 % solution in alcohol) for 30 minutes.
2.10. Statistical analysis
All statistical calculations were performed using GraphPad Prism version 7.0 (GraphPad Software, La Jolla, CA). For the analysis of corneal SK and angiogenesis, the Wilcoxon test was used and the data represent median values in Fig. 1. The Mann-Whitney U test performed to compare two groups and presented in Fig. 2-7. For comparing more than two group, analysis of variance (ANOVA) was applied with Dunnett's multiple comparisons test for Fig. 8. The log transformation is used to transform for replicating virus titres by considering Y=Log(Y) before the calculation of significance with ANOVA in Fig 9. To measure significant difference between groups: p values were presented with figures and expressed as means results ± standard errors of the means (SEM).
Fig. 1.
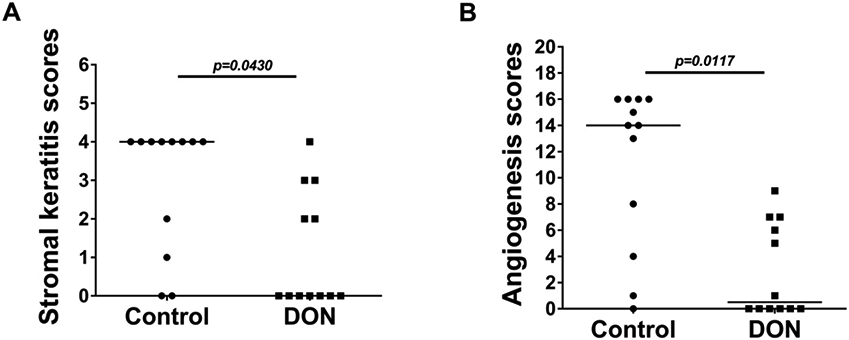
Therapeutic administration of DON reduces development and severity of SK and angiogenesis after HSV-1 ocular infection. Effect of therapeutic administration (from day 6 PI) of DON (0.3 mg/kg) on SK severity (A) in C57BL/6 at day 15 PI (n=12). Degree of angiogenesis (B) in C57BL/6 mice was recorded from individual eyes on day 15 PI (n=12). Data analyses were done by-a paired Wilcoxon-signed rank test and represented with median.
Fig. 2.
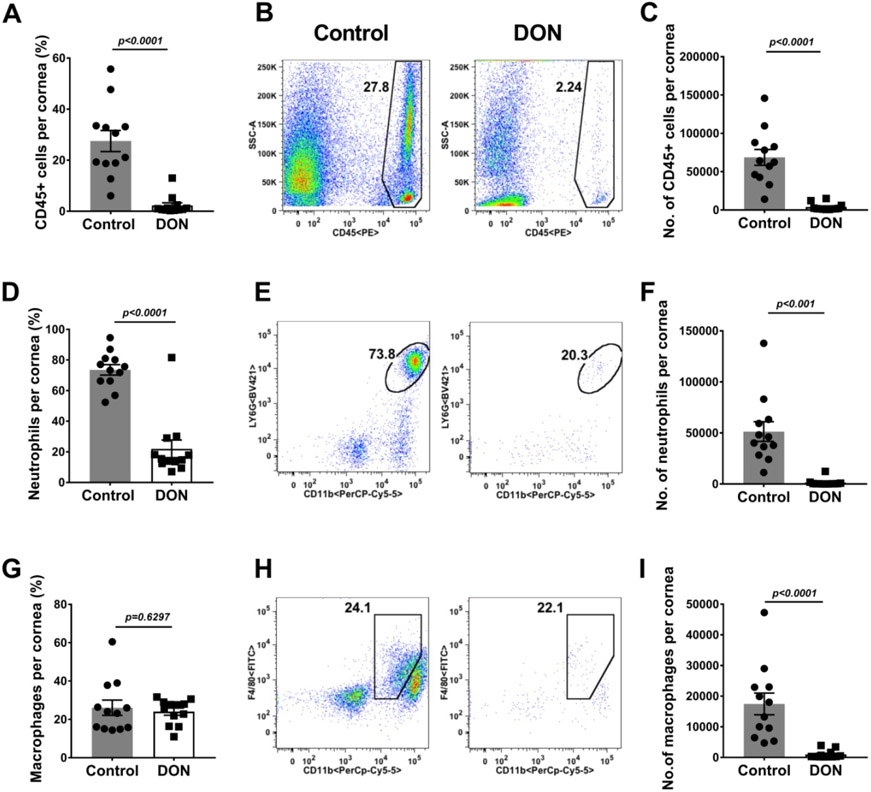
Therapeutic administration of DON diminishes innate inflammatory response in HSV-1 infected corneas. Histograms and plot analysis represent frequencies (A and B) and numbers (C) of total leukocytes, the frequencies (D and E) and numbers (F) of neutrophils (CD45+CD11b+Ly66+) in corneas, and frequencies (G and H) and total numbers (I) of macrophages (CD45+CD11b+F4/80+) present in corneas. The data represent mean results ± SEM. All data were analysed by Mann-Whitney U test (n=12).
Fig. 7.
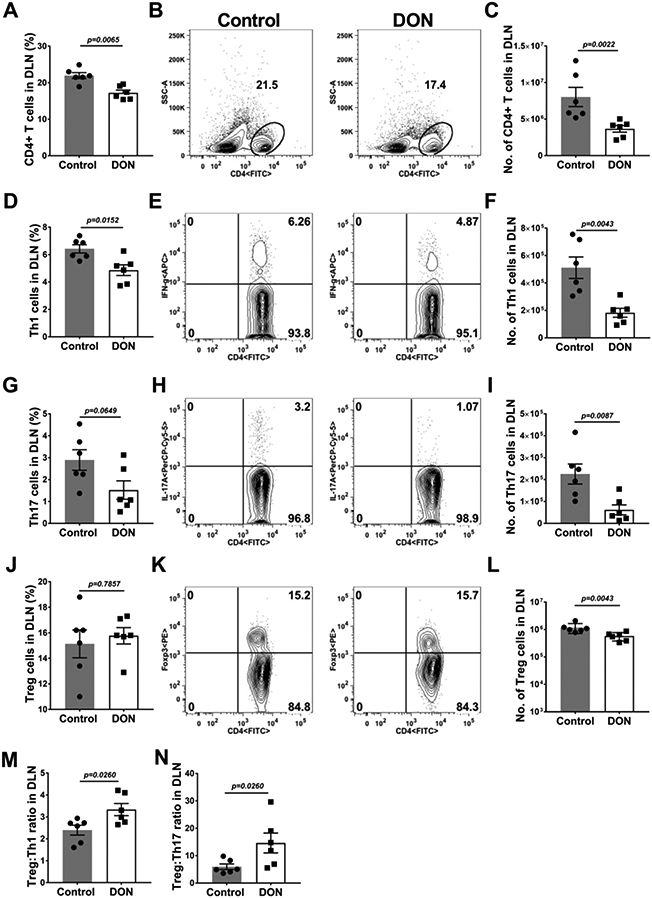
Therapeutic administration of DON decreases pro-inflammatory T cells and enhances anti-inflammatory T cells in the DLN.C57BL/6 mice were infected with HSV-1 and DON (0.3 mg/kg) was administered from day 6 until 15 PI and FACS analysis was performed on DLN at day 15 PI. Histograms and plot analysis present the frequencies (A and B) and numbers (C) of total CD4+ T cells, frequencies (D and E) and numbers (F) of Th1 cells (CD4+IFN-γ), frequencies (G and H) and numbers (I) of Th17 (CD4+IL-17A+) cells and frequency (J and K) and numbers (L) of Treg cells. The ratios of Treg:Th1 (M) and Treg:Th17 (N) in the DLN of control and DON treated animals were also presented. The data represent mean results ± SEM. All data were analysed by Mann-Whitney U test (experiments repeated three times with n=6).
Fig. 8.
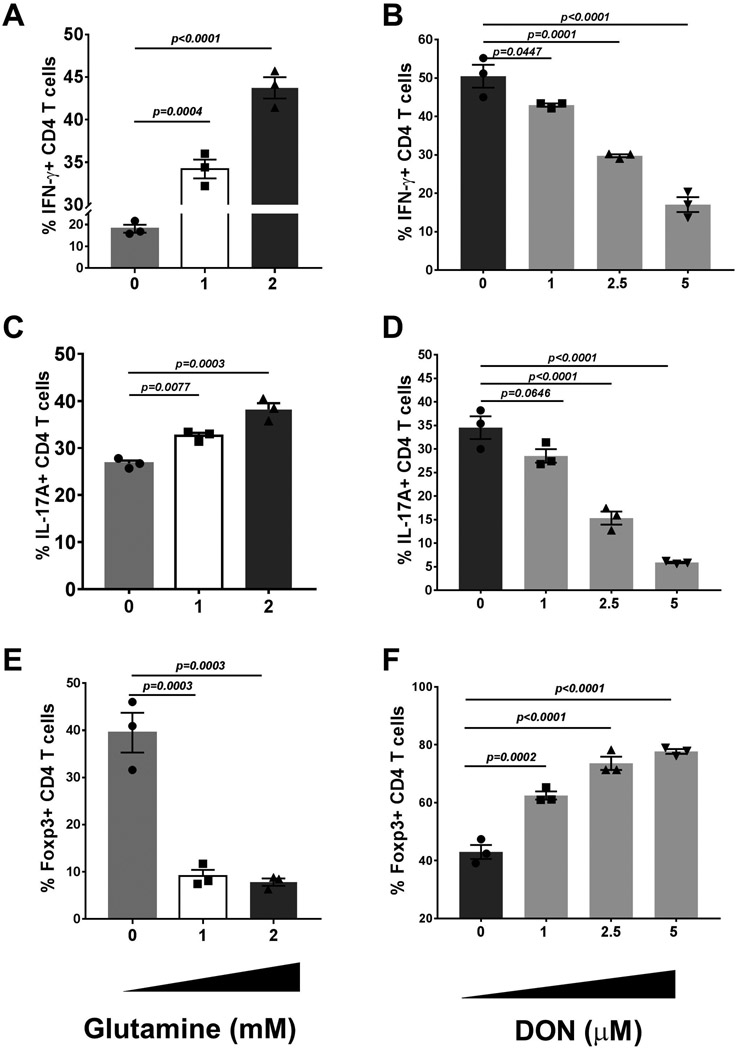
Effect of glutamine metabolism on in-vitro induction of Th1, Th17 and Treg cells. Splenocytes from DO11.10 RAG2−/− mice were ex-vivo cultured with cytokines promoting Th1, Th17 and Treg cell proliferation and tested under different concentration of glutamine and DON. After five days of incubation, the cells were harvested and analysed for the differentiation of the targeted immune phenotypes. The histogram A shows the frequencies of Th1 (CD4+IFN-γ+) cells with media containing 0, 1, and 2 mM concentrations of glutamine. Histogram B shows the frequencies of cells expressing IFN-γ at varying concentrations of DON. The histograms C and D and E and F show the same data for Th17 and Treg, respectively. The data represent mean results ± SEM. Dunnett's multiple comparisons test were performed as post-hoc test following the one-way ANOVA (experiments repeated three times with n=3).
Fig. 9.
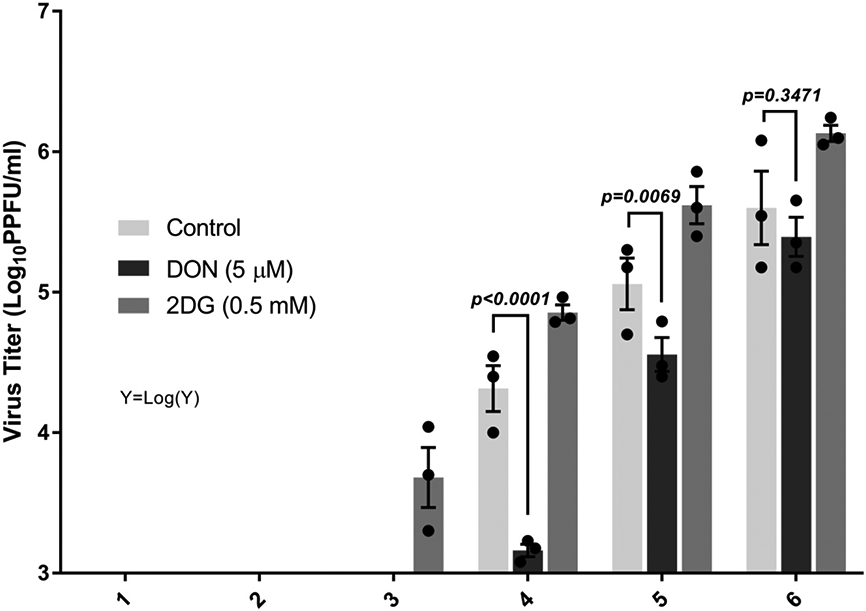
DON treatment reduces the viral titer from latently infected TG ex-plant culture. BALB/c mice were infected with HSV-1 KOS EGFP/RFP and the TG of said mice were then extracted after day 34 PI. The effect of 5 μM DON was tested on ex-vivo reactivation assay alongside with 0.5 mM of 2DG and culture control media. The 2DG treatment functioned as a positive control while the control culture media was a mock control. The supernatant was removed daily and the virus titer was counted on Vero cells in a plaque assay. Data analysis were performed on transformed [Y=Log(Y)] viral titer values. Dunnett's multiple comparisons test were performed as post-hoc test following the two-way ANOVA (experiments repeated three times with n=3). The data represent mean results ± SEM.
3. Results
3.1. Effect of blocking glutamine metabolism on severity of herpetic ocular lesions
To observe the effect of blocking glutamine metabolism on the severity of HSV-1 pathogenicity, the outcome of ocular HSV infection was compared in C57BL/6 mice that on day 6 received daily 0.3 mg/kg IP of DON compared to those given PBS. Day 6 was chosen to commence therapy since early signs of ocular inflammatory lesions become evident in some untreated mice at that time. Ocular lesions were scored daily and the experiments were terminated on day 15 PI by which time the majority of eyes in the PBS recipients were showing positive signs of angiogenesis and corneal scarring typical of SK (Fig. 1A and B). In the experiment shown (3 were performed of the same design and had similar results), 10 of 12 eyes in the control group had positive lesions of SK (a score of 1 or more on a severity scale up to 5) as well as pathological angiogenesis (a score of 1 or more on a scale up to 16). In contrast, in the DON recipients, only 5 of 12 eyes had positive SK and angiogenesis responses and none of the eyes had scores considered as severe (SK of 4 or greater and angiogenesis of 9 or greater) (Fig. 1A). The mean scores of lesion severity in the control and DON recipients for SK were 2.9 and 1.1 (Fig. 1A), and for angiogenesis were 11.9 and 2.9 (Fig. 1B) respectively.
Experiments were also done in which at the end of the observation period, individual eyes from DON treated and control mice were collected and processed to record the number and type of inflammatory cells present in the corneal stromal. In such experiments, the magnitude of the inflammatory responses was significantly reduced in the DON recipients compared to the control group (Fig. 2A-I). Analysis of data from the experiment revealed that the total leukocyte numbers were 17.6 (Fig. 2A) fold higher in the PBS group compared to the DON recipients (Fig. 2A-C). Two additional experiments (total three experiments) of the same design involving 6 mice/group per experiment showed a similar pattern of results. Comparing the relative number of neutrophils and macrophages in the two groups, these were 35.9 (Fig. 2F) and 17.5 (Fig. 2I) fold higher, respectively, in the PBS as compared to the DON recipients (Fig. 2D-I). There were also differences in the magnitude and subset representation of the T cells present in the corneas of control and DON treated animals (Fig. 3A-M). Mice that received DON had on average 5.6 (Fig. 3C) fold fewer CD4 T cells as compared to the PBS recipients. In addition, the reduction of CD4 Th1 cells was 33.9 (Fig. 3F) fold in DON recipients and for Th17 cells the reduction was 1.8 fold (Fig. 3I). The numbers of CD4+Foxp3+ cells (Treg) were also enumerated (Fig. 3J-L). These were far less reduced compared to Th1 and Th17 cells upon DON therapy. In consequence, the ratio of Treg:Th1 increased by 4.2 (Fig. 3M) fold indicating that DON therapy resulted in T cell subset rebalancing.
Fig. 3.
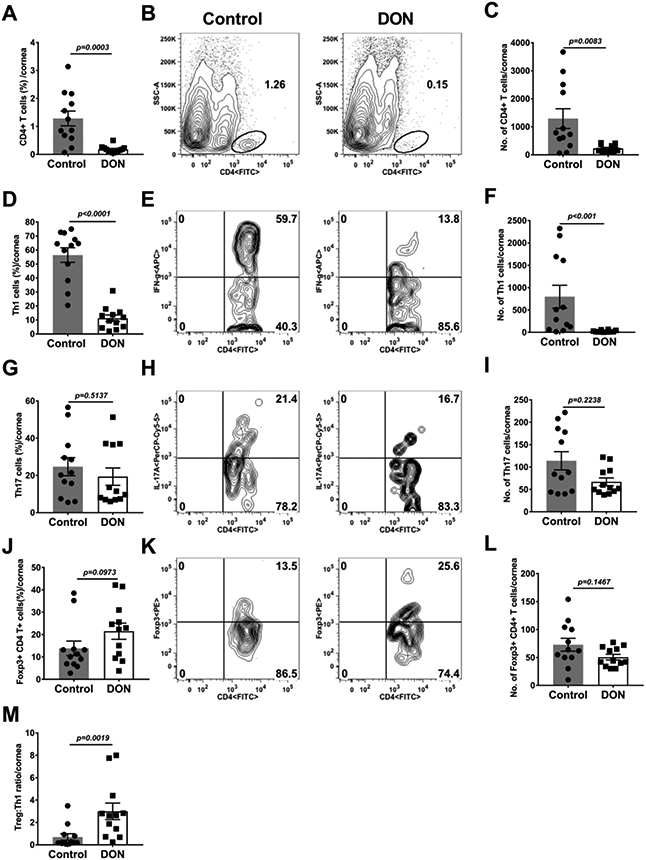
Therapeutic administration of DON resulted in reduction of pro-inflammatory T cell and promotion of regulatory T cell responses in HSV-1 infected corneas. C57BL/6 mice were infected with HSV-1 while DON (0.3 mg/kg) and PBS were administered from day 6 till 15 PI. Histogram and plot analysis represent the frequencies (A and B) and numbers (C) of total CD4+T cells in HSV-1 infected corneas, frequencies (D and E) and total numbers (F) of Th1 cells. The frequencies (G and H) and numbers (I) of Th17 cells, frequencies (J and K) and total numbers (L) of Treg cells and the ratio of Treg:Th1 (M) in the infected corneas. The data represent mean results ± SEM. All data was analysed by Mann-Whitney U test (n=12).
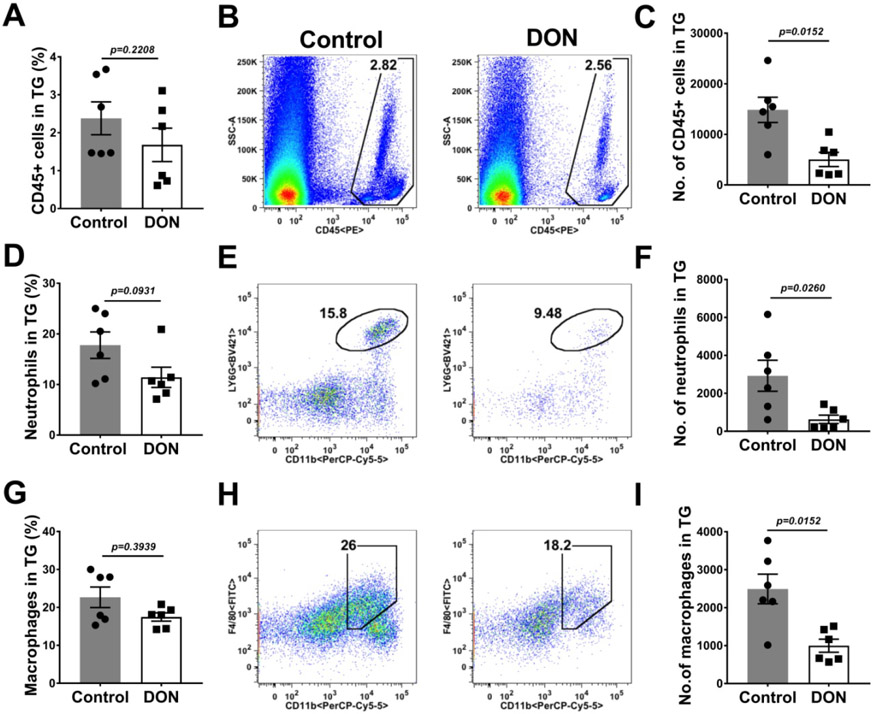
At the termination of experiments, the TG and DLN were also collected from DON treated and control animals, and the pattern of the inflammatory responses compared (Fig. 4A-I). In comparison to PBS recipient mice, the TGs of DON treated animals had reduced numbers of total leukocytes, neutrophils and macrophages by 2.9 (Fig. 4C), 4.6 and 2.5 fold (Fig. 4F) respectively. The T cell response differences in the TGs between DON treated and untreated PBS recipients (Fig. 5A-M), was a reduction in number of CD4, Th17 and Treg by 1.9 (Fig. 5C), 1.02 (Fig. 5F) and 1.4 fold (Fig. 5I) respectively. Additionally, there was also a 4.1 fold (Fig. 5L) reduction in the magnitude of Th1 cell response compared to PBS recipients (Fig. 5J-L). The ratio of the number of Treg:Th1 cells was 2.5 fold (Fig. 5M) enhanced in the TGs of DON treated mice in comparison to PBS recipient mice providing evidence that T subset rebalancing was present also in the TG.
Fig. 4.
Therapeutic administration of DON reduced innate inflammatory response in the TGs. C57BL/6 mice were infected ocularly with HSV-1, DON (0.3 mg/kg) and PBS was administered from day 6 till 15 PI and FACS analysis was performed on day 15 PI. Histograms and plot analysis represent frequencies (A and B) and total number (C) of leukocytes, the frequencies (D and E) and total numbers (F) of neutrophils (CD45+CD11b+Ly6G+) and the frequencies (G and H) and numbers (I) of macrophages (CD45+CD11b+F4/80+). The data represent mean results ± SEM. All data were analysed by Mann-Whitney U test (experiments repeated three times with n=6).
Fig. 5.
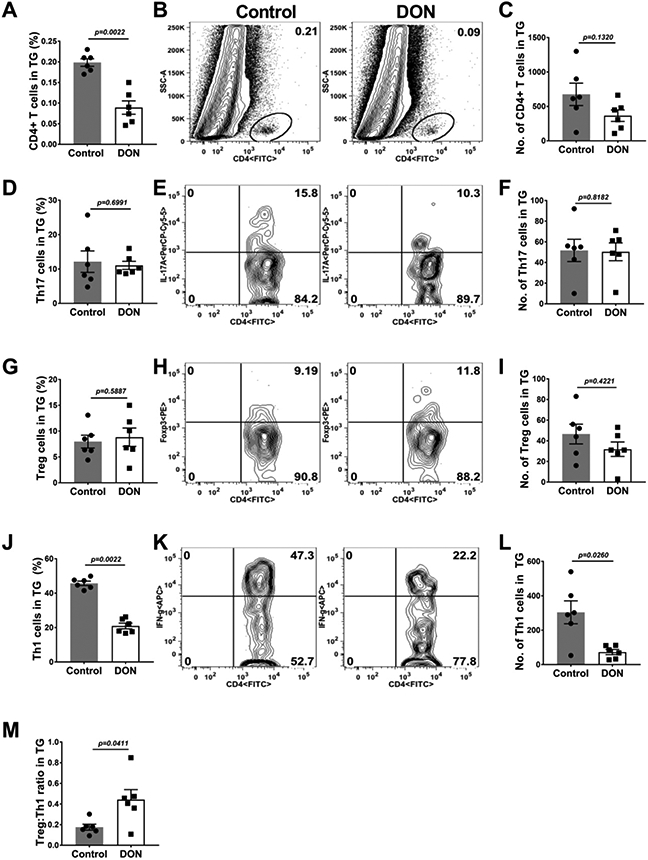
Therapeutic administration of DON diminished pro-inflammatory T cell responses in the TGs. C57BL/6 mice were ocularly infected with HSV-1, DON (0.3 mg/kg) and PBS was administered from day 6 till 15 PI and FACS analysis was performed on day 15 PI. Histograms and plot analysis represent total CD4+ T cells frequencies (A and B) and numbers (C), Th17 cells frequencies (D and E) and numbers (F), Treg cell frequencies (G and H) and numbers (I) and the Th1 frequency (J and K) and numbers (L). Fig 5 M shows the ratio of Th1:Treg on both control and DON treated animal TGs. The data represent mean results ± SEM. All data were analysed by Mann-Whitney U test (experiments repeated three times with n=6).
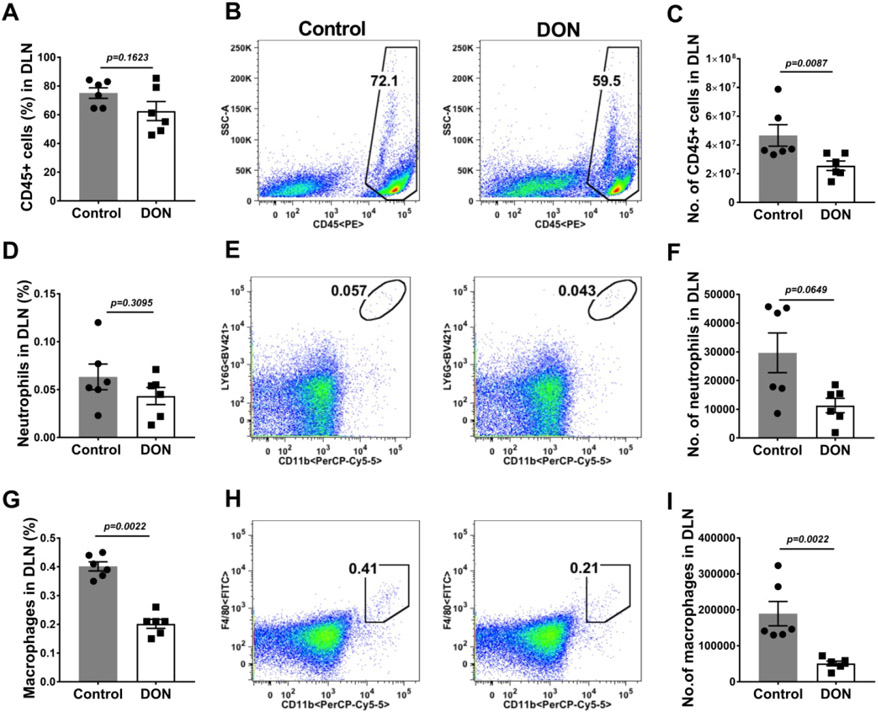
In the DLN of DON recipients (Fig. 6A-I) the numbers of macrophages and neutrophils were on average reduced by 2.6 (Fig. 6F) and 3.7 (Fig. 6I) fold respectively as compared to PBS recipients. Furthermore, T cell responses of DON recipients compared to the PBS treated group (Fig. 7A-N) in the DLN, were reduced in numbers for CD4, Th1 and Th17 cells by 2.1 (Fig. 7C), 2.8 (Fig. 7F) and 3.6 fold (Fig. 7I) respectively. The numbers of Treg were also enumerated and their number compared to the numbers of Th1 and Th17 cells (Fig. 7 J-L). The average ratio of total number of Treg:Th1 cells in control animals was 2.3 and in DON recipients the ratio increased to 3.3 (Fig. 7M). Additionally, the average mean ratio of Treg:Th17 cell number in control animals was 5.9, but in the DON recipients the ratio was enhanced to 14.6 (Fig. 7N). Changes of T cell profiles similar to those in the DLN were also observed in the spleen cell populations (data not shown).
Fig. 6.
Therapeutic administration of DON reduced innate inflammatory response in DLN. C57BL/6 mice were infected with HSV-1 and DON (0.3 mg/kg) was administered from day 6 till 15 PI and FACS analysis was performed on day 15 PI. Histograms and plot analysis represent frequencies (A and B) and numbers (C) of leukocytes. The frequencies (D and E) and numbers (F) of neutrophils (CD45+CD11b+Ly6G+) and the frequencies (G and H) and numbers (I) of macrophages (CD45+CD11b+F4/80+). The data represent mean results ± SEM. All data were analysed by Mann-Whitney U test (experiments repeated three times with n=6).
Taken together, the results from corneas, TG and DLN show that DON therapy in mice infected in the cornea with HSV was correlated with diminished inflammatory reactions that were rebalanced as regards T cell subset representation.
3.2. Effect of glutamine metabolism on the primary induction of T cell functional subsets in-vitro
The results of in-vivo studies indicated that glutamine metabolism was more relevant for the response of some subsets of T cells than it was for others. To further investigate this issue, experiments were done to measure the influence of glutamine levels on the primary induction of T cells with different immune functions from naïve precursors. For this purpose, splenocytes from DO11.10 RAG2−/−mice were cultured in-vitro under conditions shown elsewhere to optimally induce populations of Th1, Th17 and Treg [19]. The cultures were exposed to different conditions of glutamine content for 5 days after which the numbers of CD4 T cells with different functions were quantified and compared (Fig. 8). As regard the induction of Th1 T cells, excellent responses occurred in cultures with glutamine containing media (Fig. 8A), but these were reduced by 58.5% (in comparison to controls) when cultures were maintained in glutamine free media (Fig. 8A; Supplementary Fig. 3). Supplementing glutamine in the glutamine free medium restored the Th1 response (Fig. 8A; Supplementary Fig. 3). Additionally, there was a dose dependant reduced Th1 response when DON was present with the response reduced around 66% at the highest level of DON tested (5 μM, Supplementary Fig. 4); a concentration with no detectable cell toxicity (Fig. 8B). A similar pattern of results was observed with Th17 induction cultures showing also the need for glutamine to optimally induce Th17 T cell responses (Fig. 8C and D; Supplementary Fig. 3). Contrasting results were obtained with Treg induction cultures. In such cultures, responses were not impaired, but were actually enhanced when in glutamine free media was used (Fig. 8E; Supplementary Fig. 3). Moreover, a similar outcome was observed when glutamine metabolism was inhibited using DON (Supplementary Fig. 4). Curiously, even at the highest level of DON (5 μM) used in the Treg induction cultures; the Treg response was enhanced by 77.7% (Fig. 8F; Supplementary Fig. 4).
Accordingly, the results of in-vitro induction of T cell subset responses indicated that glutamine metabolism was an essential requirement for Th1 and Th17 T cells responses which are those mainly responsible for orchestrating ocular lesions after HSV infection, but not a requirement for Treg induction, the cell type involved in modulating the severity of SK.
3.3. Effect of glutamine metabolism on the stability of HSV latency
Some reports have advocated that glutamine metabolism may influence the stability of HSV latency [25, 26]. To evaluate this issue, experiments were done in wherein cultures of TG cells were set up from mice with well established latency and the effects of manipulating glutamine metabolism on the duration of latency were compared with cultures in normal media as well as with cultures where glucose metabolism was compromised using 2DG. The results shown in Fig. 9 indicate that when glutamine metabolism was inhibited using DON there was a delay in the breakdown of latency whereas in cultures that contained 2DG latency breakdown appeared to be accelerated. It was also apparent that viral levels were lower in cultures that contained DON compared to control cultures on days 4 and 5.
4. Discussion
Herpetic lesions in the cornea are examples where the host inflammatory reaction to the infection becomes the major cause of tissue damage [2]. Unfortunately, such SK reactions in humans can result in blindness[31]. The management of SK mainly relies on using anti-inflammatory drugs, such as steroids along with antiviral drugs, but this approach can result in complications, especially when long term therapy is required [32]. Alternative forms of therapy are needed that have less side effects than do anti-inflammatory drugs such as steroids. In this report, we have exploited the gathering evidence that cells which participate in inflammatory reactions may rely on different metabolic pathways to support their growth, survival and function and that manipulating some metabolic pathways can accomplish a rebalancing of cellular participants within an inflammatory reaction [33, 34]. This idea of manipulating metabolism to influence the composition of inflammatory reactions has been mainly explored in the cancer and autoimmunity fields [17, 35-37], but, as we demonstrate in this report, the approach also has promise as a means to manage the outcome of chronic lesions induced by a virus infection. Accordingly, we show that if glutamine metabolism is disrupted during the period when an inflammatory reaction in the eye to HSV infection is occurring, the severity of lesions is reduced significantly and ocular damage minimized. We show that this outcome was likely achieved because the expansion of cell types involved in orchestrating and executing tissue damage was inhibited, whereas cell types such as Treg that help resolve inflammatory reactions were unaffected. We could also show that glutamine metabolism was differentially required for the in-vitro induction of different subtypes of T cells from naïve precursors. Thus, whereas the induction of proinflammatory CD4 Th1 and Th17 T cells was impaired when glutamine was restricted or inhibited, the induction of Treg was actually expanded. Glutamine metabolism was also shown to extend the in-vitro stability of herpesvirus latency.
Glutamine metabolism is mainly involved in driving the TCA cycle which is a major means by which some cell types provide their energy requirements [38]. The glutamine derives from extracellular sources and needs to be converted first to glutamate and then to alpha-ketoglutarate, a key component of the TCA cycle [38]. Glutamine metabolism is readily blocked by compounds such as DON that targets the enzymes involved in the conversion [39]. As our study showed, when animals were treated daily with DON both neutrophils and macrophages, the cell types mainly responsible for causing the tissue damage that occurs in SK, were markedly reduced in number in the corneas. This likely occurred because the TCA cycle is essential during their differentiation and function, which others have documented [40, 41]. Furthermore, DON therapy also caused a major reduction in the numbers of CD4 Th1 and Th17 T cells, the cell types which we and others have shown are largely responsible for orchestrating the ocular inflammatory reaction to HSV infection [2, 3]. Accordingly, the overall effect of blocking glutamine metabolism was to inhibit the participation of both the organisers and the aggressors of tissue damage. In addition, we could also observe that inhibiting glutamine metabolism had no untoward effect on the Treg response to the infection. In consequence, the relative composition of CD4 T cell subtypes in the inflammatory reactions changed to favor the greater representation of Treg. It is well known from past studies that when Treg become dominant over inflammatory subsets of T cells, the tissue damaging reaction becomes reduced [42]. Moreover, substantial evidence has shown that certain types of Treg such as those that produce amphiregulin are actively involved in driving the repair of inflammatory lesions [43, 44]. Overall, inhibiting glutamine metabolism achieved the cellular rebalancing objective that we contend is necessary to counteract the viral induced immune inflammatory lesions.
One curious observation we cannot fully explain is why inhibiting glutamine metabolism had no apparent effect on the response of Treg. In fact, the results of in-vitro immune induction experiments showed that the response of Treg was even elevated when glutamine levels were limited, or its metabolism inhibited using DON. The observation that Treg are unaffected, or even enhanced, by inhibiting glutamine metabolism also has been reported by others [20, 21, 45, 46]. According to the Rathmell group, leaders in the field of immunometabolism, Treg show metabolic flexibility and can oxidize glucose to provide pyruvate which maintains TCA activity [47]. In addition, Treg also can provide their energy requirements from metabolizing fatty acids which are transported from the cytoplasm to the mitochondria as fatty acyl CoA. In the mitochondria fatty acyl CoA is changed to acetyl CoA and this acetyl CoA in-turn enters the TCA cycle [48]. Accordingly, Treg can dispense with the need for glutamine, but why the Treg response was elevated when it was unavailable for use requires a mechanistic explanation. A review by Yang et al. does discuss some mechanistic ideas that might explain the differential effects of glutamine metabolism on Th17 and Treg [49].
Although the primary focus of our investigations was to find an effective approach to modulate the inflammatory reactions in the eye to herpetic infection, it was also of interest to note that the consequences of inhibiting glutamine metabolism was also evident in the TG and DLN. In both locations, the magnitude of the response was reduced and immune cell composition changed to minimise the proinflammatory cell types. The effect on inflammatory reactions in the TG could be particularly relevant since that is the site where HSV inevitably establishes latency, a state of non-replicating infection that is lifelong [1]. Although there is no general agreement has to how HSV latency is established, maintained and interrupted during reactivation, one viable hypothesis is that the immune system participates with T cells somehow involved in helping to maintain latency [50, 51]. In addition, certain subsets of T cells appear more involved that others with CD8 and proinflammatory CD4 T cells likely most critical for maintaining latency [50]. The potential role of Treg during latency has not been adequately explored, but this topic merits such investigation. Our observation that blocking glutamine metabolism in ocularly infected mice reduced the content of CD4 Th1 and Th17 T cells in the TG could mean that reactivation from latency might become a more frequent and unfortunate consequence of the therapy. This would be of particular concern in humans where frequent reactivation from latency is a common circumstance that ultimately results in corneal blindness [52]. However, in our in-vitro reactivation experiments, we observed that blocking glutamine metabolism appeared to delay the termination of latency and reduced levels of replication competent virus production, whereas blocking the metabolism of glucose had the opposite effect of accelerating the breakdown of latency. We suspect that the expansion of Treg activity resulting from inhibiting glutamine metabolism might explain these observations, but further investigation is needed to clarify this issue.
Our in-vivo report is one of a very few that have explored the value of inhibiting glutamine metabolism to control the expression of a viral immune inflammatory disease process. More reports have evaluated the approach to limit the severity of autoimmune diseases, such as EAE, as well as the inflammatory reactions in some cancers [22, 53, 54]. Reports from the Griffin laboratory has described the value of modulating glutamine metabolism to control the chronic neuropathological lesions caused by infection with the Sindbis alpha virus [28, 29]. Similar to our findings, the alphavirus studies showed that treatment with DON reduced the CD4 gamma interferon producing cell response involved in mediating the neuropathology. In addition, there was a marked reduction in the expression level of several cytokines and chemokines involved in damage to the CNS. In the Sindbis virus disease model, the direct effect on other cell types such as neutrophils and Treg was not reported. To our knowledge the current study with HSV keratitis and that with alphavirus neuropathology are the only viral induced inflammatory diseases studied so far for the effects of inhibiting glutamine metabolism. However, as we and the Griffin group show the approach is valuable and merits evaluation, used alone or perhaps in combination with other therapies, to limit the extent of microbe induced immune-inflammatory disease. It is also worth noting that the results of in-vitro studies indicate that glutamine metabolism is needed by several viral infections, including some herpesviruses for effective replication [26]. Thus, impeding glutamine metabolism might control some viral diseases by acting to target both the virus and the host inflammatory reaction. Taken together, our results show that modulating glutamine metabolism is a valuable approach to control the inflammatory lesions caused by a viral infection and could also shape the outcome of herpesvirus latency.
Supplementary Material
Highlights.
Inhibition of glutamine metabolism diminish lesion of stromal keratitis caused by HSV.
Therapy acted to diminish proinflammatory T cells but not for the induction of Treg.
In-vitro culture of Th1 and Th17 T cells was reduced by blocking glutamine metabolism but not Treg.
Inhibiting glutamine metabolism reduced inflammatory reactions in the TG.
Acknowledgment
This work was supported by National Institutes of Health, USA and adhered to grant no: R21AI142862 and R01EY005093.
Abbreviations:
- Treg
regulatory T cell
- TGs
trigeminal ganglions
- SK
stromal keratitis
- PFU
plaque-forming units
- IP
intraperitoneal
- HSV
herpes simplex virus
- DON
6-Diazo-5-oxo-L-norleucine
- DLN
draining lymph nodes
- PI
post-infection
- PMA
phorbolmyristate acetate
- 2-DG
2-Deoxy-d-glucose
- FACS
fluorescence-activated cell sorting
- TCA
tricarboxylic acid
- EAE
experimental autoimmune encephalomyelitis
- CNS
central nervous system
Footnotes
Publisher's Disclaimer: This is a PDF file of an unedited manuscript that has been accepted for publication. As a service to our customers we are providing this early version of the manuscript. The manuscript will undergo copyediting, typesetting, and review of the resulting proof before it is published in its final form. Please note that during the production process errors may be discovered which could affect the content, and all legal disclaimers that apply to the journal pertain.
Declaration of interest
Authors declare no competing interest exist and no financial interest pending from this study.
References
- [1].Wagner EK, Bloom DC, Experimental investigation of herpes simplex virus latency, Clin. Microbiol. Rev, 10 (1997) 419–443. [DOI] [PMC free article] [PubMed] [Google Scholar]
- [2].Streilein JW, Dana MR, Ksander BR, Immunity causing blindness: five different paths to herpes stromal keratitis, Immunol. Today, 18 (1997) 443–449. [DOI] [PubMed] [Google Scholar]
- [3].Biswas PS, Rouse BT, Early events in HSV keratitis-setting the stage for a blinding disease, Microbes Infect., 7 (2005) 799–810. [DOI] [PubMed] [Google Scholar]
- [4].Tumpey TM, Chen SH, Oakes JE, Lausch RN, Neutrophil-mediated suppression of virus replication after herpes simplex virus type 1 infection of the murine cornea, J. Virol, 70 (1996) 898–904. [DOI] [PMC free article] [PubMed] [Google Scholar]
- [5].Thomas J, Gangappa S, Kanangat S, Rouse BT, On the essential involvement of neutrophils in the immunopathologic disease: herpetic stromal keratitis, J. Immunol, 158 (1997) 1383–1391. [PubMed] [Google Scholar]
- [6].Mott K, Brick DJ, van Rooijen N, Ghiasi H, Macrophages are important determinants of acute ocular hsv-1 infection in immunized mice, Investig. Ophthalmol. Vis. Sci, 48 (2007) 5605–5615. [DOI] [PubMed] [Google Scholar]
- [7].Lee DH, Ghiasi H, Roles of M1 and M2 macrophages in herpes simplex virus 1 infectivity, J. Virol, 91 (2017). [DOI] [PMC free article] [PubMed] [Google Scholar]
- [8].Niemialtowski MG, Rouse BT, Predominance of Th1 cells in ocular tissues during herpetic stromal keratitis, J. Immunol, 149 (1992) 3035–3039. [PubMed] [Google Scholar]
- [9].Suryawanshi A, Veiga-Parga T, Rajasagi NK, Reddy PB, Sehrawat S, Sharma S, Rouse BT, Role of IL-17 and Th17 cells in herpes simplex virus-induced corneal immunopathology, J. Immunol, 187 (2011) 1919–1930. [DOI] [PMC free article] [PubMed] [Google Scholar]
- [10].Keadle TL, Morris JL, Pepose JS, Stuart PM, CD4(+) and CD8(+) cells are key participants in the development of recurrent herpetic stromal keratitis in mice, Microb. Pathog, 32 (2002) 255–262. [DOI] [PubMed] [Google Scholar]
- [11].Osorio Y, Cai S, Hofman FM, Brown DJ, Ghiasi H, Involvement of CD8+ T-cells in exacerbation of corneal scarring in mice, Curr. Eye Res, 29 (2004) 145–151. [DOI] [PubMed] [Google Scholar]
- [12].Suvas S, Kumaraguru U, Pack CD, Lee S, Rouse BT, CD4+CD25+ T cells regulate virus-specific primary and memory CD8+ T cell responses, J. Exp. Med, 198 (2003) 889–901. [DOI] [PMC free article] [PubMed] [Google Scholar]
- [13].Sarangi PP, Sehrawat S, Suvas S, Rouse BT, IL-10 and natural regulatory T cells: two independent anti-inflammatory mechanisms in herpes simplex virus-induced ocular immunopathology, J. Immunol. Res, 180 (2008) 6297–6306. [DOI] [PubMed] [Google Scholar]
- [14].Jaggi U, Yang M, Matundan HH, Hirose S, Shah PK, Sharifi BG, Ghiasi H, Increased phagocytosis in the presence of enhanced M2-like macrophage responses correlates with increased primary and latent HSV-1 infection, PLoS Pathog., 16 (2020) e1008971. [DOI] [PMC free article] [PubMed] [Google Scholar]
- [15].Buck MD, O’Sullivan D, Pearce EL, T cell metabolism drives immunity, J. Exp. Med, 212 (2015) 1345–1360. [DOI] [PMC free article] [PubMed] [Google Scholar]
- [16].Sumbria D, Berber E, Mathayan M, Rouse BT, Virus infections and host metabolism—can we manage the interactions?, Front. Immunol, 11 (2021). [DOI] [PMC free article] [PubMed] [Google Scholar]
- [17].Mockler MB, Conroy MJ, Lysaght J, Targeting T cell immunometabolism for cancer immunotherapy; understanding the impact of the tumor microenvironment, Front. Oncol, 4 (2014) 107. [DOI] [PMC free article] [PubMed] [Google Scholar]
- [18].Varanasi SK, Donohoe D, Jaggi U, Rouse BT, Manipulating glucose metabolism during different stages of viral pathogenesis can have either detrimental or beneficial effects, J. Immunol, 199 (2017) 1748–1761. [DOI] [PMC free article] [PubMed] [Google Scholar]
- [19].Sumbria D, Berber E, Rouse BT, Supplementing the diet with sodium propionate suppresses the severity of viral immuno-inflammatory lesions, J. Virol, 95 (2021) e02056–02020. [DOI] [PMC free article] [PubMed] [Google Scholar]
- [20].Klysz D, Tai X, Robert PA, Craveiro M, Cretenet G, Oburoglu L, Mongellaz C, Floess S, Fritz V, Matias MI, Yong C, Surh N, Marie JC, Huehn J, Zimmermann V, Kinet S, Dardalhon V, Taylor N, Glutamine-dependent α-ketoglutarate production regulates the balance between T helper 1 cell and regulatory T cell generation, Science signaling, 8 (2015) ra97. [DOI] [PubMed] [Google Scholar]
- [21].Johnson MO, Wolf MM, Madden MZ, Andrejeva G, Sugiura A, Contreras DC, Maseda D, Liberti MV, Paz K, Kishton RJ, Johnson ME, de Cubas AA, Wu P, Li G, Zhang Y, Newcomb DC, Wells AD, Restifo NP, Rathmell WK, Locasale JW, Davila ML, Blazar BR, Rathmell JC, Distinct regulation of Th17 and Th1 cell differentiation by glutaminase-dependent metabolism, Cell, 175 (2018) 1780–1795.e1719. [DOI] [PMC free article] [PubMed] [Google Scholar]
- [22].Nakaya M, Xiao Y, Zhou X, Chang JH, Chang M, Cheng X, Blonska M, Lin X, Sun SC, Inflammatory T cell responses rely on amino acid transporter ASCT2 facilitation of glutamine uptake and mTORC1 kinase activation, Immunity, 40 (2014) 692–705. [DOI] [PMC free article] [PubMed] [Google Scholar]
- [23].Araujo L, Khim P, Mkhikian H, Mortales CL, Demetriou M, Glycolysis and glutaminolysis cooperatively control T cell function by limiting metabolite supply to N-glycosylation, eLife, 6 (2017). [DOI] [PMC free article] [PubMed] [Google Scholar]
- [24].Lian G, Gnanaprakasam JR, Glutathione de novo synthesis but not recycling process coordinates with glutamine catabolism to control redox homeostasis and directs murine T cell differentiation, eLife, 7 (2018). [DOI] [PMC free article] [PubMed] [Google Scholar]
- [25].Cinatl J, Vogel JU, Cinatl J, Kabickova H, Kornhuber B, Doerr HW, Antiviral effects of 6-diazo-5-oxo-L-norleucin on replication of herpes simplex virus type 1, Antiviral Res., 33 (1997) 165–175. [DOI] [PubMed] [Google Scholar]
- [26].Thai M, Thaker SK, Feng J, Du Y, Hu H, Ting Wu T, Graeber TG, Braas D, Christofk HR, MYC-induced reprogramming of glutamine catabolism supports optimal virus replication, Nat. Commun, 6 (2015) 8873. [DOI] [PMC free article] [PubMed] [Google Scholar]
- [27].Potter MC, Baxter VK, Mathey RW, Alt J, Rojas C, Griffin DE, Slusher BS, Neurological sequelae induced by alphavirus infection of the CNS are attenuated by treatment with the glutamine antagonist 6-diazo-5-oxo-l-norleucine, J. Neurovirol, 21 (2015) 159–173. [DOI] [PMC free article] [PubMed] [Google Scholar]
- [28].Manivannan S, Baxter VK, Schultz KLW, Slusher BS, Griffin DE, Perlman S, Protective effects of glutamine antagonist 6-diazo-5-oxo-L-norleucine in mice with alphavirus encephalomyelitis, J. Virol, 90 (2016) 9251–9262. [DOI] [PMC free article] [PubMed] [Google Scholar]
- [29].Baxter VK, Glowinski R, Braxton AM, Potter MC, Slusher BS, Griffin DE, Glutamine antagonist-mediated immune suppression decreases pathology but delays virus clearance in mice during nonfatal alphavirus encephalomyelitis, Virology, 508 (2017) 134–149. [DOI] [PMC free article] [PubMed] [Google Scholar]
- [30].Rajasagi NK, Suryawanshi A, Sehrawat S, Reddy PB, Mulik S, Hirashima M, Rouse BT, Galectin-1 reduces the severity of herpes simplex virus-induced ocular immunopathological lesions, J. Immunol, 188 (2012) 4631–4643. [DOI] [PMC free article] [PubMed] [Google Scholar]
- [31].Pepose J, Leib D, Stuart P, Easty D, Herpes simplex virus diseases: anterior segment of the eye, in: Pepose JS, Holland GR, W. KR (Eds.) Ocular Infection and Immunity, St Louis:Mosby; 1996. [Google Scholar]
- [32].Wilhelmus KR, Gee L, Hauck WW, Kurinij N, Dawson CR, Jones DB, Barron BA, Kaufman HE, Sugar J, Hyndiuk RA, Laibson PR, Stulting RD, Asbell PA, Herpetic eye disease study: A controlled trial of topical corticosteroids for herpes simplex stromal keratitis, Ophthalmology, 101 (1994) 1883–1896. [DOI] [PubMed] [Google Scholar]
- [33].MacIver NJ, Michalek RD, Rathmell JC, Metabolic regulation of T lymphocytes, Annu. Rev. Immunol, 31 (2013) 259–283. [DOI] [PMC free article] [PubMed] [Google Scholar]
- [34].O'Sullivan D, Pearce EL, Targeting T cell metabolism for therapy, Trends Immunol., 36 (2015) 71–80. [DOI] [PMC free article] [PubMed] [Google Scholar]
- [35].Kono M, Yoshida N, Tsokos GC, Metabolic control of T cells in autoimmunity, Curr. Opin. Rheumatol, 32 (2020) 192–199. [DOI] [PubMed] [Google Scholar]
- [36].Kono M, Yoshida N, Maeda K, Suárez-Fueyo A, Kyttaris VC, Glutaminase 1 inhibition reduces glycolysis and ameliorates lupus-like disease in MRL/lpr mice and experimental autoimmune encephalomyelitis, Arthritis Rheumatol., 71 (2019) 1869–1878. [DOI] [PMC free article] [PubMed] [Google Scholar]
- [37].Hollinger KR, Smith MD, Kirby LA, Prchalova E, Alt J, Rais R, Calabresi PA, Slusher BS, Glutamine antagonism attenuates physical and cognitive deficits in a model of MS, Neurol Neuroimmunol Neuroinflamm, 6 (2019) e609. [DOI] [PMC free article] [PubMed] [Google Scholar]
- [38].Yang C, Ko B, Hensley CT, Jiang L, Wasti AT, Kim J, Sudderth J, Calvaruso MA, Lumata L, Mitsche M, Rutter J, Merritt ME, DeBerardinis RJ, Glutamine oxidation maintains the TCA cycle and cell survival during impaired mitochondrial pyruvate transport, Mol. Cell, 56 (2014) 414–424. [DOI] [PMC free article] [PubMed] [Google Scholar]
- [39].Shapiro RA, Clark VM, Curthoys NP, Inactivation of rat renal phosphate-dependent glutaminase with 6-diazo-5-oxo-L-norleucine. Evidence for interaction at the glutamine binding site, J. Biol. Chem, 254 (1979) 2835–2838. [PubMed] [Google Scholar]
- [40].Injarabian L, Devin A, Ransac S, Marteyn BS, Neutrophil metabolic shift during their lifecycle: Impact on their survival and activation, Int. J. Mol. Sci, 21 (2019). [DOI] [PMC free article] [PubMed] [Google Scholar]
- [41].Jeon JH, Hong CW, Kim EY, Lee JM, Current understanding on the metabolism of neutrophils, Immune Netw., 20 (2020) e46. [DOI] [PMC free article] [PubMed] [Google Scholar]
- [42].Veiga-Parga T, Sehrawat S, Rouse BT, Role of regulatory T cells during virus infection, Immunol. Rev, 255 (2013) 182–196. [DOI] [PMC free article] [PubMed] [Google Scholar]
- [43].Burzyn D, Benoist C, Mathis D, Regulatory T cells in nonlymphoid tissues, Nat. Immunol, 14 (2013) 1007–1013. [DOI] [PMC free article] [PubMed] [Google Scholar]
- [44].Varanasi SK, Rajasagi NK, Jaggi U, Rouse BT, Role of IL-18 induced Amphiregulin expression on virus induced ocular lesions, Mucosal Immunol., 11 (2018) 1705–1715. [DOI] [PMC free article] [PubMed] [Google Scholar]
- [45].Metzler B, Gfeller P, Guinet E, Restricting glutamine or glutamine-dependent purine and pyrimidine syntheses promotes human T cells with high Foxp3 expression and regulatory properties, J. Immunol, 196 (2016) 3618–3630. [DOI] [PubMed] [Google Scholar]
- [46].Ueda Y, Saegusa J, Okano T, Sendo S, Yamada H, Nishimura K, Morinobu A, Additive effects of inhibiting both mTOR and glutamine metabolism on the arthritis in SKG mice, Sci. Rep, 9 (2019) 6374. [DOI] [PMC free article] [PubMed] [Google Scholar]
- [47].O'Neill LAJ, Kishton RJ, Rathmell J, A guide to immunometabolism for immunologists, Nat. Rev. Immunol, 16 (2016) 553–565. [DOI] [PMC free article] [PubMed] [Google Scholar]
- [48].Houten SM, Wanders RJA, A general introduction to the biochemistry of mitochondrial fatty acid β-oxidation, J. Inherit. Metab. Dis, 33 (2010) 469–477. [DOI] [PMC free article] [PubMed] [Google Scholar]
- [49].Yang G, Xia Y, Ren W, Glutamine metabolism in Th17/Treg cell fate: applications in Th17 cell-associated diseases, Science China. Life sciences, 64 (2021) 221–233. [DOI] [PubMed] [Google Scholar]
- [50].Liu T, Khanna KM, Chen X, Fink DJ, Hendricks RL, CD8(+) T cells can block herpes simplex virus type 1 (HSV-1) reactivation from latency in sensory neurons, J. Exp. Med, 191 (2000) 1459–1466. [DOI] [PMC free article] [PubMed] [Google Scholar]
- [51].Nash AA, T cells and the regulation of herpes simplex virus latency and reactivation, J. Exp. Med, 191 (2000) 1455–1458. [DOI] [PMC free article] [PubMed] [Google Scholar]
- [52].Al-Dujaili LJ, Clerkin PP, Clement C, McFerrin HE, Bhattacharjee PS, Varnell ED, Kaufman HE, Hill JM, Ocular herpes simplex virus: how are latency, reactivation, recurrent disease and therapy interrelated?, Future Microbiol., 6 (2011) 877–907. [DOI] [PMC free article] [PubMed] [Google Scholar]
- [53].Leone RD, Zhao L, Englert JM, Sun I-M, Oh M-H, Sun I-H, Arwood ML, Bettencourt IA, Patel CH, Wen J, Tam A, Blosser RL, Prchalova E, Alt J, Rais R, Slusher BS, Powell JD, Glutamine blockade induces divergent metabolic programs to overcome tumor immune evasion, Science, 366 (2019) 1013–1021. [DOI] [PMC free article] [PubMed] [Google Scholar]
- [54].Jin H, Wang S, Zaal EA, Wang C, Wu H, Bosma A, Jochems F, Isima N, Jin G, Lieftink C, Beijersbergen R, Berkers CR, Qin W, Bernards R, A powerful drug combination strategy targeting glutamine addiction for the treatment of human liver cancer, eLife, 9 (2020). [DOI] [PMC free article] [PubMed] [Google Scholar]
- [55].Berber E, Sumbria D, Newkirk KM, Rouse BT, Inhibiting glucose metabolism results in herpes simplex encephalitis, J Immunol, 207 (2021) 1824–1835. [DOI] [PMC free article] [PubMed] [Google Scholar]
Associated Data
This section collects any data citations, data availability statements, or supplementary materials included in this article.


