Abstract
Objective: To observe the effects of Diane-35 and pioglitazone on endocrine, blood lipid, and blood glucose metabolism in patients with polycystic ovary syndrome (PCOS). Methods: 70 PCOS patients were selected as subjects between January 2019 and January 2020 and were randomized into two groups. The control group was provided with Diane-35 for 1 tablet/day. The patients in the observation group took additional pioglitazone twice a day. The therapeutic effect of the two schemes was analyzed by observing hormone, blood lipid, and blood glucose levels. The body mass index (BMI), waist-hip ratio (WHR), and Ferriman-Gallwey score (F-G) of the two groups of patients at different time points were compared. Results: Compared with the control group, after pioglitazone treatment, a significant decrease was observed in the levels of various hormone factors. In the observation group (all P<0.01) and the observation group yielded lower levels of fasting blood glucose (FBG), fasting insulin (FIN), Homeostatic Model Assessment for Insulin Resistance (Homa IR), and Homeostatic Model Assessment for β-cell function (Homa B), as compared to the control group (all P<0.01). Additionally, compared with the control group, the high-density lipoprotein (HDL) levels in the observation group saw a spike (P<0.01). The low-density lipoprotein (LDL) levels witnessed a downturn (P<0.01). Immediately after treatment and 1 month after treatment, the BMI, WHR, and F-G scores of the two groups declined gradually, with lower WHR and F-G scores of the observation group than those of the control group (P<0.01). Conclusion: Diane-35 and pioglitazone can effectively improve the symptoms of sex hormone secretion, blood glucose, and blood lipid disorder in PCOS patients, which has high clinical application value.
Keywords: Diane-35, pioglitazone, polycystic ovary syndrome, sex hormone, blood glucose and lipids
Introduction
Polycystic ovary syndrome (PCOS) is a gynecological disease with an increasing incidence in recent years [1-3]. Due to the imbalance of hormone secretion, PCOS patients are often accompanied by various clinical symptoms such as obesity, hirsutism, and menstrual cycle disorders, which jeopardize the daily activities of the patients [4-6]. In addition, studies have pointed out a higher incidence of various gynecological diseases such as diabetes and hypertension in PCOS patients than healthy individuals [7,8]. PCOS, the main cause of female infertility worldwide, has captured researchers’ attention with its multi-system features, instead of being simply regarded as an ovarian disease. It is closely related to metabolic disorders and hypothalamic-pituitary-ovarian axis (HPOA) dysfunction. The syndrome can lead to hyperandrogenemia (HA), hyperinsulinemia/insulin resistance (IR), ratio imbalance of estrogen (E2), luteinizing hormone (LH), and follicle-stimulating hormone (FSH), infertility, cardiovascular disease, endometrial dysfunction, and obesity. In addition, interventions such as metformin, orlistat, hormonal contraceptives, GLP1 agonists, and vitamin D have been used to improve or reverse the pathological features of polycystic ovary syndrome, and the combination of drugs to treat PCOS is better than monotherapy [9-11]. Accordingly, it is of great significance to take effective clinical interventions for PCOS. This study used the Diane-35 plus pioglitazone to treat PCOS patients, with an aim to observe the effect of this regimen and provide a reference for the treatment of PCOS.
Materials and methods
General information
This study was authorized by the hospital ethics committee. Over a period of January 2019 to January 2020, 70 PCOS patients were selected as the research objects and were randomly divided into a control group and an observation group. This study strictly complied with the standards of the ethics committee with the ethics committee number of 2018-11-15. https://clinicaltrials.gov/, ClinicalTrials.gov Identifier: NCT04508644.
Patient screening criteria
Inclusion criteria: (1) Those with completed clinical data and definite disease history; (2) Those diagnosed with PCOS and exhibited overt clinical manifestations; (3) Those who voluntarily participated in the study (The patients and their family had a full understanding of the study); (4) Those who were conscious and signed an informed consent form accompanied by their families; (5) Those with no potential diseases that seriously affected the results of this study.
Exclusion criteria: patients (1) with abnormal adrenal or thyroid function; (2) with other potential chronic diseases; (3) who did not cooperate with follow-up after the clinical intervention.
Treatment methods
Control group: Patients in the control group took Diane-35 (Hubei Gedian Renfu Pharmaceutical Co., Ltd., H20056637) daily at a dose of 1 tablet/day, with 20 days as a course of treatment. The medication was continued on day 5 of menstruation after stopping the medication. The treatment continued for 5 courses.
Observation group: Patients in the observation group received additional pioglitazone (Sino-American Shanghai Squibb Pharmaceutical Co., Ltd., H20023370) based on the regimen of the control group. The patient took 2 tablets once, 2 times a day for 6 months.
Indicators observation
The changes in the levels of hormones, blood sugar, and blood lipids before and after treatment were detected. Hormonal indicators included LH, FSH, E2, and testosterone (TT). Insulin resistance indicators: fasting insulin (FIN) was measured by the chemiluminescence method. Fasting blood glucose (FBG) was measured by the glucose oxidase method. The insulin resistance index (Homeostatic Model Assessment for Insulin Resistance (Homa IR) = FIN × FBS/22.5) and the insulin secretion index [Homeostatic Model Assessment for β-cell function (Homa B) = 20 × FIN/(FBS-3.5)] with the steady-state model (Homa mode1) were calculated to comprehensively evaluate the degree of insulin resistance in peripheral tissues. Blood lipid indicators include cholesterol (CHO), triacylglycerol (TG), low density lipoprotein (LDL), and high density lipoprotein (HDL). BMI, WHR, and F-G of the two groups of patients at different time points were compared.
Data analysis
The data in this study were processed using SPSS 20.0. The count data were expressed as number (n, %) and tested using χ2, and the measurement data was tested using t-test and displayed in the form of (mean ± standard deviation). P<0.05 indicated that there were statistical differences between the groups.
Results
Comparison of general information
The two groups witnessed no great disparity in general information, as shown in Table 1 (P>0.05).
Table 1.
Comparison of general data
| Groups | Age (years) | BMI | waist-hip ratio | Course of disease (years) | Body weight (Kg) |
|---|---|---|---|---|---|
| Control group | 28.05±6.96 | 26.41±1.09 | 0.86±0.07 | 3.15±3.21 | 55.32±6.92 |
| Observation group | 27.93±7.27 | 26.27±1.23 | 0.85±0.05 | 3.21±3.29 | 55.11±7.22 |
| t | 0.07 | 0.50 | 0.69 | 0.50 | 0.10 |
| P | P>0.05 | P>0.05 | P>0.05 | P>0.05 | P>0.05 |
Comparison of hormone levels
The sex hormone levels of the two groups are shown in Tables 2 and 3. After treatment, the levels of LH and E2 in the control group showed a significant decrease (P<0.01). The levels of FSH and TT did not change significantly (P>0.05). The levels of four hormones in the observation group after treatment all saw a slump (P<0.01). After taking pioglitazone, the levels of the four hormones in the observation group witnessed a greater decline than the control group (P<0.01).
Table 2.
Comparison of LH and FSH Levels between two groups of patients
| LH (U/L) | FSH (U/L) | |||
|---|---|---|---|---|
|
|
|
|||
| Control group | Observation group | Control group | Observation group | |
| Before treatment | 13.92±2.21 | 13.89±2.07 | 6.71±1.31 | 6.67±1.25 |
| After treatment | 11.96±2.17 | 7.32±1.09a | 6.49±1.46 | 4.09±1.12b |
| t | 3.74 | 16.61 | 0.66 | 9.09 |
| P | <0.01 | <0.01 | 0.51 | <0.01 |
Note: a and b indicate a significant difference between the two groups in hormones before and after treatment (a: t = 11.30, P<0.01; b: t = 7.72, P<0.01).
Table 3.
Comparison of TT and E2 levels between the two groups
| TT (nmol/L) | E2 (pmol/L) | |||
|---|---|---|---|---|
|
|
|
|||
| Control group | Observation group | Control group | Observation group | |
| Before treatment | 2.39±0.49 | 1.73±0.21 | 123.96±6.10 | 121.72±5.00 |
| After treatment | 2.37±0.43 | 1.22±0.11a | 124.12±6.09 | 109.97±5.09b |
| t | 7.32 | 15.33 | 1.68 | 10.55 |
| P | <0.01 | <0.01 | 0.10 | <0.01 |
Note: a and b indicate a significant difference in hormones between the two groups before and after treatment (a: t = 12.73, P<0.01; b: t = 9.74, P<0.01).
Comparison of insulin-related indicators
Before treatment, the two groups did not present statistical difference with regard to FBG, FIN, Homa IR, and Homa B (P>0.05). After treatment, all indicators in the control group remained at the same level (P>0.05). The above indicators all down-regulated in patients of the observation group (P<0.05). See Table 4.
Table 4.
Comparison of FBG, FIN, Homa IR, and Homa B between the two groups
| Group | Time | FBS (mmol/L) | FIN (mIU/L/) | Homa IR | Homa B |
|---|---|---|---|---|---|
| control group | before treatment | 5.27±0.52 | 23.95±6.12 | 1.68±0.34 | 5.96±0.47 |
| after treatment | 5.17±0.57 | 21.89±5.27 | 1.61±0.29 | 5.91±0.44 | |
| t | 1.456 | 2.556 | 3.758 | 1.478 | |
| P | 0.423 | 0.756 | 0.365 | 0.345 | |
| Observation group | before treatment | 5.24±0.49 | 24.04±6.09 | 1.67±0.31 | 5.89±0.41 |
| after treatment | 4.54±0.56a | 13.27±4.1b | 1.23±0.26c | 5.40±0.61d | |
| t | 1.781 | 3.967 | 2.578 | 1.456 | |
| P | 0.002 | 0.001 | 0.014 | 0.003 |
Note: a, b, c, d indicate a significant difference between the two groups after treatment (a: t = 11.73, P<0.01; b: t = 8.94, P<0.01; c: t = 7.64, P<0.01; d: t = 6.74, P<0.01).
Comparison of CHO and TG levels
The CHO and TG levels of the two groups of patients before and after treatment are shown in Figure 1. After treatment, the level of TG in the control group decreased (P<0.01), and no marked change was identified in the level of CHO, while both indicators decreased significantly in the observation group (P<0.01). After taking pioglitazone, the levels of TG and CHO in the observation group were noticeably lower than those in the control group (P<0.01).
Figure 1.
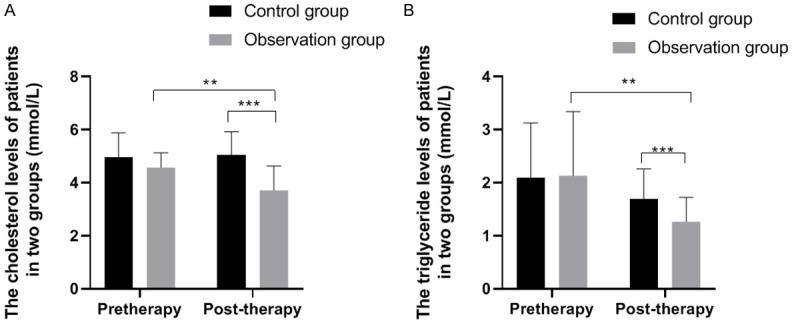
Comparison of CHO and TG levels between the two groups. Note: X: Treatment time. Y: (A) CHO level; (B) TG level. (A) The CHO levels of the control group before and after treatment were (4.97±0.91 mmol/L) and (5.03±0.89 mmol/L), while the CHO levels of the observation group before and after treatment were (4.57±0.55 mmol/L) and (3.71±0.91 mmol/L). ** and *** respectively indicate that the CHO levels of the observation group before and after treatment and between the two groups after treatment were significantly different (*: t = 4.78, P<0.01; **: t = 6.14, P<0.01). (B) The TG levels of the control group before and after treatment were (2.09±1.03 mmol/L) and (1.69±0.57 mmol/L), while the TG levels of the observation group before and after treatment were (2.13±1.21 mmol/L) and (1.26±0.46 mmol/L). ** and *** respectively indicate that the TG levels of the observation group before and after treatment and between the two groups after treatment were significantly different (*: t = 3.98, P<0.01; **: t = 3.47, P<0.01).
Comparison of HDL and LDL levels
The HDL and LDL levels of the two groups of patients before and after treatment are shown in Figure 2. After treatment, the level of LDL in the control group declined dramatically (P<0.01), and no significant change was noticed in HDL. The LDL level was significantly decreased. HDL was significantly increased in the observation group (all P<0.01). After taking pioglitazone, LDL level was significantly lower. HDL was significantly higher in the observation group than those in the control group (all P<0.01).
Figure 2.
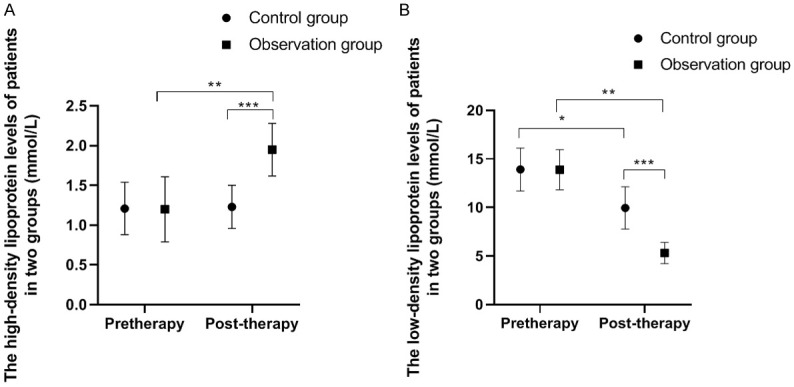
Comparison of HDL and LDL levels between the two groups. Note: X: Treatment time. Y: (A) Patient’s HDL level; (B) Patient’s LDL level. (A) The HDL levels of the control group before and after treatment were (1.21±0.33 mmol/L) and (1.23±0.27 mmol/L), while the HDL levels of the observation group before and after treatment were (1.20±0.41 mmol/L) and (1.95±0.33 mmol/L). There were significant differences in HDL levels in the observation group before and after treatment and between the two groups after treatment (t = 8.43, **P<0.01; t = 9.99, ***P<0.001). (B) The LDL levels of the control group before and after treatment were (13.29±2.21 mmol/L) and (9.96±2.17 mmol/L), while the LDL levels of the observation group before and after treatment were (13.89±2.07 mmol/L) and (5.32±1.09 mmol/L). The LDL levels of the observation group before and after treatment and between the two groups after treatment were significantly different (t = 24.62, *P<0.05; t = 21.67, **P<0.01; t = 11.30, ***P<0.001).
BMI comparison
Figure 3 presented that BMI after treatment in both groups saw a trend of decrease (P<0.01). No evidence of statistical differences was found between the two groups before and after treatment (P>0.05).
Figure 3.
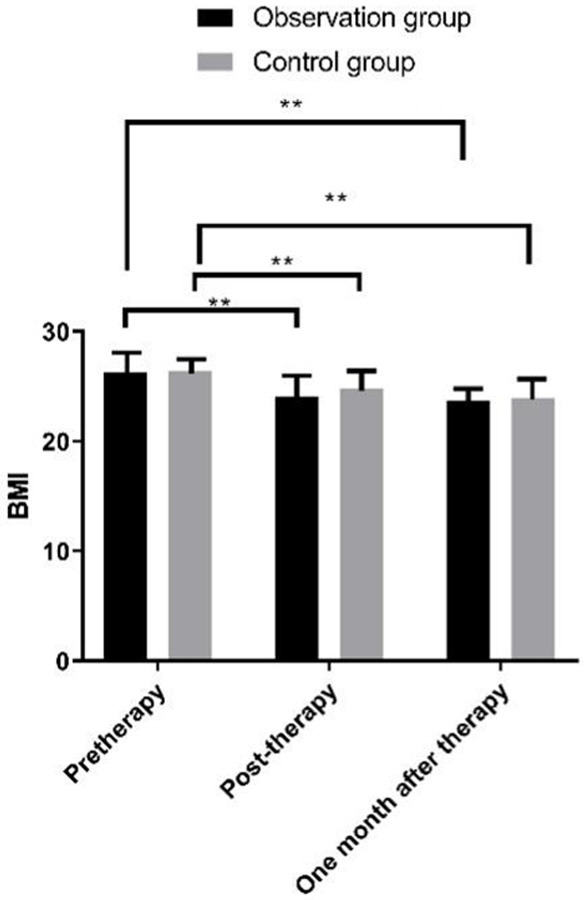
Comparison of BMI between the two groups of patients at different time points. Note: X: Treatment time. Y: BMI. After treatment, the BMI of observation group patients was (24.1±4.5) kg/m2 lower than that before treatment (26.27±1.23) kg/m2 (t = 1.357, **P<0.01); The BMI of the control group patients was (24.8±4.6) kg/m2 lower than before treatment (26.41±1.09) kg/m2 (t = 3.347, **P<0.01); One month after surgery, the BMI of the observation group patients was (23.3±2.5) kg/m2 lower than that before treatment (26.27±1.23) kg/m2 (t = 5.677, **P<0.01); The BMI of the control group patients was (23.9±4.6) kg/m2 lower than that before treatment (26.41±1.09) kg/m2 (t = 5.167, **P<0.01); There was no significant difference between the two groups before and after treatment (t = 7.548, 4.369, 4.555, P = 0.751, 0.548, 0.478).
WHR comparison
Immediately after treatment and 1 month after treatment, Figure 4 displays a lower WHR level of the two groups than that before treatment, in which the observation group garnered a lower WHR level than that of the control group (P<0.01).
Figure 4.
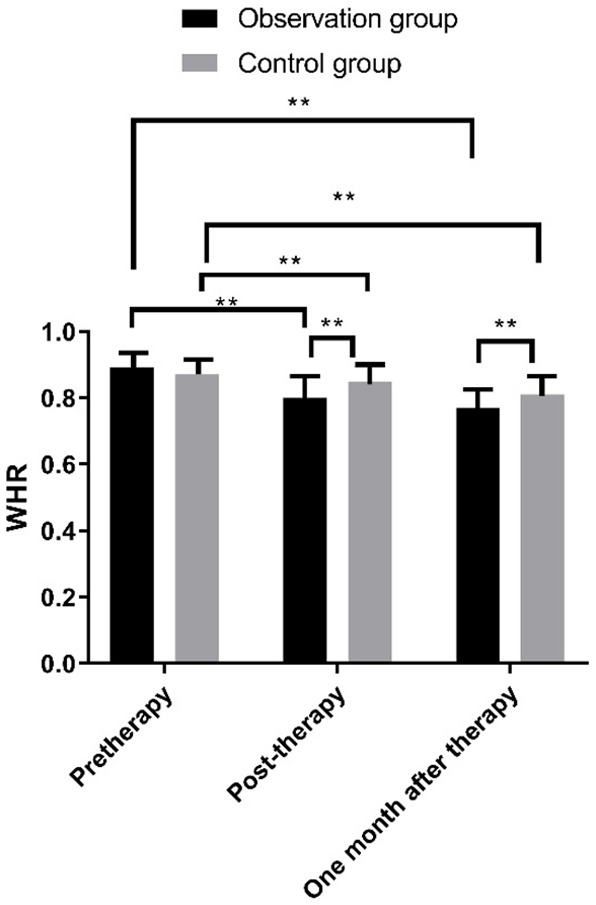
Comparison of WHR between the two groups of patients at different time points. Note: X: Treatment time. Y: WHR. After treatment, the WHR of the observation group patients was (0.80±0.11) lower than before treatment (0.89±0.12) (t = 2.547, **P<0.01); The WHR of the control group patients was (0.85±0.13) lower than before treatment (0.87±0.14) (t = 4.584, **P<0.01); One month after treatment, the WHR of the observation group patients was (0.73±0.08) lower than before treatment (0.89±0.12) (t = 2.747, **P<0.01); The WHR of the control group patients was (0.79±0.23) lower than before treatment (0.87±0.14) (t = 5.640, **P<0.01); Immediately after treatment and 1 month after treatment, the WHR of the observation group patients was lower than that of the control group patients (t = 7.478, 8.639, **P<0.01).
F-G score comparison
Immediately after treatment and 1 month after treatment, the F-G scores of the two groups of patients showed a clear trend of decline, with lower F-G scores of the observation group than those of the control group (P<0.01). See Figure 5.
Figure 5.
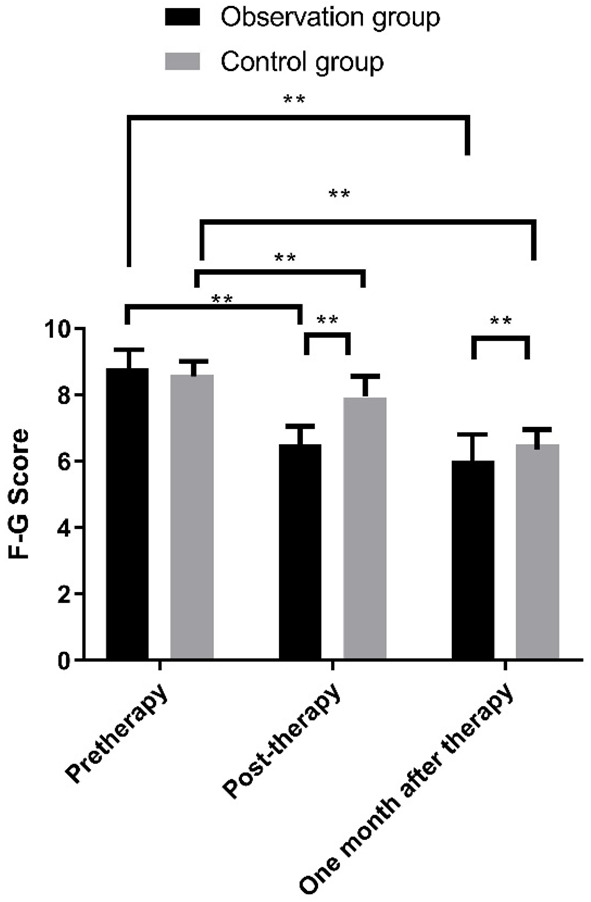
Comparison of F-C scores between the two groups of patients at different time points. Note: X: Treatment time. Y: F-C score. After treatment, the WHR of the observation group patients was (6.5±2.9) lower than that before treatment (8.8±3.5) (t = 3.517, **P<0.01); The WHR of the control group patients was (7.9±3.1) lower than before treatment (8.6±3.4) (t = 4.447, **P<0.01); One month after treatment, the WHR of the observation group patients was (6.0±1.9) lower than before treatment (8.8±3.5) (t = 2.517, **P<0.01); The WHR of the control group patients was (6.5±3.1) lower than before treatment (8.6±3.4) (t = 2.347, **P<0.01); Immediately after treatment and 1 month after treatment, the WHR of observation group patients was lower than that of Control group patients (t = 6.378, **P<0.01).
Discussion
PCOS is a high-incidence gynecological disease that can cause various complications such as diabetes and hypertension, which seriously takes a toll on women’s life and health [11,12]. Currently, anti-androgen drugs such as Diane-35 are used to treat PCOS to drive down the level of male hormones in the body to alleviate the patient’s symptoms and maintain their normal physiological activities [13-15]. Some critically ill patients usually exhibit symptoms such as dyslipidemia and aberrant blood sugar levels. It is formidable to substantially relieve their symptoms through mere anti-androgen therapy.
In this study, after treatment with Diane-35, the secretion level of some hormones such as TT in the patient’s body was significantly improved. The disorder of blood glucose and blood lipids showed no prominent mitigation. In the process of clinical intervention for patients, in addition to a single anti-androgen therapy, treatments for lowering blood sugar and blood lipids are imperative for such conditions. Pioglitazone is a biguanide drug that can lower blood sugar by delaying the absorption of glucose by the stomach and intestines [16,17]. This study compared patients receiving single Diane-35 treatment and patients taking additional pioglitazone. It showed different degrees of optimization in blood glucose and blood lipid levels 1 month after treatment. This showed that additional treatment with pioglitazone yields a positive effect on the improvement of the patient’s internal environment. Studies have pointed out that pioglitazone can increase the sensitivity of adenosyl cyclase to insulin and drive down glucose synthesis by inhibiting liver gluconeogenesis, effectively lowering the patient’s body’s resistance to insulin [18]. We observed that 1 month after treatment with pioglitazone, the insulin level in the patient showed a remarkable improvement. The weakening of insulin resistance suggested that only a smaller amount of insulin is needed in the body to stabilize the patient’s blood sugar level. This also plays a positive role in improving the patient’s overall internal environment. Our study revealed that compared with patients receiving single Diane-35 treatment, patients who took pioglitazone concurrently witnessed a remarkable improvement in the secretion of E2 and FSH and other sex hormones. Immediately after treatment and 1 month after treatment, the BMI, WHR, and F-G scores of the two groups decreased drastically compared with those before treatment. The observation group obtained lower WHR and F-G scores than the control group (P<0.01). It indicated that pioglitazone can not only maintain the patient’s blood sugar stability but also played a positive role in controlling the patient’s level of sex hormone secretion. In addition, Fonseka et al. [19-21] found that Diane-35 combined with pioglitazone can effectively improve the endocrine and blood sugar level of patients, and enjoy a satisfactory effect on PCOS. Cui et al. [20] also revealed that pioglitazone has a very significant effect on the treatment of PCOS. These studies confirmed the conclusions of this study. Diane-35 is an oral contraceptive that inhibits the secretion of LH, increases SHBG levels, reduces androgen secretion, blocks the response of peripheral target organs to androgens, lowers its biological effects, and achieves the purpose of treatment [22]. Studies have shown that Diane-35 may produce gastrointestinal discomforts such as nausea and vomiting. It can also lead to decreased insulin sensitivity, weight gain, and aggravation of obesity. Pioglitazone is widely recognized for correcting the IR of PCOS patients, improving the success rate of ovulation and the glucose balance disorder in the body. Concurrently it can predominantly make up for the deficiency of Diane-35 while enhancing the efficacy [23].
In summary, DIANE-35 combined with pioglitazone can effectively improve the symptoms of PCOS patients such as sex hormone secretion disorders and blood glucose and blood lipid disorders, and play a positive role in the rehabilitation of patients, which has high clinical applications value.
Disclosure of conflict of interest
None.
References
- 1.Kyrou I, Karteris E, Robbins T, Chatha K, Drenos F, Randeva HS. Polycystic ovary syndrome (PCOS) and COVID-19: an overlooked female patient population at potentially higher risk during the COVID-19 pandemic. BMC Med. 2020;18:220. doi: 10.1186/s12916-020-01697-5. [DOI] [PMC free article] [PubMed] [Google Scholar]
- 2.Özkan S, Yılmaz ÖÇ, Yavuz B. Increased masked hypertension prevalence in patients with polycystic ovary syndrome (PCOS) Clin Exp Hypertens. 2020;42:681–684. doi: 10.1080/10641963.2020.1772815. [DOI] [PubMed] [Google Scholar]
- 3.Ganie MA, Rashid A, Sahu D, Nisar S, Wani IA, Khan J. Prevalence of polycystic ovary syndrome (PCOS) among reproductive age women from Kashmir valley: a cross-sectional study. Int J Gynaecol Obstet. 2020;149:231–236. doi: 10.1002/ijgo.13125. [DOI] [PubMed] [Google Scholar]
- 4.Ntumy M, Maya E, Lizneva D, Adanu R, Azziz R. The pressing need for standardization in epidemiologic studies of PCOS across the globe. Gynecol Endocrinol. 2019;35:1–3. doi: 10.1080/09513590.2018.1488958. [DOI] [PubMed] [Google Scholar]
- 5.Ollila MM, West S, Keinänen-Kiukaaniemi S, Jokelainen J, Auvinen J, Puukka K, Ruokonen A, Järvelin MR, Tapanainen JS, Franks S, Piltonen TT, Morin-Papunen LC. Overweight and obese but not normal weight women with PCOS are at increased risk of type 2 diabetes mellitus-a prospective population-based cohort study. Hum Reprod. 2017;32:968. doi: 10.1093/humrep/dex030. [DOI] [PMC free article] [PubMed] [Google Scholar]
- 6.Liu J, Ding J, Qu B, Liu J, Song X, Suo Q, Zhou A, Yang J. CircPSMC3 alleviates the symptoms of PCOS by sponging miR-296-3p and regulating PTEN expression. J Cell Mol Med. 2020;24:11001–11011. doi: 10.1111/jcmm.15747. [DOI] [PMC free article] [PubMed] [Google Scholar]
- 7.Wojciechowska A, Osowski A, Jóźwik M, Górecki R, Rynkiewicz A, Wojtkiewicz J. Inositols’ importance in the improvement of the endocrine-metabolic profile in PCOS. Int J Mol Sci. 2019;20:5787. doi: 10.3390/ijms20225787. [DOI] [PMC free article] [PubMed] [Google Scholar]
- 8.Ruan X, Song J, Gu M, Wang L, Wang H, Mueck AO. Effect of Diane-35, alone or in combination with orlistat or metformin in Chinese polycystic ovary syndrome patients. Arch Gynecol Obstet. 2018;297:1557–1563. doi: 10.1007/s00404-018-4762-0. [DOI] [PubMed] [Google Scholar]
- 9.Condorelli RA, Calogero AE, Di Mauro M, La Vignera S. PCOS and diabetes mellitus: from insulin resistance to altered beta pancreatic function, a link in evolution. Gynecol Endocrinol. 2017;33:665–667. doi: 10.1080/09513590.2017.1342240. [DOI] [PubMed] [Google Scholar]
- 10.Wekker V, van Dammen L, Koning A, Heida KY, Painter RC, Limpens J, Laven JSE, Roeters van Lennep JE, Roseboom TJ, Hoek A. Long-term cardiometabolic disease risk in women with PCOS: a systematic review and meta-analysis. Hum Reprod Update. 2020;26:942–960. doi: 10.1093/humupd/dmaa029. [DOI] [PMC free article] [PubMed] [Google Scholar]
- 11.Li Y, Chen C, Ma Y, Xiao J, Luo G, Li Y, Wu D. Multi-system reproductive metabolic disorder: significance for the pathogenesis and therapy of polycystic ovary syndrome (PCOS) Life Sci. 2019;228:167–175. doi: 10.1016/j.lfs.2019.04.046. [DOI] [PubMed] [Google Scholar]
- 12.Kupreeva M, Diane A, Lehner R, Watts R, Ghosh M, Proctor S, Vine D. Effect of pioglitazone and flutamide on insulin, lipogenic and androgen-estrogen signaling, and cardiometabolic risk in a PCOS-prone metabolic syndrome rodent model. Am J Physiol Endocrinol Metab. 2019;316:E16–E33. doi: 10.1152/ajpendo.00018.2018. [DOI] [PMC free article] [PubMed] [Google Scholar]
- 13.Scarinci E, Tropea A, Russo G, Notaristefano G, Messana C, Alesiani O, Fabozzi SM, Lanzone A, Apa R. Increased fibulin-1 plasma levels in polycystic ovary syndrome (PCOS) patients: possible contribution to the link between PCOS and cardiovascular risk. J Endocrinol Invest. 2019;42:91–96. doi: 10.1007/s40618-018-0891-3. [DOI] [PubMed] [Google Scholar]
- 14.Ruan X, Kubba A, Aguilar A, Mueck AO. Use of cyproterone acetate/ethinylestradiol in polycystic ovary syndrome: rationale and practical aspects. Eur J Contracept Reprod Health Care. 2017;22:183–190. doi: 10.1080/13625187.2017.1317735. [DOI] [PubMed] [Google Scholar]
- 15.Bitzer J, Römer T, Lopes da Silva Filho A. The use of cyproterone acetate/ethinyl estradiol in hyperandrogenic skin symptoms - a review. Eur J Contracept Reprod Health Care. 2017;22:172–182. doi: 10.1080/13625187.2017.1317339. [DOI] [PubMed] [Google Scholar]
- 16.Behboudi-Gandevani S, Abtahi H, Saadat N, Tohidi M, Ramezani Tehrani F. Effect of phlebotomy versus oral contraceptives containing cyproterone acetate on the clinical and biochemical parameters in women with polycystic ovary syndrome: a randomized controlled trial. J Ovarian Res. 2019;12:78. doi: 10.1186/s13048-019-0554-9. [DOI] [PMC free article] [PubMed] [Google Scholar]
- 17.Li X, Wang X, Snyder MP. Pioglitazone affects heme function as a possible mechanism of action. G3 (Bethesda) 2019;9:513–522. doi: 10.1534/g3.118.200803. [DOI] [PMC free article] [PubMed] [Google Scholar]
- 18.Feng W, Jia YY, Zhang DY, Shi HR. Management of polycystic ovarian syndrome with Diane-35 or Diane-35 plus metformin. Gynecol Endocrinol. 2016;32:147–150. doi: 10.3109/09513590.2015.1101441. [DOI] [PubMed] [Google Scholar]
- 19.Furat Rencber S, Kurnaz Ozbek S, Eraldemır C, Sezer Z, Kum T, Ceylan S, Guzel E. Effect of resveratrol and pioglitazone on ovarian reserve and ultrastructure in PCOS: an experimental study. J Ovarian Res. 2018;11:55. doi: 10.1186/s13048-018-0427-7. [DOI] [PMC free article] [PubMed] [Google Scholar]
- 20.Fonseka S, Wijeyaratne CN, Gawarammana IB, Kalupahana NS, Rosairo S, Ratnatunga N, Kumarasiri R. Effectiveness of low-dose ethinylestradiol/cyproterone acetate and ethinylestradiol/desogestrel with and without pioglitazone on hirsutism in polycystic ovary syndrome: a randomized, double-blind, triple-dummy study. J Clin Aesthet Dermatol. 2020;13:18–23. [PMC free article] [PubMed] [Google Scholar]
- 21.Cui N, Feng X, Zhao Z, Zhang J, Xu Y, Wang L, Hao G. Restored plasma anandamide and endometrial expression of fatty acid amide hydrolase in women with polycystic ovary syndrome by the combination use of Diane-35 and pioglitazone. Clin Ther. 2017;39:751–758. doi: 10.1016/j.clinthera.2017.02.007. [DOI] [PubMed] [Google Scholar]
- 22.Ruan X, Song J, Gu M, Wang L, Wang H, Mueck AO. Effect of Diane-35, alone or in combination with orlistat or metformin in Chinese polycystic ovary syndrome patients. Arch Gynecol Obstet. 2018;297:1557–1563. doi: 10.1007/s00404-018-4762-0. [DOI] [PubMed] [Google Scholar]
- 23.Morley LC, Tang T, Yasmin E, Norman RJ, Balen AH. Insulin-sensitising drugs (metformin, rosiglitazone, pioglitazone, D-chiro-inositol) for women with polycystic ovary syndrome, oligo amenorrhoea and subfertility. Cochrane Database Syst Rev. 2017;11:CD003053. doi: 10.1002/14651858.CD003053.pub6. [DOI] [PMC free article] [PubMed] [Google Scholar]


