

Abstract
Early in the COVID‐19 pandemic, people living in cities were much more likely than rural residents to become infected with and die from the virus. Beginning in the summer of 2020, however, the proportional increase in virus spread became much greater in rural areas. By March 2021, per capita cases and deaths were greater in nonmetro than in metro areas. Multi‐variate regression analysis found that political views were the most important variable explaining per capita COVID‐19 cases, while measures of disadvantage were the best predictors of COVID‐19 deaths. Counties with high proportions of Trump voters had higher per capita cases, and in nonmetro areas, these counties had higher death rates. Overall, the best predictor of COVID‐19 death rates is low levels of educational attainment, high poverty rates, and high minority populations.
Introduction
The first human cases of COVID‐19 (SARS‐CoV‐2) were identified in Wuhan, China in December 2019 (Wu et al. 2020). From there, the disease spread around the world. The first known case in the United States was in January 2020 (Schuchat et al. 2020). By March 2020, COVID‐19 cases were found throughout the country (Lewis 2021; Omer et al. 2020). A year later in March 2021, more than 28 million Americans were known to have contracted the disease and over half a million Americans had died. The economic impacts have been devastating for some segments of the population. Understanding the health, economic, social, and many other impacts of this pandemic is one of the more important endeavors of our time. This manuscript seeks to contribute to this understanding by exploring factors related to COVID‐19 cases and deaths in nonmetro compared with metro areas in the United States.
As COVID‐19 spread, it quickly became obvious that some segments of the population were more at risk than others. Residence was clearly an important early risk factor. During the early months of the pandemic, data showed that residents of cities, especially large cities, were much more likely to test positive for and die from the virus than residents of rural areas (Rocklöv and Sjödin 2020). Metropolitan areas are home to travelers who may have brought the disease from elsewhere. In cities, people live and work in close proximity to one another and are more dependent upon mass transit, all of which make social distancing more difficult. These circumstances provide prime conditions for the virus to spread. In contrast, in rural areas, there are fewer people, and these people are more widely dispersed, making it easier for people to remain apart slowing virus spread. Thus, on May 1, 2020, calculations of data shown in Table 2 indicate that 94.3 percent of the known cases and 94.8 percent of deaths from COVID‐19 occurred in metropolitan counties, even though only 86 percent of the nation's residents lived in these metro counties. A majority of these cases and deaths were in the nation's very largest cities. By contrast, on May 1, 2020, only 107 of the 643 (17 percent) most rural counties had 10 or more known cases, and in 276 rural counties, there were no cases at all. In more than 1,300 rural counties, there were no COVID‐19 deaths.
Table 2.
Overview of Variables Used in the Analysis Along the Rural/Urban Continuum (N = 3,112).
| 1 | 2 | 3 | 4 | 5 | 6 | 7 | 8 | 9 | Total | |
|---|---|---|---|---|---|---|---|---|---|---|
| COVID‐19 on May 1, 2020 | ||||||||||
| Total cases | 853,181 | 131,829 | 50,937 | 20,736 | 7,572 | 20,571 | 9,582 | 3,212 | 1,930 | 1,097,620 |
| Cases per 100,000 | 468 | 188 | 172 | 152 | 128 | 141 | 118 | 152 | 76 | 334 |
| Share of total | 77.7 | 12.0 | 4.6 | 1.9 | 0.7 | 1.8 | 0.8 | 0.3 | 0.2 | 100 |
| Total deaths | 35,319 | 6,903 | 1,911 | 735 | 221 | 982 | 348 | 74 | 59 | 46,552 |
| Deaths per 100,000 | 19.4 | 9.8 | 6.5 | 5.5 | 4.4 | 6.7 | 4.3 | 3.5 | 2.3 | 14.2 |
| Share of total | 75.9 | 14.8 | 4.1 | 1.6 | 0.5 | 2.1 | 0.7 | 0.2 | 0.1 | 100 |
| COVID‐19 on March 1, 2021 | ||||||||||
| Total cases | 15,660,027 | 5,942,529 | 2,631,632 | 1,181,938 | 455,535 | 1,341,041 | 737,336 | 176,037 | 221,387 | 28,347,462 |
| Cases per 100,000 | 8,585 | 8,471 | 8,886 | 8,678 | 9,038 | 9163 | 9,109 | 8,301 | 8,703 | 8,636 |
| Share of total | 55.2 | 21.0 | 9.3 | 4.2 | 1.6 | 4.7 | 2.6 | 0.6 | 0.8 | 100.0 |
| Total deaths | 273,158 | 100,698 | 46,197 | 22,268 | 8,045 | 28,029 | 14,318 | 3,696 | 4,477 | 500,886 |
| Deaths per 100,000 | 149.8 | 143.5 | 156.0 | 163.5 | 159.6 | 191.5 | 176.9 | 174.3 | 176.0 | 152.6 |
| Share of total | 54.5 | 20.1 | 9.2 | 4.4 | 1.6 | 5.6 | 3.0 | 0.7 | 0.9 | 100.0 |
| Median score by county for other variables | ||||||||||
| Percent voting for Trump | 54.2 | 59.9 | 63.2 | 63.3 | 63.2 | 69.6 | 70.4 | 70.8 | 77.0 | 66.1 |
| Percent employed in high‐risk industries | 42.2 | 45.3 | 47.2 | 49.7 | 49.0 | 50.4 | 50.1 | 48.9 | 51.2 | 48.2 |
| Percent in poverty | 12.7 | 16.0 | 16.7 | 18.0 | 18.1 | 18.6 | 17.7 | 18.4 | 16.0 | 16.7 |
| Percent non‐Hispanic White | 71.7 | 74.5 | 78.0 | 78.1 | 73.2 | 77.3 | 77.9 | 80.5 | 83.1 | 77.3 |
| Percent Hispanic | 10.3 | 9.9 | 8.0 | 9.4 | 12.8 | 8.8 | 10.1 | 4.6 | 7.1 | 8.9 |
| Percent of person 25 or older with college degree | 28.6 | 23.6 | 22.3 | 20.3 | 22.4 | 15.9 | 18.1 | 16.2 | 18.1 | 20.4 |
During the summer of 2020, the relationship between residence and COVID‐19 began to change. From May 1 onward, per capita cases and deaths were increasing more rapidly in nonmetro than in metro counties. By March 1, 2021, per capita cases and deaths were greater in nonmetro counties than in metro counties. With COVID‐19, the nature of the disease had not changed significantly at that time nor did the structural safety advantages inherent with rural living. Thus, variations in disease spread must be attributed to behavioral differences of nonmetro compared with metro residents.
Understanding factors related to the spread of COVID‐19 in rural America is a question of utmost importance. Nonmetro America is home to about 46 million Americans, and by March 1, 2021, more than 80,000 rural Americans had died from COVID‐19. This is more than the number of Americans killed in 10 years of the Vietnam War and all U.S. wars since. COVID‐19 research on rural America, however, has been underrepresented (Mueller et al. 2021). Lack of rural research on COVID‐19 is troubling because rural residents have more preexisting health conditions and less access to quality health care (James 2014; Monnat and Pickett 2011), which makes the danger from COVID‐19 potentially more perilous for rural compared with urban populations once they contract the disease (Johnson 2020; Peters 2020).
The goal of this manuscript is to understand factors related to the rapid growth of COVID‐19 in nonmetro compared with metro U.S. counties by exploring counties along the rural/urban continuum as developed by USDA's Economic Research Service. The analysis is conducted using variables that could help understand this spread. A significant benefit of this manuscript is that actual data on COVID‐19 cases and deaths are utilized for nearly every county in the U.S, which allows comparisons all along the rural–urban continuum.
The manuscript also analyzes data for both COVID‐19 cases and deaths. The two are obviously related as death from the disease is dependent on first acquiring the disease. As of March 1, 2021, however, only 1.8 percent of persons who tested positive for the disease had died as a consequence. COVID‐19 is obviously much more dangerous for some segments of the population than others. Specifically, age is clearly a risk factor as the danger of the disease increases sharply as persons get older (Davies et al. 2020). Additionally, the disease is more serious for persons with underlying health conditions such as heart or respiratory disease or diabetes (Wortham 2020). Consequently, it may be possible that different variables are related to per capita cases compared with per capita deaths.
This manuscript continues with a discussion of the relationship between residence and COVID‐19. This will be followed by a discussion of variables that could be related to the spread of the virus by residence.
Residence and COVID‐19
COVID‐19 is spread when individuals come in close contact with one another (Greenhalgh et al. 2021). Consequently, all else equal, the reduced population density of rural America should result in rural residents having lower case and death rates from COVID‐19. The rapid increase in disease cases and deaths in rural areas during the summer and fall months of 2020 are expected to be explained by other variables which are described below and utilized in the data analysis. It is thus expected that when controlling for these other relevant variables, cases, and deaths from COVID‐19 will be lower as communities become progressively more rural and isolated.
Politics and COVID‐19
To prevent virus spread, health experts recommend washing hands, social distancing, and wearing masks while awaiting vaccination development. These approaches have been found to be effective in slowing disease spread (Gandhi et al. 2020; Lyu and Wehby 2020). Health experts have maintained that if people would simply wear a mask, thousands of lives could have been saved (IHME 2020). In response, some state and local governments implemented policies that included closing schools and businesses, requiring the wearing of masks, and encouraging people to work remotely when possible.
Almost from the outset, implementation of and adherence to these policies varied widely. A primary reason is that efforts to address the pandemic quickly became political (Hill et al. 2020b). This is relevant for this analysis because nonmetro residents are much more likely to vote Republican than their urban counterparts (Goetz et al. 2018; Monnat and Brown 2017; Scala and Johnson 2017). From the beginning of the pandemic, Democrats were much more likely than Republicans to take the threat of the virus seriously and to support efforts to control virus spread, whereas Republicans expressed greater concern for the economic and other impacts of health safety policies (Bruine de Bruin et al. 2020; Hamilton and Safford 2020). State and local governments under Republican control were less likely to implement restrictive policies (Hsiehchen et al. 2020). Early research found that counties with a higher share of Trump voters tended to have lower perceptions of the dangers of COVID‐19, and these perceptions led to riskier behavior (Barrios and Hochberg 2020). States with more Trump voters were more resistant to stay‐at‐home orders (Hill et al. 2020b). In more religious states, which tend to be more Republican, people were found to be more mobile during the pandemic despite recommendations to stay home (Hill et al. 2020a). Perry et al. (2020) found Christian Nationalism, which has strong ties to the Republican Party, was related to many of the far‐right responses to COVID‐19. Ulrich‐Schad et al. (2020) found much more resistance to mask wearing and social distancing in the heavily Republican rural areas of Utah compared to urban areas with more Democrat voters.
Political differences on views toward COVID‐19 started at the top. From the beginning, the severity of the pandemic was downplayed by President Trump. For example, on February 19, 2020, Trump maintained the disease would be eliminated by warmer spring weather. On February 27, Trump stated, “One day, it's like a miracle—it will disappear.” Trump resisted wearing a mask and held political rallies where thousands of people gathered, most not wearing masks (Wright 2021). Reacting to policies intended to slow disease spread, on April 17, 2020, Trump tweeted “Liberate Michigan” (Paz 2020).
Beyond the president, other political leaders and media outlets sent divergent messages on COVID‐19. Again, Republicans and right‐wing media tended to downplay the threat of the disease and express opposition to steps intended to prevent spread (Allcott et al. 2020). With support from Republican leaders and the right‐wing media, protests were held throughout the country in opposition to mask mandates and business and school closures. There was even an attempt by a group of right‐wing individuals to kidnap the Governor of Michigan after she implemented lockdown policies. In many communities, wearing a mask became a political statement with many Republicans arguing that mask mandates violated their individual freedoms. Antimask rallies were held in numerous communities. The pandemic became a major issue in the 2020 elections as Democrats tended to argue for greater safety measures to save lives, whereas Republicans were more likely to claim that safety measures were unnecessary and such measures would harm the economy.
Political differences in views about COVID‐19 are consistent with variations in attitudes on related issues. Research shows that Democrats consistently have greater trust in science than Republicans (Conway and Oreskes 2012; Gauchat 2012; Hamilton 2015; Hamilton et al. 2015; McCright et al 2013; Mooney 2007), and this trust extends to a wide variety of issues ranging from climate change (Dunlap and McCright 2008; Lachapelle and Albrecht 2019; Oreskes and Conway 2011) to evolution (Nadelson and Hardy 2015). This greater trust in science and health experts was found to extend to COVID‐19 (Evans and Hargitta 2020). With their greater tendency to trust science, it is not surprising that Democrats were more likely to accept the reality of a global health pandemic. For years, scientists and health experts had warned of potentially devastating impacts of a pandemic resulting from the emergence of a new disease for which humans have little or no resistance (e.g., Hatchett et al. 2007; Lewis 2021; Morens and Fauci 2007; Quammen 2012; Quick and Fryer 2018; Webster et al. 1997). By disregarding science and the views of experts, Republicans are more likely to discount these concerns. It is thus not surprising that where people are skeptical of human‐caused climate change, they are also less likely to comply with masks and physical distancing measures intended to stop the spread of COVID‐19 (Brzezinski et al. 2020).
In this manuscript, we expect that there will be a positive relationship between the percent of votes in a county for Donald Trump in the 2020 presidential election, a measure of political views, and case and death rates from COVID‐19 in that county.
Type of Employment
During the pandemic, millions of Americans were able to work from home, which provided some safety from the virus by reducing contact with other people. Millions of other people, however, were employed in sectors where remote work was much less feasible. Many of these individuals lost their job during the early months of the pandemic. For those who retained their jobs, contact with more people clearly increased their likelihood of getting COVID‐19. For purposes of this study, employment in an industry more likely to require face‐to‐face interactions with other people is defined as “high‐risk,” in accordance with standards established by OSHA (Occupational Safety and Health Administration 2021).
It seems likely that counties more dependent on high‐risk industries are more at risk from the virus than counties more reliant on industries where remote work is more feasible. For example, early in the pandemic, there were a number of major outbreaks in meatpacking plants where people work shoulder‐to‐shoulder. Many meatpacking plants are located in rural communities and are often the largest employer in the community (Krumel 2020). A lower proportion of rural workers have white‐collar jobs that make remote work possible and more are employed in high‐risk industries. In this analysis, it is expected that there will be a positive relationship between COVID‐19 cases and deaths and the percent of the labor force employed in high‐risk industries.
Poverty
Research has found that high poverty communities have significantly higher rates of COVID‐19 cases and deaths than communities with lower poverty rates (Adhikari et al. 2020; Jung et al. 2020). For purposes of this study, it is also important to recognize that poverty rates are more extensive in rural compared with urban areas (Albrecht et al. 2000; Lichter et al. 2012). There are several reasons why poverty could enhance virus spread and make disease outcomes more severe (Ahmed et al. 2020). Often persons in poverty are living in crowded and unsanitary conditions that enhance disease spread. Additionally, persons living in poverty are more likely to have underlying health conditions and often have inadequate health care (Case and Deaton 2020; Chokshi 2018). It is thus expected that as poverty rates in a county increase, COVID‐19 case and death rates will also increase.
Race/Ethnicity
Data show that minorities are much more likely than white people to test positive for and die from COVID‐19 (e.g., Hawkins 2020; Karaca‐Mandic et al. 2021; Ogedegbe et al. 2020; Raifman and Raifman 2020), and this tendency extends to rural communities (Cheng et al. 2020). Many communities with large numbers of minorities have struggled with significant virus outbreaks. For example, the pandemic has had extensive consequences in Black communities in the rural South and in urban neighborhoods with large Black populations throughout the nation. The virus had major consequences on Native American reservations in the West and Midwest. The Navajo Reservation in Arizona, New Mexico, and Utah was especially hard hit (Kovich 2020).
There are several factors that may account for high disease impacts among minorities. Poverty status and type of employment are variables related to both race/ethnicity and COVID‐19 as described above. Additionally, because of language barriers and a lack of trust in authority figures, minorities may be less aware of the extent of the danger that exists from the COVID‐19 virus. Further, based on a history of exploitation, minorities may be less likely to trust the information provided by health experts (Howell and Fagan 1988; Nunnally 2012). In this analysis, it is expected that there will be an inverse relationship between the percent of the population in a county that is non‐Hispanic white and cases and deaths from COVID‐19. It should be noted that communities with large minority populations are found all along the rural/urban continuum. On average, however, nonmetro counties have a higher percentage of non‐Hispanic white residents than metro counties.
Educational Attainment
Counties with higher levels of educational attainment are expected to have lower rates of COVID‐19 cases and deaths. There are several reasons for this expectation. First, the professional, white‐collar jobs that are conducive to remote work are typically held by persons with advanced education. Remote work clearly provides a level of protection from COVID‐19. Counties, where a higher proportion of the workforce are employed in these types of jobs, are thus likely to have lower infection rates. Second, more advantaged persons have long been found to score better on measures of health, and thus have fewer underlying health conditions that increase the danger from COVID‐19 (Link and Phelan 1995). Third, persons with higher levels of education have more trust in science (Drummond and Fischhoff 2017; Roberts et al. 2013). This trust likely results in behaviors such as wearing a mask and social distancing that will slow virus spread. Of relevance to this study, education levels, on average, are lower in rural compared with urban areas (Albrecht 2012). It is thus expected that as educational attainment levels increase, rates of COVID‐19 cases and deaths will decline.
In summary, the structural advantages relative to disease spread from living in rural compared with urban communities should result in lower levels of COVID‐19 spread. Several variables used in this study may explain why the expected safety of rural areas failed to materialize. Specifically, it is expected that COVID‐19 cases and deaths will be greater, where (1) the percent of Trump voters are greater, (2) a higher proportion of the workforce are employed in high‐risk industries, (3) poverty rates are higher, (4) minorities are more extensive, and (5) educational attainment levels are lower.
Methods
The county is the unit of analysis for this study. Counties are the smallest practical geographic unit where data are available for all the variables utilized in the study. The dependent variables used in the regression models are cases and deaths from COVID‐19 per 100,000 residents. Two separate dates are used, one early and one late in the pandemic. The first date is May 1, 2020, a day chosen to represent the early portion of the pandemic. The second date is 10 months later on March 1, 2021. This date was chosen because the disease had been spreading throughout the world for a year, allowing the impacts of all study variables to be apparent. Further, on March 1, COVID‐19 vaccinations were being widely distributed, greatly changing the nature of the spread of the disease. A study of later dates after vaccinations was available, while important, would be less effective in meeting the objectives of this study.
To measure the dependent variables, county‐level data were obtained from the New York Times dataset (New York Times 2021). This dataset provides the number of COVID‐19 cases and deaths for each county in the United States on a daily basis. New York Times data are obtained from state, regional, and county sources continually. New York Times data are virtually identical to data from other sources because all data providers get their information from the same places. The advantage of the New York Times dataset is that it is available to the general public and can be easily downloaded. The total number of COVID‐19 cases and deaths in each county were downloaded for May 1, 2020 and March 1, 2021. The dependent variables for each date are developed by dividing cases and deaths in each county by the total population of that county as reported by the 2014–2018 American Community Survey and then multiplying by 100,000. Figures 1 (cases) and 2 (deaths) present maps showing the geographic distribution of COVID‐19 on March 1, 2021. The concentration of the disease in heavily rural areas, such as the upper Midwest, the rural South, and reservation counties in the West is apparent.
Figure 1.
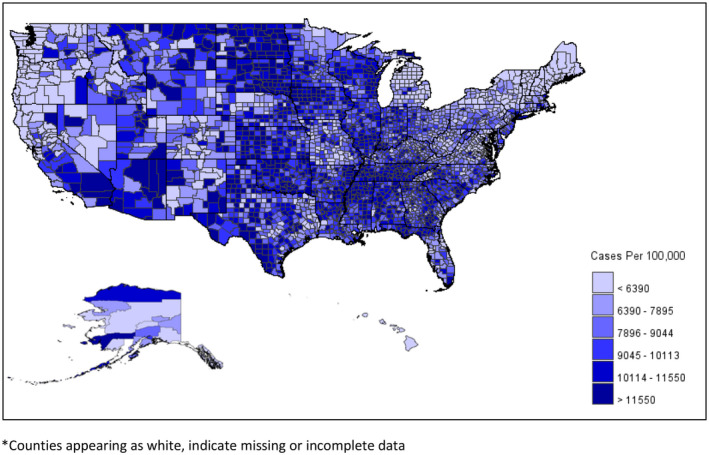
County‐Level Map Showing Cases of COVID‐19 per 100,000 as of March 1, 2021. *Counties appearing as white, indicate missing or incomplete data. [Colour figure can be viewed at wileyonlinelibrary.com
Figure 2.
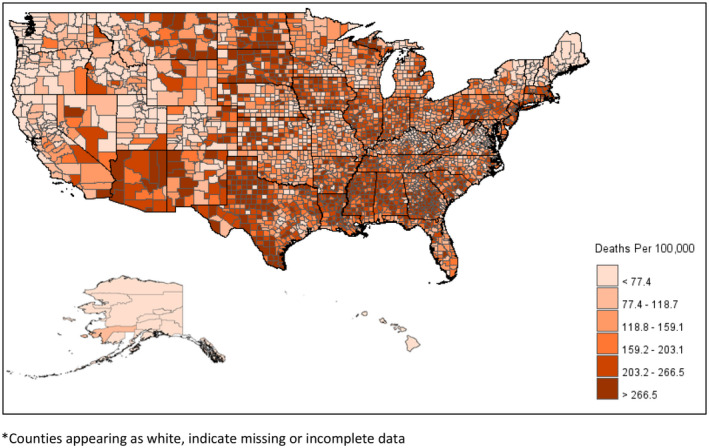
County‐Level Map Showing Deaths From COVID‐19 per 100,000 as of March 1, 2021. *Counties appearing as white, indicate missing or incomplete data. [Colour figure can be viewed at wileyonlinelibrary.com
The primary independent variable is residence along the Rural/Urban Continuum. This continuum was developed by the Economic Research Service of USDA. Continuum scores range from 1 to 9. As scores increase, counties have progressively smaller populations and become ever more isolated from metro centers. Table 1 provides an overview of each category of the county. Categories 1–3 are metropolitan, whereas categories 4–9 are nonmetropolitan. The most metropolitan counties in Category 1 are the 432 counties that have a population of 1 million or more. A majority of the U.S. population (55.7 percent) lives in Category 1 counties alone. At the opposite extreme, Category 9 counties are the 408 completely rural counties, with the largest community having a population of less than 2,500, and that is not adjacent to a metro area. Less than 2 percent of the U.S. population live in categories 8 and 9 combined.
Table 1.
Overview of Rural–Urban Continuum Categories.
| Category and Defintion | Number of Counties | Total Population | Proportion of Population by RUCC | Average County Population |
|---|---|---|---|---|
| 1. Metrocounties in metro areas of 1 million | 432 | 182,406,377 | 55.7 a | 422,237 b |
| 2. Metrocounties in metro areas of 250,000 to 1 million population | 376 | 69,758,436 | 21.3 | 185,528 |
| 3. Metrocounties in metro areas of fewer than 250,000 population | 354 | 29,518,397 | 9.0 | 83,385 |
| 4. Nonmetro‐Urban population of 20,000 or more, adjacent to a metro area | 214 | 13,620,408 | 4.2 | 63,647 |
| 5. Nonmetro‐Urban population of 20,000 or more, not adjacent to metro area | 91 | 5,008,469 | 1.5 | 55,038 |
| 6. Nonmetro‐Urban population of 2,500 to 19,999, not adjacent to a metro area | 593 | 14,634,916 | 4.5 | 24,679 |
| 7. Nonmetro‐Urban population of 2,500 to 19,999, not adjacent to a metro arear | 425 | 7,954,349 | 2.4 | 18,716 |
| 8. Nonmetro‐Completely rural or less than 2,500 urban population, adjacent to metro area | 219 | 2,118,659 | 0.6 | 9,674 |
| 9. Nonmetro‐Completely rural or less than 2,500 urban population, not adjacent to metro area | 408 | 2,487,881 | 0.8 | 6,098 |
| Total | 3,112 | 327,507,892 | 100.0 | 105,240 |
Percent of Total U.S. residents in each RUCC category.
Computed by dividng total population in RUCC category by number of counties in category.
Table 2 provides data on COVID‐19 cases and deaths on both study dates along the rural/urban continuum. It is apparent that early in the pandemic on May 1, 2020, the disease was concentrated in metro counties. In Category 1 counties (the most urban counties), there were 468 cases per 100,000 residents, compared with 76 in Category 9 counties (the most rural counties). Also, there were 19.4 deaths per 100,000 residents in Category 1 counties compared with 2.3 in Category 9 counties. By March 1, 2021, these differences were gone and case and death rates were more evenly distributed across the rural/urban continuum. Overall, on March 1, 2021 both cases and deaths per 100,000 residents were greater in nonmetro counties combined (Categories 4–9) than in metro counties combined (Categories 1–3).
Five additional variables are utilized to help understand variations in COVID‐19 cases and deaths along the rural/urban continuum. The first is the percent of votes in each county in the 2020 presidential election for Donald Trump, which is a measure of political views. County‐level voting data were downloaded from the New York Times (New York Times 2020) and determination was made of the percent of voters in each county that cast their ballot for Donald Trump in the 2020 presidential election. The other four independent variables are obtained from the 2014–2018 American Community Survey. A high‐risk industry measure was created by determining the percent of the total workforce employed in industries more likely to require person‐to‐person contact. It should be noted that Census variables are based on where people live, not where they work. High‐risk industries were defined as the natural resource industries (agriculture, logging, and mining), manufacturing, retail trade, health care, education, and entertainment, arts, accommodations, and food services (Occupational Safety and Health Administration 2021). Poverty is determined by the percent of people living in poverty in each county. The official poverty measure used by the U.S. Census Bureau is utilized for this variable. Two measures of race/ethnicity are used. The first is the percent of the population that is non‐Hispanic white, whereas the second is the percent of the population that is Hispanic. Educational attainment is determined by the percent of persons age 25 and older with a college degree in each county. The bottom panel of Table 1 provides data showing scores in the median county for all independent variables along the rural/urban continuum. It is clear from Table 1 that as counties become more rural and isolated, there is a tendency for the percentage of votes for Trump to increase, for dependence on high‐risk industries to increase, for poverty levels to increase, for the percent non‐Hispanic white to increase, and for the percent of adults with a college degree to decline. The share of Hispanic residents is comparable across the rural/urban continuum.
For the data analysis, regression models are utilized where COVID‐19 cases and deaths per 100,000 on May 1, 2020 and March 1, 2021 are used as dependent variables and the rural/urban continuum, percent voting for Trump, percent employed in high‐risk industries, percent in poverty, percent non‐Hispanic white, percent Hispanic, and percent of adults with a college degree are used as independent variables. In addition to regression models for all counties, separate models are conducted for metro and nonmetro counties. The analysis is conducted on 3,112 counties for which data are available on all variables used in the analysis. During the regression analysis, the rural/urban continuum variable is used as a series of categorical variables with Category 1 as reference. For the analysis of nonmetro counties alone, Category 4 is used as the reference category. All the regression models are weighted by the total population of the county. This is done to account for vast differences in the number of residents from one county to another.
Findings
Regression models are presented in Tables 3 (May 1, 2020) and 4 (March 1, 2021). Table 3 shows the relationship between the independent variables and cases and deaths per 100,000 residents from COVID‐19 early in the pandemic. The first panels of Table 3 present data on cases and deaths per 100,000 residents or all counties. Of greatest relevance, early in the pandemic, it was found that as the proportion of Trump voters increased, COVID‐19 case and death rates both declined. Thus, in counties where Trump received a higher proportion of the vote, COVID‐19 cases and deaths per 100,000 residents tended to be lower. This relationship also held true in metro counties. In nonmetro counties, however, the relationship between percent voting for Trump and COVID‐19 cases and deaths was statistically insignificant. In nonmetro counties, the most important variable was percent non‐Hispanic white, where it was found that as the percent non‐Hispanic white increased, cases and deaths per 100,000 residents from COVID‐19 declined.
Table 3.
Regression Models Showing Relationship Between Independent Variables and COVID‐19 Cases and Deaths Per 100,000 on May 1, 2020.
| Independent Variables | Cases | Deaths | ||||
|---|---|---|---|---|---|---|
| Parameter Estimate | 95% Confidence Intervals | Standardized Beta | Parameter Estimate | 95% Confidence Intervals | Standardized Beta | |
| All Counties (N = 3,112) | ||||||
| Percent voting for Trump | −800* | −1,003 to −596 | −0.257 | −33.8* | −43.8 to −23.9 | −0.223 |
| Percent employed in high‐risk industries | −2,165* | −2,596 to −1,734 | −0.240 | −41.1* | −62.4 to −19.7 | −0.094 |
| Percent in poverty | −116 | −619 to 388 | −0.012 | −38.4* | −63.6 to −13.3 | −0.081 |
| Percent non‐Hispanic White | −49 | −243 to 146 | −0.020 | −2.2 | −11.7 to 7.4 | −0.018 |
| Percent Hispanic | −178 | −361 to 6 | −0.056 | −20.8* | −29.7 to −11.8 | −0.137 |
| Percent of persons 25 years and older with college degree | 555* | −853 to −258 | −0.111 | −12.2 | −26.9 to 2.6 | −0.050 |
| Rural/Urban continuum category | ||||||
| 2 | −126* | −177 to −74 | −0.100 | −5.6* | −8.1 to −3.1 | −0.091 |
| 3 | −48 | −123 to 27 | −0.026 | −6.6* | −10.2 to −2.9 | −0.075 |
| 4 | −5 | −109 to 99 | −0.002 | −5.7 | −10.7 to −0.6 | −0.045 |
| 5 | −24 | −178 to 130 | −0.006 | −6.6 | −14.0 to 0.9 | −0.032 |
| 6 | 27 | −79 to 132 | 0.010 | −2.3 | −7.4 to 2.8 | −0.019 |
| 7 | 23 | −110 to 156 | 0.007 | −4.3 | −10.8 to 2.1 | −0.026 |
| 8 | 5 | −242 to 253 | 0.001 | −6.7 | −18.6 to 5.3 | −0.020 |
| 9 | −8 | −250 to 235 | −0.001 | −5.8 | −17.5 to 5.9 | −0.018 |
| Intercept | 1,921* | 1,652 to 2,192 | 0.000 | 65.5* | 52.1 to 78.9 | 0.000 |
| F‐value | 37.5* | – | 25.9* | – | ||
| Adjusted R 2 | .153* | – | .110* | – | ||
| Metro Counties (N = 1,162) | ||||||
| Percent voting for Trump | −976* | −1,323 to −629 | −0.273 | −44.9* | −62.0 to −27.8 | −0.256 |
| Percent employed in high‐risk industries | −2,922* | −3,671 to −2,173 | −0.274 | −53.5* | −91.4 to −15.7 | −0.102 |
| Percent in poverty | −60 | −941 to 821 | −0.006 | −54.6 | −99.8 to −9.5 | −0.104 |
| Percent non‐Hispanic White | 124 | −206 to 455 | 0.047 | 5.4 | −11.0 to 21.8 | 0.042 |
| Percent Hispanic | −110 | −415 to 195 | −0.033 | −16.0 | −31.1 to −0.9 | −0.102 |
| Percent of persons 25 years and older with college degree | −759* | −1,250 to −268 | −0.137 | −22.3 | −47.0 to 2.5 | −0.083 |
| Rural/Urban continuum category | ||||||
| 2 | −102 | −183 to −23 | −0.080 | −4.7 | −8.7 to −0.8 | −0.078 |
| 3 | −10 | −126 to 107 | −0.005 | −5.2 | −10.9 to 0.5 | −0.060 |
| Intercept | 2,248* | 1,793 to 2,704 | 0.000 | 75.6* | 52.6 to 98.6 | 0.000 |
| F‐value | 27.3* | – | 16.7* | – | ||
| Adjusted R 2 | .155* | – | .099* | – | ||
| Nonmetro Counties (N = 1,950) | ||||||
| Percent voting for Trump | −147 | −291 to −3 | −0.069 | −2.5 | −8.5 to 3.5 | −0.028 |
| Percent employed in high‐risk industries | 324 | 68 to 580 | 0.061 | −2.0 | −12.6 to 8.7 | −0.009 |
| Percent in poverty | −328 | −632 to −25 | −0.068 | −4.1 | −16.7 to 8.6 | −0.020 |
| Percent non‐Hispanic White | −373* | −507 to −239 | −0.240 | −18.0* | −23.5 to −12.4 | −0.275 |
| Percent Hispanic | −181 | −336 to −31 | −0.078 | −22.8* | −29.1 to −16.4 | −0.232 |
| Percent of persons 25 years and older with college degree | −245 | −514 to 25 | −0.059 | −2.6 | −13.8 to 8.6 | −0.015 |
| Rural/Urban continuum category | ||||||
| 5 | −15 | −64 to 35 | −0.015 | −1.3 | −3.4 to 0.7 | −0.034 |
| 6 | −14 | −50 to 22 | −0.022 | 1.3 | −0.3 to 2.8 | 0.047 |
| 7 | −19 | −62 to 23 | −0.024 | −0.5 | −2.3 to 1.3 | −0.015 |
| 8 | −21 | −53 to 94 | 0.014 | −2.2 | −5.3 to 0.9 | −0.035 |
| 9 | −35 | −107 to 37 | −0.024 | −2.3 | −5.3 to 0.7 | −0.038 |
| Intercept | 505* | 306 to 704 | 0.000 | 25.4* | 17.1 to 33.6 | 0.000 |
| F‐value | 7.7* | – | 10.3* | – | ||
| Adjusted R 2 | .042* | – | .057* | – | ||
Statistically significant at the .01 level.
Table 4.
Regression Models Showing Relationship Between Independent Variables COVID‐19 Cases and Deaths per 100,000 on March 1, 2021
| Independent Variables | Cases | Deaths | ||||
|---|---|---|---|---|---|---|
| Parameter Estimate | 95% Confidence Interval | Standardized Beta | Parameter Estimate | 95% Confidence Interval | Standardized Beta | |
| All Counties (N = 3,112) | ||||||
| Percent voting for Trump | 7,526* | 6,695 to 8,357 | 0.517 | 3.0 | −23.1 to 29.1 | 0.007 |
| Percent employed in high‐risk industries | 3,085* | 1,331 to 4,838 | 0.073 | −165.8 | −220.9 to −110.8 | −0.136 |
| Percent in poverty | 6,792* | 4,746 to 8,838 | 0.147 | 185.0* | 120.8 to 249.3 | 0.139 |
| Percent non‐Hispanic White | ‐3,047* | −3,840 to −2,254 | −0.266 | −30.4* | −55.3 to −5.5 | −0.092 |
| Percent Hispanic | 3,541* | 2,791 ‐ 4,290 | 0.237 | 15.8 | −7.8 to 39.3 | 0.037 |
| Percent of persons 25 years and older with college degree | 379 | ‐837 ‐ 1,595 | 0.016 | −201.2* | −239.4 to −163.0 | −0.297 |
| Rural/Urban continuum category | ||||||
| 2 | −670* | −882 to −458 | −0.110 | −10.4* | −17.1 to −3.8 | −0.059 |
| 3 | −468* | −775 to −160 | −0.054 | 2.4 | −7.2 to 12.1 | 0.010 |
| 4 | −953* | −1,379 to −527 | −0.076 | 4.1 | −9.3 to 17.4 | 0.011 |
| 5 | −755* | −1,386 to −124 | −0.037 | 1.4 | −18.3 to 21.3 | 0.003 |
| 6 | −969* | −1,399 to −539 | −0.080 | 23.6 | 10.0 to 37.1 | 0.067 |
| 7 | −804* | −1,337 to −270 | −0.049 | 17.9 | 1.1 to 34.7 | 0.038 |
| 8 | −1,586* | −2,538 to −635 | −0.051 | 3.6 | −26.3 to 33.5 | 0.004 |
| 9 | −1,272* | −2,160 to −385 | −0.044 | 15.1 | −12.8 to 42.9 | 0.018 |
| Intercept | 4,189* | 3,087 to 5,292 | 0.000 | 270.7* | 236.1 to 305.3 | 0.000 |
| F‐value | 94.2* | – | 44.5* | – | ||
| Adjusted R 2 | .296* | – | .164* | – | ||
| Metro Counties (N = 1,162) | ||||||
| Percent voting for Trump | 7,030* | 5,690 to 8,370 | 0.457 | −45.1 | −86.0 to −4.2 | −0.106 |
| Percent employed in high‐risk industries | 461 | −2,433 ‐ 3,356 | 0.010 | −260.5* | −348.8 to −172.1 | −0.206 |
| Percent in poverty | 8,507* | 5,101 to 11,914 | 0.184 | 202.9* | 98.9 to 306.8 | 0.159 |
| Percent non‐Hispanic White | −1,642* | −2,919 to −365 | −0.144 | 38.7 | −0.2 to 77.7 | 0.124 |
| Percent Hispanic | 4,653* | 3,473 to 5,833 | 0.328 | 61.1* | 25.1 to 97.1 | 0.156 |
| Percent of persons 25 years and older with college degree | 295 | −1,604 to 2,194 | 0.012 | −218.5* | −276.5 to −160.5 | −0.331 |
| Rural/Urban continuum category | ||||||
| 2 | −651* | −960 to −342 | −0.117 | −8.2 | −17.7 to 1.2 | −0.054 |
| 3 | −412 | −862 to 38 | −0.053 | 6.7 | −7.0 to 20.5 | 0.031 |
| Intercept | 0.042* | 2,461 to 5,984 | 0.000 | 0.003* | 230.1 to 337.6 | 0.000 |
| F‐value | 67.5* | – | 28.0* | – | ||
| Adjusted R 2 | .314* | – | .157* | – | ||
| Nonmetro Counties (N = 1,950) | ||||||
| Percent voting for Trump | 9,956* | 8,760 to 11,151 | 0.452 | 139.1* | 100.1 to 178.1 | 0.195 |
| Percent employed in high‐risk industries | 10,185* | 8,069 to 12,300 | 0.185 | 89.9 | 20.9 to 159.0 | 0.050 |
| Percent in poverty | −1,589 | −4,080 to 901 | −0.032 | −12.7 | −94.0 to 68.6 | −0.008 |
| Percent non‐Hispanic White | −8,443* | −9,552 to −7,333 | −0.525 | −240.6* | −276.8 to −204.4 | −0.462 |
| Percent Hispanic | −2,442* | −3,704 to −1,179 | −0.102 | −111.2* | −152.4 to −70.0 | −0.143 |
| Percent of persons 25 years and older with college degree | −13 | −2,262 to 2,235 | −0.000 | −344.3* | −417.7 to −270.9 | −0.248 |
| Rural/Urban continuum category | ||||||
| 5 | 200 | −218 to 618 | 0.020 | −3.5 | −17.1 to 10.2 | −0.011 |
| 6 | −256 | −563 to 50 | −0.039 | 2.3 | −7.7 to 12.3 | 0.011 |
| 7 | 11 | −344 to 366 | 0.001 | 3.6 | −8.0 to 15.2 | 0.014 |
| 8 | −810* | −1,399 to −221 | −0.055 | −12.6 | −31.8 to 6.7 | −0.026 |
| 9 | −506 | −1,057 to 45 | −0.037 | −1.7 | −19.7 to 16.3 | −0.004 |
| Intercept | 4,540* | 2,895 to 6,186 | 0.000 | 304.1* | 250.4 to 357.8 | 0.000 |
| F‐value | 70.0* | – | 66.1* | – | ||
| Adjusted R 2 | .280* | – | .269* | – | ||
Statistically significant at the .01 level.
The most important part of the data analysis is presented in Table 4 where regression models are presented on cases and deaths of COVID‐19 per 100,000 residents on March 1, 2021. With respect to COVID‐19 cases, by far the most important independent variable was percent voting for Trump where there was a positive relationship between this measure of political views and COVID‐19 cases per 100,000. It is critical to note that the direction of the relationship between percent voting for Trump and COVID‐19 spread completely flipped between May 2020 (Table 3) and March 2021 (Table 4). Also, of significance, as the percent non‐Hispanic white increased, virus case rates declined. However, as the percent Hispanic increased, virus case rates tended to increase. Percent employed in high‐risk industries and percent in poverty also had a significant, but weak positive relationship with COVID‐19 case rates. Finally, when considering the effects of the other independent variables, there were lower rates of COVID‐19 cases in rural/urban Categories 2, 3, 4, 6, 8, and 9.
For the regression model exploring COVID‐19 deaths for all counties, the percent voting for Trump was statistically insignificant. The most important variables explaining death rates were measures of disadvantage. That is, counties with higher death rates had lower proportions of adults with a college degree, higher poverty rates, a lower percentage of non‐Hispanic white residents. Also, higher rates of employment in high‐risk industries tended to result in lower COVID‐19 death rates. Percent of adults with a college degree was the most important explanatory variable in this model. The rural/urban continuum variables were mostly statistically insignificant.
The results of the regression analysis for metro counties alone were very similar to the all‐county models. That is, the percent voting for Trump and percent Hispanic were by far the strongest predictors of cases per 100,000 residents, whereas the percent of adults with a college degree was the best predictor of COVID‐19 death rates. Similarly, for the analysis of nonmetro counties alone, percent voting for Trump greatly increased COVID‐19 case rates, whereas as the percentage non‐Hispanic white increased, case rates declined sharply. Death rates were lowest in counties where higher percentages of adults have a college degree and there are higher percentages of non‐Hispanic white residents. In nonmetro counties, it was found that death rates were higher in counties with a higher percentage of Trump voters.
Conclusions
Between May 1, 2020 and March 1, 2021, cases and deaths per 100,000 residents from the COVID‐19 virus increased much more rapidly in nonmetro than in metro counties. By March 1, both case and death rates were greater in nonmetro than in metro counties. Little of this increase can be explained by position along the rural/urban continuum. Thus, it is not nonmetro residence per se leading to the greater spread of the disease in rural areas. Rather, changes in COVID‐19 cases and deaths are a product of other factors. Critically, factors explaining case rates tended to be somewhat different from the factors explaining death rates. The most important variable explaining COVID‐19 cases was political views where counties with a higher percentage of Trump voters had more COVID‐19 cases per 100,000 residents than counties with a lower percentage of Trump voters. The importance of this variable is apparent when noting that the direction of the relationship completely flipped between May 2020 and March 2021. The relationship between the percentage of Trump voters and higher rates of COVID‐19 cases occurred in metro as well as nonmetro counties. It is apparent that counties with large numbers of Trump voters were initially safer from the virus but then were less likely to implement recommended safety precautions. The result is large numbers of COVID‐19 cases. Case rates were inversely related to the percentages of non‐Hispanic white residents and positively related to the percentages of Hispanic residents.
While political views and race/ethnicity are related to the spread of the disease, whether or not people die from the disease is more a function of disadvantage. Death rates were highest in counties where a lower percentage of adults have a college degree, where there are higher poverty rates, and where there is a lower percentage of non‐Hispanic white residents. In nonmetro counties, the death rate was also higher in counties with a higher percentage of Trump voters. In nonmetro counties, the death rate declined as the percentage of Hispanic increased, likely a consequence of the relatively young ages of the Hispanic population.
Two conclusions from this analysis are relevant. First, political views were strongly related to the spread of a dangerous disease. Understanding and coping with a disease should not be political. Finding ways to close the political divide could be vital in improving our nation’s response when faced with future crises. Second, it is critical that consideration be made to protect those who are most vulnerable (Johnson 2020). During the COVID‐19 pandemic, death rates were highest for people in poverty, minorities, and persons with lower levels of educational attainment. The COVID‐19 pandemic was no different from other disasters in that costs are unequally born by those lacking the resources to cope. Of course, many questions remain unanswered. Much additional research is needed for a more in‐depth understanding of the COVID‐19 pandemic.
Address correspondence to Don E. Albrecht, Western Rural Development Center, Utah State University, Logan, Utah. Email: don.albrecht@usu.edu
References
- Adhikari, Samrachana , Pantaleo Nicholas P., Feldman Justin M., Ogedegbe Olugbenga, Thorpe Lorna, and Troxel Andrea B.. 2020. “Assessment of Community‐Level Disparities in Coronavirus Disease 2019 (COVID‐19) Infections and Deaths in Large US Metropolitan Areas.” JAMA Network Open 3(7):e2016938. [DOI] [PMC free article] [PubMed] [Google Scholar]
- Ahmed, Faheem , Ahmed Na'eem, Pissarides Christopher, and Stiglitz Joseph. 2020. “Why Inequality Could Spread COVID‐19.” The Lancet Public Health 5(5):e240. [DOI] [PMC free article] [PubMed] [Google Scholar]
- Albrecht, Don E . 2012. “A Comparison of Metro and Nonmetro Incomes in a Twenty‐First Century Economy.” Journal of Rural Social Sciences 27(1). Retrieved March 1, 2021 (https://egrove.olemiss.edu/jrss/vol27/iss1/1). [Google Scholar]
- Albrecht, Don E. and Albrecht Stan L.. 2000. “Poverty in Nonmetropolitan America: Impacts of Industrial, Employment, and Family Structure Variables.” Rural Sociology 65(1):87–103. [Google Scholar]
- Allcott, Hunt , Boxell Levi, Conway Jacob, Gentzkow Matthew, Thaler Michael, and Yang David. 2020. “Polarization and Public Health: Partisan Differences in Social Distancing During the Coronavirus Pandemic.” National Bureau of Economic Research Working Paper 26946. [DOI] [PMC free article] [PubMed]
- Barrios, John M. & Hochberg Yael 2020. “Risk Perception Through the Lens of Politics in the Time of COVID‐19 Pandemic.” National Bureau of Economic Research Working Paper 27008.
- Bruine de Bruin, Wändi , Saw Htay‐Wah, and Goldman Dana P.. 2020. “Political Polarization in US Residents' COVID‐19 Risk Perceptions, Policy Preferences, and Protective Behaviors.” Journal of Risk Uncertainty 61(2):177–94. 10.1007/s11166-020-09336-3. [DOI] [PMC free article] [PubMed] [Google Scholar]
- Brzezinski, Adam , Kecht Valentin, Van Dijcke David, and Wright Austin L.. 2020. “Belief in Science Influences Physical Distancing in Response to COVID‐19 Lockdown Policies.” University of Chicago, Bechler Friedman Institute for Economics Working Paper No. 2020‐56.
- Case, Anne and Deaton Angus. 2020. Deaths of Despair. Princeton, NJ: Princeton University Press. [Google Scholar]
- Cheng, Kent Jason G. , Sun Yue, and Monnat Shannon M.. 2020. “COVID‐19 Death Rates Are Higher in Rural Counties with Larger Shares of Blacks and Hispanics.” The Journal of Rural Health 36(4):602–08. [DOI] [PMC free article] [PubMed] [Google Scholar]
- Chokshi, Dave A. 2018. “Income, Poverty, and Health Inequality.” JAMA 319(13):1312–3. [DOI] [PubMed] [Google Scholar]
- Conway, Erik M. and Oreskes Naomi. 2012. “Why Conservatives Turned Against Science.” Chronicle Review 5. [Google Scholar]
- Davies, Nicholas G. , Klepac Petra, Liu Yang, Prem Kiesha, Jit Mark, and Egg Rosalind M.. 2020. “Age‐Dependent Effects in the Transmission and Control of COVID‐19 Epidemics.” Nature medicine 26(8):1205–11. [DOI] [PubMed] [Google Scholar]
- Drummond, Caitlin and Fischhoff Baruch. 2017. “Individuals with Greater Science Literacy and Education Have More Polarized Beliefs On Controversial Science Topics.” Proceedings of the National Academy of Sciences 114(36):9587–92. [DOI] [PMC free article] [PubMed] [Google Scholar]
- Dunlap, Riley E. and McCright Araon M.. 2008. “A Widening Gap: Republican and Democratic View on Climate Change.” Environment 50:26–35. [Google Scholar]
- Evans, John H. and Hargittai Eszter. 2020. “Who Doesn't Trust Fauci? The Public's Belief in the Expertise and Shared Values of Scientists in the COVID‐19 Pandemic.” Socius 6:2378023120947337. [Google Scholar]
- Gandhi, Monica , Beyrer Chris, and Goosby Eric. 2020. “Masks Do More Than Protect Others During COVID‐19: Reducing The Inoculum of SARS‐CoV‐2 to Protect the Wearer.” Journal of General Internal Medicine 35(10):3063–6. [DOI] [PMC free article] [PubMed] [Google Scholar]
- Gauchat, Gordon. 2012. “Politicization of Science in the Public Sphere: A Study of Public Trust in the United States, 1974 to 2010.” American Sociological Review 77(2):167–87. [Google Scholar]
- Goetz, Stephan J. , Davlasheridze Meri, Han Yicheol, and Fleming‐Muñoz David A.. 2018. “Explaining the 2016 Vote for President Trump across U.S. Counties.” Applied Economic Perspectives and Policy 41(4):703–22. 10.1093/aepp/ppy026. [DOI] [Google Scholar]
- Greenhalgh, Trisha , Jimenez Jose L., Prather Kimberly A., Tufekci Zeynep, Fisman David, and Schooley Robert. 2021. “Ten Scientific Reasons in Support of Airborne Transmission of SARS‐CoV‐2.” The Lancet 397(10285):1603–5. [DOI] [PMC free article] [PubMed] [Google Scholar]
- Hamilton, Lawrence C . 2015. Conservative and Liberal Views of Science, Does Trust Depend On Topic? University of New Hampshire, Carsey School of Public Policy, Regional Issue Brief # 45. [Google Scholar]
- Hamilton, Lawrence C. , Hartter Joel, and Saito Kei. 2015. “Trust in Scientists on Climate Change and Vaccines.” SAGE Open 5(3):2158244015602752. [Google Scholar]
- Hamilton, Lawrence C. and Safford Thomas. 2020. “Conservative Media Consumers Less Likely to Wear Masks and Less Worried about COVID‐19.” Carsey Perspectives: University of New Hampshire. Carsey School of Public Policy.
- Hatchett, Richard J. , Mecher Carter E., and Lipsitch Marc. 2007. “Public Health Interventions and Epidemic Intensity During the 1918 Influenza Pandemic.” Proceedings of the National Academy of Sciences 104(18):7582–7. [DOI] [PMC free article] [PubMed] [Google Scholar]
- Hawkins, Devan . 2020. “Differential Occupational Risk for COVID‐19 and Other Infectious Exposure According to Race and Ethnicity.” American Journal of Industrial Medicine 63(9):817–20. [DOI] [PMC free article] [PubMed] [Google Scholar]
- Hill, Terrence D. , Gonzalez Kelsey E., and Burdette Amy M.. 2020a. “The Blood of Christ Compels Them: State Religiosity and State Population Mobility During the Coronavirus (COVID‐19) Pandemic.” Journal of Religion and Health 59(5):2229–2242. [DOI] [PMC free article] [PubMed] [Google Scholar]
- Hill, Terrence , Gonzalez Kelsey E., and Davis Andrew. 2020b. “The Nastiest Question: Does Population Mobility Vary by State Political Ideology During the Novel Coronavirus (COVID‐19) Pandemic?” Sociological Perspective 1:1–18. [Google Scholar]
- Howell, Susan E. and Fagan Deborah. 1988. “Race and Trust in Government: Testing the Political Reality Model.” Public Opinion Quarterly 52(3):343–50. [Google Scholar]
- Hsiehchen, David , Espinoza Magdalena, and Slovic Paul. 2020. “Political Partisanship and Mobility Restriction During the COVID‐19 Pandemic.” Public Health 187:111–4. ISSN 0033‐3506, 10.1016/j.puhe.2020.08.009. [DOI] [PMC free article] [PubMed] [Google Scholar]
- IHME (Institute for Health Metrics and Evaluation) 2020. “COVID‐19 Projections.”
- James, Wesley L. 2014. “All Rural Places are not Created Equal: Revisiting the Rural Mortality Penalty in the United States.” American Journal of Public Health 104(11):2122–9. [DOI] [PMC free article] [PubMed] [Google Scholar]
- Johnson, Kenneth M. 2020. “Health Conditions and an Older Population Increase COVID‐19 Risks in Rural America.” Carsey Research National Issue Brief #150.
- Jung, Juergen , Manley James, and Shrestha Vinish. 2020. “Coronavirus Infections and Deaths by Poverty Status: The Effects of Social Distancing.” Journal of Economic Behavior & Organization 182:311–30. [DOI] [PMC free article] [PubMed] [Google Scholar]
- Karaca‐Mandic, Pinar , Georgiou Archelle, and Sen Soumya. 2021. “Assessment of COVID‐19 Hospitalizations by Race/Ethnicity in 12 States.” JAMA Internal Medicine 181(1):131–134. [DOI] [PMC free article] [PubMed] [Google Scholar]
- Kovich, Heather . 2020. “Rural Matters: Coronavirus and the Navajo Nation.” New England Journal of Medicine 383:105–7. [DOI] [PubMed] [Google Scholar]
- Krumel, Thomas . “The Meatpacking Industry in Rural America During the COVID‐19 Pandemic.” Economic Research Service, USDA. August 28, 2020. [Google Scholar]
- Lachapelle, Paul and Albrecht Don. 2019. Addressing Climate Change at the Community Level in the United States. London: Routledge. [Google Scholar]
- Lewis, Michael . 2021. The Premonition. New York: W.W. Norton. [Google Scholar]
- Lichter, Daniel T. , Parisi Domenico, and Taquino Michael C.. 2012. “The Geography of Exclusion: Race, Segregation, and Concentrated Poverty.” Social Problems 59(3):364–88. [Google Scholar]
- Link, Bruce G. and Phelan Jo. 1995. “Social Conditions as Fundamental Causes of Disease.” Journal of Health and Social Behavior 35:80–94. [PubMed] [Google Scholar]
- Lyu, Wei and Wehby George L.. 2020. “Community Use of Face Masks and COVID‐19: Evidence from a Natural Experiment of State Mandates in the US.” Health Affairs 39(8):1419–25. [DOI] [PubMed] [Google Scholar]
- McCright, Aaron M. , Dentzman Katherine, Charters Meghan, and Dietz Thomas. 2013. “The Influence of Political Ideology on Trust in Science.” Environmental Research Letters 8 (4):044029. [Google Scholar]
- Monnat, Shannon M. , and Beeler Pickett Camille. 2011. “Rural/Urban Differences in Self‐Rated Health: Examining the Roles of County Size and Metropolitan Adjacency.” Health & place 17(1):311–9. [DOI] [PubMed] [Google Scholar]
- Monnat, Shannon M. and Brown David L.. 2017. “More than a Rural Revolt: Landscapes of Despair and the 2016 Presidential Election.” Journal of Rural Studies 55:227–36. 10.1016/j.jrurstud.2017.08.010. [DOI] [PMC free article] [PubMed] [Google Scholar]
- Mooney, Chris 2007. The Republican War on Science. New York: Basic Books. [Google Scholar]
- Morens, David M. and Fauci Anthony S.. 2007. “The 1918 Influenza Pandemic: Insights for the 21st Century.” Journal of Infectious Diseases 195(7):1018–28. [DOI] [PubMed] [Google Scholar]
- Mueller, Tom J. , McConnell Kathryn, Burow Paul Berne, Pofahl Katie, Merdjanoff Alexis A., and Farrell Justin. 2021. “Impacts of the COVID‐19 Pandemic on Rural America.” Proceedings of the National Academy of Sciences 118(1):2019378118. [DOI] [PMC free article] [PubMed] [Google Scholar]
- Nadelson, Louis S. and Hardy Kimberly K.. 2015. “Trust in Science and Scientists and the Acceptance of Evolution.” Evolution: Education and Outreach 8(1):1–9. [Google Scholar]
- New York Times . 2020. NYTimes/Election‐Data. Downloaded December 20, 2020.
- New York Times . 2021. NYTimes/COVID‐19‐Data. Downloaded May 1, 2020 and March 1, 2021.
- Nunnally, Shayla C. 2012. Trust in Black America: Race, Discrimination, and Politics. New York: NYU Press. [Google Scholar]
- Occupational Safety and Health Administration (OSHA) . 2021. “Hazard Recognition.” U.S. Department of Labor (Downloaded May 7, 2021).
- Ogedegbe, Gbenga , Ravenell Joseph, Adhikari Samrachana, Butler Mark, Cook Tiffany, Francois Fritz, Iturrate Eduardo, Jean‐Louis Girardin, Jones Simon A., Onakomaiya Deborah, Petrilli Christopher M., Pulgarin, Claudia , Regan, Seann , Reynolds, Harmony , Seixas, Azizi , Volpicelli, Frank Michael , and Horwitz, Leora Idit . 2020. “Assessment of Racial/Ethnic Disparities in Hospitalization and Mortality in Patients with COVID‐19 in New York City.” JAMA Network Open 3(12):e2026881. [DOI] [PMC free article] [PubMed] [Google Scholar]
- Omer, Saad B. , Malani Preeti, and Del Rio Carlos. 2020. “The COVID‐19 Pandemic in the US: A Clinical Update.” JAMA 323(18):1767–8. [DOI] [PubMed] [Google Scholar]
- Oreskes, Naomi and Conway Erik M.. 2011. Merchants of Doubt: How a Handful of Scientists Obscured the Truth on Issues from Tobacco Smoke to Global Warming. New York: Bloomsbury Publishing. [Google Scholar]
- Paz, Christian . 2020. “All the President's Lies about the Coronavirus.” The Atlantic (November 2).
- Perry, Samuel L. , Whitehead Andrew L., and Grubbs Joshua B.. 2020. “Culture Wars and COVID‐19 Conduct: Christian Nationalism, Religiosity, and Americans' Behavior During the Coronavirus Pandemic.” Journal for the Scientific Study of Religion 59(3):405–16. [Google Scholar]
- Peters, David J. 2020. “Community Susceptibility and Resiliency to COVID‐19 Across the Rural‐Urban Continuum in the United States.” The Journal of Rural Health 36(3):446–56. [DOI] [PMC free article] [PubMed] [Google Scholar]
- Quammen, David . 2012. Spillover: Animal Infections and the Next Human Pandemic. New York: Norton. [Google Scholar]
- Quick, Jonathan D. , and Fryer Bronwyn. 2018. The End of Epidemics. New York: St. Martins Press. [Google Scholar]
- Raifman, Matthew A. and Raifman Julia R.. 2020. “Disparities in Population at Risk of Severe Illness from COVID‐19 by Race/Ethnicity and Income.” American Journal of Preventive Medicine 59(1):137–9. [DOI] [PMC free article] [PubMed] [Google Scholar]
- Roberts, Mary Roduta , Reid Grace, Schroeder Meadow, and Norris Stephen P.. 2013. “Causal or Spurious? The Relationship of Knowledge and Attitudes to Trust in Science and Technology.” Public Understanding of Science 22(5):624–41. [DOI] [PubMed] [Google Scholar]
- Rocklöv, Joacim and Sjödi Henrik. 2020. “High Population Densities Catalyze the Spread of COVID‐19.” Journal of Travel Medicine 27(3):taaa038. [DOI] [PMC free article] [PubMed] [Google Scholar]
- Scala, Dante J. and Johnson Kenneth M.. 2017. “Political Polarization along the Rural‐Urban Continuum? The Geography of the Presidential Vote, 2000–2016.” Annals of the American Academy of Political and Social Science 672:162–84. 10.1177/0002716217712696. [DOI] [Google Scholar]
- Schuchat, Anne , and CDC Covid Response Team . 2020. “Public Health Response to the Initiation and Spread of Pandemic COVID‐19 in the United States, February 24–April 21, 2020.” Morbidity and Mortality Weekly Report 69(18):551–556. [DOI] [PMC free article] [PubMed] [Google Scholar]
- Ulrich‐Schad, Jessica , Givens Jennifer, and Wengreen Connor. 2020. ““Rural Utahns during the COVID‐19 Pandemic.” Rural Connections 13(2):9–12. [Google Scholar]
- Webster, R.G. , Shortridge K.F., and Kawaoka Y. 1997. “Influenza: Interspecies Transmission and Emergence of New Pandemics.” Immunology and Medical Microbiology 18(4):275–9. [DOI] [PMC free article] [PubMed] [Google Scholar]
- Wortham, Jonathan M. 2020. “Characteristics of Persons Who Died with COVID‐19—United States, February 12–May 18, 2020.” Morbidity and Mortality Weekly Report 69(28):923–29. [DOI] [PubMed] [Google Scholar]
- Wright, Lawrence . 2021. The Plague Year. New York: Alfred A. Knopf. [Google Scholar]
- Wu, Yi‐Chi , Chen Ching‐Sung, and Chan Yu‐Jiun. 2020. “The Outbreak of COVID‐19: An Overview.” Journal of the Chinese medical association 83(3):217–20. [DOI] [PMC free article] [PubMed] [Google Scholar]