Abstract
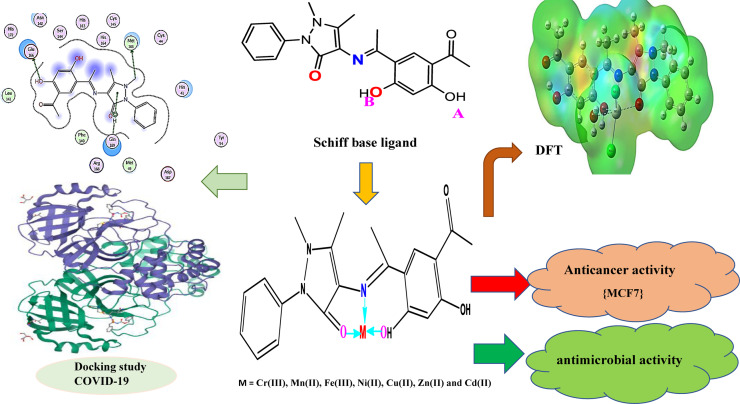
Mononuclear chelates of Cr(III), Mn(II), Fe(III), Ni(II), Cu(II), Zn(II) and Cd(II) resulted from new tridentate Schiff base ligand, 4‐((1‐(5‐acetyl‐2,4‐dihydroxyphenyl)ethylidene)amino)‐1,5‐dimethyl‐2‐phenyl‐1H‐pyrazol‐3(2H)‐one, were synthesized. Metal to ligand ratio was found to be1 : 1, which was revealed via elemental analysis and characterized via various spectroscopic tools. IR has point out that the coordination of the ligand towards the metal ions was carried out via NOO donor atoms. UV‐Vis, 1H NMR spectral data, molar conductivity measurements, BET surface area, melting points and theoretically through density function theory were used such as characterizing techniques in supporting further interpretation of the complexes structures. The complexes were octahedral except Cu(II) and Ni(II) complexes were tetrahedral as suggested from the magnetic moment measurement. The complexes were found to have surface area, pore volume and particle radius of 23–176 m2 g−1, 0.02‐0.33 cc/g and 8.71‐4.32 nm, respectively, as pointed out from BET measurement. Schiff base ligand and metal complexes were tested in vitro to estimate their antimicrobial activity opposed to Gram‐negative and Gram‐positive bacterial and fungal organisms. MOE 2008 was used headed for screen potential drugs with molecular docking by the protein sites of new coronavirus and the study was constructed to molecular docking without validation through MD simulations.
Keywords: Metal complexes, Schiff base ligand, spectroscopic analyses, Microbial and anticancer activity, molecular docking of COVID-19, density functional theory
1. Introduction
Schiff bases derived from the condensation of an amino and a carbonyl compound, form an important class of ligands that have the propensity to bind almost all metal ions via azomethine nitrogen. [1] The chemistry of Schiff bases has been discussed extensively over the past few decades due to the most versatile starting compounds in coordination chemistry, exhibit significant biological applications including antifungal, antibacterial, antiviral, anticancer and antioxidant activities.[ 2 , 3 ]
The excessive use of antimicrobial has been a major factor in the rise of drug‐resistant microbes, which remain a leading cause of death worldwide. Because of a lack of effective treatments, microbial infections cause serious problems to humankind. Therefore, to overcome the growing resistance of antimicrobial agents, researchers are developing new classes of antimicrobial drugs with adequate mechanisms. In recent years, transition metal complexes [4] have many clinical, biochemical, and pharmacological properties. [5]
A wide variety of pharmaceutical activities are available at different Schiff base metal complexes. For example, as a result of their biological properties, transition metal complexes with “N” and “O” Schiff base ligands are very important in supporting antibacterial, anticonvulsant, antifungal, anti‐inflammatory, antioxidative, antitumoral, analgesic and anthelmintic examples. [6] The bifunctional carbonyl compound namely 4,6‐diacetyl‐resorcinol (DAR) serves as precursor for the building of tridentate ligands. Over the past few years, 4,6‐diacetyl‐resorcinol had also received much attention towards the biological applications as well as the coordination chemistry.[ 7 , 8 ]
4‐Aminoantipyrine is a pyrazalone derivative, it has shown wide range of biological activities such as antimicrobial activity, analgesic, antiviral and also used as precursors in the synthesis of bioactive compounds i. e. β‐lactams. [9] The unwanted COVID‐19 outbreak driven by this highly infectious virus SARS‐CoV‐2 has spread its tentacles over the entire world and has taken millions of people under its cover. Everyday huge number of people loses their lives due to this deadly disease. [10] The ongoing 2019 coronavirus (COVID‐19), allegedly caused by so‐called severe acute coronavirus 2 (SARS‐CoV‐2) syndrome, is a significant cause of global serious health problems.
People commit themselves to staying at home either because of a compulsory local lock‐out guideline or because they are afraid that there is an apparently endless pandemic that should protect themselves. This is highly infecting viral infection from China has first been officially reported in most parts of the world on 31 December 2019[ 11 , 12 ].
In addition to their metallic complexes, this work aimed to synthesize the new Schiff base ligand. Many characterization tests have described in order to emphasize the structures of the complexes. Apart from anti‐breast cancer activities, in vitro antimicrobial was also screened. The binding affinity of the synthesized compounds towards the SARS‐CoV‐2 main protease with UAW247 crystal‐structure inhibitor (PDB‐ID: 6XBH) was examined by molecular docking study. Thus, docking research was aimed at this target. Based on results of molecular docking, the scoring function have calculated indicating the enthalpy contribution to the value of free binding energy (Affinity DG) for the best conformational positions; values of free binding energy and binding constants (EDoc kcal/mol and Ki uM (micromolar)) for a fixed conformational position of the ligand allowed to measure the stability of complexes formed between ligand and complexes and the corresponding protein target. [10]
2. Results and discussion
2.1. Characterization of Schiff base and metal complexes
Elemental analyses are conducted on the new Schiff base ligand, H2L. In addition to the melting points, the results of elemental analyses (N, H and C) are present in Table 1. The results obtained are consistent with the results calculated from the proposed formula. The sharp melting points represent the purity of the Schiff base ligand and complexes preparation. The preparation scheme for the Schiff base is set out in Scheme1. Additionally, the structure of this Schiff base is confirmed by IR and 1H NMR spectral analyses which will be discussed later in detail with the metal complexes. [15]
Table 1.
Analytical and physical data of Schiff base ligand (H2L) and its metal complexes.
|
Compound (Molecular Formula) |
Colour (%yield) |
M.p. (°C) |
% Found (Calcd.) |
Λm Ω−1mol−1 cm2 |
μeff (BM) |
|||
|---|---|---|---|---|---|---|---|---|
|
C |
H |
N |
M |
|||||
|
H2L |
orange (92) |
190 |
66.39 (66.42) |
5.49 (5.53) |
11.01 (11.07) |
– |
– |
– |
|
[Cr(H2L)(H2O)2Cl]Cl2 ⋅ 2H2O |
yellow (85) |
>300 |
41.28 (41.34) |
4.64 (4.76) |
6.72 (6.89) |
8.41 (8.53) |
113 |
3.99 |
|
[Mn(H2L)(H2O)2Cl]Cl ⋅ 2H2O |
brown (84) |
206 |
43.18 (43.66) |
4.99 (5.02) |
7.20 (7.27) |
9.39 (9.52) |
63 |
5.41 |
|
[Fe(H2L)(H2O)2Cl]Cl2 |
brown (83) |
>300 |
43.37 (43.61) |
4.29 (4.33) |
7.19 (7.27) |
9.56 (9.69) |
103 |
5.28 |
|
[Ni(H2L)(H2O)]Cl2 ⋅ 4H2O |
green (80) |
>300 |
42.01 (42.06) |
5.07 (5.17) |
7.00 (7.01) |
9.71 (9.85) |
107 |
4.39 |
|
[Cu(H2L)Cl]Cl ⋅ 2H2O |
Greenish blue (86) |
>300 |
45.73 (45.82) |
4.43 (4.55) |
7.22 (7.64) |
11.18 (11.55) |
74 |
2.8 |
|
[Zn(H2L)(H2O)Cl2] ⋅ 2H2O |
Dark brown (84) |
169 |
43.83 (44.23) |
4.63 (4.74) |
7.30 (7.37) |
11.37 (11.41) |
24 |
Diamagnetic |
|
[Cd(H2L)(H2O)Cl2] |
brown (85) |
158 |
43.25 (43.39) |
3.78 (3.96) |
7.21 (7.23) |
19.19 (19.35) |
9 |
Diamagnetic |
The new Schiff base ligand has an orange color and stable at room temperature. In DMF and DMSO solvents, it was soluble. The results obtained were in due agreement, depending on those determined in accordance with the proposed formula.
The structure of the Schiff base ligand was shown in scheme 1The metal‐to‐ligand ratio in all complexes which were achieved by estimating the carbon, hydrogen, nitrogen, and metal contents was supposed to be 1 : 1 (Table 1) and to be MH2L type. The results of the experimental elemental analyses for the complexes were close to the theoretical calculations (Table 1) depending on the formula proposed. [16]
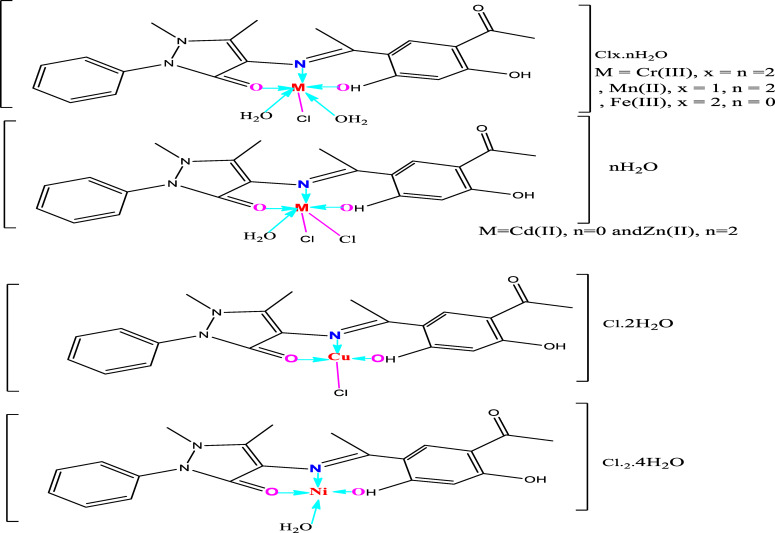
The structures of the metal complexes of the tridentate Schiff base ligand (H2L) were characterized through elemental analyses, molar conductivity, IR, 1H NMR, UV–Vis, mass and thermal analyses and their suggested structures were given in Figure 1.
Figure 1.
Structures of Schiff base metal complexes.
2.2. Composition and structure of Schiff base and its complexes
2.2.1. Infrared spectra
The data of the IR spectra of Schiff base ligand (H2L) and its mononuclear metal complexes were listed in Table (2). [14] H2L ligand showed an absence of the 4‐aminoantipyrin NH2 stretching band. Alternatively, a new strong and sharp vibration band was appeared at 1589 cm−1attributable to the azomethine group, ν(C=N), indicating the formation of the Schiff base ligand (H2L). IR spectra of the complexes exhibited shifts in the band related to the azomethine groups, ν(C=N), which refers to the coordination of this group to the metal ions. [19] The broad band of carbonyl groups, ν(C=O), of resorcinol and 4‐aminoantipyrine, was appeared at 1652 cm−1. [20] The IR spectra of the complexes showed two bands related to carbonyl of resorcinol and antipyrine in 1636–1652 and 1595–1636 cm−1, respectively. The slight shift in the resorcinol carbonyl group can accounted to the formation of a hydrogen bond with the adjacent hydrogen. The apparent shift in the antipyrine carbonyl group may be attributed to its participation in metal ions coordination. This was confirmed by the appearance of the stretching vibrations of the M−N and M−O bands in 421–459 cm−1 and in 546–599 cm−1 regions, respectively. [19] The IR spectra of the complexes showed broad bands at 3148–3264 and 3417–3439 cm−1 which could be allocated to ν(OH) of water molecules and v(OH) phenolic group. Also, the spectra showed peaks at 666–720 and 757–889 cm−1 due to the rocking (ρr(H2O)) and wagging (ρw(H2O)) vibrations of water molecules, respectively. However, a TG‐DTG analysis can further confirm the presence of various types of water molecules.[ 17 , 18 ]
Table 2.
IR spectra of H2L ligand and its metal complexes.
|
Assignment |
ν(OH) phenolic and H2O |
ν(C=N) azomethine |
ν(C=O) resorcinol |
ν(C=O) antipyrine |
ρr(H2O) and ρw(H2O). |
ν(M−O) |
ν(M−N) |
|---|---|---|---|---|---|---|---|
|
H2L |
– |
1589m |
1652br |
– |
– |
– |
|
|
[Cr(H2L)(H2O)2Cl]Cl2 ⋅ 2H2O |
3424br,3148br |
1531sh |
1643 m |
1620s |
757, 698 |
575 |
452 |
|
[Mn(H2L)(H2O)2Cl]Cl ⋅ 2H2O |
3428br,3192br |
1560s |
1636br |
839, 666 |
578 |
421 |
|
|
[Fe(H2L)(H2O)2Cl]Cl2 |
3417br,3165br |
1539m |
1648sh |
1595s |
840, 692 |
546 |
453 |
|
[Ni(H2L)(H2O)]Cl2 ⋅ 4H2O |
3429br |
1550s |
1626br |
876, 720 |
591 |
443 |
|
|
[Cu(H2L)Cl]Cl ⋅ 2H2O |
3425br,3244br |
1541sh |
1630sh |
1601s |
836, 694 |
599 |
429 |
|
[Zn(H2L)(H2O)Cl2] ⋅ 2H2O |
3439br,3264br |
1579s |
1651sh |
1620s |
840, 699 |
579 |
459 |
|
[Cd(H2L)(H2O)Cl2] |
3421br |
1587m |
1652sh |
1630s |
889, 696 |
590 |
448 |
2.2.2. 1H NMR spectral study
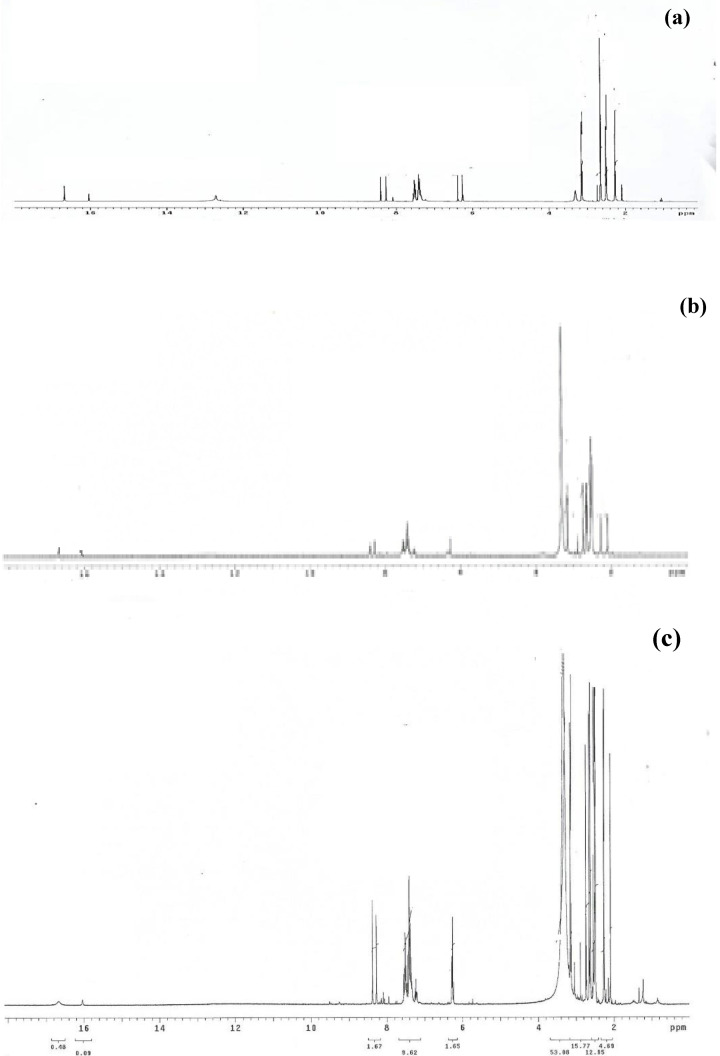
In addition to its purity, the ligand structure was supported by 1H NMR spectral data (δ ppm) carried out for the free ligand using TMS (0 ppm) and DMSO‐d6 solvent. Two phenolic OHa and OHb protons, respectively, can be assigned to the signals seen at 16.10 and 16.73 ppm. Also, the free ligand spectrum (H2L) showed a multiple signal at 6.27–8.41 ppm region that can be assigned to the aromatic protons (m,7H, Ar−H). The ligand spectrum showed overlapping singlets at 2.26‐3.13 ppm for methyl protons (s, 12H, 4CH3).[ 11 , 14 , 18 ] The lack of a peak for the −NH2 group at around 4 ppm indicated the production of the most wanted product. [22]
The 1H NMR spectral (δ ppm) data of Cd(II) and Zn(II) complexes showed phenolic OHa protons at 16.10 and 16.11 ppm and OHb protons at 16.67 and 16.70 ppm for Cd(II) and Zn(II) complexes, respectively. The phenolic OHb proton was slightly shifted from its position in the free ligand which indicated that OHb participated in coordination to the metal ions without proton displacement. While the phenolic OHa proton appeared in the same position of the free ligand confirming its non‐involvement in chelate formation. In the aromatic region, the spectra showed overlapping signals at the range of 6.27–8.40 and 6.27–8.38 ppm for Zn(II) and Cd(II) complexes, respectively. The methyl protons were found in the aliphatic region (m, 12H, 4CH3) as overlapping singlet signals observed in the range of 2.10–3.50 and 2.09–3.31 ppm for Cd(II) and Zn(II) complexes, respectively. [23]
The data of the 1H NMR spectra of Schiff base ligand (H2L) and its mononuclear metal complexes are shown in Figure 2.
Figure 2.
1H NMR spectra of (a) H2L, (b) Zn(II) and (c) Cd(II) complexes.
2.2.3. Molar conductivity measurement
The molar conductivity of the metal complexes was determined with the aid of DMF as a solvent (Table1). The molar conductivity was found within the 9–113 Ohm−1cm2mol−1 range. The molar conductivity values of the complexes showed their electrolytic nature except for the Zn(II) and Cd(II) complexes, which are non‐electrolytes (Table 1). [24]
2.2.4. Electronic spectra and magnetic properties of prepared complexes
Magnetic susceptibility measurements and diffused reflectance spectral data were used to infer the structures of the complexes. The effective magnetic moment (μeff) values were also used to predict the geometry of complexes at room temperature.
The electronic spectra of the ligand and metal complexes were carried out in DMF as a solvent within the wavelength range from 200 to 700 nm. Only one high‐intensity peak at 395 nm was detected in the UV‐Vis spectrum of the prepared Schiff base ligand. This peak can be accounted to the π→π* transition of the azomethine group. This peak was shifted in the spectra of complexes to lower wavelengths in the range of 337–378 nm. This shift can attribute to the coordination of the azomethine group in the Schiff base ligand to metal ions. [25]
The Cr(III) complex was equivalent to three unpaired electrons, i. e. has μeff 3.99 B.M. corresponding to high‐spin chromium(III) octahedral complexes.[ 25 , 26 ] The Cr(III) complex displays bands at 17,953, 25,169, 26,436, and 39,525 cm−1, respectively. These bands may be ascribed to 4B1g→4Eg, 4B1g→4B2g, 4B1g→4Ebg and 4B1g→4A1g transitions, respectively, resulting from an increase in the energy degeneration of orbital triplet in octahedral geometry.[ 25 , 26 ]
The high‐spin octahedral Mn(II) complex has magnetic moment equivalent to five unpaired electrons (i. e., 5.41 B.M). The diffused reflectance spectrum of the Mn(II) complex displayed three bands at 17,801, 21,942 and 24,492 cm−1. These bands may be attributed to 6A1g→4T1g(G); 6A1g→4T2g(G) and 6A1g→4T1g(P) transitions, respectively. The ligand field bands and magnetic moment value therefore support an octahedral geometry of the Mn(II) complex.[ 14 , 27 ]
The Fe(III) complex had magnetic moment value of 5.28 B.M. ascribed for high‐spin octahedral Fe(III) complexes. [14] Three bands were observed in the solid reflectance spectrum at 22,127, 19,897 and 17,035 cm−1. These bands may be ascribed for 4T2g(G)→6A1g, 4T2g(G)→6A1g and 4T1g(D)→6A1g transitions, respectively. [14] Ni(II) complex had magnetic moment of 3.33 B.M which equivalent to two unpaired electrons. Bands found in the diffused reflectance spectrum at 12,219, 17,002 and 23,122 cm−1 were accounted for 3A2(F)→3T2(F), 3A2(F)→3T1(F) and 3A2(F)→3T1(P) transitions, respectively. The bands position and magnetic moment value ascertained the tetrahedral geometry[ 26 , 28 ].
Diffused reflectance spectrum of the Cu(II) complex displays bands at 10,842, 19,765 and 29,928 cm−1. First two bands may be ascribed to the transitions: 2B1g→2A1g (dx 2‐y 2→dz 2) and 2B1g→2B2g (dx 2‐y 2→dzy), respectively. The third band may be due to charge transfer. Also, the magnetic moment value of the Cu(II) complex is 2.80 B.M. which equivalent to the presence of one unpaired electron which is consistent with tetrahedral geometry. This indicated the formation of tetrahedral geometry of the complex.[ 14 , 26 , 28 , 29 ]
In general, octahedral‐geometry was proposed for Zn(II) and Cd(II) complexes and due to its fully filled d10 orbital, there were no d‐d electronic transitions.[ 14 , 28 ]
2.2.5. Geometry optimization
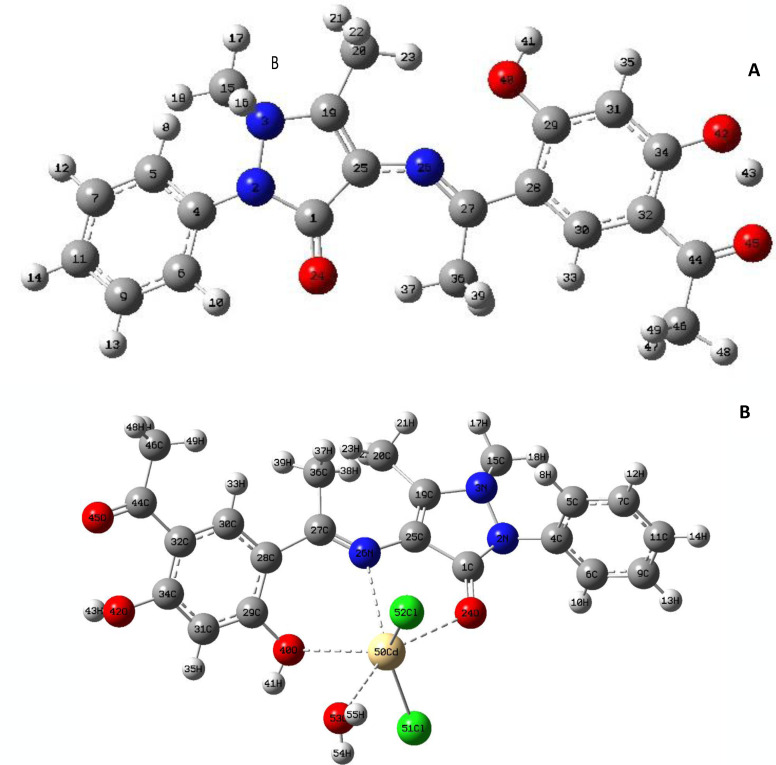
Figure 3 shows the fully optimized geometries of the H2L ligand plus its Cd(II) complex. Distorted octahedral geometry around the Cd(II) ion was suggested as deduced from the selected bond lengths and bond angles calculated for Cd(II) complex and Schiff base ligand (Table 3). The bond lengths of C(25)−N(26), C(1)−O(24) and C(29)−O(40) were 1.47, 1.25 and 1.43, respectively, in the ligand. They showed a small elongation upon coordination to Cd(II) ion and found to be 1.50, 1.33 and 1.45 A°, respectively. In the Cd(II) complex, the ligand (H2L) coordinated by azomethine nitrogen, carbonyl oxygen and phenolic oxygen, while two chloride ions and coordinated water oxygen took up other three positions. As previously stated, the bond angles in the Cd(II) coordination sphere were investigated the octahedral geometry. Intramolecular hydrogen connections can be attributed to the reduction of the metal chloride angles.[ 11 , 14 , 30 ]
Figure 3.
The optimized structures of (A) H2L and (B) Cd(II) complex.
2.2.6. Molecular electrostatic potential (MEP)
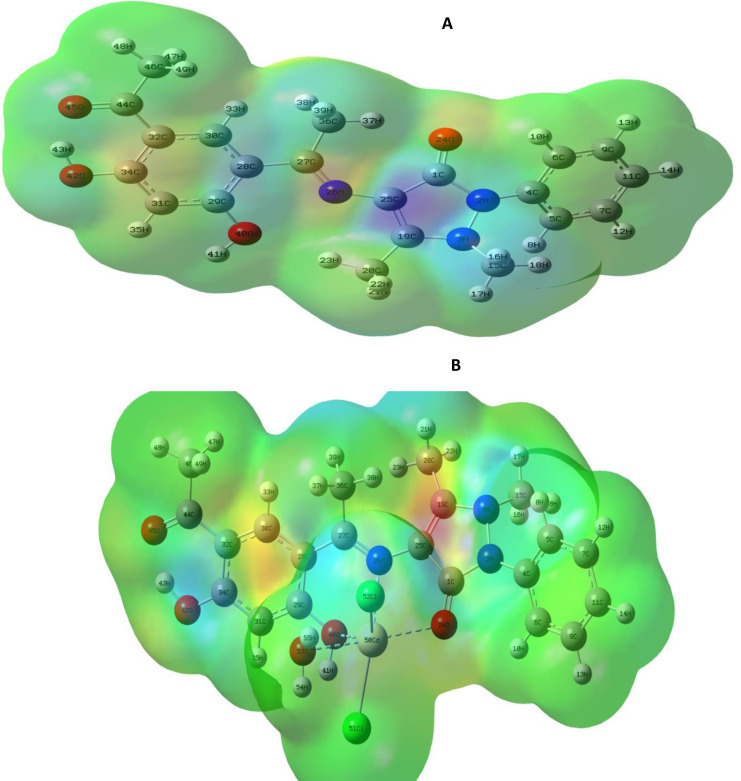
To study the reactions, electrostatic potential V(r) maps were calculated which are known for the identification of the electronic charge distribution around molecular surface and subsequently to predict the expected sites for the reactions. These graphs are calculated using the same set of bases as optimized. In this study, a 3D MEP map of the ligand and its Cd(II) complex was drawn (Figure 4). According to MEP, it can generally sort the red electronic‐rich areas on the map (favorable for sites that are electrophilic attack). However, the electron‐deficient area is blue (a favorable position for nucleophilic attack). But the green area points to the area of neutral electrostatic potential. H2L is stable and has an approximately uniform charge density distribution. However, the two oxygen and nitrogen atoms are surrounded by a larger negatively charged surface, making these sites potentially more suitable for electrophilic attack (red). (Figure 4). [14]
Figure 4.
Molecular electrostatic potential map of (A) H2Land (B)[Cd(H2L)(H2O)Cl2]complex. The electron density isosurface is 0.004 a.u.
In terms of electron density, the aromatic ring appears to be neutral. This potential distribution leads to the complexation reaction, which is further confirmed by the electrostatic potential distribution of the Cd(II) complex, where the largest negative charge is surrounded by the metal center (Figure 4b). In addition to the increase of the electron negative capacity of oxygen and nitrogen in Cd(II) complex than free H2L, the Mulliken electron negative is the favored location for electrical attacks with metal ion.[ 11 , 14 , 30 ]
2.2.7. Molecular parameters
In continuation to our work, [6] Table 3 lists the different geometrical parameters of the free H2L ligand with its Cd(II) complex. It can conclude that, the Cd(II) complex displayed high dipole values compared to the free ligand. The main orbital elements participating in chemical stability were the highest occupied molecular orbital (HOMO) and the lowest unoccupied molecular orbital (LUMO). The HOMO is an electron donation capability, LUMO is an electron accepting device, it is an electron donation capability. It can assume from the achieved data that the HOMO and LUMO energies of Cd(II) complex were negative, and more negative than free H2L, confirming lonely complex stability. The EHOMO and ELUMO values of Cd(II) complex have been calculated and show that the Cd(II)–H2L bond strength is lower than the free ligand. The total energy of Cd(II) complex is larger than the free ligand, and the consistency of the solid lonely complex is highly evident. The little energy divide can be linked to a high chemical reactivity, low kinetic stability, and the highly polarizing molecule mirror to active electronic charge transfer interaction. Azomethine nitrogen and oxygen were usually located at the HOMO levels of the ligand phenol groups, which indicated the preferred places of nuclear attack against the central metal atom. H2L and its Cd(II) complex contains different optimized and quantum chemical parameters (Table 3).[ 11 , 13 , 14 ]
Table 3.
The different optimized and quantum chemical parameters of H2L and its Cd(II) complex.
|
Bond lengths (Å) |
H2L |
[Cd(H2L)(H2O)Cl2] |
|---|---|---|
|
C(1)−N(2) |
1.46 |
1.47 |
|
C(1)−O(24) |
1.25 |
1.33 |
|
N(2)−N(3) |
1.41 |
1.43 |
|
N(2)−C(4) |
1.47 |
1.47 |
|
N(3)−C(15) |
1.47 |
1.47 |
|
N(3)−C(19) |
1.50 |
1.49 |
|
C(25)−N(26) |
1.46 |
1.50 |
|
N(26)−C(27) |
1.31 |
1.31 |
|
C(29)−O(40) |
1.43 |
1.45 |
|
C(34)−O(42) |
1.43 |
1.43 |
|
O(40)−H(41) |
0.96 |
0.96 |
|
O(42)−H(43) |
0.96 |
0.96 |
|
C(44)−O(45) |
1.26 |
1.26 |
|
Cd(50)−Cl(51) |
— |
2.40 |
|
Cd(50)−Cl(52) |
— |
2.40 |
|
Cd(50)−O(53) |
— |
3.11 |
|
O(40)−Cd(50) |
— |
3.06 |
|
N(26)−Cd(50) |
— |
3.06 |
|
O(24)−Cd(50) |
— |
3.08 |
|
Bond angles (o) |
|
|
|---|---|---|
|
O(24)−Cd(50)−O(40) |
— |
114 |
|
O(24)−Cd(50)−Cl(52) |
— |
89 |
|
N(26)−Cd(50)−Cl(52) |
— |
93 |
|
O(40)−Cd(50)−Cl(51) |
— |
90 |
|
O(40)−Cd(50)−O(53) |
— |
94 |
|
Cl(51)−Cd(50)−O(53) |
— |
86 |
|
The calculated quantum chemical parameters | ||
|---|---|---|
|
E (a.u.) |
−1270.99 |
−7705.93 |
|
Dipole moment (Debye) |
4.60 |
13.75 |
|
EHOMO (eV) |
−5.51 |
−6.10 |
|
ELUMO (eV) |
−1.70 |
−2.30 |
|
Δ E (eV) |
3.81 |
3.80 |
|
χ (eV) |
−3.61 |
−4.20 |
|
η (eV) |
1.91 |
1.90 |
|
σ (eV)−1 |
0.52 |
0.53 |
|
Pi (eV) |
3.61 |
4.20 |
|
S (eV)‐1 |
0.26 |
0.26 |
|
ω (eV) |
3.41 |
4.64 |
|
▵Nmax |
1.89 |
−2.21 |
2.2.8. UV‐Vis spectra
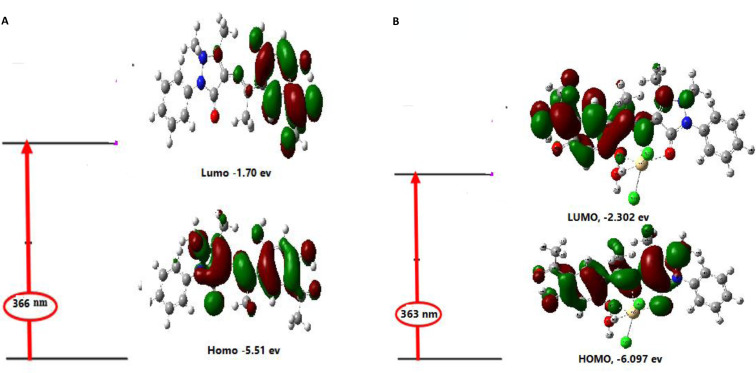
Explaining the photochemistry of transition metal compounds requires understanding the properties of molecular orbitals and appropriate excited states. Boundary orbitals play a relevant role in such systems because they control the electronic excitation and transition properties. With the help of TD‐DFT calculations, the contribution of ligands and metal orbitals to molecular orbitals can be fed back. It is impractical to analyze all electronic transitions and orbitals; therefore, some restrictions are used. Due to the high accuracy and low computational cost of TD‐DFT, it has become popular in the theoretical research of molecular electronic spectroscopy. At present, the exploration of the low‐level excited state in the optimized ground state structure of H2L and its Cd(II) complex has been carried out on the theoretical level of TD‐DFT / B3LYP / LANL2DZ thirty singlet states. In Table 4, the experimental and theoretical electronic spectra are given. The TD‐DFT calculation has been evaluated in the solvent background of N,N dimethylformamide and matched the experimental data.
Table 4.
Main calculated optical transition with composite ion in terms of molecular orbitals.
|
Compound |
Transition |
Excitation energy (ev) |
λmax Calc. (nm) |
λmax exp. (nm) |
Oscillating strength |
|---|---|---|---|---|---|
|
H2L |
HOMO LUMO |
3.39 |
366 |
395 |
0.147 |
|
[Cd(H2L)Cl2(H2O)] |
HOMO LUMO |
3.42 |
363 |
340 |
0.142 |
Figure 5a, b shows the transition between the orbitals between the limits of the wavelength corresponding to the maximum intensity of the oscillator of the simulation results and the contemporary experimental observations. For example, the calculated peak for H2L ligand obtained at 366 nm match to experimental peak at 395 nm. This transition has been majorly contributed from HOMO to LUMO transitions which were primarily π→π* in nature. The various transitions and their experimental matching part of the free ligand and its Cd(II) complex have been summarized in Table 4.[ 11 , 13 , 14 ]
Figure 5.
a) Theoretical electronic absorption transitions for H2L in ethanol solvent. b) Theoretical electronic absorption transitions for Cd(II) complex in DMF solvent.
2.2.9. Thermogravimetric Analysis
Thermogravimetric analysis (TGA) of new Schiff base ligand and its metal complexes were carried out in nitrogen atmosphere at a heating rate of 10 °C /min from room temperature (30 °C) to 1000 °C.
The thermal stabilities of these nine compounds are slightly different. The thermal decomposition process of novel Schiff base ligand (C21H21N3O4), concerned three steps of weight loss, as shown in Table 5. A primal two step weight loss of 37.69 % (calcd. mass loss 37.25 %) is observed in the temperature range of 30 °C to 330 °C, on account of the decomposition of the C10H21 molecule. The last step shows a weight loss of about 60.17 % (calcd. mass loss 62.75 %) in the range of 330–900 °C, on account of the decomposition of the C11N3O4 molecule.
Table 5.
Thermoanalytical results (TG and DTG) of Schiff base ligand (H2L) and its metal complexes.
|
Complex |
TG range (°C) |
DTGmax (°C) |
n* |
Mass loss Total mass loss Estim (Calcd) % |
Assignment |
Residues |
|---|---|---|---|---|---|---|
|
H2L |
30–330 330–900 |
195, 255 400 |
2 1 |
37.69 (37.25) 60.17 (62.75) 97.69 (100.00) |
‐ Loss of C10H21. ‐ Loss of C11N3O4. |
|
|
[Cr(H2L)(H2O)2 Cl]Cl2 ⋅ 2H2O |
30–120 120–900 |
66 218, 700, 810 |
1 3 |
5.64 (5.90) 69,70 (71.31) 75.34 (77.21) |
‐ Loss of 2H2O. ‐ Loss of 1.5Cl2, 2H2O and C16H22N3O2.5. |
1/2Cr2O3+5C |
|
[Mn(H2L)(H2O)2Cl]Cl ⋅ 2H2O |
30–375 375–900 |
71, 125, 155 379, 812 |
3 2 |
34.50 (34.81) 41.62 (42.43) 76.12 (77.24) |
‐ Loss of Cl2,4H2O, C4H10. ‐ Loss of C12H11N3O3. |
MnO+5C |
|
[Fe(H2L)(H2O)2Cl]Cl2 |
30–900 |
139, 204 |
2 |
78.15 (77.78) 78.15 (77.78) |
‐ Loss of 1.5Cl2, 2H2O and C17H21N3O2.5. |
1/2Fe2O3+4C |
|
[Ni(H2L)(H2O)]Cl2 ⋅ 4H2O |
30–250 250–900 |
73, 157 183, 424 |
2 2 |
27.29 (26.87) 50.91 (50.74) 78.2 (77.61) |
‐ Loss of 5H2O, Cl2. ‐ Loss of C16H21N3O3. |
NiO+5C |
|
[Cu(H2L)Cl]Cl ⋅ 2H2O |
30–135 135–900 |
68 169, 270, 550 |
1 3 |
6.56 (6.55) 69.02 (70.19) 75.58 (76.74) |
‐ Loss of 2H2O. ‐ Loss of Cl2, C17H21N3O3. |
CuO+4C |
|
[Zn(H2L)(H2O)Cl2] ⋅ 2H2O |
30–180 180–365 365–900 |
61, 155 178, 285 464, 800 |
2 2 2 |
9.47 (9.48) 19.77 (20.89) 43.44 (42.67) 72.68 (73.02) |
‐ Loss of 3H2O. ‐ Loss of Cl2, 3CH4 ‐ Loss of C12H9N3O3 |
ZnO+6C |
|
[Cd(H2L)(H2O)Cl2] |
30–160 160–245 245–480 480–900 |
132 217 268 561, 833 |
1 1 1 2 |
3.65 (3.10) 11.83 (12.22) 24.70 (24.45) 33.30 (32.03) 73.48 (71.80) |
‐ Loss of H2O. ‐ Loss of Cl2. ‐ Loss of C10H 21. ‐ Loss of C7N3O3. |
CdO+4C |
* n=number of decomposition steps.
The [Cr(H2L)(H2O)2Cl]Cl2 ⋅ 2H2O complex concerned four procedures of weight loss, as shown in Table 5. A primal weight loss of 5.64 % (calcd. mass loss 5.90 %) is observed in the temperature range of 30 °C to 120 °C, on account of the decomposition of the two uncoordinated water molecules. The last three steps show weight loss of about 69.70 % (calcd. mass loss 71.31 %) in the range of 120–900 °C, on account of the decomposition of two water, 3/2 Cl2 and C16H22N3O2.5 molecules.
The [Mn(H2L)(H2O)2Cl]Cl ⋅ 2H2O complex concerned five steps of weight loss, as shown in Table 5. A primal three weight loss of 34.50 % (calcd. mass loss 34.81 %) is observed in the temperature range of 30 °C to 375 °C, on account of the decomposition of the four water, Cl2 and C4H10 molecules. The last two steps show weight loss of about 41.62 % (calcd. mass loss 42.43 %) in the range of 375–900 °C, on account of the decomposition of C12H11N3O3 molecule.
The [Fe(H2L)(H2O)2Cl]Cl2 complex concerned two steps of weight loss, as shown in Table 5. A total weight loss of 78.15 % (calcd. mass loss 77.78 %) is observed in the temperature range of 30 °C to 900 °C, on account of the decomposition of the 2H2O, Cl2 and C17H21N3O2.5 molecules.
The [Ni(H2L)(H2O)]Cl2 ⋅ 4H2O complex concerned four steps of weight loss (Table 5). A primal two weight loss of 27.29 % (calcd. mass loss 26.87 %) is observed in the temperature range of 30 °C to 250 °C, on account of the decomposition of the five water and Cl2 molecules. The last two steps show weight loss of about 50.91 % (calcd. mass loss 50.74 %) in the range of 250–900 °C, on account of the decomposition of C16H21N3O3 molecule.
The [Cu(H2L)Cl]Cl ⋅ 2H2O complex concerned four steps of weight loss (Table 5). A primal weight loss of 6.56 % (calcd. mass loss 6.55 %) is observed in the temperature range of 30 °C to 135 °C, on account of the decomposition of the two uncoordinated water molecules. The last three steps show weight loss of about 69.02 % (calcd. mass loss 70.19 %) in the range of 135–900 °C, on account of the decomposition of Cl2 and C17H21N3O3 molecules.
The [Zn(H2L)(H2O)Cl2] ⋅ 2H2O complex concerned six steps of weight loss (Table 5). A primal two weight loss of 9.47 % (calcd. mass loss 9.48 %) is observed in the temperature range of 30 °C to 180 °C, on account of the decomposition of the three water molecules. The next two steps show weight loss of about 19.77 % (calcd. mass loss 20.89 %) in the range of 180–365 °C, on account of the evolution of Cl2 and 3CH4 molecules. The last two steps show weight loss of about 43.44 % (calcd. mass loss 42.67 %) in the range of 365–900 °C, on account of the decomposition of C12H9N3O3 molecule.
The [Cd(H2L)(H2O)Cl2] complex concerned five decomposition steps as shown in Table 5. A primal weight loss of 3.65 % (calcd. mass loss 3.10 %) is observed in the temperature range of 30 °C to 160 °C, on account of the decomposition of the one water molecule. The second step shows a weight loss of about 11.83 % (calcd. mass loss 12.22 %) in the range of 160–245 °C, on account of the evolution of Cl2 molecule. The third step shows a weight loss of about 24.70 % (calcd. mass loss 24.45 %) in the range of 245–480 °C, on account of the evolution of C10H21 molecule. The last two steps show weight loss of about 33.30 % (calcd. mass loss 32.03 %) in the range of 480–900 °C, on account of the decomposition of C7N3O3. molecule.
The thermograms of the complexes revealed their tentative structures and confirmed the presence of uncoordinated water molecules in all metal complexes except Cd(II) complex.
2.2.10. Mass spectral study
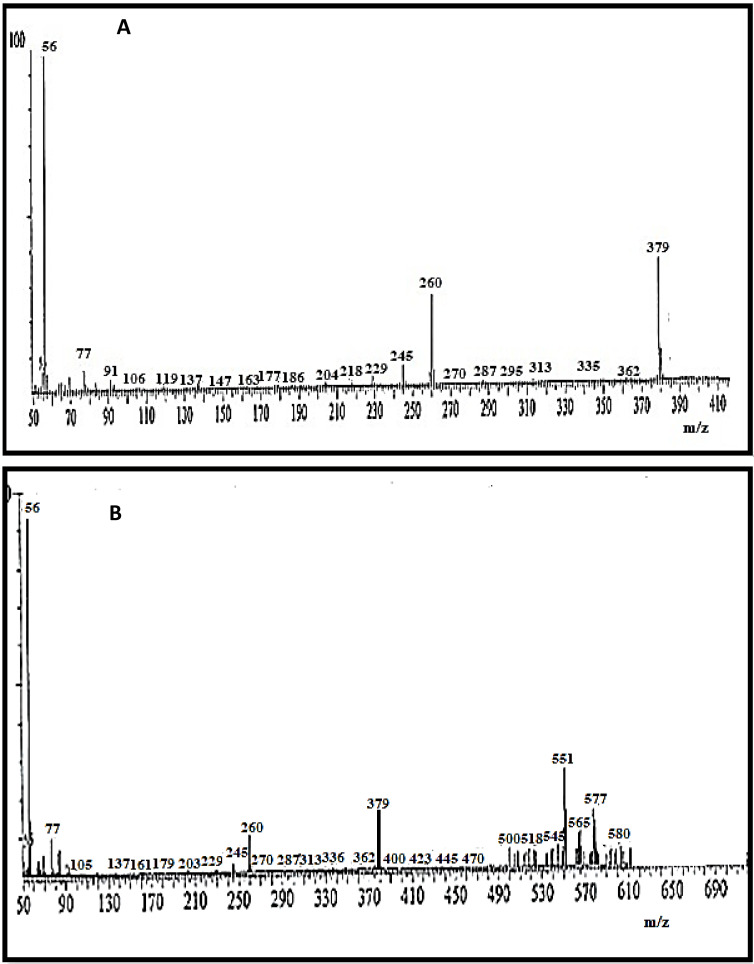
The H2L ligand mass spectrum showed a molecular ion peak at m/z=379 amu which matches well with the suggested formula[C21H21N3°4]+ with calculated molecular weight of 379.43 g/mole. A molecular ion peak at m/z=580.5 amu was found in the mass spectrum complex Cd(II), which was coextensive by calculated molecular weight of 580.8 g/mole. Hence, the stoichiometry of this complex is [Cd(H2L)(H2O)Cl2]. The peak corresponding to the parent ligand, on the other hand, seemed at m/z 379 amu in the mass spectrum of the Cd(II) complex confirming the complex formation. Figure 6 showed the mass spectra of Schiff base ligand and Cd(II) complex. [14]
Figure 6.
Mass spectra of (A) H2L ligand and (B) [Cd(H2L)(H2O)Cl2]complex.
2.2.11. BET surface area
The BET measurements (Table 6) were carried out in the direction of determining the surface area of the metal complexes. The obtained data showed high surface area, which was found in the range of 23–176 m2 g−1. It is to be observed that the high surface area, might be contributed to the mesoporous structure and nano size of the particles with average particle radius of 4.32–8.71 nm. [31] Surface area and pore volume values estimated through nitrogen adsorption isotherms by relative pressures (p/p°) are given in Table 6. The micropore volumes and SBET values of synthesized complexes showed an excessively large decrease in pore volume (0.33–0.02 cc/g) and surface area (200–13 m2/g). [32]
Table 6.
BET surface area and band gaps of metal chelates.
|
Samples |
SBET (m2/g) |
Pore volume (cc/g) |
Average Particle radius (nm) |
BET surface area (m2 g−1) |
Band gap energy (eV) |
Average Pore Size (nm) |
|---|---|---|---|---|---|---|
|
[Cr(H2L)(H2O)2Cl]Cl2 ⋅ 2H2O |
119 |
0.20 |
7.75 |
176 |
3.41 |
2.28 |
|
[Mn(H2L)(H2O)2Cl]Cl ⋅ 2H2O |
90 |
0.15 |
4.32 |
118 |
3.41 |
2.57 |
|
[Fe(H2L)(H2O)2Cl]Cl2 |
13 |
0.02 |
5.83 |
23 |
3.68 |
1.95 |
|
[Ni(H2L)(H2O)]Cl2 ⋅ 4H2O |
51 |
0.09 |
5.32 |
95 |
3.14 |
2.02 |
|
[Cu(H2L)Cl]Cl ⋅ 2H2O |
79 |
0.14 |
8.71 |
156 |
3.44 |
1.73 |
|
[Zn(H2L)(H2O)Cl2] ⋅ 2H2O |
200 |
0.33 |
6.10 |
83 |
3.69 |
7.85 |
|
[Cd(H2L)(H2O)Cl2] |
77 |
0.13 |
7.96 |
63 |
3.66 |
4.08 |
2.2.12. Antimicrobial assays
An in‐vitro antibacterial activity outcome of the Schiff base ligand and metal complexes were tested opposed to the Gram‐negative (E. coli) and the Gram‐positive (S. aureus) bacterial strains and in vitro antifungal activity results opposed to C. albicans and A. flavus through well diffusion method were studied [33] and the results are shown in Table 7.
Table 7.
Biological activity of Schiff base ligand (H2L) and its metal complexes.
|
Sample |
Inhibition zone diameter (mm/mg sample) |
||||
|---|---|---|---|---|---|
|
|
Bacterial species |
Fungal species |
|||
|
|
G+ |
G− |
|
|
|
|
|
Staphylococcus aureus |
Escherichia coli |
Aspergillus flavus |
Candida albicans |
|
|
Control: DMSO |
0.0 |
0.0 |
0.0 |
0.0 |
|
|
Standard |
Amikacin Antibacterial agent |
10 |
6 |
– |
– |
|
|
ketokonazole Antifungal agent |
– |
– |
8 |
9 |
|
H2L |
12 |
14 |
0 |
10 |
|
|
[Cr(H2L)(H2O)2Cl]Cl2⋅2H2O |
9 |
9 |
0 |
0 |
|
|
[Mn(H2L)(H2O)2Cl]Cl⋅2H2O |
10 |
11 |
0 |
0 |
|
|
[Fe(H2L)(H2O)2Cl]Cl2. |
11 |
13 |
14 |
12 |
|
|
[Ni(H2L)(H2O)]Cl2⋅4H2O |
16 |
15 |
0 |
19 |
|
|
[Cu(H2L)Cl]Cl⋅2H2O |
14 |
14 |
0 |
0 |
|
|
[Zn(H2L)(H2O)Cl2]⋅2H2O |
14 |
14 |
0 |
10 |
|
|
[Cd(H2L)(H2O)Cl2] |
20 |
24 |
11 |
20 |
|
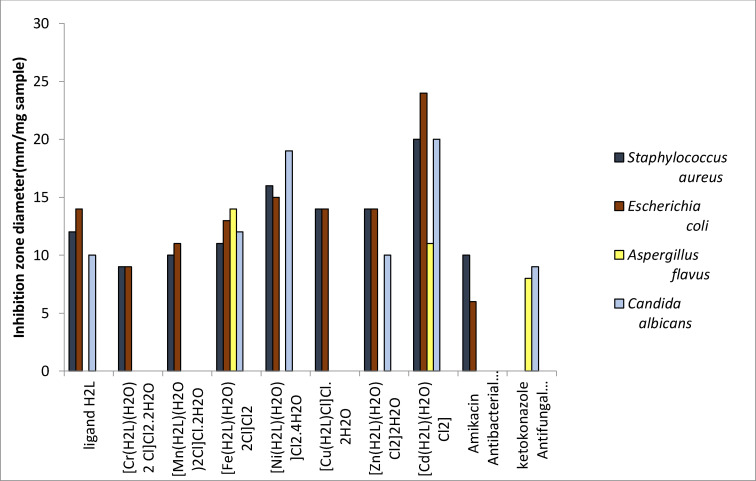
A comparative study of the Schiff base and its complexes reveals a greater antimicrobial activity of the metal complexes than the parent Schiff base ligand (Figure 7). This is because metal chelates are reduced by ligand coordination, which increases their lipophilicity and thus increases the spread of metal ion via the membrane. The chelating effect therefore renders the metal complex like strong antibacterial agents, inhibiting the growth of microorganisms or destroying their active sites.[ 35 , 36 ]
Figure 7.
Biological activity of Schiff base ligand (H2L) and its metal complexes.
The behavior of the prepared Schiff base ligand and its metal complexes was demonstrated through calculating the activity index using the following relation:
Activity index (A)=Inhibition Zone of compound m /Inhibition Zone of standard drug mm×100.
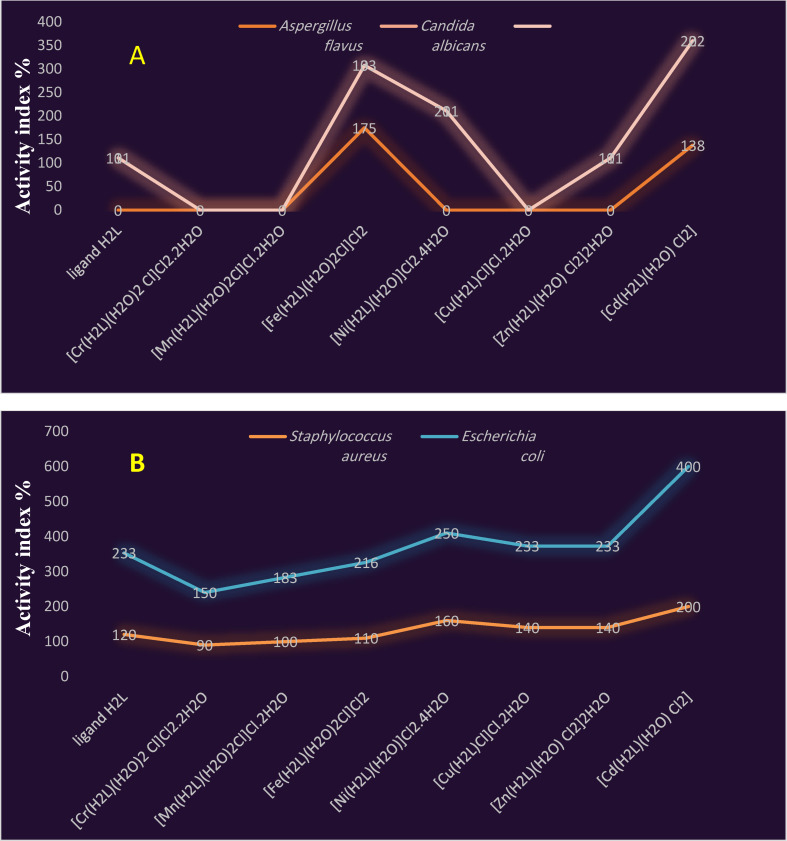
The data obtained were shown in Figure 8(a,b). Lastly, the order of rising bacterial and fungal growth inhibitory capacity is in the following order:
Figure 8.
Activity index of Schiff base ligand (H2L) and its metal complexes against (A) different fungal (B) different Gram (+ve) and Gram (−ve) bacteria.
For E. coli: Cr(III)<Mn(II)<Fe(III)<H2L=Zn(II)=Cu(II)<Ni(II)<Cd(II),
For S. aureus: Cr(III)<Mn(II)<Fe(III)<H2L<Zn(II)=Cu(II)<Ni(II)<Cd(II),
For Candida albicans: H2L=Zn(II)<Fe(III)<Ni(II)<Cd(II)
and For Aspergillus flavus: Cd(II)<Fe(III).
Results obtained emphasize that, the metal complexes exhibited higher antimicrobial activity than the free ligand. In addition, the maximum zones of inhibition were obtained in Fe(III) complex with 14 mm zone of inhibition against Aspergillus flavus, Cd(II) complex with 20 mm against S. aureus and Cd(II) complex with 24 and 20 mm against E. coli and Candida albicans, respectively. [35]
Just before assess the biological profile, an additional series of antimicrobial agents based on metal complexes of [(1E)‐1‐(2‐hydroxyphenyl)ethylidene]‐2‐oxo‐2H‐chromene‐3‐carbohydrazide Schiff base ligand possessing a NOO donor sites was synthesized and in detail analyzed. Its Cd(II) complex showed the maximum zone of inhibition 18 and 20 mm against E. coli and Staphylococcus aureus cells compared to reported [Cd(H2L)(H2O)Cl2] complex which showed nearly the same zone of inhibition 24 and 20 mm against the same organisms.[ 36 , 37 ] For the same Schiff base ligand, Fe(III) complex showed the maximum zone of inhibition 14 mm against Aspergillus flavus which is the same to the reported [Fe(H2L)(H2O)2Cl]Cl2 against the same organism. [38]
Also, another series of antimicrobial agents based on metal complexes previously prepared with 2‐(((1,5‐dimethyl3‐oxo‐2‐phenyl‐2,3‐dihydro‐1H‐pyrazol‐4‐yl)imino)(phenyl)methyl)benzoic acid Schiff base ligand, its Cd(II) complex showed the maximum zone of inhibition (20 mm) against Candida albicans which is similar to [Cd(H2L)(H2O)Cl2] complex reported herein. [13]
The metal complexes had the highest antimicrobial activity in contrast with the Schiff base ligand. The difference in activity can account to the difference in nature and coordination sites of the ligand coordinated to metal ions. Chelation also improves the lipophilicity of a metal ion, and the entire rupture in the cells describes the complete cell rupture as caused by the oxidative stress on the microbial cell entering the nucleus, thus deteriorating the chromosomal DNA through the cellular inhibition of protein synthesis. [36]
2.2.13. Anticancer effects of Schiff base and its complexes
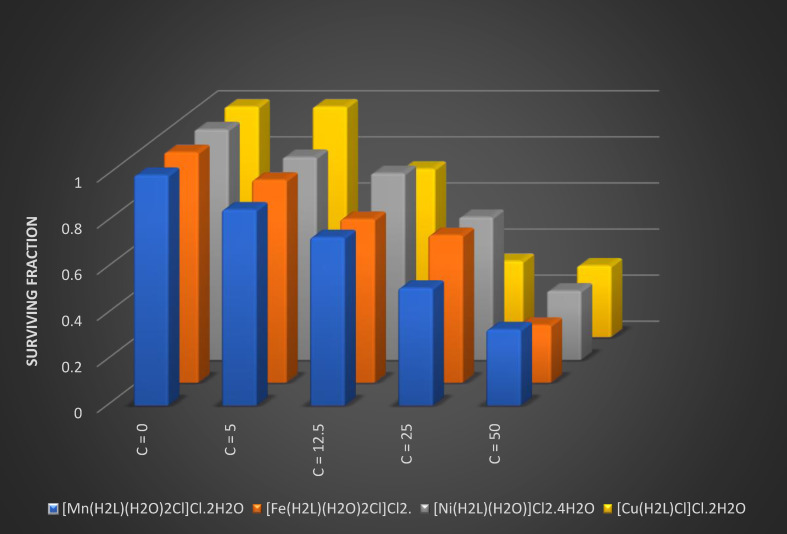
Several concentrations were used to screen the anti‐cancer effect of the new Schiff base ligand and its complexes on the human breast carcinoma (MCF‐7). Details were provided in Table 8 which provides the anticancer effects of the compounds at 100 μg/ml. The proportion of cell inhibition and IC50 values of the complexes have been found to be higher sensitive to the breast cancer cell lines than the free ligand (Figure 9). [33]
Table 8.
Anticancer effects of Schiff base ligand and its metal complexes in terms of % Cell Inhibition at 100 μg/ml concentration.
|
Samples |
% Cell Inhibition |
Surviving fraction (MCF7) |
IC 50 (μg/ml) |
||||
|---|---|---|---|---|---|---|---|
|
0.0 |
5.0 |
12.5 |
25 |
50 |
|||
|
H2L |
64 |
|
|
|
|
|
– |
|
[Cr(H2L)(H2O)2Cl]Cl2 ⋅ 2H2O |
64 |
|
|
|
|
|
– |
|
[Mn(H2L)(H2O)2Cl]Cl ⋅ 2H2O |
72 |
1 |
0.85 |
0.73 |
0.51 |
0.33 |
26 |
|
[Fe(H2L)(H2O)2Cl]Cl2 |
75 |
1 |
0.88 |
0.71 |
0.64 |
0.25 |
33 |
|
[Ni(H2L)(H2O)]Cl2 ⋅ 4H2O |
75 |
1 |
0.88 |
0.81 |
0.62 |
0.3 |
34 |
|
[Cu(H2L)Cl]Cl ⋅ 2H2O |
70 |
1 |
1 |
0.73 |
0.33 |
0.31 |
19.6 |
|
[Zn(H2L)(H2O)Cl2] ⋅ 2H2O |
67 |
|
|
|
|
|
– |
|
[Cd(H2L)(H2O)Cl2] |
64 |
|
|
|
|
|
– |
Figure 9.
Anticancer effects of Schiff base ligand and its metal complexes in terms of % cell inhibition at 100 μg/ml concentration.
The results of the in vitro biological test show that the biological activity of metal complexes is greater than that of Schiff base. Furthermore, during the changing of hydrophilicity and lipophilicity, chelation improves the biochemical potential of the bioactive Schiff base, transmitting the cells permeability barriers and speeding the rate of molecules into cell walls. In addition to overloading the metal binding sites in microorganism enzymes, this type of results increases penetration of metal complexes into lipid membranes. It also distracts the cell‘s breathing process and blocks the planning of proteins, which limit organisms′ supplementary growth. [33]
Comparing the IC50 values of Mn(II), Fe(III), Ni(II) and Cu(II) complexes, it can be found that the Cu(II) complex has stronger activity in opposition to human breast cancer cell line (MCF‐7) than the other complexes, and its IC50 value is 19.6 mg/L. These results gave more possibilities in support of the research and development of metal anticancer drugs and provide some experimental data for the development and application of anticancer drugs. Other than their performance should be further studied, [39] comparable to that of the standard drug cisplatin against MCF‐7 cell line cancer cell with IC50=2.97 μg/mL for.[ 36 , 37 , 38 ]
2.2.14. Molecular modeling: Docking study
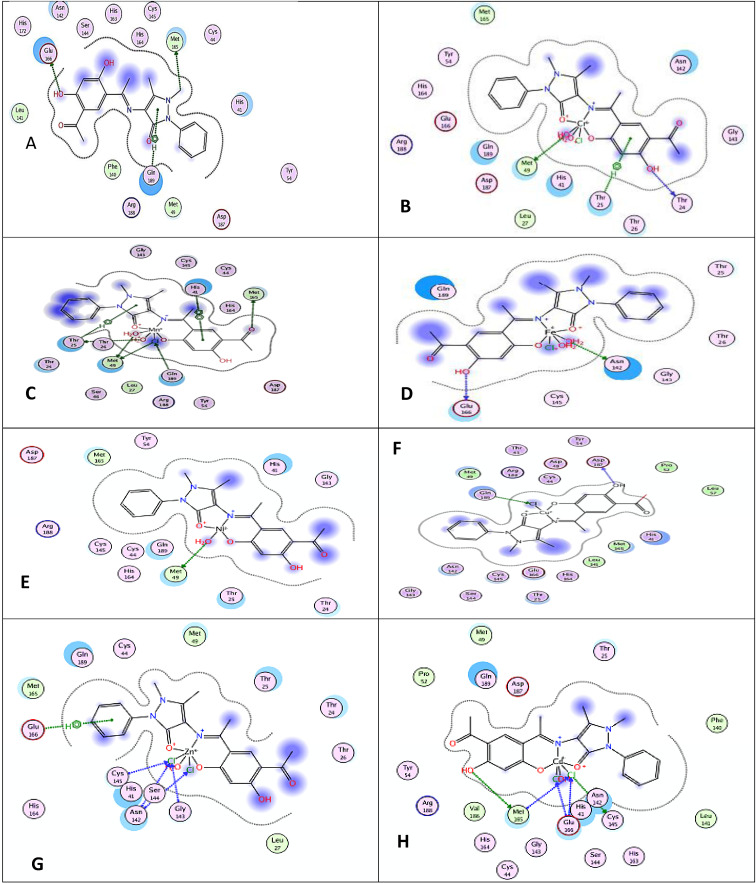
Computer prediction of the antiviral activity was performed for molecules and drugs used in formularies for the treatment of COVID‐19.[ 42 , 43 ] Molecular docking studies have been carried out with the purpose of imagine the binding modes of the H2L ligand and its metal complexes to crystal structure of the SARS‐CoV‐2 (COVID‐19) main protease in complex by inhibitor UAW247 (6XBH). The lesser most binding energies of the ligand and its metal complexes by 6XBH were calculated and showed in Figure 10. 3D interaction maps showed the binding models of H2L and its metal complexes towards protein. It was confirmed that wholly the tested compounds were interacted via a hydrogen bond (Table 9 and Figure 10).
Figure 10.
2D Molecular docking simulation studies of hydrophobic interactions of the Schiff base ligand (A) H2L and (B) Cr(III), (C) Mn(II), (D) Fe(III), (E) Ni(II), (F) Cu(II), (G) Zn(II) and (H) Cd(II) complexes with amino acid residues of PDB ID: 6XBHare shown with dotteFigure S11. 3D Molecular docking simulation studies of the interaction between (A) Schiff base ligand H2L and (B) Cr(III), (C) Mn(II), (D) Fe(III), (E) Ni(II), (F) Cu(II), (G) Zn(II) and (H) Cd(II) complexes with the active site of the receptor of PDB ID: 6XBH. The docked conformation of the compound is shown in ball and stick representation
Table 9.
Energy values obtained in docking calculations of H2L and its metal complexes with to Crystal structure of the SARS‐CoV‐2 (COVID‐19) main protease in complex with inhibitor UAW247 (6XBH).
|
Compound |
moiety |
Receptor site |
Interaction |
Distance (Aο) |
E (kcal/mol) |
|---|---|---|---|---|---|
|
Ligand (H2L) |
O 16 |
OE2 GLU 166 |
H‐donor |
2.88 |
−2.5 |
|
C2 26 |
SD MET 165 |
H‐donor |
3.45 |
−1.1 |
|
|
5‐ring |
NE2 GLN 189 |
pi‐H |
3.36 |
−0.9 |
|
|
[Cr(H2L)(H2O)2Cl]Cl2 ⋅ 2H2O |
O15 |
O THR 24 |
H‐donor |
3.09 |
−1.0 |
|
O54 |
SD MET 49 |
H‐donor |
3.38 |
−28.6 |
|
|
6‐ring |
CG2 THR 25 |
pi‐H |
4.55 |
−0.7 |
|
|
[Mn(H2L)(H2O)2Cl]Cl ⋅ 2H2O |
O 22 |
SD MET 165 |
H‐donor |
4.03 |
−0.4 |
|
CL45 49 |
SD MET 49 |
H‐donor |
3.47 |
−3.1 |
|
|
O46 50 |
SD MET 49 |
H‐donor |
3.07 |
−0.9 |
|
|
O 54 |
OG1 THR 25 |
H‐donor |
2.70 |
−1.4 |
|
|
CL45 49 |
NE2 GLN 189 |
H‐acceptor |
3.77 |
−3.3 |
|
|
5‐ring |
CG2 THR 25 |
pi‐H |
3.92 |
−0.7 |
|
|
6‐ring |
5‐ring HIS 41 |
pi‐pi |
3.64 |
−0.0 |
|
|
[Fe(H2L)(H2O)2Cl]Cl2. |
O 15 |
O GLU 166 |
H‐donor |
2.86 |
−5.0 |
|
O 54 |
OD1 ASN 142 |
H‐donor |
2.91 |
−3.6 |
|
|
[Ni(H2L)(H2O)]Cl2 ⋅ 4H2O |
O 50 |
SD MET 49 |
H‐donor |
3.31 |
−4.9 |
|
[Cu(H2L)Cl]Cl ⋅ 2H2O |
O 15 |
O ASP 187 |
H‐donor |
2.88 |
−2.9 |
|
CL 50 |
CG GLN 189 |
H‐acceptor |
3.34 |
−0.8 |
|
|
CL 50 |
NE2 GLN 189 |
H‐acceptor |
3.08 |
−3.0 |
|
|
[Zn(H2L)(H2O)Cl2] ⋅ 2H2O |
CL45 49 |
CA ASN 142 |
H‐acceptor |
4.24 |
−0.6 |
|
CL46 50 |
CA ASN 142 |
H‐acceptor |
4.03 |
−0.9 |
|
|
CL46 50 |
N GLY 143 |
H‐acceptor |
3.06 |
−8.0 |
|
|
CL46 50 |
N CYS 145 |
H‐acceptor |
4.27 |
−1.9 |
|
|
CL46 50 |
SG CYS 145 |
H‐acceptor |
3.60 |
−0.9 |
|
|
6‐ring |
N GLU 166 |
pi‐H |
4.80 |
−0.7 |
|
|
[Cd(H2L)(H2O)Cl2] |
O 15 |
SD MET 165 |
H‐donor |
3.51 |
−2.6 |
|
CL45 49 |
SG CYS 145 |
H‐donor |
3.92 |
−3.8 |
|
|
CL45 49 |
CA MET 165 |
H‐acceptor |
3.48 |
−2.2 |
|
|
CL45 49 |
N GLU 166 |
H‐acceptor |
4.16 |
−1.1 |
|
|
CL46 50 |
N GLU 166 |
H‐acceptor |
3.34 |
−6.5 |
|
|
CL46 50 |
CB GLU 166 |
H‐acceptor |
3.64 |
−0.8 |
After analyzing out the predicted binding conformations of ligand, Cr(III), Mn(II), Fe(III), Ni(II), Cu(II), Zn(II) and Cd(II) complexes with 6XBH docking, the most excellent confirmations exhibited that the free energies of binding (ΔG) were −2.5, −28.6, −3.3, −5.0, −4.9, −3.0, −8.0 and −6.5 kcal/mol, respectively. Ligand, Cr(III), Fe(III) and Ni(II) complexes are binding via H‐donor with the amino acid residues of glutamic acid (Glu 166) and methionine (Met 49) except Mn(II), Cu(II), Zn(II) and Cd(II) are binding with the amino acid residues of glutamine (Gln 189), glycine (Gly 143), Glu 166 by H‐acceptor with 2.88, 3.38, 3.77, 2.86, 3.31, 3.08, 3.06 and 3.34 A° distances, respectively.[ 42 , 43 ]
The values of interaction energies revealed that its Cr(III) complex had the greatly stable interaction and has a lesser binding energy. Since the point of view of binding energy shows strong interactions with the targets of new coronavirus. This can account to hydrogen bonds formation with the amino acid residues of Met165 and Gln 166. Complex is stabilized by pi‐H interactions with the residues of Glu189. [11, 12, 14, 42, 43].
3. Conclusion
The new Schiff base and its complexes were synthesized. The tridentate coordination behavior characteristic to the ligand was evidenced by means of an azomethine nitrogen and two oxygen atoms for all complexes as indicated from the IR spectral studies. The tetrahedral geometry of Ni(II) and Cu(II) complexes and the octahedral geometry of Cr(III), Mn(II), Fe(III), Zn(II) and Cd(II) complexes were inferred from the magnet moment, diffused reflectance and UV‐vis spectral studies. The large surface and the small porous size of the BET results of the ligand and its complexes suggested their possible use in different nanotechnology applications. The metal complexes usually showed extra antimicrobial activities than free‐ligand molecule which approved the activity of the metal complexes as pathogenic to microorganisms. The recent coronavirus study, H2L was successful applied in fighting. Its complex Cr(III) has lower binding energy than the ligand, which suggests that antivirals can be strong. This research can lead to new coronavirus treatment in the future.
4. Experimental
4.1. Synthesis of Schiff base ligand and its metal complexes
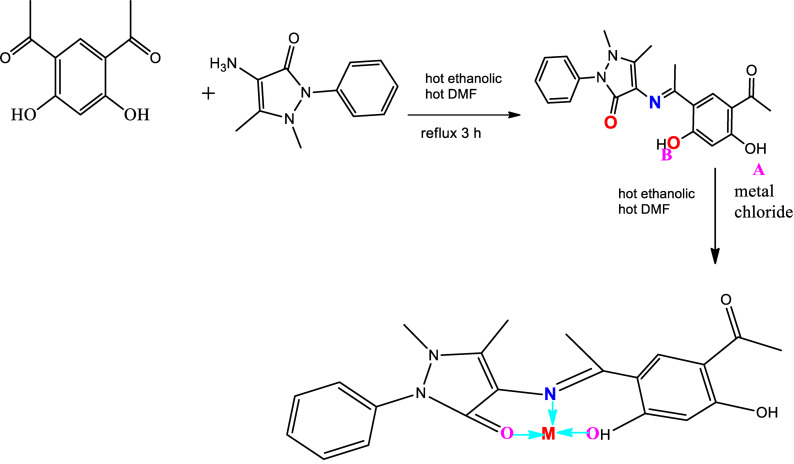
The novel Schiff base ligand (H2L) was synthesized through condensation of 4,6‐diacetyl‐resorcinol (4,6‐DAR) and 4‐aminoantipyrine. A solution of 4‐aminoantipyrine (15.45 mmol, 3.14 g) dissolved in ethanol was added dropwise to 4,6‐DAR (15.45 mmol, 3 g) dissolved in DMF. The resulting mixture was stirred in reflux for about 3 h, through which the orange solid compound was separated. It was filtered, recrystallized, washed with diethyl ether and dried in vacuum (Scheme 1).
Scheme 1.
Preparation of the Schiff base ligand and metal complexes.
Complexes of H2L ligand were synthesized via the reaction of 1 : 1 molar mixture of warm ethanolic solution (60 °C) of the suitable metal chloride (0.20 g CrCl3 ⋅ 6H2O, 0.15 g MnCl2 ⋅ 4H2O, 0.12 g FeCl3 ⋅ 6H2O, 0.18 g NiCl2 ⋅ 6H2O, 0.13 g CuCl2 ⋅ 2H2O, 0.10 g ZnCl2 and 0.14 g CdCl2; 0.76 mmol) and H2L (0.3 g, 0.76 mmol). The resulting mixture was stirred under reflux for 1 h whereupon the complexes precipitated. They were collected via filtration and purified through washing several times by diethyl ether.
4.2. Solutions and chemicals
Stock solutions (1×10⁻³ M) of the Schiff base ligand (H2L) and metal complexes were prepared by precisely weighting the desired quantity and dissolving in DMF solvent. These solutions were utilized for molar conductivity measurement. UV‐Vis spectra in DMF solvent within the wavelength range from 200 to 700 nm was measured using dilute solutions of the Schiff base ligand and its metal complexes (1×10⁻⁴ and 1×10⁻⁵ M).[ 13 , 14 ]
Chemicals consumed were of the analytical reagent grade (AR) and 4‐aminoantipyrine (Sigma) was of the highest purity obtainable. The chemicals consumed included 4,6‐diacetyl‐resorcinol (Sigma), CrCl3 ⋅ 6H2O, MnCl2 ⋅ 4H2O and FeCl3 ⋅ 6H2O (Sigma‐Aldrich), NiCl2 ⋅ 6H2O, CuCl2 ⋅ 2H2O and ZnCl2 (BDH) and CdCl2(Merck). Solvents consumed were ethyl alcohol (95 %) and N,N‐dimethylformamide (DMF). Bidistilled water was usually consumed in every preparation.[ 13 , 14 ]
4.3. Solution of anticancer study
Stock solution (1×10⁻³ M) of Schiff base ligand in addition to its metal complexes (0.12×10⁻² g L−1) were prepared in the appropriate volume of DMF (90 %). DMSO has been used for cell cryopreservation. The medium RPMI‐1640 was prepared as previously described in the protocol of analysis.[ 13 , 14 ]
4.4. Instrumentation
Microanalyses of nitrogen, hydrogen and carbon were approved by the Micro analytical Center, Cairo University, Egypt, via a CHNS‐932 (LECO) Vario elemental analyzer. Analyses of the metals content were performed through dissolving the solid complexes in concentrated HNO3 and dissolving the remnants in deionized water. The metal content was carried out by inductively coupled plasma atomic absorption spectrometry (ICP‐AES), Egyptian Petroleum Research Institute. Fourier transform infrared (FT‐IR) spectra were recorded with a Perkin‐Elmer 1650 spectrometer (400—40 00 cm−1) as KBr pellets. 1H NMR spectra were carried out in DMSO‐d 6 using a 300 MHz Varian‐Oxford Mercury instrument at room temperature consuming tetra‐methylsilane such as an interior standard. Mass spectra were performed using the electron ionization technique at 70 eV with MS‐5988 GS‐MS Hewlett‐Packard instrument in the Microanalytical Center, National Research Center, Egypt. UV‐visible spectra were acquired including a Shimadzu UVmini‐1240 spectrophotometer. Molar conductivities of 10−3 M solutions of the solid complexes in DMF were measured by a Jenway 4010 conductivity meter. Thermogravimetric analyses (TG) of the solid complexes were carried out from room temperature to 1000 °C by a Shimadzu TG‐50H thermal analyzer. Antimicrobial measurements were carried out at the Microanalytical Center, Cairo University, Egypt. Anticancer activity experiments were performed at National Cancer Institute, Cancer Biology Department, Pharmacology Department, Cairo University. The optical density (OD) of each in good form was measured spectrophotometrically at 564 nm with an ELIZA micro plate reader (Meter tech. R960, Lewiston, USA). The surface area of compounds, gas adsorption measurements, was conducted via N2 as the adsorptive gas at 77 K. The analysis was carried out via a Nova Touch LX2 analyzer and calculated based on the Brunauer‐Emmett‐Teller (BET) theory.
4.5. Pharmacology
4.5.1. Antibacterial activities
A modified Kirby‐Bauer disc diffusion technique has been used to establish antimicrobial activity of probation samples. [44] The method was followed as fully described in the previously published research. [23] Gram(‐ve) bacteria (Escherichia coli (ATCC: 11775)), Gram(+ve) bacteria (Staphylococcus aureus (ATCC: 12600)) and yeast (Candida albicans (ATCC: 7102)) were used. The diameters of the inhibition zones were measured in millimeters. Standard amikacin (antibacterial) and ketoconazole (antifungal) were used as positive controls. The zone diameters were measured by the National Committee for the Pro‐Clinical Laboratory Standards′ slipping calipers, designed for disaggregation. Agar‐based methods such as E‐testing and disc diffusion can be alternatives since they are easier and quicker than broth‐based methods. [14]
4.5.2. Anticancer activity
The compounds were tested with the method Skehan and Storeng for likely cytotoxicity. [45] For 24 h before the therapy was carried out via the combinations to allow various compound dilution under the analysis of the cell (0, 5, 12.5, 25, 50 and 100 μg/ml) to be mixed into a 96‐multiproperly platform to allow the composite to attach to the cell wall of the platform. The monolayer cells, including the compounds 48 hours, were stored warm at 37 °C and 5 % CO2. Cells were fixed and washed after 48 h, with SRB stains stained and stained. The Tris‐EDTA buffer washed excess stain with acetic acid and reclaimed stain. ELIZA microplate reader measured the optical density (AD) of all goods spectrophotometrically at 564 nm, average background updates were automatically subtracted, and mean values were calculated of each drug concentration. The relationship between the drug concentration and the surviving fraction is traced into the breast tumor cell line survival curve for each substance. After completion of the protocol, In detail, untreated MCF7 breast cancer cell lines taken as the control group, MCF7 breast cancer cell lines treated with standard drug Cisplatin considered as positive control group. The cell survival percentage was determined as follows:
Survival fraction=O.D (treated cells)/O.D (control cells)
The IC50 values (the concentrations of the Schiff base ligand (H2L) or its metal complexes needed to produce 50 % inhibition of cell growth). [14]
4.5.3. Computational methodology
Gaussian09 suite of program was used for the electronic structure calculations of H2L and Cd(II)complex. DFT based B3LYP method along using the LANL2DZ basis set were employed for full optimization. In order to incorporate the effect of the solvent around the molecule, the TD‐DFT method (along with LANL2DZ basic set) was used to estimate the electronic absorption spectra of the ligand and its Cd(II) complex. The contribution of molecular orbital on HOMO and LUMO were also calculated.[ 14 , 23 ]
4.5.4. Molecular docking
Molecular docking studies have been conducted with software MOE2008, to expose the possible binding modes of very good active compounds as opposed to the SARS‐CoV‐2 (COVID‐19) crystal structure, in complex UAW247(PDB ID: 6XBH). It is a steep molecular docking software and is a molecular graphic communication program that allows for the calculation of possible receptor and ligand docking modes and complex molecules. It is also available. The ligand and input receiver in PDB format is required. The sequence of amino acids was reserved and the crystallized ligands, water molecules and chloride ions were deleted. The Crystal structure of the SARS‐CoV‐2 (COVID‐19) was downloaded from the protein data bank (http://www.rcsb.org./pdb). [46]
sh=sharp, m=medium, br=broad, s=small, w=weak
Conflict of interest
The authors declare no conflict of interest.
Supporting information
As a service to our authors and readers, this journal provides supporting information supplied by the authors. Such materials are peer reviewed and may be re‐organized for online delivery, but are not copy‐edited or typeset. Technical support issues arising from supporting information (other than missing files) should be addressed to the authors.
Supporting Information
Acknowledgements
The authors wish to share their sincere appreciation to Dr. Walaa H. Mahmoud for the revision of the manuscript.
G. G. Mohamed, M. M. Omar, Y. M. Ahmed, Z. Anorg. Allg. Chem. 2021, 647, 2201.
References
- 1. El-ajaily M. M., Sarangi A. K., Mohapatra R. K., Hassan S. S., Eldaghare R. N., Mohapatra P. K., Al-Noor T. H., Chem. Select. 2019, 4, 9999–10005.. [Google Scholar]
- 2. Mohapatra R. K., El-ajaily M. M., Alassbaly F. S., Sarangi A. K., Das D., Maihub A. A., Ben-Gweirif S. F., Mahal A., Suleiman M., Perekhoda L., Azam M., Al-Noor T. H., Chem. Pap. 2021, 75, 1005–1019. [Google Scholar]
- 3. Al-Noor T. H., Mohapatra R. K., Azam M., Karim L. K. A., Mohapatra P. K., Ibrahim A. A., Parhi P. K., Dash G. C., El-ajaily M. M., Al-Resayes S. I., Raval M. K., Pintilie L., J. Mol. Struct. 2021, 1229, 129832. [Google Scholar]
- 4. Sarangi A. K., Mahapatra B. B., Mohapatra R. K., Sethy S. K., Das D., Pintilie L., Zahan M. K. E., Azam M., Meher H., Appl. Organomet. Chem. 2020, 34, e5693. [Google Scholar]
- 5. Mohapatra R. K., Das P. K., Pradhan M. K., Maihub A. A., El-ajaily M. M., J. Iran. Chem. Soc. 2018, 15, 2193–2227. [Google Scholar]
- 6. Ommenya F. K., Nyawade E. A., Andala D. M., J. Kinyua. J Chem. 2020, 20, 1745236. [Google Scholar]
- 7. Shebl M., El-Ghamry M. A., Khalil S. M. E., Kishk M. A. A., Spectrochim. Acta Part A 2014, 126, 232–241. [DOI] [PubMed] [Google Scholar]
- 8. Dhahagani K., Kesavan M. P., Vinoth K. G. G., Ravi L., Rajagopal G., Rajesh J., Mater. Sci. Eng. C 2018, 1, 119–130. [DOI] [PubMed] [Google Scholar]
- 9. Shoaib M., Rahman G., Shah S. W. A., Umar M. N., Bangladesh J. Pharmacol. 2015, 10, 332–336. [Google Scholar]
- 10. Mohapatra R. K., Perekhoda L., Azam M., Suleiman M., Sarangi A. K., Semenets A., Pintilie L., Al-Resayes S. I., J. King Saud Univ. 2021, 33, 101315. [DOI] [PMC free article] [PubMed] [Google Scholar]
- 11. Mohapatra R. K., Mishra S., Azam M., Dhama K., De Gruyter. 2021, 16, 491–493. [DOI] [PMC free article] [PubMed] [Google Scholar]
- 12. Yu R., Chen L., Lan R., Shen R., Li P., Int. J. Antimicrob. Agents 2020, 56, 106012. [DOI] [PMC free article] [PubMed] [Google Scholar]
- 13. Mahmoud W. H., Deghadi R. G., Mohamed G. G., J. Therm. Anal. Calorim. 2017, 127, 2149–2171. [Google Scholar]
- 14. Mahmoud W. H., Omar M. M., Ahmed Y. M., Mohamed G. G., Appl. Organomet. Chem. 2020, 34, 1–20. [Google Scholar]
- 15. Abdallah S. M., Zayed M. A., Mohamed G. G., Arab. J. Chem. 2010, 3, 103–113. [Google Scholar]
- 16. Mahmoud W. H., Mahmoud N. F., Mohamed G. G., El-Bindary A. A., El-Sonbati A. Z., J. Mol. Struct. 2015, 1086, 266–275. [Google Scholar]
- 17. Shebl M., El-ghamry M. A., Khalil S. M. E., Kishk M. A. A., Spectrochim Acta - Part A Mol Biomol Spectrosc. 2014, 126, 232–241. [DOI] [PubMed] [Google Scholar]
- 18. Dianu M. L., Kriza A., Stanica N., Musuc A. M., J. Serb. Chem. Soc. 2010, 75, 1515–1531. [Google Scholar]
- 19. Abdulghani A. J., Hussain R. K., Open J. Inorg. Chem. 2015, 5, 83–101. [Google Scholar]
- 20. Mahmoud W. H., Mahmoud N. F., Mohamed G. G., J. Therm. Anal. Calorim. 2018, 131, 2775–2793. [Google Scholar]
- 21. Emara A. A. A., Adly O. M. I., Transit Met Chem. 2007, 32, 889–901. [Google Scholar]
- 22. Sekhar E. V., Karki S. S., Rangaswamy J., Bhat M., Kumar S., Beni-Suef University Journal of Basic and Applied Sciences. 2020, 13, 282–290. [Google Scholar]
- 23. Ahmed Y. M., Mahmoud W. H., Omar M. M., Mohamed G. G., J. Inorg. Organomet. Polym. Mater. 2021, 31, 2339–2359. [Google Scholar]
- 24. Ramarasan S., Sharma L. R., Angelo A. N. P., J. Emerging Technologies & Innovative Research. 2018, 5, 394–404. [Google Scholar]
- 25. Al-Zaidi B. H., Hasson M. M., Ismail A. H., J Appl Pharm Sci. 2019, 9, 45–57. [Google Scholar]
- 26. Bayoumi H. H., Alaghaz A.N, Aljahdali M.S, Int. J. Electrochem. Sci. 2013, 8, 9399–9413. [Google Scholar]
- 27. Soleimani E., Journal of the Chinese Chemical Society. 2010, 57, 653–658. [Google Scholar]
- 28. Nair M. S., Arish D., Joseyphus R. S., J. Saudi Chem. Soc. 2012, 16, 83–88. [Google Scholar]
- 29. Wahba O., Hassan A. M., Naser A. M., Hanafi A. M., Egypt. J. Chem. 2017, 60, 25–40. [Google Scholar]
- 30. Sahu R., Mohapatra R. K., Al-Resayes S. I., Das D., Parhi P. K., Rahman S., Pintilie L., Kumar M., Ansari A., J. Saudi Chem. Soc. 2021, 25, 101193. [Google Scholar]
- 31. Reddy J. K., Lalitha K., Reddy P. V. L., Sadanandam G., Subrahmanyam M., Kumari V. D. Catal. Lett. 2014, 144, 340–346. [Google Scholar]
- 32. Modi C. K., Trivedi P. M., Arab. J. Chem. 2017, 10, S1452–1459. [Google Scholar]
- 33. Palanimurugan A., Kulandaisamy A., J. Organomet. Chem. 2018, 861, 263–274. [Google Scholar]
- 34. Vairalakshmi M., Princess R., Johnsonraja S., Asian J. Pharm. Clin. Res. 2019, 12, 206–210. [Google Scholar]
- 35. Sivaprakash G., Tharmaraj P., Jothibasu M., Arun A., Int J Adv Res. 2017, 5, 2656–2663. [Google Scholar]
- 36. Malik M. A., Dar O. A., Gull P., Wani M. Y., Hashmi A. A., MedChemComm 2018, 9, 409. [DOI] [PMC free article] [PubMed] [Google Scholar]
- 37. Siddappa K., Mallikarjun K., Reddy T., Mallikarjun M., Reddy C. V., Tambe M., J. of Chem. 2009, 6, 615–624. [Google Scholar]
- 38. Abu-Khadra A. S., Afify A. S., Mohamed A., Farag R. S., Aboul-Enein H. Y., The Open Bioactive Compounds J. 2018, 6, 1–10. [Google Scholar]
- 39. Liu Q., Xie B., Lin S., Liao Q., Deng R., Zhaohua Y., J. Chem. Sci. 2019, 131, 73. [Google Scholar]
- 40. Mane R. S., Vedamurthy A. B., Int. J. Pharma Bio Sci. 2020, 11, 1–6. [Google Scholar]
- 41. Soliman A. M. M., Kamel M. M., Eweas A. F., Wietrzyk J., Milczarek M., Soliman S. S., Chem. Res. J. 2018, 3, 26–32. [Google Scholar]
- 42. Xu Y., Meng X., Sci. Rep. 2020, 10, 1–13. [DOI] [PMC free article] [PubMed] [Google Scholar]
- 43. Kamaci U. D., Kamaci M., Peksel A., J. Fluoresc. 2017, 27, 805–17. [DOI] [PubMed] [Google Scholar]
- 44. Bauer A. W., Kirby W. M., Sherris J. C., Turck M., Am. J. Clin. Pathol. 1966, 45, 493–496. [PubMed] [Google Scholar]
- 45. Skehan P., Storeng R., J. Natl. Cancer Inst. 1990, 82, 1107–1112. [DOI] [PubMed] [Google Scholar]
- 46.<Y. M. Ahmed, M.M.Omar⋅ G. G.Mohamed, Journal of the Iranian Chemical Society. 2021,https://doi.org/10.1007/s13738-021-02359-w
Associated Data
This section collects any data citations, data availability statements, or supplementary materials included in this article.
Supplementary Materials
As a service to our authors and readers, this journal provides supporting information supplied by the authors. Such materials are peer reviewed and may be re‐organized for online delivery, but are not copy‐edited or typeset. Technical support issues arising from supporting information (other than missing files) should be addressed to the authors.
Supporting Information


