Abstract
Cholangiocarcinoma (CCA) is the second most malignant neoplasm in the liver that arises from the biliary tree. CCA is associated with a poor prognosis, and the key players involved in its pathogenesis are still not well understood. Receptor tyrosine kinases (RTKs), such as epidermal growth factor receptor (EGFR), can mediate intracellular calcium (Ca2+) signaling pathways via inositol 1,4,5-trisphosphate (InsP3), activating inositol 1,4,5-trisphosphate receptors (ITPRs) and regulating tumor growth. ITPR isoform 3 (ITPR3) is the main intracellular Ca2+ release channel in cholangiocytes. The effects of intracellular Ca2+ are mediated by calcium-binding proteins such as Calmodulin and S100 calcium-binding protein A4 (S100A4). However, the clinicopathological and biological significance of EGFR, ITPR3 and S100A4 in CCA remains unclear. Thus, the present work investigates the immunoexpression of these three proteins in 59 CCAs from patients who underwent curative surgical treatment and correlates the data with clinicopathological features and survival. High ITPR3 expression was correlated with CA 19–9 levels, TNM stage and lymph node metastasis (N). Furthermore, ITPR3 expression was increased in distal CCA compared to control bile ducts and intrahepatic and perihilar CCAs. These observations were confirmed by proteomic analysis. ITPR3 and S100A4 clinical scores were significantly correlated. Furthermore, it was demonstrated that EGF induces calcium signaling in a cholangiocarcinoma cell line and ITPR3 colocalizes with nonmuscle myosin IIA (NMIIA). In summary, ITPR3 overexpression could contribute to CCA progression and it may represent a potential therapeutic target.
Keywords: ITPRs, ITPR3, S100A4, cholangiocarcinoma, liver, cancer
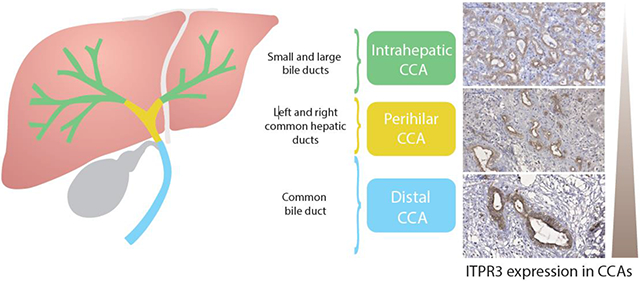
Graphical Abstract
1. Introduction
Cholangiocarcinoma (CCA) constitutes a rare and diverse group of malignancies arising from the biliary tree. Depending on their anatomical position, CCAs are divided into three subtypes: intrahepatic, perihilar and distal. The heterogeneous histogenesis of CCA may originate from hepatic progenitor cells, cholangiocytes, hepatocytes and liver stem cells [1, 2]. Moreover, their clinical manifestations, natural history, risk factors, and genomics can interfere with the chemotherapy response. Despite many advances in the field, the mechanisms of biliary carcinogenesis remain poorly understood [2, 3].
Cholangiocarcinogenesis is orchestrated by a complex interaction of ligands, such as proinflammatory cytokines and growth factors. Immunohistochemical (IHC) studies have shown that growth factor receptors are overexpressed in samples of human CCA [4]. Epidermal growth factor receptor (EGFR), a tyrosine kinase receptor encoded by proto-oncogenes, has been reported to play a key role in the cell cycle, cell migration, and angiogenesis [5]. EGFR overexpression is implicated in CCA carcinogenesis, with a high expression level in the intrahepatic subtype [6]. EGFR activation by its ligand EGF also activates Ca2+ signaling via inositol 1,4,5-trisphosphate (InsP3), activating inositol 1,4,5-trisphosphate receptors (ITPRs) [7].
Ca2+ signaling pathways can regulate cellular processes such as tumor growth, cell proliferation, apoptosis, cell migration, gene transcription and necrosis. In cholangiocytes, Ca2+ release into the cytosol mainly occurs through the type 3 inositol 1,4,5-trisphosphate receptor (ITPR3) [8-11]. Previous work has demonstrated that this isoform is involved in CCA biology [12]. Furthermore, ITPR3 expression is involved in the pathogenesis of other malignancies, and its overexpression is correlated with other types of human cancer [13-15].
The effects of intracellular calcium are mediated by calcium-binding proteins that have been related to a poor prognosis and tumor aggressiveness in patients with different types of carcinoma, including colorectal, esophageal, bladder, pancreatic, gastric, and breast cancers [16-18]. For example, the protein S100A4, a calcium-binding protein containing two EF-hand domains, has been recognized to play a key role in tumor progression and metastasis [19, 20]. This protein regulates a wide range of intracellular and extracellular biological effects, including cell proliferation, extracellular matrix remodeling, cell detachment, and angiogenesis [21, 22]. For example, S100A4 interacts with the C-terminus region of nonmuscle myosin IIA (NMIIA), causing filament disassembly, which is correlated with the increased metastatic potential of tumoral cells [23]. Previous work demonstrated S100A4 expression as a useful marker for predicting the progression, metastasis and prognosis of CCA as a metastasis-related gene [20]. Recently, S100A4 expression was detected in intrahepatic CCA, and the nuclear expression of S100A4 was identified as a strong predictor of metastasis and reduced survival after resection [20, 22].
This study aimed to investigate the IHC expression of ITPR3, S100A4 and EGFR and their correlation with the clinicopathological features of intra- and extrahepatic CCAs. The association between ITPR3, S100A4 and EGFR expression and the postoperative survival of CCA patients was evaluated. Furthermore, it was demonstrated that EGF mediate calcium signals via ITPR3.
2. Materials and methods
2.1. Patient selection and anatomopathological study
A total of 59 samples were collected between January 2008 and March 2021 from subjects who underwent curative surgical resection with a histological diagnosis of CCA. Data regarding sex, age, history of smoking or alcoholism, localization, anatomic origin, CA 19–9 (carbohydrate antigen), histological type, tumor stage, angiovascular invasion, surgical margin and survival after treatment were collected. Classification and staging followed the TNM pattern of the American Joint Cancer Committee/Union for International Cancer Control [24, 25]. To adjust for possible effects on survival related to surgical complications rather than tumor prognosis, subjects who died during the first 30 days after surgery were excluded; thus, the follow-up period started 30 days after tumor resection. The follow-up period ranged from 2 to 60 months (median: 21.78 months). The relationships between ITPR3, S100A4 and EGFR and the clinicopathological features of human CCA are reported in Table 1. The Institutional Ethics Committee approved this research (reference number: CAAE - 37156714.6.0000.5149).
Table 1.
Relationship between ITPR3, S100A4, EGFR and clinicopathological features in human cholangiocarcinoma cases.
| Cases | ITPR3 | p | S100A4 | p | EGFR | p | ||||
|---|---|---|---|---|---|---|---|---|---|---|
| Clinical Features |
n | Negative | Positive | Negative | Positive | Negative | Positive | |||
| Gender | ||||||||||
| Male | 32 | 10 | 22 | 29 | 3 | 22 | 10 | |||
| Female | 25 | 5 | 20 | 0.339 | 23 | 2 | 0.856 | 17 | 8 | 0.952 |
| Age (years) | ||||||||||
| ≤60 | 27 | 5 | 22 | 24 | 3 | 17 | 10 | |||
| >60 | 30 | 10 | 20 | 0.255 | 28 | 2 | 0.554 | 22 | 8 | 0.400 |
| Smoking | ||||||||||
| Yes | 18 | 3 | 15 | 16 | 2 | 13 | 5 | |||
| No | 37 | 10 | 27 | 0.396 | 34 | 3 | 0.716 | 24 | 13 | 0.585 |
| Alcohol Use | ||||||||||
| Yes | 16 | 4 | 12 | 15 | 1 | 12 | 4 | |||
| No | 41 | 11 | 30 | 0.888 | 37 | 4 | 0.674 | 27 | 14 | 0.504 |
| CA 19-9 | ||||||||||
| ≤ 37 U/ml | 12 | 7 | 5 | 12 | 0 | 9 | 3 | |||
| > 37 U/ml | 24 | 6 | 18 | 0.049 | 22 | 2 | 0.375 | 14 | 10 | 0.326 |
| Localization | ||||||||||
| Intrahepatic | 14 | 6 | 8 | 14 | 0 | 7 | 7 | |||
| Extrahepatic | 43 | 9 | 34 | 0.106 | 38 | 5 | 0.182 | 32 | 11 | 0.088 |
| Histology | ||||||||||
| Papillary | 15 | 4 | 11 | 14 | 1 | 10 | 5 | |||
| Others | 42 | 11 | 31 | 0.971 | 38 | 4 | 0.737 | 29 | 13 | 0.865 |
| Angiovascular Invasion | ||||||||||
| Positive | 42 | 10 | 32 | 37 | 5 | 28 | 14 | |||
| Negative | 15 | 5 | 10 | 0.472 | 15 | 0 | 0.162 | 11 | 4 | 0.634 |
| Histological Grade | ||||||||||
| G1 | 14 | 2 | 12 | 14 | 0 | 12 | 2 | |||
| G2 | 38 | 12 | 26 | 35 | 3 | 25 | 13 | |||
| G3 | 5 | 1 | 4 | 0.429 | 3 | 2 | 0.024 | 2 | 3 | 0.140 |
| Lymph node metastasis | ||||||||||
| Positive | 23 | 2 | 21 | 18 | 5 | 15 | 8 | |||
| Negative | 28 | 10 | 18 | 0.024 | 28 | 0 | 0.009 | 20 | 8 | 0.634 |
| T stage | ||||||||||
| T1 +T2 | 34 | 9 | 25 | 33 | 1 | 26 | 8 | |||
| T3+ T4 | 23 | 6 | 17 | 0.974 | 19 | 4 | 0.058 | 13 | 10 | 0.112 |
| TNM stage | ||||||||||
| I+II | 31 | 9 | 22 | 30 | 1 | 25 | 6 | |||
| III+IV | 25 | 6 | 19 | 0.673 | 21 | 4 | 0.096 | 14 | 11 | 0.046 |
| Surgical margin | ||||||||||
| Positive | 22 | 8 | 14 | 18 | 4 | 15 | 7 | |||
| Negative | 35 | 7 | 28 | 0.172 | 34 | 1 | 0.047 | 24 | 11 | 0.975 |
2.2. IHC staining
The primary antibodies used for the IHC analysis were anti-EGFR (1:100, clone 31G7, Invitrogen, California, USA), ITPR3 (1:100, monoclonal, BD Biosciences, Rockville, MD, USA) and S100A4 (1:200, polyclonal, Invitrogen). IHC staining was performed as previously described, with minor modifications [26-28]. In brief, for ITPR3 and S100A4 staining, 4 μm sections of primary tumors were mounted onto silanized slides, and formalin-fixed paraffin-embedded (FFPE) tissue sections were dewaxed, rehydrated, and unmasked in Trilogy solution (Cell Marque, Koclin, CA, USA) with pressurized heating (125°C) for 20 min according to the manufacturer's instructions. Enzymatic recovery of EGFR was performed using 0.1% pepsin in 10 mM HCl (Sigma-Aldrich, St. Louis, MO, USA) at 37°C for 30 minutes. Slides were dewaxed in xylene (Sigma-Aldrich), and endogenous peroxidase activity was quenched with 3% H2O2 in methanol (Sigma-Aldrich). Subsequently, the slides were covered with serum-free protein block (Dako, Santa Clara, CA, USA) for 30 minutes and then incubated with the primary antibodies (EGFR, ITPR3 and S100A4) overnight at 4°C. A peroxidase-based detection system, Novolink™ Polymer (Leica Biosystems Newcastle Ltd., Newcastle, UK), was applied manually. Immunoreactivity was visualized by incubating the slides with 3,3′-diaminobenzidine (Lab Vision DAB substrate system; Lab Vision, Fremont, California, USA) for 2 minutes. Negative controls were prepared by omitting the primary antibody. Nontumor adjacent liver tissue was used as a positive control.
2.3. IHC scoring
Two independent observers evaluated the degree of immunostaining on the sections in a blinded manner. Five high-power fields (40×) from each section were randomly selected to evaluate the percentage of immunostained tumor cells and staining intensity. EGFR expression was assessed in CCA samples using the scores defined according to the consensus of the American Society of Clinical Oncology and College of American Pathologists (ASCO/CAP; Wolff et al.) as follows: 0 = no membrane staining or incomplete and faint/barely perceptible membrane staining in ≤10% of tumor cells, 1 = incomplete and faint/barely perceptible membrane staining in ≥10% of tumor cells, 2 = incomplete and/or weak/moderate membrane staining in >10% of tumor cells or complete and intense membrane staining in ≤10% of tumor cells, and 3 = complete and intense membrane staining in >10% of tumor cells. In our study, specimens with scores of 0, 1 and 2 were regarded as low/negative, and those with a score of 3 were regarded as high/positive [29, 30].
The scoring method used by Silveira et al. for prostaglandin G/H synthase 2 (COX2) was adapted for ITPR3 and S100A4 scoring [31, 32]. The number of ITPR3- and S100A4-positive cells was evaluated semiquantitatively, with the distribution score defined by the estimated percentage of positive cells in five fields at 40× magnification as follows: 0 = absence, 1 = fewer than 10% stained cells, 2 = between 10% and 30%, 3 = between 31% and 60%, and 4 = more than 61% stained cells. For staining intensity, the values ranged from 0 to 3 as follows: 0 = absence, 1 = weak staining, 2 = moderate staining, and 3 = strong staining. The distribution score and intensity were multiplied to obtain a total score, which ranged from 0 to 12. To evaluate S100A4 expression, staining in the cytoplasm and/or nuclei was considered positive.
2.4. Bioinformatic analysis of proteomics data
The mass spectrometry proteomics data analyzed were deposited into the ProteomeXchange Consortium via the PRIDE partner repository under dataset identifier PXD010294. The normalized abundance of ITPR3 (protein ID: Q14573) was analyzed from the dataset 1813003-Quantification-allgroups-withoutHCC-protein-measurement.xlsx [33, 34].
2.5. Cell culture
The cholangiocarcinoma cell lines MzChA-1 WT and MzChA-1 ITPR3-KO were kindly provided by Dr. Michael H. Nathanson (Yale University, CT, USA). The ITPR3 knockout MzChA-1 cells were established by using the CRISPR/Cas9 system, as described previously [12]. The MzChA-1 WT and MzChA-1 ITPR3-KO cell lines were cultured in MEM-Alpha medium supplemented with 10% Fetal Bovine Serum (FBS) and 100 units/ml penicillin, and 100 μg/ml streptomycin (Invitrogen). Cells were maintained at 37°C in an atmosphere of 5% of CO2 atmosphere incubator.
2.6. Immunoblot analysis
Western blotting was performed and detected as described previously [7]. In brief, MzChA-1 whole-cell extracts were obtained from homogenized samples by using a lysis buffer (150 mM NaCl, 1 mM EDTA, 20 mM Tris-HCl, pH 8.0, 0.5% Nonidet P-40 and 1% of protease inhibitor cocktail (Sigma-Aldrich). Lysates were centrifuged at 16,000 g for 10 min at 4 °C and quantified using the Bradford assay reagent from Sigma-Aldrich. Extracts of protein (30 μg) was separated by electrophoresis on a denaturing 10% polyacrylamide–sodium dodecyl sulphate gel and transferred to a polyvinylidene difluoride membrane (Bio-Rad, Hercules, CA, USA). The membranes were blocked for 1 hour in Tris-buffered saline (TBS) containing 5% (w/v) nonfat dry milk and 0.05% Tween-20 and incubated with specific anti-ITPR3 mouse monoclonal antibody (1:500, BD Biosciences) in TBS containing 5% (w/v) nonfat dry milk and 0.05% Tween-20. As a loading control, the membranes were reprobed with anti-GAPDH (1:4000; Santa Cruz, TX, USA). After washing, the membranes were incubated with a horseradish peroxidase-conjugated anti-mouse secondary antibody (1:2000; Sigma Aldrich). Immunoreactive bands were visualized using an enhanced chemiluminescence reagent (ECL Plus; GE Healthcare Life Sciences, Piscataway, NJ, USA). The western blot repeats are presented in supplementary Fig.2.
2.7. Cytosolic calcium signaling
ITPR3-KO-MzChA-1 or control-MzCha-1 (WT) cells were plated and cultured on 35 mm glass-bottom dishes (MatTex, Ashland, MA, USA) for 24 hours. Cells were serum-starved (6-10 h) prior EGF stimulus. Then, cells were loaded with 5 μM of Fluor-4 AM (Thermo Fisher Scientific) for 15 minutes at 37°C in HEPES-buffered solution. Dishes were placed on the stage of the LSM 880 Zeiss Confocal microscope at 40× magnification, and cells were kept on HEPES-buffered solution during imaging. Cells were stimulated with EGF 200 ng/ml. Fluo-4 AM fluorescence images were collected at a rate of 5 frames/second. Changes in fluorescence F were normalized by the initial fluorescence (F0) and were expressed as (F/F0) × 100%. Cells maximum peak responses were quantified by using ImageJ software (NIH) [11].
2.8. Immunofluorescence
Immunofluorescence imaging were performed as described previously [7, 35]. In brief, MzChA-1 cells were double labeled with a mouse monoclonal anti-ITPR3 (1:200, BD Biosciences) and a rabbit polyclonal anti- nonmuscle myosin IIA (NMIIA) (1:200, Thermo Scientific, Austin, TX, USA) overnight at 4°C and then incubated with secondary antibodies conjugated to Alexa Fluor 488 or 546 (Thermo Scientific). Hoechst 33342 (Thermo Scientific) was used as a marker for the nuclear compartment. The negative control was included in all reactions by omitting primary antibodies. Images were collected using a Leica GSD/TIRF HP microscope with a HC PL APO ×100, 1.47 NA oil objective lens. Imagens were deconvolved using the 3D deconvolution module available in the LAS X software using 10 interactions. LAS X 3D analysis module was used to quantify the number of clusters of ITPR3 that come into contact with NMIIA.
2.9. Statistical analysis
Differences in the IHC score and tumor marker levels depending on location were analyzed using the Kruskal-Wallis test and Mann-Whitney U-test. Statistical analysis of survival curves and Cox proportional hazards regression model were carried out using the survival and survminer packages of RStudio software (version 1.4,1717; running R version: 4.10). Chi-square and Fisher's exact tests were used to analyze the correlation between ITPR3, S100A4 and EGFR expression and the clinicopathological characteristics of CCA patients. According to the Kaplan–Meier survival analysis, the log-rank test was used to compare the overall survival rate of patients. Multivariate analyses were performed using the Cox proportional hazards regression model. P<0.05 was considered statistically significant, except as otherwise stated. The significance of changes in maximum peak-calcium levels and western blot experiments were determined by Student's t test, using GraphPad Prism software. Data are represented as mean ± S.D.
3. Results
3.1. Expression of ITPR3, S100A4 and EGFR in primary CCA
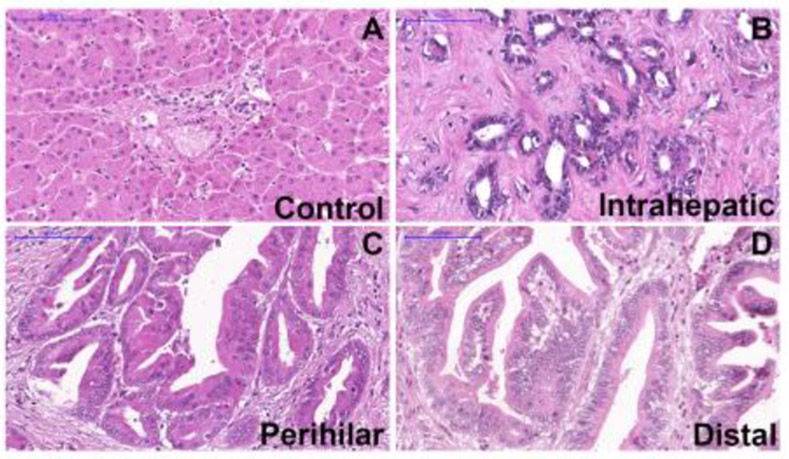
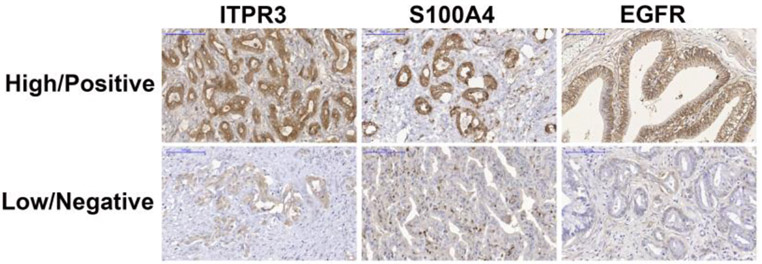
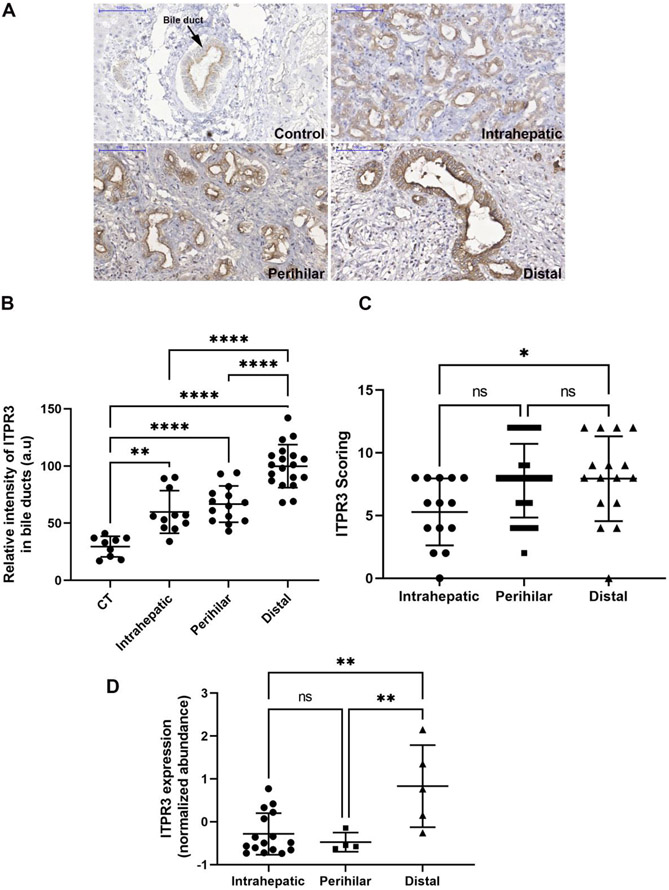
First, the relationship of ITPR3, S100A4 and EGFR expression in CCA was examined in liver samples from patients with intrahepatic (n=17), perihilar (n=29) or distal (n=17) CCA. Histological diagnoses were established based on the examination of hematoxylin-eosin (H&E)-stained specimens (Fig. 1A-D). The rates of high ITPR3, EGFR and S100A4 expression were 73.6%, 31.58% and 8.7%, and the rates of low expression were 26.32%, 68.42% and 91.23%, respectively (Fig. 2). Representative images of high/positive and low/negative staining for each protein are shown in Figure 2. Next, relative ITPR3 expression was examined according to the anatomical origin of the tumor. IHC labeling of ITPR3 increased when comparing control bile ducts with intrahepatic, perihilar and distal CCAs (p<0.05 and p<0.0001, respectively) (Fig. 3B). No labeling difference was observed between intrahepatic versus perihilar CCA (Fig. 3B). This result was confirmed when comparing ITPR3 expression according to the IHC score and proteomics quantification (Fig. 3C and 3D). Increased ITPR3 expression in distal CCA compared with intrahepatic CCA was confirmed by the IHC score and proteomics quantification (p<0.05) (Fig. 3C and 3D). Proteomic analysis showed that S100A4 expression was increased in perihilar compared with intrahepatic and distal CCA (p<0.05) (see supplementary Fig.1A). No difference was observed in EGFR expression comparing the three anatomical regions (see supplementary Fig. 1B). The reference for the mass spectrometry data used for the analysis is presented in methods section 2.4. Nontumor liver tissue was used as a positive control. The IHC staining of liver sections from controls showed that ITPR3 expression in cholangiocytes was concentrated at the bile duct apical area, as has been described previously [9, 12]. Together, these results demonstrate that ITPR3 expression is increased in CCA, and its overexpression is especially pronounced in patients with distal CCA.
Fig. 1. Liver histology from CCA patients and controls.
Representative photomicrographs of liver specimens from controls and patients with intrahepatic, perihilar and distal CCA stained with hematoxylin and eosin (H&E). (A) Liver section showing a normal hepatic parenchyma with one normal-appearing portal tract. (B) Section from an intrahepatic CCA showing many glandular structures with round to irregular profiles. (C) Section from a perihilar CCA showing a papillary type of growth. (D) Section from a distal CCA showing a papillary type of growth. Micrographs represent observations from 15, 29 and 15 patients in each category. Scale bars = 100 μm.
Fig. 2. Representative images of high/positive and low/negative expression (IHC staining).
High/positive expression of ITPR3 (73.6%), S100A4 (8.7%) and EGFR (31.58%) and low/negative expression of ITPR3 (26.32%), S100A4 (91.23%) and EGFR (68.42%). Scale bars = 100 μm.
Fig. 3. ITPR3 staining is increased in cholangiocytes of patients with distal CCA.
(A) Representative immunohistochemical (IHC) staining of ITPR3 in liver specimens from control bile ducts (black arrows) and patients with intrahepatic, perihilar and distal CCAs shows that ITPR3 staining is more intense in liver samples from CCA patients. Scale bars = 100 μm. (B) Quantitative analysis of the intensity of ITPR3 staining in IHC images. Images are representative of observations from 10 patients (10 images per patient), *p < 0.0001. (C) ITPR3 expression versus the anatomical origin of the tumor, p < 0.05. (D) ITPR3 expression abundance by bioinformatic analysis of proteomics data, p < 0.05.
3.2. Correlation between ITPR3, S100A4 and EGFR expression and clinicopathological characteristics
The chi-square analysis showed that positive ITPR3 expression was correlated with a CA 19–9 value > 37 U/ml (P=0.049) and lymph node metastasis (P=0.024). S100A4-positive expression was correlated with a high histological grade (P=0.024), lymph node metastasis (P=0.009) and surgical margin (P=0.047). EGFR-positive expression was correlated with TNM stage (P=0.046). Other factors, including sex, age, smoking and alcohol use, localization, histology, angiovascular invasion and T stage, showed no significant correlation with any of the 3 proteins analyzed (Table 1).
Correlations between ITPR3, S100A4 and EGFR were explored with Fisher's exact test. The expression of ITPR3 was correlated with the expression of S100A4 (p=0.049). On the other hand, there was no significant correlation between the expression of EGFR and the expression of the other proteins (Table 2).
Table 2.
Correlation between ITPR3, S100A4 and EGFR expression in human cholangiocarcinoma.
| S100A4 | EGFR | |
|---|---|---|
| ITPR3 Correlation coefficient | 0.262 | 0.017 |
| p | 0.049 | 0.898 |
| S100A4 Correlation coefficient | −0.040 | |
| p | 0.767 |
3.3. Survival analysis
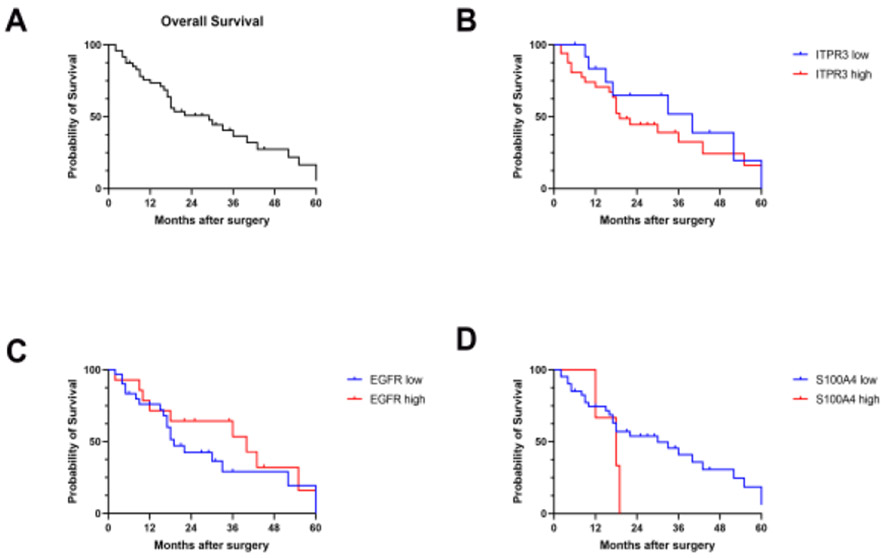
Kaplan-Meier survival analysis was performed on the 49 patients who survived for more than one month after surgery (Fig. 4A). During the follow-up period (1 to 60 months), a total of 31 patients died (63.2%). The median survival time based on 49 subjects was 29 months (95% confidence interval [CI] = 18 to 43). As shown in Figure 4, for subjects with low and high ITPR3 expression, the median survival times were 40 and 19 months (p = 0.4715) (Fig. 4B). The median survival times were 19 and 40 months (p = 0.2773) when comparing patients with low versus high EGFR expression (Fig. 4C) and 30 and 18 months (p = 0.1948) for patients with low versus high S100A4 expression (Fig. 4D). The overall survival rates comparing the high and low expression levels between the 3 proteins showed no difference understudy.
Fig. 4. Probability of survival in CCA patients following resection.
(A) Kaplan-Meier survival curve estimates for CCA patients with low/negative and high/positive ITPR3, EGFR and S100A4 expression after surgical resection. (B) For ITPR3, the median survival times were 40 and 19 months (p = 0.4715). (C) For EGFR, the median survival times were 19 and 40 months (p = 0.2773). (D) For S100A4, the median survival times were 30 and 18 months (p = 0.1948).
3.4. Multivariate analysis of the prognosis of patients with CCA
Multivariate analyses using the Cox proportional hazards regression model were performed to assess independent prognostic factors for CCA (Fig. 5). The four significant factors (CA 19–9, lymph node metastasis, T stage, and TNM stage) identified in the univariate analysis were analyzed. The multivariate analysis of CA, T, N, Stage and S100A4 and EGFR scores showed that TNM stages III+IV and EGFR expression (HR: 55.60; p = 0.005, HR: 13.36; p = 0.028; Fig. 5A) were independent prognostic factors for overall survival (see model 1). According to model 2 (CA, T, N, Stage and ITPR3 and EGFR), the higher TNM stages (III+IV) were more significant than the lower TNM stages (I+II) (HR: 14.94; p = 0.012) (Fig. 5B). The multivariate analysis of CA, T, N, Stage, ITPR3, S100A4 and EGFR scores on model 3 also demonstrated the significance of TNM stages III+IV (HR: 47.07; p = 0.01) when comparing EGFR high/positive expression with low/negative EGFR expression (HR: 13.56; p = 0.042) (Fig. 5C).
Fig. 5. Multivariate analysis using the Cox proportional hazards model.
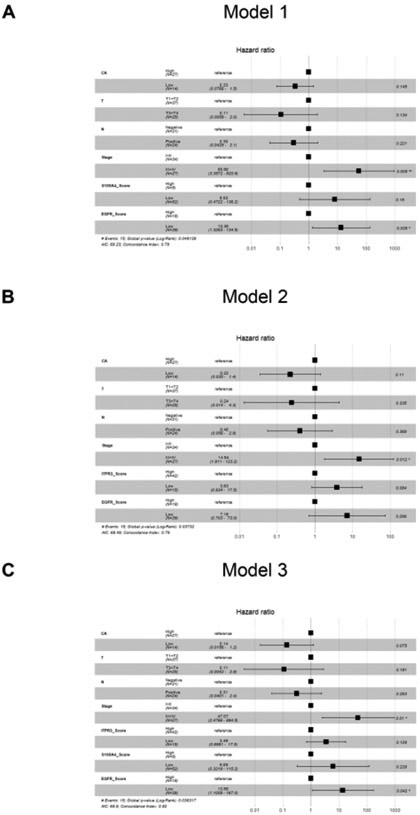
(A-B and C) shows the proposed models. The global p values (log-rank) are 0.049139, 0.03732, and 0.036317, respectively.
3.5. EGF induces Ca2+ signaling in cholangiocarcinoma cell line
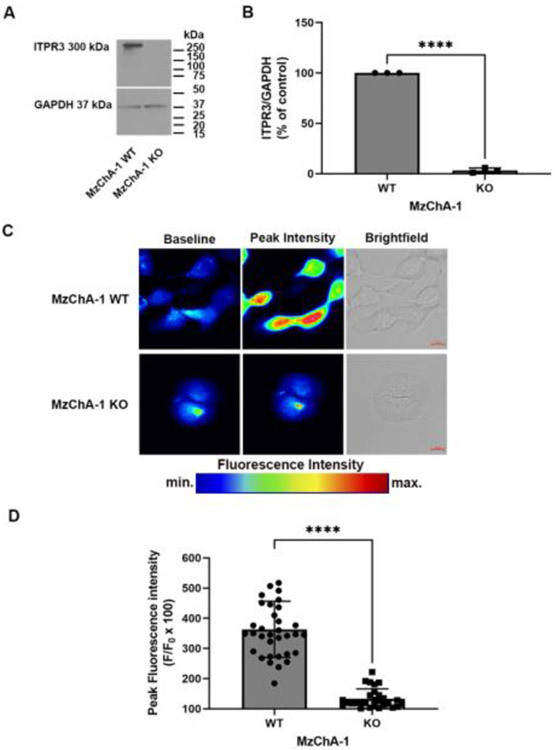
To demonstrate that epidermal growth factor (EGF) mediate calcium signals via ITPR3, a MzChA-1 cholangiocarcinoma cell line knockout for ITPR3 was used. This CRISPR/Cas9 knockout cell was characterized in detail previously [12]. First, we confirmed a reduction of 96.8 ± 1.4% of ITPR3 expression levels by western blot in MzChA-1 Knockout (KO) compared with the MzChA-1 wild type (WT) cell (n = 3; P <0.0001) (Fig. 6A and 6B). Next, cells were loaded with 5 μm of Fluo-4 AM to examine EGF induced-Ca2+ signaling. Cells were observed by time-lapse confocal microscopy and after 1 min of imaging MzChA-1 WT or MzChA-1 KO were stimulated with 200 ng/ml of EGF. The maximum peak analyses demonstrated a reduction of 229.5 ± 18.5% in KO cells compared with WT (n = 34 WT or 28 KO cells, P < 0.0001) (Fig. 6C and 6D). These findings demonstrate that EGF induces Ca2+ signals that are mediated via ITPR3 in this cholangiocarcinoma cell line.
Fig. 6. EGF induces calcium signaling in a cholangiocarcinoma cell line.
Panel (A-B) show a representative immunoblot and quantitative analysis of total ITPR3 expression in MzChA-1 WT and MzChA-1 KO cells (n = 3, P < 0.0001). (C) Representative confocal images of MzChA-1 WT and MzChA-1 KO cells loaded with 5 μM Fluo-4 AM to monitor Ca2+ signaling in response to 200 ng/ml EGF. (D) The bar graph shows the maximum peak response analyses and it demonstrates a reduction of 229.5 ± 18.5% in KO cells compared with WT (n = 34 WT or 28 KO cells, P < 0.0001). Values are mean ± S.D. of the maximum peak Fluo-4 AM fluorescence attained during the observation period. Results are expressed as % of baseline as described in materials and methods.
3.6. ITPR3 colocalizes with nonmuscle myosin IIA
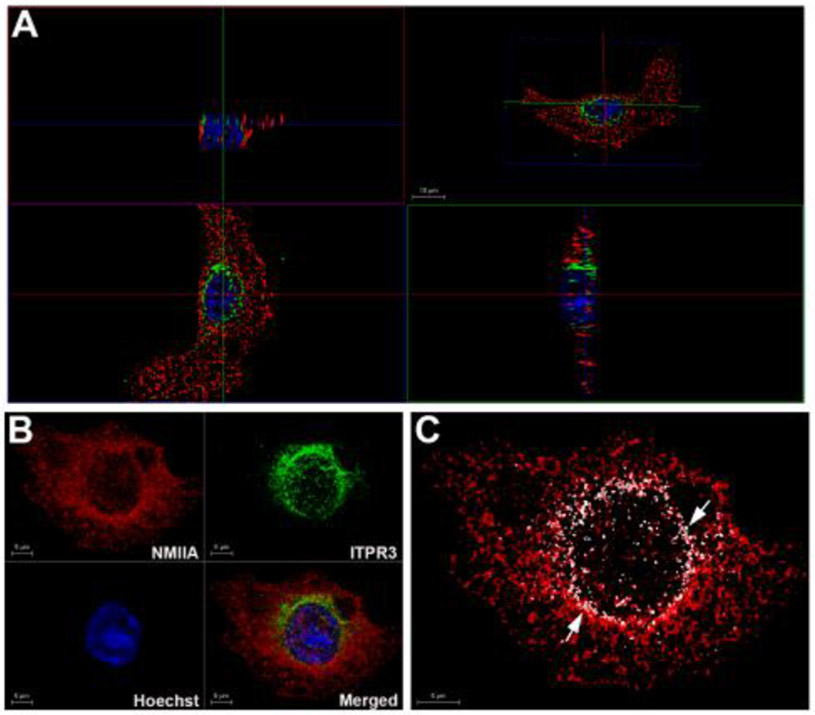
The expression of S100A4 was correlated with the expression of ITPR3. It was demonstrated that NMIIA interacts with S100A4 [23]. We investigate if ITPR3 colocalizes with NMIIA. First, was performed immunofluorescence followed by 3D imaging to visualize the colocalization of ITPR3 with NMIIA in MzChA-1 WT cells. To observe the colocalization of these proteins an 3D orthogonal projections were used (Fig. 7A). The xy and xz projections showed that NMIIA colocalizes with ITPR3. ITPR3 was accumulated at the perinuclear regions of the cells (Fig. 7B). To confirm this colocalization 3D rendering was performed using the LAS X 3D analysis to quantify the number of clusters of ITPR3 that come into contact with NMIIA clusters (only contact points are shown in white, Fig. 7C). Quantification of contact points in 3D demonstrated that 20.2 ± 3.6% (n = 3) of the ITPR3 clusters come in contact with NMIIA. These results demonstrate that ITPR3 colocalizes with NMIIA.
Fig.7. The ITPR3 colocalizes with nonmuscle myosin IIA.
Immunofluorescence representative images of double-labeled MzChA-1 WT cells with ITPR3 and NMIIA, respectively. ITPR3 receptor labeling is in green, NMIIA labeling is in red and the nuclei are stained in blue with Hoechst. (A) Orthogonal sections of three-dimensional (3D) reconstruction were used to demonstrate that ITPR3 colocalizes with NMIIA. At the top right – the 3D projection, at the bottom left – the clipping plane with a view from the front, at the top left - the clip plane with a view from the top and at the bottom right - the clip plane with a view from the left. Images were reconstructed and rendered in 3D to confirm that ITPR3 interacts with NMIIA. Panel B shows the processed representative images. Image C displays in white only the contact points (see white arrows) between ITPR3 and NMIIA of cell presented in panel B. Scale bars = 5 or 10 μm.
4. Discussion
CCA is characterized by a poor prognosis, early invasion and widespread metastasis. However, there is still a lack of accurate noninvasive biomarkers to diagnose and estimate the prognosis of patients with CCA. Surgical resection remains the main potentially curative treatment for all three disease subtypes, and only a small percentage of patients are eligible. Thus, the investigation of new markers underlying the progression of CCA is important for diagnosis and therapy [1, 2, 36].
Here, we studied the expression of EGFR, ITPR3 and S100A4 in resected human CCA samples and correlated the clinical outcomes with these three proteins. A previous study demonstrated that EGFR expression in CCA was associated with tumor progression and recurrence [37]. The EGFR family is known as a tyrosine-protein kinase family involved in many cellular processes by activating several downstream pathways [7, 38]. Activated EGFR can initiate intracellular signals for cell proliferation, migration, adhesion and oncogenesis [26, 38, 39]. Increased EGFR expression and mutations in its gene are associated with neoplasms such as breast cancer, glioblastomas, non-small-cell lung cancer and head and neck squamous cell carcinoma [38]. EGF family proteins are used as potential biomarkers for disease prognosis and progression in several tumors [40-42].
In this work, EGFR expression was considered positive in 31.58% of cases. The univariate analysis showed a higher expression rate in tumors in advanced stages, occurring in 19.6% of stage III + IV tumors versus 10.7% of stage I + II tumors (p = 0.046), translating characteristics of an aggressive phenotype in the presence of invasive disease. However, in our study, EGFR low/negative expression using the Cox proportional hazards ratio showed that the risk of CCA increased 13.56 in patients with low EGFR expression versus those with high EGFR expression (Fig. 5C, p = 0.042). One hypothesis is that high EGFR expression is more important in tumors reaching the advanced stages.
CCA is classified into three subgroups according to its pathologic characteristics and stages. Depending on the location, CCAs have different degrees of invasion into adjacent structures, which may also influence prognosis [43]. The anatomical location implies different survival outcomes, although EGFR expression displayed no significant difference between the three locations, as previously described by our group [44].
EGFR activation by EGF also activates Ca2+ signaling via InsP3, activating ITPRs, and this signaling has been implicated in tumor growth [7]. Under normal conditions, ITPR3 plays an important role in mediating cholangiocyte bicarbonate secretion [45]. ITPR3 is reported to be decreased under cholestatic conditions [46]. ITPR3 is present and concentrated in the apical region of human and rodent bile duct epithelia [9, 45]. The type 3 ITPR is the principal isoform in cholangiocytes, and new evidence suggests that this isoform may play a particularly important role in cancer [9, 12]. Previous work has shown that ITPR3 expression is involved in the pathogenesis of hepatocellular carcinoma [47]. It is also associated with colorectal carcinoma aggressiveness [14]. Ueasilamongkol et al. reported ITPR3 overexpression in both intrahepatic (n = 4) and hilar (n = 3) CCAs [12]. Our study examined ITPR3 expression in a larger number of patients (n = 59) with clinicopathological data according to the anatomic origins of the three types of CCA. It was shown that EGF-induced calcium signaling in the CCA cell line was impaired in ITPR3 KO cells suggesting that EGF mediate InsP3-Ca2+ signaling via ITPR3.
We found that ITPR3 expression was increased in patients with distal CCA compared with intrahepatic CCA and normal bile ducts. High/positive ITPR3 scoring (by IHC staining) was found in 73.6% of cases. Depending on the anatomic origin of CCA, ITPR3 expression was increased in perihilar and distal CCAs compared to intrahepatic CCA. The bioinformatic analysis of an independent study showed that ITPR3 expression was abundant in patients with distal CCA, corroborating our findings. High/positive ITPR3 expression significantly increased with the levels of the tumor marker CA 19–9 in 50% of patients (p = 0.049). Lymph node metastasis was high in 41.1% of cases (p = 0.024).
The effects of calcium rise via ITPR3 are mediated by calcium-binding proteins such as S100A4. This protein has been proposed as a useful marker for predicting the progression, metastasis and prognosis of CCA [20]. S100A4 is localized in the cytoplasm, nucleus, and extracellular space and is involved in many steps of the metastatic cascade, including cell motility, invasion, and angiogenesis [21]. Previous studies of S100A4 expression have reported that the overexpression of S100A4 may be correlated with tumor aggressiveness and a poor prognosis in other types of carcinoma [48, 49]. In this study, S100A4-positive expression in primary CCA was confirmed in 8.7% of cases. However, previous results indicated that nuclear S100A4 was a strong predictor of metastasis and reduced survival after resection in patients with CCA [20]. In our study, we observed nuclear expression in only 3 cases. However, in most of our specimens, cytoplasmic expression was predominant, as observed by Zhang et al. [22]. Furthermore, the positive staining in specimens was not restricted only to tumor cells because highly expressed levels were also detected in tumor/stroma tissues. High/positive S100A4 expression was correlated with a high histological grade, lymph node metastasis and surgical margin. In addition, S100A4 is reported to interact with the C-terminus region of NMIIA, causing filament disassembly [23]. The present work evaluated the colocalization of ITPR3 with NMIIA in MzChA-1 cell line. Our findings demonstrated that ITPR3 colocalized with NMIIA. Thus, NMIIA represents a new interactor protein with ITPR3 and these proteins may form a complex with S100A4. New studies are necessary to confirm this hypothesis.
The development of targeted therapies for CCA is hindered by the heterogeneity of these tumors, and the rarity of cases compared to other solid tumors is still a challenge [50, 51]. Some limitations to this kind of study, such as the limited size of samples (since it is a relatively rare disease), need to be considered. However, the current work was the first to investigate and provide evidence of relationships between ITPR3, S100A4 and EGFR expression and prognostic factors such as CA 19–9, TNM and lymph node metastasis. We also demonstrated increased ITPR3 protein expression in distal CCA, which was confirmed with the bioinformatic analysis. Further work will be necessary to better understand the factors involved in ITPR3 accumulation in CCA and to determine whether these factors can be investigated for therapeutic proposals.
5. Conclusions
Our results demonstrate that the elevated expression of ITPR3 is correlated with clinicopathological findings, such as CA 19–9, TNM stage and lymph node metastasis (N). Furthermore, the expression of ITPR3 and S100A4 was significantly correlated. ITPR3 expression is increased in CCA, and its overexpression is particularly pronounced in patients with distal CCA. The IHC scoring and bioinformatic analysis reinforced these observations. EGF mediates Ca2+ signaling via ITPR3 in a CCA cell line. Furthermore, ITPR3 colocalizes with NMIIA and these proteins may form a network with S100A4. In conclusion, ITPR3 and S100A4 are involved in the progression and pathogenesis of CCA and they may represent a new therapeutical target for CCA.
Supplementary Material
Highlights:
ITPR3 expression is increased in cholangiocarcinoma.
Distal cholangiocarcinoma has increased ITPR3 expression.
ITPR3 and S100A4 clinical scores are correlated.
Nonmuscle myosin IIA (NMIIA) colocalizes with ITPR3.
EGF induces calcium signals in a cholangiocarcinoma cell line.
Acknowledgments
This study was supported by grants from the NIH (1R03TW008709), CNPq, FAPEMIG and CAPES. The funding sources had no role in manuscript writing; data collection, analysis, or interpretation; or any other aspect pertinent to the study. We thank Dr. Michael H. Nathanson that kindly providing the cholangiocarcinoma cell lines.
Abbreviations:
- ITPRs
inositol 1,4,5-trisphosphate receptors
- ITPR3
inositol 1,4,5-trisphosphate receptor type 3
- InsP3
inositol 1,4,5-trisphosphate
- EGFR
epidermal growth factor receptor
- S100A4
S100 calcium-binding protein A4
- CA 19–9
carbohydrate antigen
- CCA
cholangiocarcinoma
- NMIIA
nonmuscle myosin IIA
Footnotes
Publisher's Disclaimer: This is a PDF file of an unedited manuscript that has been accepted for publication. As a service to our customers we are providing this early version of the manuscript. The manuscript will undergo copyediting, typesetting, and review of the resulting proof before it is published in its final form. Please note that during the production process errors may be discovered which could affect the content, and all legal disclaimers that apply to the journal pertain.
Declaration of Competing Interest
The authors declare that they have no known competing financial interests or personal relationships that could have appeared to influence the work reported in this paper.
6. References
- 1.Rizvi S, Khan SA, Hallemeier CL, Kelley RK, Gores GJ. Cholangiocarcinoma — evolving concepts and therapeutic strategies. Nature Reviews Clinical Oncology. 2018;15:95–111. doi: 10.1038/nrclinonc.2017.157. [DOI] [PMC free article] [PubMed] [Google Scholar]
- 2.Banales JM, Marin JJG, Lamarca A, Rodrigues PM, Khan SA, Roberts LR, et al. Cholangiocarcinoma 2020: the next horizon in mechanisms and management. Nature Reviews Gastroenterology & Hepatology. 2020;17:557–88. doi: 10.1038/s41575-020-0310-z. [DOI] [PMC free article] [PubMed] [Google Scholar]
- 3.Banales JM, Huebert RC, Karlsen T, Strazzabosco M, LaRusso NF, Gores GJ. Cholangiocyte pathobiology. Nature Reviews Gastroenterology & Hepatology. 2019; 16:269–81. doi: 10.1038/s41575-019-0125-y. [DOI] [PMC free article] [PubMed] [Google Scholar]
- 4.Harder J, Waiz O, Otto F, Geissler M, Olschewski M, Weinhold B, et al. EGFR and HER2 expression in advanced biliary tract cancer. World Journal of Gastroenterology. 2009; 15:4511. doi: 10.3748/wjg.15.4511. [DOI] [PMC free article] [PubMed] [Google Scholar]
- 5.Mahipal A, Kommalapati A, Tella SH, Lim A, Kim R. Novel targeted treatment options for advanced cholangiocarcinoma. Expert Opinion on Investigational Drugs. 2018;27:709–20. doi: 10.1080/13543784.2018.1512581. [DOI] [PubMed] [Google Scholar]
- 6.Pignochino Y, Sarotto I, Peraldo-Neia C, Penachioni JY, Cavalloni G, Migliardi G, et al. Targeting EGFR/HER2 pathways enhances the antiproliferative effect of gemcitabine in biliary tract and gallbladder carcinomas. BMC Cancer. 2010; 10:631. doi: 10.1186/1471-2407-10-631. [DOI] [PMC free article] [PubMed] [Google Scholar]
- 7.de Miranda MC, Rodrigues MA, de Angelis Campos AC, Faria JAQA, Kunrath-Lima M, Mignery GA, et al. Epidermal growth factor (EGF) triggers nuclear calcium signaling through the intranuclear phospholipase Cδ-4 (PLCδ4). Journal of Biological Chemistry. 2019;294:16650–62. doi: 10.1074/jbc.RA118.006961. [DOI] [PMC free article] [PubMed] [Google Scholar]
- 8.Hirata K, Nathanson MH. Bile duct epithelia regulate biliary bicarbonate excretion in normal rat liver. Gastroenterology. 2001;121:396–406. [DOI] [PubMed] [Google Scholar]
- 9.Hirata K, Dufour J-F, Shibao K, Knickelbein R, O’Neill AF, Bode H-P, et al. Regulation of Ca2+ signaling in rat bile duct epithelia by inositol 1,4,5-trisphosphate receptor isoforms. Hepatology. 2002;36:284–96. [DOI] [PMC free article] [PubMed] [Google Scholar]
- 10.Gomes DA, Thompson M, Souto NC, Goes TS, Goes AM, Rodrigues MA, et al. The type III inositol 1,4,5-trisphosphate receptor preferentially transmits apoptotic Ca2+ signals into mitochondria. Journal of Biological Chemistry. 2005;280. [DOI] [PubMed] [Google Scholar]
- 11.Rodrigues MA, Gomes DA, Leite MF, Grant W, Zhang L, Lam W, et al. Nucleoplasmic Calcium Is Required for Cell Proliferation. Journal of Biological Chemistry. 2007;282:17061–8. doi: 10.1074/jbc.M700490200. [DOI] [PMC free article] [PubMed] [Google Scholar]
- 12.Ueasilamongkol P, Khamphaya T, Guerra MT, Rodrigues MA, Gomes DA, Kong Y, et al. Type 3 Inositol 1,4,5–Trisphosphate Receptor Is Increased and Enhances Malignant Properties in Cholangiocarcinoma. Hepatology. 2020;71:583–99. doi: 10.1002/hep.30839. [DOI] [PMC free article] [PubMed] [Google Scholar]
- 13.Kang SS, Han K-S, Ku BM, Lee YK, Hong J, Shin HY, et al. Caffeine-Mediated Inhibition of Calcium Release Channel Inositol 1,4,5-Trisphosphate Receptor Subtype 3 Blocks Glioblastoma Invasion and Extends Survival. Cancer Research. 2010;70:1173–83. doi: 10.1158/0008-5472.CAN-09-2886. [DOI] [PMC free article] [PubMed] [Google Scholar]
- 14.Shibao K, Fiedler MJ, Nagata J, Minagawa N, Hirata K, Nakayama Y, et al. The type III inositol 1,4,5-trisphosphate receptor is associated with aggressiveness of colorectal carcinoma. Cell calcium. 2010;48:315–23. doi: 10.1016/j.ceca.2010.09.005. [DOI] [PMC free article] [PubMed] [Google Scholar]
- 15.Hedberg ML, Goh G, Chiosea SI, Bauman JE, Freilino ML, Zeng Y, et al. Genetic landscape of metastatic and recurrent head and neck squamous cell carcinoma. Journal of Clinical Investigation. 2015;126:169–80. doi: 10.1172/JCI82066. [DOI] [PMC free article] [PubMed] [Google Scholar]
- 16.Xu C, Chen H, Wang X, Gao J, Che Y, Li Y, et al. S100A14, a Member of the EF-hand Calcium-binding Proteins, Is Overexpressed in Breast Cancer and Acts as a Modulator of HER2 Signaling. Journal of Biological Chemistry. 2014;289:827–37. doi: 10.1074/jbc.M113.469718. [DOI] [PMC free article] [PubMed] [Google Scholar]
- 17.Chen H, Xu C, Jin Q, Liu Z. S100 protein family in human cancer. American journal of cancer research. 2014;4:89–115. http://www.ncbi.nlm.nih.gov/pubmed/24660101. [PMC free article] [PubMed] [Google Scholar]
- 18.Nedjadi T, Evans A, Sheikh A, Barerra L, Al-Ghamdi S, Oldfield L, et al. S100A8 and S100A9 proteins form part of a paracrine feedback loop between pancreatic cancer cells and monocytes. BMC Cancer. 2018; 18:1255. doi: 10.1186/s12885-018-5161-4. [DOI] [PMC free article] [PubMed] [Google Scholar]
- 19.Park CK, Jung WH, Koo JS. Expression of cancer-associated fibroblast-related proteins differs between invasive lobular carcinoma and invasive ductal carcinoma. Breast Cancer Research and Treatment. 2016;159:55–69. doi: 10.1007/s10549-016-3929-2. [DOI] [PubMed] [Google Scholar]
- 20.Fabris L, Cadamuro M, Moserle L, Dziura J, Cong X, Sambado L, et al. Nuclear expression of S100A4 calcium-binding protein increases cholangiocarcinoma invasiveness and metastasization. Hepatology. 2011;54:890–9. doi: 10.1002/hep.24466. [DOI] [PMC free article] [PubMed] [Google Scholar]
- 21.Boye K, Mælandsmo GM. S100A4 and Metastasis. The American Journal of Pathology. 2010;176:528–35. doi: 10.2353/ajpath.2010.090526. [DOI] [PMC free article] [PubMed] [Google Scholar]
- 22.Tian X, Wang Q, Li Y, Hu J, Wu L, Ding Q, et al. The Expression of S100A4 Protein in Human Intrahepatic Cholangiocarcinoma: Clinicopathologic Significance and Prognostic Value. Pathology & Oncology Research. 2015;21:195–201. doi: 10.1007/s12253-014-9806-6. [DOI] [PubMed] [Google Scholar]
- 23.Kiss B, Kalmár L, Nyitray L, Pál G. Structural determinants governing S100A4-induced isoform-selective disassembly of nonmuscle myosin II filaments. The FEBS Journal. 2016;283:2164–80. doi: 10.1111/febs.13728. [DOI] [PubMed] [Google Scholar]
- 24.Edge SB, Compton CC. The American Joint Committee on Cancer: the 7th Edition of the AJCC Cancer Staging Manual and the Future of TNM. Annals of Surgical Oncology. 2010;17:1471–4. doi: 10.1245/s10434-010-0985-4. [DOI] [PubMed] [Google Scholar]
- 25.Amin MB, Greene FL, Edge SB, Compton CC, Gershenwald JE, Brookland RK, et al. The Eighth Edition AJCC Cancer Staging Manual: Continuing to build a bridge from a population-based to a more “personalized” approach to cancer staging. CA: A Cancer Journal for Clinicians. 2017;67:93–9. doi: 10.3322/caac.21388. [DOI] [PubMed] [Google Scholar]
- 26.Faria JAQA, de Andrade C, Goes AM, Rodrigues MA, Gomes DA. Effects of different ligands on epidermal growth factor receptor (EGFR) nuclear translocation. Biochemical and Biophysical Research Communications. 2016;478:39–45. doi: 10.1016/j.bbrc.2016.07.097. [DOI] [PMC free article] [PubMed] [Google Scholar]
- 27.Rodrigues MA, Gamba CO, Faria JAQA, Ferreira Ê, Goes AM, Gomes DA, et al. Inner nuclear membrane localization of epidermal growth factor receptor (EGFR) in spontaneous canine model of invasive micropapillary carcinoma of the mammary gland. Pathology Research and Practice. 2016;212. [DOI] [PMC free article] [PubMed] [Google Scholar]
- 28.Rodrigues MA, Caldeira-Brant AL, Gomes DA, Silveira TL, Chiarini-Garcia H, Cassali GD. Characterization of neoplastic cells outlining the cystic space of invasive micropapillary carcinoma of the canine mammary gland. BMC Veterinary Research. 2021; 17:130. doi: 10.1186/s12917-021-02807-y. [DOI] [PMC free article] [PubMed] [Google Scholar]
- 29.Wolff AC, Hammond MEH, Hicks DG, Dowsett M, McShane LM, Allison KH, et al. Recommendations for Human Epidermal Growth Factor Receptor 2 Testing in Breast Cancer: American Society of Clinical Oncology/College of American Pathologists Clinical Practice Guideline Update. Journal of Clinical Oncology. 2013;31:3997–4013. doi: 10.1200/JCO.2013.50.9984. [DOI] [PubMed] [Google Scholar]
- 30.Wolff AC, Hammond MEH, Allison KH, Harvey BE, McShane LM, Dowsett M. HER2 Testing in Breast Cancer: American Society of Clinical Oncology/College of American Pathologists Clinical Practice Guideline Focused Update Summary. Journal of Oncology Practice. 2018; 14:437–1. doi: 10.1200/JOP.18.00206. [DOI] [PubMed] [Google Scholar]
- 31.Lavalle GE, Bertagnolli AC, Tavares WLF, Cassali GD. Cox-2 Expression in Canine Mammary Carcinomas. Veterinary Pathology. 2009;46:1275–80. doi: 10.1354/vp.08-VP-0226-C-FL. [DOI] [PubMed] [Google Scholar]
- 32.Silveira TL, Veloso ES, Gonçalves INN, Costa RF, Rodrigues MA, Cassali GD, et al. Cyclooxygenase-2 expression is associated with infiltration of inflammatory cells in oral and skin canine melanomas. Veterinary and Comparative Oncology. 2020;18:727–38. doi: 10.1111/vco.12601. [DOI] [PubMed] [Google Scholar]
- 33.Vizcaíno JA, Csordas A, Del-Toro N, Dianes JA, Griss J, Lavidas I, et al. 2016 update of the PRIDE database and its related tools. Nucleic Acids Research. 2016;44:D447–56. doi: 10.1093/nar/gkv1145. [DOI] [PMC free article] [PubMed] [Google Scholar]
- 34.Le Faouder J, Gigante E, Léger T, Albuquerque M, Beaufrère A, Soubrane O, et al. Proteomic Landscape of Cholangiocarcinomas Reveals Three Different Subgroups According to Their Localization and the Aspect of Non-Tumor Liver. PROTEOMICS – Clinical Applications. 2019;13:1800128. doi: 10.1002/prca.201800128. [DOI] [PubMed] [Google Scholar]
- 35.Faraco CCF, Faria JAQA, Kunrath-Lima M, Miranda MC de, de Melo MIA, Ferreira A da F, et al. Translocation of Epidermal Growth Factor (EGF) to the nucleus has distinct kinetics between adipose tissue-derived mesenchymal stem cells and a mesenchymal cancer cell lineage. Journal of Structural Biology. 2018;202:61–9. doi: 10.1016/j.jsb.2017.12.007. [DOI] [PMC free article] [PubMed] [Google Scholar]
- 36.Rizvi S, Gores GJ. Pathogenesis, Diagnosis, and Management of Cholangiocarcinoma. Gastroenterology. 2013;145:1215–29. doi: 10.1053/j.gastro.2013.10.013. [DOI] [PMC free article] [PubMed] [Google Scholar]
- 37.Padthaisong S, Thanee M, Namwat N, Phetcharaburanin J, Klanrit P, Khuntikeo N, et al. A panel of protein kinase high expression is associated with postoperative recurrence in cholangiocarcinoma. BMC Cancer. 2020;20:154. doi: 10.1186/s12885-020-6655-4. [DOI] [PMC free article] [PubMed] [Google Scholar]
- 38.Yarden Y, Pines G. The ERBB network: at last, cancer therapy meets systems biology. Nature Reviews Cancer. 2012;12:553–63. doi: 10.1038/nrc3309. [DOI] [PubMed] [Google Scholar]
- 39.De Angelis Campos AC, Rodrigues MA, de Andrade C, de Goes AM, Nathanson MH, Gomes DA. Epidermal growth factor receptors destined for the nucleus are internalized via a clathrin-dependent pathway. Biochemical and Biophysical Research Communications. 2011;412:341–6. [DOI] [PMC free article] [PubMed] [Google Scholar]
- 40.Arteaga CL, Engelman JA. ERBB Receptors: From Oncogene Discovery to Basic Science to Mechanism-Based Cancer Therapeutics. Cancer Cell. 2014;25:282–303. doi: 10.1016/j.ccr.2014.02.025. [DOI] [PMC free article] [PubMed] [Google Scholar]
- 41.Briffa R, Um I, Faratian D, Zhou Y, Turnbull AK, Langdon SP, et al. Multi-Scale Genomic, Transcriptomic and Proteomic Analysis of Colorectal Cancer Cell Lines to Identify Novel Biomarkers. PLOS ONE. 2015;10:e0144708. doi: 10.1371/journal.pone.0144708. [DOI] [PMC free article] [PubMed] [Google Scholar]
- 42.Miyata K, Yotsumoto F, Fukagawa S, Kiyoshima C, Ouk NS, Urushiyama D, et al. Serum Heparin-binding Epidermal Growth Factor-like Growth Factor (HB-EGF) as a Biomarker for Primary Ovarian Cancer. Anticancer research. 2017;37:3955–60. doi: 10.21873/anticanres.11779. [DOI] [PubMed] [Google Scholar]
- 43.Ercolani G, Dazzi A, Giovinazzo F, Ruzzenente A, Bassi C, Guglielmi A, et al. Intrahepatic, peri-hilar and distal cholangiocarcinoma: Three different locations of the same tumor or three different tumors? European Journal of Surgical Oncology (EJSO). 2015;41:1162–9. doi: 10.1016/j.ejso.2015.05.013. [DOI] [PubMed] [Google Scholar]
- 44.Gomes RV, Rodrigues MA, Rodrigues JBSR, Vidigal PT, Damasceno KA, Lima HA, et al. Expression of epidermal growth factor receptor (EGFR) in cholangiocarcinomas: predictive factors and survival. Revista do Colégio Brasileiro de Cirurgiões. 2018;45. doi: 10.1590/0100-6991e-20181826. [DOI] [PubMed] [Google Scholar]
- 45.Minagawa N, Nagata J, Shibao K, Masyuk AI, Gomes DA, Rodrigues MA, et al. Cyclic AMP Regulates Bicarbonate Secretion in Cholangiocytes Through Release of ATP Into Bile. Gastroenterology. 2007;133:1592–602. [DOI] [PMC free article] [PubMed] [Google Scholar]
- 46.Shibao K, Hirata K, Robert ME, Nathanson MH. Loss of Inositol 1,4,5-trisphosphate receptors from bile duct epithelia is a common event in cholestasis. Gastroenterology. 2003; 125:1175–87. doi: 10.1016/S0016-5085(03)01201-0. [DOI] [PMC free article] [PubMed] [Google Scholar]
- 47.Guerra MT, Florentine RM, Franca A, Lima Filho AC, dos Santos ML, Fonseca RC, et al. Expression of the type 3 InsP 3 receptor is a final common event in the development of hepatocellular carcinoma. Gut. 2019;68:1676–87. doi: 10.1136/gutjnl-2018-317811. [DOI] [PMC free article] [PubMed] [Google Scholar]
- 48.Wang Y-Y, Ye Z-Y, Zhao Z-S, Tao H-Q, Chu Y-Q. High-Level Expression of S100A4 Correlates with Lymph Node Metastasis and Poor Prognosis in Patients with Gastric Cancer. Annals of Surgical Oncology. 2010;17:89–97. doi: 10.1245/s10434-009-0722-z. [DOI] [PubMed] [Google Scholar]
- 49.Tsukamoto N, Egawa S, Akada M, Abe K, Saiki Y, Kaneko N, et al. The Expression of S100A4 in Human Pancreatic Cancer Is Associated With Invasion. Pancreas. 2013;42:1027–33. doi: 10.1097/MPA.0b013e31828804e7. [DOI] [PubMed] [Google Scholar]
- 50.Voss JS, Holtegaard LM, Kerr SE, Fritcher EGB, Roberts LR, Gores GJ, et al. Molecular profiling of cholangiocarcinoma shows potential for targeted therapy treatment decisions. Human Pathology. 2013;44:1216–22. doi: 10.1016/j.humpath.2012.11.006. [DOI] [PubMed] [Google Scholar]
- 51.Banales JM, Cardinale V, Carpino G, Marzioni M, Andersen JB, Invernizzi P, et al. Cholangiocarcinoma: current knowledge and future perspectives consensus statement from the European Network for the Study of Cholangiocarcinoma (ENS-CCA). Nature Reviews Gastroenterology & Hepatology. 2016;13:261–80. doi: 10.1038/nrgastro.2016.51. [DOI] [PubMed] [Google Scholar]
Associated Data
This section collects any data citations, data availability statements, or supplementary materials included in this article.


