Abstract
Human chronic latent magnesium deficiency is estimated to impact a substantive portion of the world’s population. A number of magnesium compounds have been developed to combat this deficiency; however, none are ideal due to issues of solubility, absorption, side effects (e.g., laxation) and/or formulation. Here, we describe the pH-dependent synthesis, chemical characterization (inductively coupled plasma and thermal analysis, infrared and nuclear magnetic resonance (1D and 2D) spectroscopies, and electrospray mass spectrometry) and in vitro uptake (in a cell model of the large intestine (CaCo-2 cells)) of a magnesium complex of the glycine dimer (HG2). Results demonstrate that the HG2 ligand assumes a tridentate coordination mode with an N2O donor set and an octahedral coordination sphere completed with coordinated waters. The magnesium:HG2 complex exhibits significant solubility and cellular uptake.
1. Introduction
Due to insufficient dietary intake, it is now estimated that up to 30% of people living in developed countries may be magnesium-deficient.1,2 Magnesium supplements comprise the primary means of palliating the effects of such magnesium deficiency (hypomagnesemia, defined as <0.75 mmol/L in serum), an issue estimated to affect approximately 45% of Americans alone.3−9 Although providing a relatively efficacious means of treatment, current magnesium supplements are not ideal as they are often suffering from laxative effects,10,11 a lack of water solubility that limits dosing options, incomplete characterization (affecting formulation and dosing), and/or possessing poor gastrointestinal (GI) absorption.12 As such, new ligands that may mitigate these issues are of utmost importance.
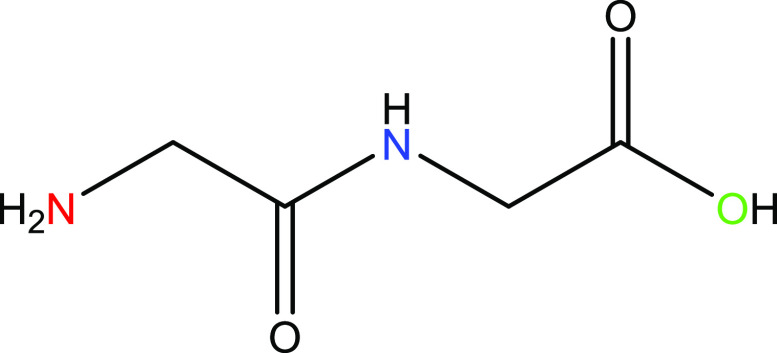
First synthesized in 1901 by Fischer and Fourneau,13 glycylglycine (Figure 1; HG2)—the simplest canonical peptide—is naturally occurring, having been isolated, along with glycylglycylglycine (triglycine) by Fowden et al. in 1968.14 Martell et al. predicted that the HG2 ligand would assume a tridentate coordination mode given that no increased complex stability arises upon forming an 8-membered ring.15 Given the likely coordination chemistry and its substantial water solubility (22.8 g/100 mL),16,17 HG2 is an intriguing ligand for magnesium chelation and the subsequent production of a pharmaceutical-grade magnesium supplement. Additionally, previous studies have indicated the substantial uptake of short glycine peptides in man, including HG2, providing evidence for the efficacious treatment of deficiencies utilizing ligands of this type.18
Figure 1.
Structure of the dipeptide glycylglycine (HG2).
To this end, the work herein describes the synthesis and full characterization of an HG2 chelate of magnesium (1) that builds upon and finally completes the initial 1955–1957 work of Martell et al.15,19 Complete solution- and solid-state characterization and in vitro uptake of 1 in a standard cell model of the large intestine (CaCo-2), is described.
2. Experimental Section
2.1. Materials
Magnesium oxide (99.99% metal basis) was purchased from Fisher Scientific (Waltham, MA, USA). HG2 (Gly–Gly, ≥99%), MgCl2 (BioReagent, ≥97.0%), citric acid (ACS Reagent, ≥99.5%), D2O, and DMSO-d6 NMR solvents, ethanol, and potassium bromide (KBr) for FT-IR analysis were purchased through Sigma-Aldrich (St. Louis, MO, USA). DI water was obtained in-house. Magnesium uptake colorimetric assay kits (catalog #385-100; includes magnesium enzyme mix, assay developer, and magnesium assay buffer) were purchased from BioVision (Milpitas, CA, USA). Stock solutions for magnesium uptake assays were made in-house, with magnesium bisglycinate (MgBG) provided by Balchem Corp (New Hampton, NY, USA) and confirmed for purity in-house by 1H NMR and magnesium triglycine (MgG3) provided in-house. CaCo-2 (HTB-37) cells and Dulbecco’s modified Eagle medium (30–2002) were purchased from ATCC (Manassas, VA, USA). Penicillin streptomycin (10,000 U/mL), fetal bovine serum (FBS), and trypsin/EDTA (0.25%) were purchased from Gibco (Waltham, MA, USA). White clear-bottomed 96-well Armadillo assay plates (Catalog #AB2396) were purchased from ThermoFisher (Waltham, MA, USA).
2.2. Methods
Electrospray ionization mass spectrometry was carried out on a Shimadzu 8040 LC-MS/MS with samples analyzed utilizing a solvent system of H2O/MeOH/0.1% TFA at a flow rate of 0.2 mL/min over a 1.5 min time frame and evaluated from 0–600 m/z. 1D and 2D NMR were conducted on a Bruker Avance III HD 400 MHz instrument. FT-IR was carried out on a Nicolet infrared spectrophotometer. Thermogravimetric analysis (TGA) was carried out on a TA Instrument Q500 from 20–800 °C with sample weights of 5–10 mg. ICP was conducted by Intertek Pharmaceutical Services (Whitehouse, NJ, US). Uptake of magnesium in CaCo-2 cells was determined on a Molecular Devices FlexStation 3 (Molecular Devices). Cellular uptake data was plotted using Prism 8 graphing software.
2.3. Synthesis of Magnesium Glycylglycine (1)
HG2 (1.02 g, 7.57 mmol) was dissolved in DI H2O (∼20 mL) in a 50 mL round-bottom flask, with constant heating at 90 °C and stirring. A separate solution of magnesium oxide (MgO; 0.336 g, 8.33 mmol) was taken up in DI H2O (∼20 mL), with an addition of citric acid (CA; 0.364 g, 2.08 mmol (0.25 equiv)), constantly stirred and heated to 90 °C. The MgO/CA solution was added to the HG2 solution—upon addition, the combined solution turned an opaque white and was observed as translucent white/clear after about 10 min and up until reaction completion. The reaction was left to run for 1 h at 90 °C. The reaction was cooled to room temperature, centrifuged to pellet any remaining solid, and the supernatant was filtered through a 40 μm filter. The pH of the solution was noted as 10.2. The solution was concentrated in vacuo to approximately 3 mL, and the solid was precipitated with anhydrous ethanol. Centrifugation was employed to pellet the solid, and the ethanol was decanted off. The solid was triturated with diethyl ether ad libitum and centrifuged. The ether was decanted off. To ensure that no trace solvent remained, the solid was reconstituted in DI H2O (∼50 mL), flash-frozen, and dried in vacuo on a lyophilizer. The dried material was collected and massed to 1.28 g. Yield was found to be 74% relative to magnesium and 82.6% pure with a 17.3% impurity attributed to magnesium citrate. 1: 1H NMR (D2O, 400 MHz): δ 3.76 (s, 2H, H2), 3.38 (s, 2H, H1). ESMS m/z: [Mg (G2) + H+]+ calcd for Mg(C4H7N2O3) 155.4; found 155, [1 + H+]1+ calcd for [MgC4H12N2O6 + H+]1+ 209.5; found 210 (Figure S1). (Mg(C4H7N2O3)(H2O)(OH)): By ICP calcd: Mg, 8.66%; N, 9.99%; found: Mg, 8.78%; N, 9.89%; calcd ratio Mg:N = 0.87, found ratio Mg:N = 0.89 (Scheme 1).
Scheme 1. Synthetic Approach to the Synthesis of 1.

2.4. Culturing of CaCo-2 Cells
CaCo-2 cells were cultured from liquid N2 frozen stocks and rapidly thawed to RT using a water bath at 37 °C; cryopreservation media was removed with a micropipette after cells were pelleted via centrifugation for 5 min at 125 g. Cells were resuspended in 1 mL of room temperature Dulbecco’s modified Eagle medium (DMEM) and cultured in 14 mL of DMEM (total volume of 15 mL) with a seeding density of 3.6 × 10⁴ cells/cm2 (CaCo-2) in a T-75 cm2 culture flask and left to grow in an incubator at 37 °C and 5% CO2. Cells were subcultured at 90% confluency, and subculturing occurred in a minimum of five times before use in uptake assays. When cultures reached 90% confluency, media was removed and 3 mL of trypsin/EDTA was added; the trypsinized culture flask was placed back in the incubator for ∼10 min to detach cells. Once detached, cells were confirmed under a microscope, the culture flask was rinsed with 6 mL of fresh media to neutralize the trypsin/EDTA, and cells for uptake assays were then counted utilizing a DeNovix CellDrop. Once counted, cells were pelleted down via centrifugation at 125 g for 10 min, and the supernatant was removed via pipetting. Cells were resuspended in 5 mL of room temperature magnesium assay buffer for cellular uptake assay.
2.5. Determination of Magnesium Uptake in CaCo-2 Cells
A colorimetric magnesium uptake assay kit for use with a 96-well plate was purchased from BioVision (Milpitas, CA, US). Sample solutions for use with the kit were prepared in house utilizing magnesium-/calcium-free Hank’s balanced salt Solution (HBSS). The samples tested were magnesium chloride hexahydrate (MgCl2× 6 H2O), 1, MgBG, and MgG3. The kit provided standard for linearity confirmation consists of a 150 nm/μL stock; as such, MgCl2× 6 H2O, utilized as an internal standard, was prepared at this concentration containing 17.93 mM Mg2+. All samples were prepared to contain the same amount of Mg2+ so as to evaluate magnesium uptake in a relative fashion. DMEM was removed from the plated cells, and cells were subsequently washed three times with HBSS in 100 μL volume. All samples were administered at 150 μL/well as triplicate independent dilutions. Cells were treated for 1–2 h at 37 °C and 5% CO2. After incubating, the sample volume was removed from each well and the cells were again washed three times with HBSS. Cells were lysed utilizing 200 μL of kit assay buffer, the post-lysis volume was collected, and each sample was centrifuged at 14,000g for 10 min. The resulting supernatants were replated in the same order in 50 μL volume. Fifty microliters of kit-provided enzyme/buffer/developer mix was added to each well with a multichannel micropipette, and the plate was allowed to incubate for 40 min at 37 °C. Some wells were left blank for required background subtraction. The kit-provided standard was diluted to 0, 3, 6, 9, 12, and 15 nmol/μl in DI H2O and administered and developed in the same volumes as the samples and was used only to determine kit linearity (see Figure S12). Each well was analyzed for endpoint value over nine full-plate scans with triplet scans/well/plate scan (a total of 27 scans per well), and the reported value of each well was the average value of these scans after background subtraction. All samples were analyzed in triplicate. Data was collected at 40 min. Raw data was reduced and plotted as absorbance against magnesium concentration of each well. All assays were repeated in triplicate—error bars were shown in a graph (Figure 9) (SEM: MgCl2 = 0.0006, MgBG = 0.0006, 1 = 0.0007, MgG3 = 0.001; upper 95% C.I.: MgCl2 = 0.004, MgBG = 0.003, 1 = 0.004, MgG3 = 0.006; lower 95% C.I.: MgCl2 = 0.001, MgBG = 8.98 × 10⁻⁵, 1 = 1.11 × 10⁻⁵, MgG3 = 0.0005).
Figure 9.
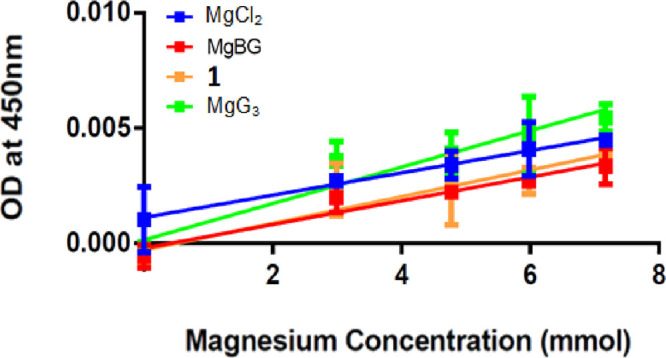
Cellular uptake of 1 (orange) plotted with magnesium bisglycinate (red), magnesium triglycine (green), and MgCl2 (blue) in CaCo-2 cells. Slope/R2 MgCl2: 5 × 10⁻⁵/0.7373. Slope/R21: 5 × 10⁻⁴ /0.7231. Slope/R2 MgBG: 5 × 10⁻⁴/0.8477. Slope/R2 MgG3: 7 × 10⁻⁴/0.8019. SEM: MgCl2 = 0.0006, MgBG = 0.0006, 1 = 0.0007, MgG3 = 0.001; upper 95% C.I.: MgCl2 = 0.004, MgBG = 0.003, 1 = 0.004, MgG3 = 0.006 ; lower 95% C.I.: MgCl2 = 0.001, MgBG = 8.98 × 10⁻⁵, 1 = 1.11 × 10⁻⁵, MgG3 = 0.0005. Kit linearity provided in Figure S12.
3. Results and Discussion
3.1. Structural Characterization of 1 Via Infrared Spectroscopy
The FT-IR of 1 relative to HG2 exhibited a substantial change in the frequency region that corresponds specifically to the −OH stretching mode attributed to the carboxylic acid of the HG2 ligand at 3287 cm–1. HG2 exhibited a sharp stretching band in this region that is not observed for 1, providing support for the deprotonation of the acid (pKa = 3.14). Additionally, HG2 exhibits a broad signal at 2055 cm–1, which is attributed to the terminal amine (−NH3+),21 a signal not observed for 1. This implicates that both the terminal amine and the terminal acid are in coordination. The FT-IR spectra of HG2 and 1 are provided as Figure 2. IR values are provided as Table 1.
Figure 2.
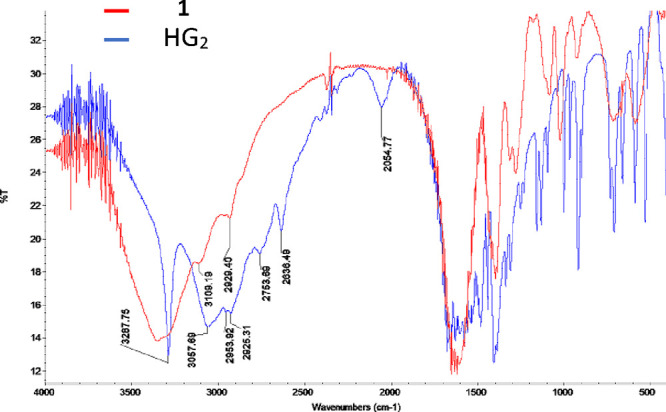
FT-IR spectrum of HG2 and 1 in KBr.
Table 1. Infrared Spectroscopy Values for HG2 and 1.
| complex | IR frequency (cm–1) | assignment |
|---|---|---|
| HG2 | 3287 | v(OH), C–OH |
| 2055 | v(−NH3+) | |
| 1 | 3360 | v(OH), H2O |
| v(−NH3+) |
3.2. Determining the Chemical Composition of 1 Via ICP and Thermal Analyses
Duplicate independent ICP analyses were conducted on 1 from the same synthetic batch. Acquisition of nitrogen values is complicated by the substantially hygroscopic nature of 1. ICP analysis elucidated the percent magnesium present in the samples and thus provided compositional insight utilizing a Mg:N ratio. The ICP provided values of Mg = 8.78% and N = 9.89% (Figure S11). The values are consistent with a species of composition Mg(G2)(H2O)(OH) × 5 H2O. The theoretical nitrogen and magnesium values for this species are Mg = 8.66% and N = 9.99%. Utilizing the Mg:N ratio, the experimental ratio of M:N = 0.89 and is consistent with the theoretical value of Mg:N = 0.87.
TGA of HG2 exhibited a single, gradual percent weight decrease onset at 220 °C (inflection point observed at 270 °C), which is consistent with the melting point of HG2 at 220 °C. TGA analysis of 1 indicated a gradual decline in percent weight onset from 30 °C until just before 200 °C. The weight change accounts for a loss of 21%, which is consistent with the loss of 2 waters (calculated to 19%) (Figure 3). This result is consistent with the tendency of magnesium to take on water in a rapid fashion,22,23 thus suggesting the core magnesium species Mg(G2)(H2O)(OH) where rapid acquisition of subsequent water molecules is likely.
Figure 3.
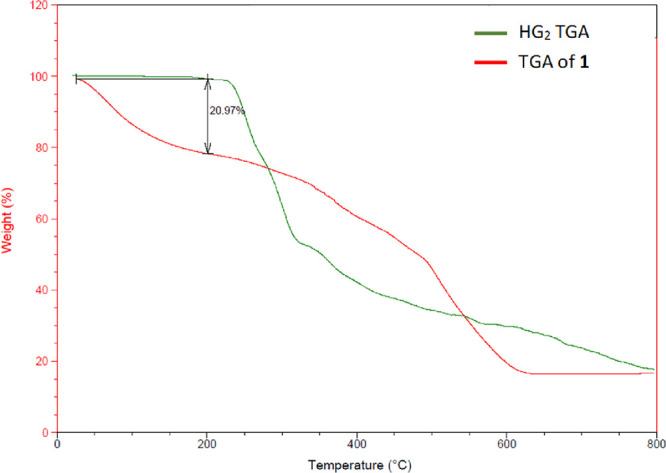
Overlay of HG2 TGA (green) and TGA of 1 (red).
3.3. Structural Characterization of 1 Via 1D and 2D 1H/13C NMR
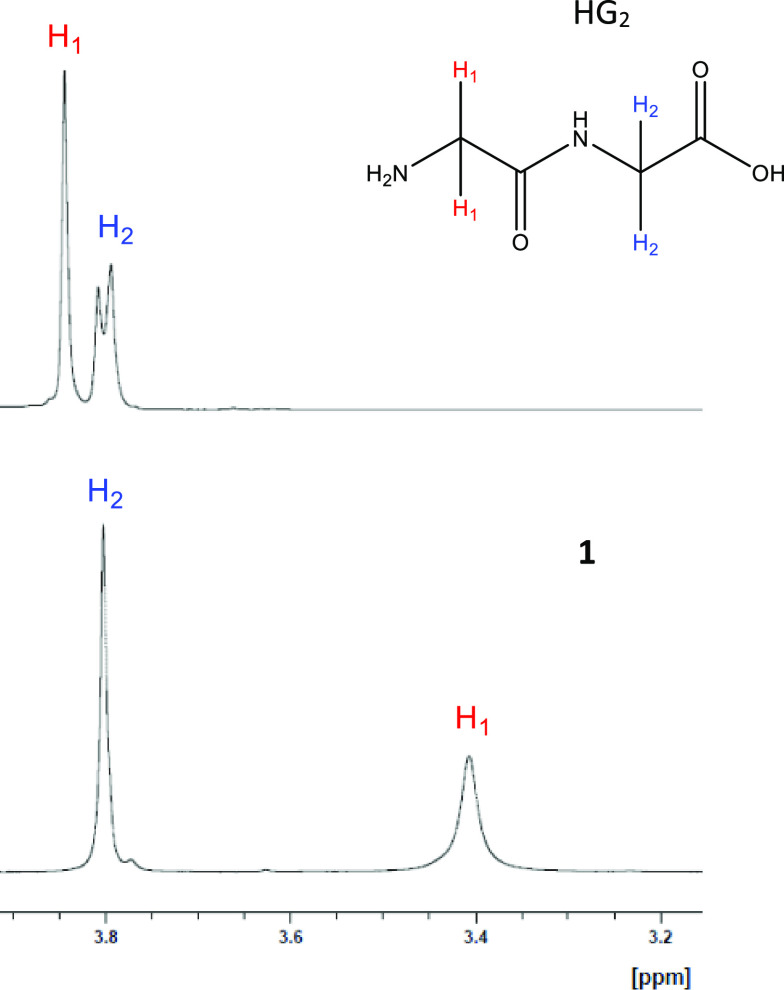
Further support for the coordination mode of 1 was provided in the form of solution-state NMR analysis at equimolar concentration. 1H NMR of 1 was conducted relative to the HG2 ligand. The 1H NMR spectrum of HG2 exhibited two proton signals with a combined integration of two (2) (not sure what this 2 means); the observed signals were a sharp singlet at 3.84 ppm (H1) and a doublet centered around 3.80 ppm (H2; Figure 4; full spectra 1H NMR of HG2 available as Figure S2). Additionally, the 1H NMR 1 exhibited a combined integration of four (4). These observations were consistent with the hypothesized observations. Like the 1H NMR spectrum of HG2, spectral analysis of 1 exhibited two proton signals with a combined integration of four (4). Unlike HG2, the observed proton signals of 1 were both singlets, and each singlet exhibited a substantial upfield shift: H1 = 3.38 ppm (Δppm = 0.46) and H2 = 3.76 (Δppm = 0.04) (Figure 4; full 1H NMR spectrum of 1 is provided as Figure S3). Furthermore, spectral analysis of 1 revealed a quartet between 2.50–2.70 ppm attributed to magnesium citrate of a 1:1 magnesium:citrate composition when compared to a magnesium citrate standard, which is a result of citric acid utilization during synthesis (Figure 4 and Figure S5). Full spectra 1H NMR overlay indicating solvent calibration is provided as Figure S4.
Figure 4.
1HNMR overlay of HG2 (top) and 1 (bottom) conducted in D2O. Asterisks indicate peaks attributed to magnesium citrate.
As previously reported by Case et al. when analyzing a triglycine chelate of magnesium, the more substantial upfield shift of the proton nearest the terminal amine (H1) implicates the participation of this moiety in coordination.20 Additionally, coalescing of the H2 proton signal for 1 relative to HG2 suggests coordination to the carboxylic acid that results in an even distribution of electron density and subsequent lack of observed splitting. Furthermore, the observation of upfield proton shifting coincides with generalized magnesium coordination and may be observed for the α-proton adjacent to the point of coordination and as far-reaching as the γ-proton.24−27 Conserved integration of the HG2 proton signals is consistent with no formation of new ligand-based product and is consistent with the 1:1 stoichiometric yield of the previously discussed synthesis.
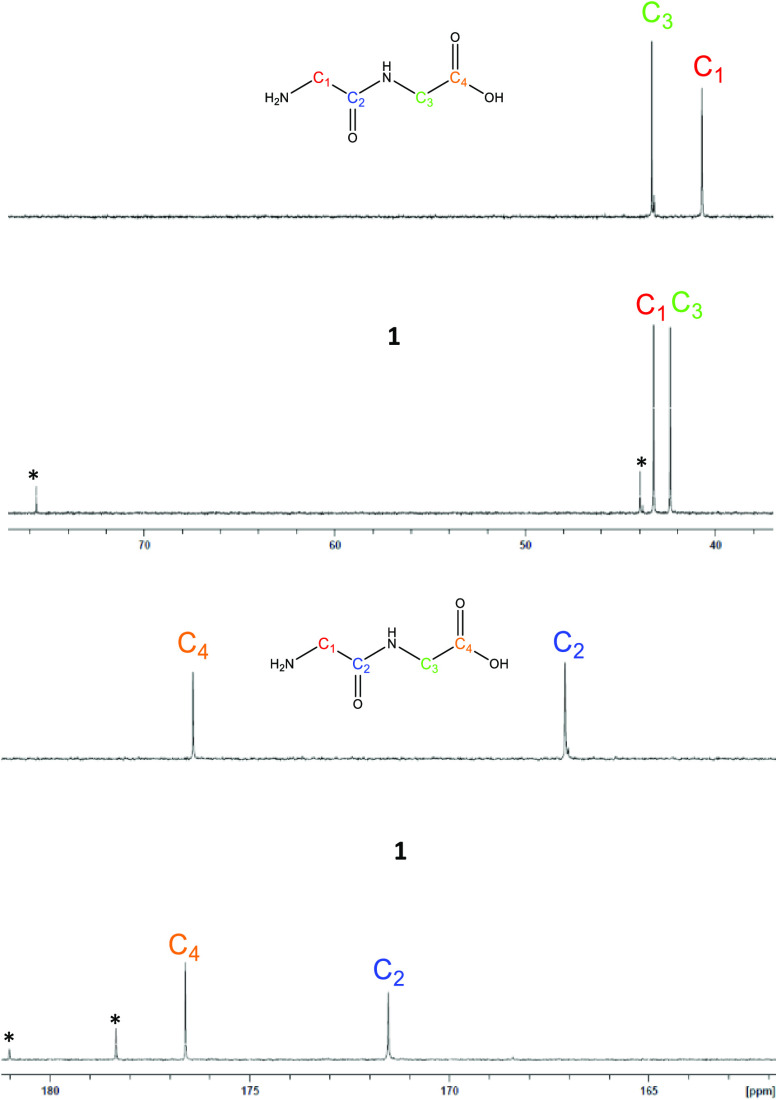
13C NMR was conducted with the aim of confirming the conclusions derived from infrared and 1H NMR analyses and is supported as a more sensitive method for determining the mode of magnesium coordination.26,27 The 13C NMR of 1 was conducted relative to HG2. Spectral analysis HG2 revealed four carbon signals: two signals between the range of 40–50 ppm attributed to the sp3-hybridized R–CH2–R carbon moieties (C1, 40.7 ppm; C3, 43.4 ppm) and two signals between 160–180 ppm attributed to the sp2-hybridized R–CO–R moieties (C2, 167.1 ppm; C4, 176.4 ppm) (Figure 5). 13C analysis of 1 exhibited four carbon signals in the same regions as the free HG2 ligand. In contrast to the 13C spectrum of HG2, the signal separation was substantially diminished, which is a result of the downfield shift of the C1 (Δppm = 3) and C2 (Δppm = 8) signals to 43.2 ppm and 175 ppm, respectively. These observations are consistent with those reported by Drevenṧek et al.24 and Chang et al.27 in their studies of magnesium testosterone and magnesium ofloxacin/levofloxacin, respectively and are consistent with magnesium coordination in regions adjacent to these moieties. Additionally, in agreement with 1H NMR analysis, 13C NMR analysis of 1 exhibited four signals attributed to magnesium citrate (Figure 5 and Figures S7 and S8), and no new ligand-based carbon signals were observed, further supporting the formation of 1 as a 1:1 complex.
Figure 5.
13C NMR overlay of HG2 and 1 sp3-hybridized carbons (top) and HG2 and 1 sp2-hybridized carbons (bottom) conducted inD2O. Asterisks indicate peaks attributed to magnesium citrate.
Both 2D 1H/13C heteronuclear single quantum coherence (HSQC), which shows correlations between a defined proton and the carbon a single bond distance away, and heteronuclear multiple-bond correlation (HMBC), which confirms the interaction defined proton and corresponding carbons over multiple bond lengths, confirmed all proton and carbon signal assignments. The HSQC spectrum of HG2 (Figure 6) indicated two correlation points: one point attributed to H1 and one point attributed to H2. The point attributed to H1 corresponded to the carbon signal at 40.7 ppm, confirming this to be C3, and the point attributed to H2 corresponded to the carbon signal at 43.4 ppm, confirming this carbon to be C1. The HMBC of HG2 (Figure 7) showed three correspondence points of ratio 1:2. The proton signal attributed to H2 exhibited two correspondence points. Given that H1 is within range of only one carbon, this indicates that the observed correspondence point for H1 at 167.1 ppm is attributed to C2. Additionally, H2 shows two correspondence points. Given that the C2 carbon signal corresponds to two protons, this confirms the assignment of the C2 proton given its proximity to both protons, and the remaining carbon signal at 176.5 ppm is confirmed as C4 given that it is out of range of the H1 proton (Figure 7).
Figure 6.
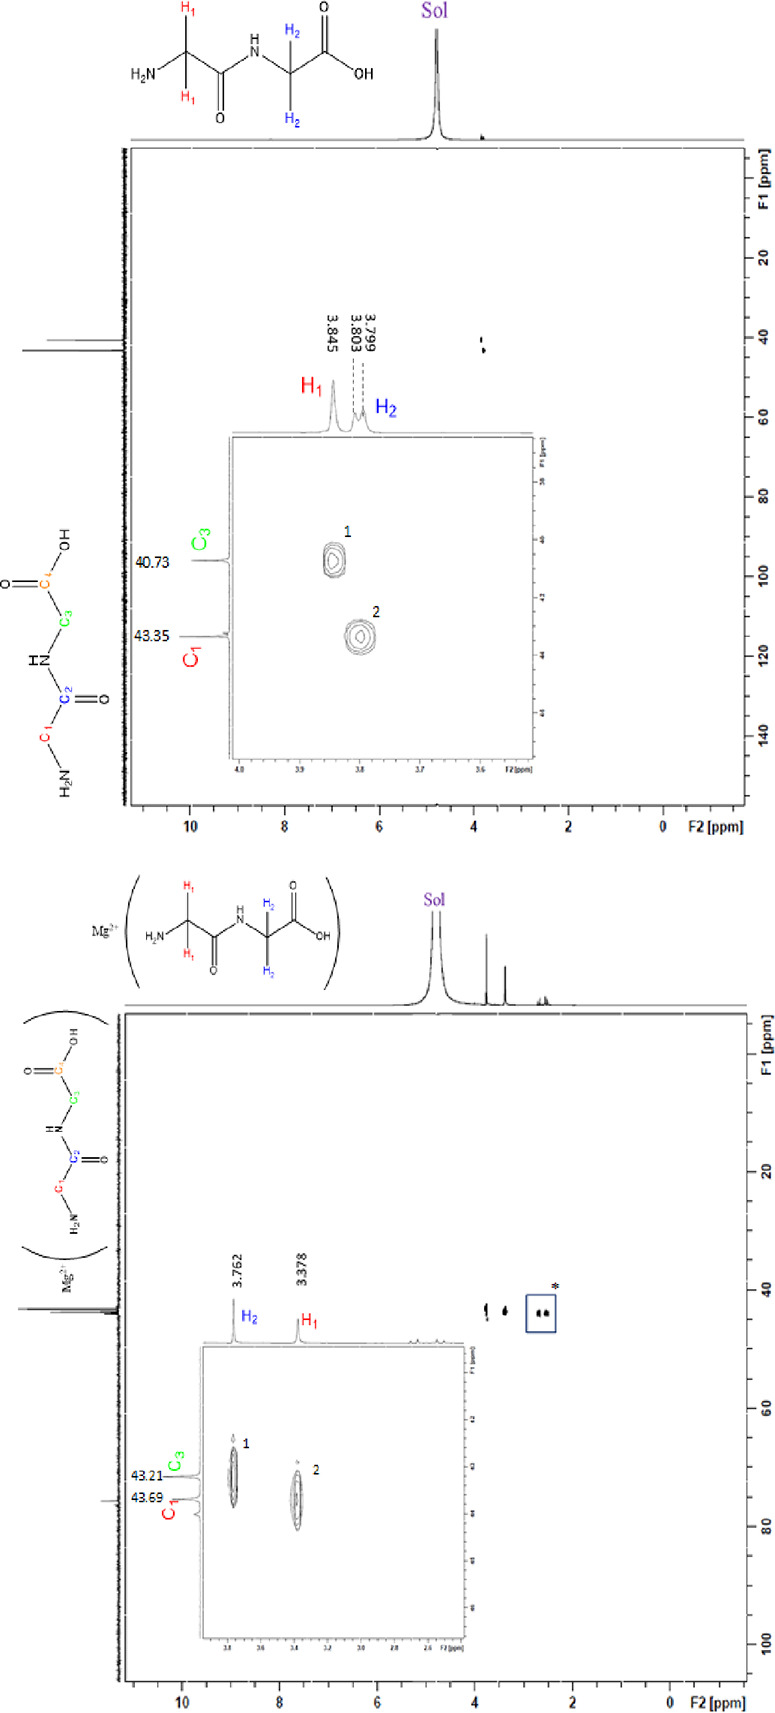
2D HSQC of HG2 (top) and HSQC (bottom) of 1 conducted in D2O. “Sol” represents the residual HOD peak.
Figure 7.
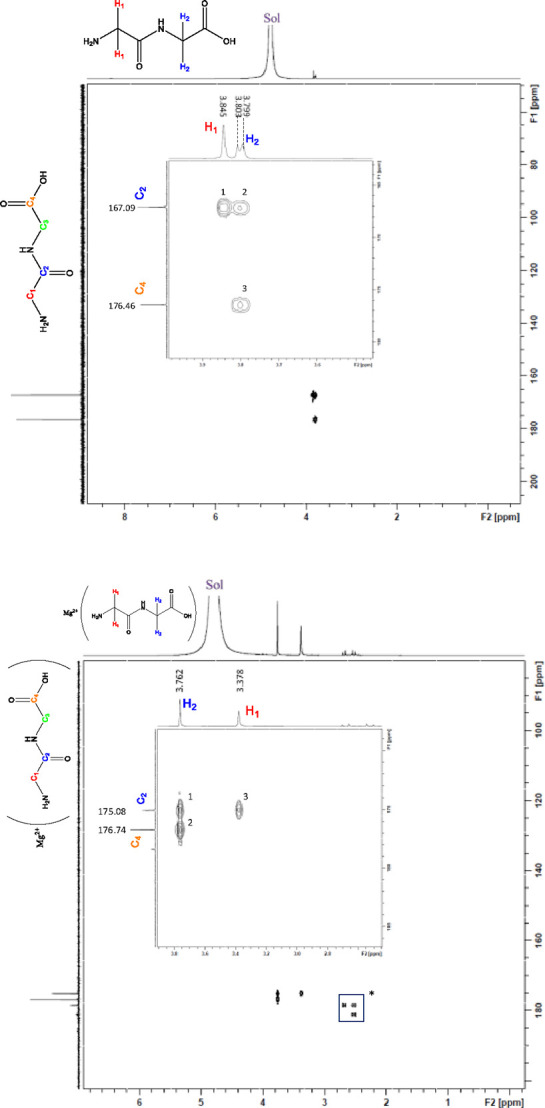
2D HMBC of HG2 (top) and HMBC (bottom) of 1 conducted in D2O. Asterisks indicate signals attributed to magnesium citrate. “Sol” indicates the residual HOD signal.
HSQC analysis of 1 (Figure 6) indicates two correspondence points like that of the free HG2 ligand (Figure 6). In contrast to the HMBC of the free HG2 ligand, the ratio of correspondence points observed for 1 is switched (2:1) (Figure 7). Given the observations made for the HMBC of HG2, this indicates that the more substantial upfield shift attributed to the H1 proton during 1H NMR analysis is consistent, with terminal amine participation in coordination. Additionally, the HMBC confirms the H2 assignment and implicates the terminal carboxylic acid moiety, which was previously supported by infrared analysis.
A combination of both 1D and 2D 1H/13C NMR provides insight into the overall coordination mode of the HG2 ligand and indicates that the ligand acts as a tridentate chelate that coordinates via an N2O donor set. This coordination is achieved via the terminal amine, the backbone amide, and the terminal carboxylic acid. These results are consistent with magnesium chelate ligands assuming higher-order coordination modes that favor entropically stable complexes,28−30 as well as previous studies that indicate the tendency of ligands such as HG2 and triglycine to act as tri- and tetradentate magnesium chelates.15,19 Lastly, all NMR analyses of 1 exhibit minimum amounts of magnesium citrate, confirming an 82.6% purity of 1.
3.4. Overall Discussion on the Structure of 1
The combined solution- and solid-state data is consistent with the structure as shown in Figure 8. The HG2 ligand acts as a tridentate magnesium chelate and assumes an N2O donor set to form an entropically-favored complex. Additionally, the six-coordinate, octahedral coordination sphere is completed by two waters and one hydroxide. Confirmation of the presence of a hydroxide anion was provided by a series of potentiometric experiments evaluating the conductivity of 1 relative to potassium chloride (KCl; a 1:1 electrolyte). Solutions of both KCl and 1 were prepared at concentrations of 1, 10, and 100 mM, respectively. At 100 mM, data indicated that KCl has a conductivity of 13.11mS and 1 has a conductivity of 5.08 mS (approximately 2.5× less than that of KCl). These data indicate that 1 acts as a 1:1 electrolyte with only partial dissociation, which is consistent with the previously reported MgG3.20 Conductivity values for both KCl and 1 trend linearly at the given concentration range with R2KCl = 1.0000 and R21 = 0.9995.
Figure 8.
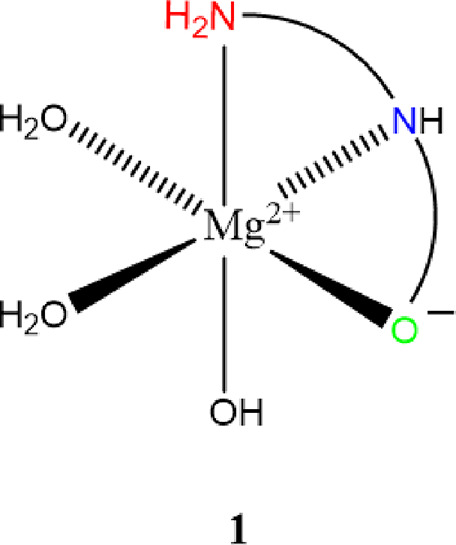
The predicted chemical structure of 1 based on solution- and solid-state analyses. Waters of crystallization are omitted for clarity.
3.5. Determining the Water Solubility of 1
The solubility of 1 was determined via triplicate independent analyses and compared to other reported magnesium chelate complexes. Analysis indicated that 1 has a water solubility of approximately 39 g/100 mL. While more soluble than MgO, 1 is less soluble than MgCl2 and about one fifth as soluble as MgG3, which is previously reported by Case et al. (Table 2).20 The water solubility of 1 is attributed in part to the inherent change to a more polar complex given the substantial electropositive character of the divalent magnesium and the dipole alteration generated upon ligand coordination. Additionally, as was the case with MgG3,20 it is likely that the extensive hydrogen bond network of the HG2 ligand is efficacious in generating increased water solubility.
Table 2. Water Solubilities of Previously Reported Magnesium Chelate Complexes and Common Magnesium Compounds.
3.6. In Vitro Cellular Uptake of 1
Cellular uptake of 1 was evaluated in a lower intestinal colorectal carcinoma (CaCo-2) cell line relative to select previously reported magnesium chelate complexes and MgCl2 (Figure 9). Uptake is plotted as a linear regression.
Analysis of cellular uptake data indicates that 1 exhibits uptake less than that of MgCl2 and comparable to MgBG. Furthermore, observed uptake of 1 was only about half that of the previously reported MgG3 complex.20 Uptake increases with increased peptide length from MgBG, 1, and MgG3. This is consistent with the uptake observed in humans for the free mono-, di- and tripeptide glycine ligands observed by Craft et al.18 Craft explains that the rate of cellular uptake of the free ligands is directly related to the available mole quantity of the ligand and the corresponding rate of uptake as it pertains to the amount of ligand available.18 It is believed that in the case of the uptake of magnesium chelates of glycine-based complexes as reported, Craft’s discussion supports the observable uptake trend. The trend of increasing uptake with a corresponding increase in peptide length is also supported by the findings of Hellier et al., who observed greater intestinal absorption of HG2 relative to glycine in human studies.32
Additionally, uptake appears to exhibit trending relative to complex solubility. Further in vivo testing is required to confirm this uptake trend at concentrations near complex solution saturation.
4. Conclusions
Both solution- and solid-state methods confirm the successful synthesis of a 1:1 magnesium-HG2 complex: 1. Both 1D and 2D 1H/13C NMR as well as FTIR confirm that the HG2 ligand acts as a tridentate chelate and coordinates via an N2O donor set utilizing the terminal amine, the backbone amide, and the terminal carboxylic acid. This coordination mode is consistent with the hypothesis previously reported by Martell et al.15,19 Additionally, 1 has a predicted distorted octahedral geometry with the remaining three coordination sites not utilized by the HG2 ligand, occupied by water and a hydroxide anion for charge balance, which was subsequently confirmed utilizing conductivity. Furthermore, solid-state analyses indicate the propensity of 1 to adsorb water. This is observed in both the ICP and thermal analyses of 1, exhibiting pentahydrate and tetrahydrate composition, respectively. The in vitro uptake of 1 was comparable to that of the bisglycine chelate MgBG, although both were significantly lower than that of MgCl2 or the triglycine chelate MgG3, indicating a trend of increasing uptake with increasing peptide length and higher-order coordination (bi-, tri-, and tetradentate). Further in vivo testing is required to confirm the observed in vitro trends.
Acknowledgments
The authors wish to thank Balchem Corp. for financial support in conducting this research. Additionally, the authors wish to thank Syracuse University.
Glossary
Abbreviations
- MgBG
magnesium bisglycinate
- MgG3
magnesium triglycine
- CaCo-2
colorectal carcinoma cells differentiated into human intestinal epithelial cells
- MgCl2
magnesium chloride
- MgO
magnesium oxide
- ESMS
electrospray mass spectrometry
- ICP
inductively coupled plasma
- NMR
nuclear magnetic resonance
- HSQC
heteronuclear single quantum coherence
- HMBC
heteronuclear multiple bond correlation
- FT-IR
Fourier transform infrared radiation
- TGA
thermogravimetric analysis
- DSC
differential scanning calorimetry
Supporting Information Available
The Supporting Information is available free of charge at https://pubs.acs.org/doi/10.1021/acsomega.1c04146.
Full spectra 1H/13C NMR of HG2/1; confirmation of magnesium citrate impurity via 1H/13C NMR; raw elemental analysis values; cellular uptake of 1 relative to percent composition of magnesium (PDF)
Author Contributions
R.P.D. conceived of the project. R.P.D. and J.Z. mentored D.R.C. All synthetic, chemical, and biochemical work was conducted by D.R.C. D.R.C. and R.P.D. drafted the manuscript with assistance from all authors.
Funding for this work was provided by Balchem Corp. (New Hampton, NY, USA) to R.P.D.
The authors declare the following competing financial interest(s): RPD is a paid scientific advisory board member of Balchem Corporation.
Notes
R.P.D. sits on the scientific advisory board of Balchem Corp. (New Hampton, NY, United States).
Supplementary Material
References
- DiNicolantonio J. J.; O’Keefe J. H.; Wilson W. Subclinical Magnesium Deficiency: A Principal Driver of Cardiovascular Disease and a Public Health Crisis. Open Heart 2018, 5, e000668 10.1136/openhrt-2017-000668. [DOI] [PMC free article] [PubMed] [Google Scholar]
- Costello R. B.; Elin R. J.; Rosanoff A.; Wallace T. C.; Guerrero-Romero F.; Hruby A.; Lutsey P. L.; Nielsen F. H.; Rodriguez-Moran M.; Song Y.; et al. Perspective: The Case for an Evidence-Based Reference Interval for Serum Magnesium: The Time Has Come. Adv. Nutr. 2016, 7, 977–993. 10.3945/an.116.012765. [DOI] [PMC free article] [PubMed] [Google Scholar]
- Kass L.; Weekes J.; Carpenter L. Effect of Magnesium Supplementation on Blood Pressure: A Meta-Analysis. Eur. J. Clin. Nutr. 2012, 66, 411–418. 10.1038/ejcn.2012.4. [DOI] [PubMed] [Google Scholar]
- Guerrera M.; Volpe S.; Mao J. Therapeutic Uses of Magnesium. Am. Fam. Physician 2009, 80, 157–162. [PubMed] [Google Scholar]
- Classen H.-G.; Kisters K. Magnesium and Osteoporosis. Trace Elem. Electrolytes 2017, 34, 100–103. 10.5414/TEX01482. [DOI] [Google Scholar]
- Verma H.; Garg R. Effect of Magnesium Supplementation on Type 2 Diabetes Associated Cardiovascular Risk Factors : A Systematic Review and Meta-Analysis. J. Hum. Nutr. Diet. 2017, 30, 621–633. 10.1111/jhn.12454. [DOI] [PubMed] [Google Scholar]
- Mofrad M. D.; Djafarian K.; Mozaffari H.; Shab-Bidar S. Effect of Magnesium Supplementation on Endothelial Function : A Systematic Review and Meta-Analysis of Randomized Controlled Trials. Atherosclerosis 2018, 273, 98–105. 10.1016/j.atherosclerosis.2018.04.020. [DOI] [PubMed] [Google Scholar]
- Vormann J. Magnesium: Nutrition and Metabolism. Mol. Aspects Med. 2003, 24, 27–37. 10.1016/S0098-2997(02)00089-4. [DOI] [PubMed] [Google Scholar]
- Workinger J. L.; Doyle R. P.; Bortz J. Challenges in the Diagnosis of Magnesium Status. Nutrients 2018, 10, 1202. 10.3390/nu10091202. [DOI] [PMC free article] [PubMed] [Google Scholar]
- Thongon N.; Krishnamra N. Apical Acidity Decreases Inhibitory Effect of Omeprazole on Mg2+ Absorption and Claudin-7 and -12 Expression in Caco-2 Monolayers. Exp. Mol. Med. 2012, 44, 684–693. 10.3858/emm.2012.44.11.077. [DOI] [PMC free article] [PubMed] [Google Scholar]
- Coudray C.; Feillet-Coudray C.; Rambeau M.; Tressol J. C.; Gueux E.; Mazur A.; Rayssiguier Y. The Effect of Aging on Intestinal Absorption and Status of Calcium, Magnesium, Zinc, and Copper in Rats: A Stable Isotope Study. J. Trace Elem. Med. Biol. 2006, 20, 73–81. 10.1016/j.jtemb.2005.10.007. [DOI] [PubMed] [Google Scholar]
- Ropp R. C.Group 16 (O, S, Se, Te) Alkaline Earth Compounds; 2013; Vol. 16.
- Dunn M. S.; Butler A. W.; Deakers T. The Synthesis of Glycylglycine. J. Biol. Chem. 1932, 99, 217–220. 10.1016/S0021-9258(18)76083-3. [DOI] [Google Scholar]
- Fowden L.; Smith A. Peptides From Blighia Sapida Seed. Phytochemistry 1969, 8, 1043–1045. 10.1016/S0031-9422(00)86353-0. [DOI] [Google Scholar]
- Manyak A. R.; Murphy C. B.; Martell A. E. Metal Chelate Compounds of Glycylglycine and Glycylglycylglycine. Arch. Biochem. Biophys. 1955, 59, 373–382. 10.1016/0003-9861(55)90504-X. [DOI] [PubMed] [Google Scholar]
- Nozaki Y.; Tanford C. The Solubility of Amino Acids, Diglycine, and Triglycine in Aqueous Guanidine Hydrochloride Solutions. J. Biol. Chem. 1970, 245, 1648–1652. 10.1016/S0021-9258(19)77141-5. [DOI] [PubMed] [Google Scholar]
- Pérez-Sánchez G.; Santos Y. S.; Ferreira O.; Coutinho J. A. P.; Gomes J. R. B.; Pinho S. P. The Cation Effect on the Solubility of Glycylglycine and N-Acetylglycine in Aqueous Solution: Experimental and Molecular Dynamics Studies. J. Mol. Liq. 2020, 310. 10.1016/j.molliq.2020.113044. [DOI] [Google Scholar]
- Craft I. L.; Geddes D.; Hyde C. W.; Wise I. J.; Matthews D. M. Absorption and Malabsorption of Glycine and Glycine Peptides in Man. Gut 1968, 9, 425–437. 10.1136/gut.9.4.425. [DOI] [PMC free article] [PubMed] [Google Scholar]
- Murphy C. B.; Martell A. E. Metal Chelates of Glycine and Glycine Peptides. J. Biol. Chem. 1957, 226, 37–50. 10.1016/S0021-9258(18)64803-3. [DOI] [PubMed] [Google Scholar]
- Case D. R.; Zubieta J.; Gonzalez R.; Doyle R. P. Synthesis and Chemical and Biological Evaluation of a Glycine Tripeptide Chelate of Magnesium. Molecules 2021, 26, 2419. 10.3390/molecules26092419. [DOI] [PMC free article] [PubMed] [Google Scholar]
- Leifer A.; Lippincott E. R. The Infrared Spectra of Some Amino Acids. J. Am. Chem. Soc. 1957, 79, 5098–5101. 10.1021/ja01576a006. [DOI] [Google Scholar]
- Mansour S. A. A. Thermal Decomposition of Magnesium Citrate 14-Hydrate. Thermochim. Acta 1994, 233, 231–242. 10.1016/0040-6031(94)85117-4. [DOI] [Google Scholar]
- Weston J.Biochemistry of Magnesium; John Wiley & Sons, Ltd., 2009. [Google Scholar]
- Drevenšek P.; Košmrlj J.; Giester G.; Skauge T.; Sletten E.; Sepčić K.; Turel I. X-Ray Crystallographic, NMR and Antimicrobial Activity Studies of Magnesium Complexes of Fluoroquinolones - Racemic Ofloxacin and Its S-Form, Levofloxacin. J. Inorg. Biochem. 2006, 100, 1755–1763. 10.1016/j.jinorgbio.2006.06.011. [DOI] [PubMed] [Google Scholar]
- Martin-Benlloch X.; Lanfranchi D. A.; Haid S.; Pietschmann T.; Davioud-Charvet E.; Elhabiri M. Magnesium Complexes of Ladanein : A Beneficial Strategy for Stabilizing Polyphenolic Antivirals. Eur. J. Inorg. Chem. 2021, 27, 2764–2772. 10.1002/ejic.202100341. [DOI] [Google Scholar]
- Carillo K. D.; Wu D.; Lin S. C.; Tsai S. L.; Shie J. J.; Tzou D. L. M. Magnesium and Calcium Reveal Different Chelating Effects in a Steroid Compound: A Model Study of Prednisolone Using NMR Spectroscopy. Steroids 2019, 150, 108429. 10.1016/j.steroids.2019.108429. [DOI] [PubMed] [Google Scholar]
- Chang J. Y.; Carollo K. D.; Lin S. C.; Wu Y. Y.; Tzou D. L. M. NMR Investigation of Magnesium Chelation and Cation-Induced Signal Shift Effect of Testosterone. Steroids 2016, 115, 18–25. 10.1016/j.steroids.2016.07.004. [DOI] [PubMed] [Google Scholar]
- Schmidbaur H.; Classen H. G.; Helbig J. Aspartic and Glutamic Acid as Ligands to Alkali and Alkaline-Earth Metals: Structural Chemistry as Related to Magnesium Therapy. Angew. Chem., Int. Ed. Engl. 1990, 29, 1090–1103. 10.1002/anie.199010901. [DOI] [Google Scholar]
- Wiesbrock F.; Schier A.; Schmidbaur H. Magnesium Anthranilate Dihydrate. Zeitschrift für Naturforschung B 2002, 57, 251–254. 10.1515/znb-2002-0219. [DOI] [Google Scholar]
- Schmidt M.; Schier A.; Schmidbaur H. Magnesium Bis[D(−)-Mandelate] Dihydrate and Other Alkaline Earth, Alkali, and Zinc Salts of Mandelic Acid. Zeitschrift für Naturforschung B 1998, 53, 1098–1102. 10.1515/znb-1998-1004. [DOI] [Google Scholar]
- O’neil M. J.The Merck Index - An Encyclopedia of Chemicals, Drugs, and Biologicals.; Merck and Co., Inc.: Whitehouse Station, NJ, 2006. [Google Scholar]
- Hellier M. D.; Radhakrishnan A. N.; Ganapathy V.; Gammon A.; Baker S. J. Intestinal Absorption in Normal Indian and English People. Br. Med. J. 1976, 1, 186–188. 10.1136/bmj.1.6003.186. [DOI] [PMC free article] [PubMed] [Google Scholar]
Associated Data
This section collects any data citations, data availability statements, or supplementary materials included in this article.


