eLife logoLink to eLife
. 2021 Dec 17;10:e70046. doi: 10.7554/eLife.70046

NMNAT promotes glioma growth through regulating post-translational modifications of P53 to inhibit apoptosis

Jiaqi Liu 1,2, Xianzun Tao 2, Yi Zhu 2, Chong Li 2,, Kai Ruan 2, Zoraida Diaz-Perez 2, Priyamvada Rai 3,4, Hongbo Wang 1,, R Grace Zhai 2,4,
Editors: Patrik Verstreken5, Jonathan A Cooper6
PMCID: PMC8683086  PMID: 34919052

Abstract

Gliomas are highly malignant brain tumors with poor prognosis and short survival. NAD+ has been shown to impact multiple processes that are dysregulated in cancer; however, anti-cancer therapies targeting NAD+ synthesis have had limited success due to insufficient mechanistic understanding. Here, we adapted a Drosophila glial neoplasia model and discovered the genetic requirement for NAD+ synthase nicotinamide mononucleotide adenylyltransferase (NMNAT) in glioma progression in vivo and in human glioma cells. Overexpressing enzymatically active NMNAT significantly promotes glial neoplasia growth and reduces animal viability. Mechanistic analysis suggests that NMNAT interferes with DNA damage-p53-caspase-3 apoptosis signaling pathway by enhancing NAD+-dependent posttranslational modifications (PTMs) poly(ADP-ribosyl)ation (PARylation) and deacetylation of p53. Since PARylation and deacetylation reduce p53 pro-apoptotic activity, modulating p53 PTMs could be a key mechanism by which NMNAT promotes glioma growth. Our findings reveal a novel tumorigenic mechanism involving protein complex formation of p53 with NAD+ synthetic enzyme NMNAT and NAD+-dependent PTM enzymes that regulates glioma growth.

Research organism: D. melanogaster

eLife digest

One of the most common types of brain cancer, glioma, emerges when harmful mutations take place in the ‘glial’ cells tasked with supporting neurons. When these genetically damaged cells are not fixed or eliminated, they can go on to multiply uncontrollability. A protein known as p53 can help to repress emerging tumors by stopping mutated cells in their tracks.

Glioma is a highly deadly cancer, and treatments are often ineffective. Some of these approaches have focused on a protein involved in the creation of the coenzyme NAD+, which is essential to the life processes of all cells. However, these drugs have had poor outcomes.

Instead, Liu et al. focused on NMNAT, the enzyme that participates in the final stage of the creation of NAD+. NMNAT is known to protect neurons, but it is unclear how it involved in cancer. Experiments in fruit flies which were then validated in human glioma cells showed that increased NMNAT activity allowed glial cells with harmful mutations to survive and multiply. Detailed molecular analysis showed that NMNAT orchestrates chemical modifications that inactivate p53. It does so by working with other molecular actors to direct NAD+ to add and remove chemical groups that control the activity of p53.

Taken together, these results show how NMNAT can participate in the emergence of brain cancers. They also highlight the need for further research on whether drugs that inhibit this enzyme could help to suppress tumors before they become deadly.

Introduction

Glioma is the most common intrinsic tumor of the central nervous system (CNS) and derives from the neoplastic glial cells or neuroglia (Goodenberger and Jenkins, 2012). Based on pathological criteria, gliomas are classified from WHO grade I to IV, among which the high-grade gliomas generally have a much poorer prognosis (Wesseling and Capper, 2018). Several major cellular signaling pathways associated with glioma have been well studied, including RTK/Ras/PI3K, p53, and RB signaling pathways (Cancer Genome Atlas Research Network, 2008). In addition, metabolism factors, such as IDH1/2, were found to play important roles in glioma (Yan et al., 2009). IDH1 is an enzyme of tricarboxylic acid (TCA) cycle in glucose metabolism and the main producer of NADPH (Molenaar et al., 2014). However, drugs targeting these pathways showed a limited clinical response, indicating a critical need for the mechanistic understanding of the metabolic requirement for glioma tumorigenesis.

Nicotinamide adenine dinucleotide (NAD+) is an essential signaling cofactor that regulates cancer metabolism through its co-enzymatic function for many bioenergetic pathways, including glycolysis, TCA cycle, and oxidative phosphorylation (Hanahan and Weinberg, 2011). Multiple processes associated with NAD+ signaling are dysregulated in cancer, including DNA repair, cell proliferation, differentiation, and apoptosis (Chiarugi et al., 2012). Inherited polymorphisms and epigenetic repression of DNA damage repair genes are significantly correlated with the risk of gliomas, indicating that abnormal DNA damage repair plays important roles in glioma formation and progression (Chen et al., 2010; Qi et al., 2017). One of the key initiation events of DNA damage response is poly (ADP-ribose) polymerase (PARP)-mediated poly(ADP-ribosyl)ation (PARylation), the main process that consumes nuclear NAD+ (Amé et al., 2004). Moreover, NAD+-dependent SIRTs-mediated deacetylation regulates many oncogenes and tumor suppressor genes in cancer cells (Brooks and Gu, 2009). Consistently, a high level of NAD+ is observed in gliomas (Reddy et al., 2008; Tso et al., 2006), and 90% of gliomas are susceptible to NAD+ depletion (Tateishi et al., 2015). Therefore, it is critical for rapidly proliferating glioma cells to replenish the NAD+ pool for survival.

In the past years, targeting NAD+ metabolism has been considered for cancer therapy, and most efforts have been focused on nicotinamide phosphoribosyltransferase (NAMPT), the rate-limiting enzyme of the NAD+ salvage pathway, whose expression is increased in multiple types of cancer (Garten et al., 2015; Lucena-Cacace et al., 2018; Ohanna et al., 2018; Pylaeva et al., 2019). Disappointingly, several clinical trials of NAMPT inhibitors have failed due to low efficacy and high toxicities (Sampath et al., 2015), which demands the urgent consideration of an alternative target in the NAD+ metabolic pathway. Nicotinamide mononucleotide adenylyltransferase (NMNAT), the last enzyme in the NAD+ salvage synthetic pathway, has recently emerged as a potential candidate (Chiarugi et al., 2012). NMNAT has three isoforms in mammals with distinct subcellular localizations: NMNAT1, in the nucleus; NMNAT2, in the cytosol; and NMNAT3, in the mitochondria (Berger et al., 2005). Dysregulations of both NMNAT1 and NMNAT2 have been implicated in cancer. For example, NMNAT1 is considered a poor prognostic marker for renal cancer (Uhlén et al., 2015; Uhlen et al., 2017). Decreased NMNAT1 expression leads to epigenetic silencing of tumor suppressor genes (Henderson et al., 2017). Inhibition of NMNAT1 delays DNA repair and increases rRNA transcription (Song et al., 2013). In colorectal cancer, NMNAT2 upregulation correlates with the cancer invasive depth and TNM stage (Cui et al., 2016; Qi et al., 2018). In non-small cell lung cancer (NSCLC), NMNAT2 enzymatic activity is upregulated by SIRT3-mediated deacetylation process or p53 signaling (Li et al., 2013; Pan et al., 2014). Moreover, the depletion of NMNAT2 inhibits cell growth indirectly by reducing glucose availability in neuroblastoma cells (Ryu et al., 2018). These observations indicate the regulatory link between compartmentalized NAD+ synthesis and cellular metabolism and rapid cancer cell growth, and further underscore the potential of NMNAT as a viable alternative target in NAD+ synthetic pathway, given their aberrant regulation and critical role in cancer metabolism.

In this report, to address the knowledge gap regarding the role of NMNAT in glioma, we adapted an in vivo glial neoplasia in Drosophila (Read et al., 2009) and discovered a genetic requirement for NMNAT in glioma growth. Combined with human glioma cell culture models, we characterized the mechanism of NMNAT in gliomagenesis. Our results identified the upregulation of enzymatically active NMNAT as an essential metabolic regulator for promoting gliomagenesis and revealed that NMNAT-sustained PARylation and deacetylation of p53 results in suppression of apoptosis, a key tumor-inhibitory response.

Results

NMNAT is upregulated in oncogenic Rasv12 induced glial neoplasia

The Ras/Raf/ERK signaling cascade is one of the most conserved pathways both in Drosophila and human, and a major component of the MAP kinase signaling stress-response network (Morrison, 2012). RAS mutations are the most commonly found oncogenic alteration in human cancers, most frequently observed in KRAS (85%), and to a lesser degree in NRAS (12%) and HRAS (3%) (Simanshu et al., 2017). Upregulated RAS and mutant RAS have been detected in gliomas (Arvanitis et al., 1991; Guha et al., 1997; Knobbe et al., 2004; Rajasekhar et al., 2003), and activation of Ras has been used to model human glioma in Drosophila (Read, 2011; Read et al., 2009).

Ras oncogene at 85D (Ras85D) is the Drosophila orthologue of human RAS. The constitutively active Ras85D mutation (G12V), Rasv12, has been suggested to be analogous to human oncogenic RAS mutation and used to induce tumor (Barbacid, 1987; Wu et al., 2010). We established a Drosophila glial neoplasia model by overexpressing Rasv12 in glial cells, driven by the pan-glial driver repo-GAL4 (Read et al., 2009). Green fluorescent protein (GFP) was co-expressed as a reporter to mark the Ras expressing cells. Under normal conditions, the Drosophila CNS is wrapped by perineurial, subperineurial, and ensheathing glia (Freeman, 2015). Powered with high-resolution quantitative brain morphology analysis (Brazill et al., 2018b), we analyzed glial neoplasia tissue using three criteria, (i) tissue double-positive for GFP and endogenous Repo expression; (ii) tissue mass consists of multiple layers of glia of at least 400 cells, and (iii) tissue mass volume greater than 12.4 × 103 μm3 (Figure 1—figure supplement 1). When Rasv12 was expressed in glia, numerous glial neoplasia tissues marked by GFP and Repo in the brain and ventral nerve cord (VNC) were detected as early as 100 hr after egg laying (AEL), and the volumes of glial neoplasia increased with age (Figure 1A, B and G). The brain tumors caused early lethality in pupal stage and greatly reduced survival rate (Figure 1H). Notably, compared with the normal brain (Figure 1C and E), we found significantly increased endogenous NMNAT in glial cells at both 100 and 150 hr AEL. NMNAT was most prominently increased in the nuclear region (Figure 1D and F), suggesting a possible role for NMNAT1, the nuclear isoform, in Rasv12-induced glial neoplasia formation in Drosophila.

Figure 1. NMNAT is upregulated in Rasv12-induced glial neoplasia in Drosophila.

(A, B) Larval CNS at 100 AEL with glial expression of GFP+ GFP or Rasv12+ GFP was probed for F-actin (white), Repo (red), and DAPI (blue). The yellow dashed lines mark the boundary of glial neoplasia. The third and fourth rows show the boxed area of the first and second rows. (C–F) Larval CNS at 100 (C, D) and 150 (E, F) AEL. The second to fourth rows show the boxed areas in the first row. (C–E) Brains were probed for Nmnat (gray), Repo (red), and DAPI (blue). (F) Brains were probed for HRP (magenta), Nmnat (gray), F-actin (white), and DAPI (blue). Yellow dashed lines mark the glial neoplasia boundaries. (G) Quantification of the total glial neoplasia volumes in each fly. Data are presented as mean ± s.d., n=4. Significance level was established by one-way ANOVA post hoc Bonferroni test. (H) Survival rate. Data are presented as mean ± s.d., n≥3. Significance level was established by Chi-square test. (I–J) Nmnat intensity at 100 and 150 AEL. Data are presented as median ± quartiles, n≥3. Significance level was established by one-way ANOVA post hoc Bonferroni test. ***p≤0.001; ****p≤0.0001. Scale bars, 30 µm. AEL, after egg laying; CNS, central nervous system; NMNAT, nicotinamide mononucleotide adenylyltransferase.

Figure 1.

Figure 1—figure supplement 1. Glial neoplasia tissue area in Drosophila larval CNS.

Figure 1—figure supplement 1.

The Drosophila larval CNS with glial expression of Rasv12+ GFP (green) was probed for Repo (red). The glial neoplasia tissue and non-tumor glial area are marked with cyan and white dashed lines, respectively. Scale bars, 30 µm. CNS, central nervous system.

NMNAT is required for glial neoplasia development in Drosophila

To determine whether increased NMNAT is required for glial neoplasia development, we used the RNAi approach to downregulate NMNAT expression in Rasv12-induced glial neoplasia cells (Brazill et al., 2018a). NMNAT RNAi-mediated knockdown in Rasv12 overexpression cells reduced NMNAT expression level to around 36% of wild-type flies (Figure 2—figure supplement 1). Interestingly, knocking down Nmnat drastically reduced both the volume and the number of individual Rasv12-expressing glial cells in the brain and VNC at 100 hr AEL (Figure 2A, C and D), demonstrating a strong antitumor effect of NMNAT inhibition in vivo. We further analyzed RNAi-mediated knockdown of NMNAT in normal glial cells (without Rasv12 expression) and found no growth inhibition (Figure 2—figure supplement 2), suggesting NMNAT is not essential for normal cell survival.

Figure 2. NMNAT is required for glial neoplasia growth in Drosophila.

(A, B) Larval CNS at 100 AEL with glial expression of Rasv12+lacZ, Rasv12+NmnatRNAi, lacZ+Rasv12, PC+Rasv12, PCWR+Rasv12, and PD+Rasv12 was probed for F-actin (green), Repo (red), DAPI (blue), and Nmnat (gray). Each individual glial neoplasia is marked with dashed lines and numbered. The second and third rows show the high magnification of glial neoplasia areas in the first row. Scale bars, 30 µm. (C) Quantification of glial neoplasia volume in each fly. Data are presented as mean ± s.d., n≥7. Significance level was established by one-way ANOVA post hoc Bonferroni test. (D) Quantification of glial neoplasia number in each fly. Data are presented as mean ± s.d., n≥7. Significance level was established by one-way ANOVA post hoc Bonferroni test. (E) Survival rate of flies with glial expression of Rasv12 together with lacZ, PC, PCWR, or PD. Data are presented as mean ± s.d., n≥3. Significance level was established by chi-square test. *p≤0.05; **p≤0.01; ***p≤0.001; ****p≤0.0001. AEL, after egg laying; NMNAT, nicotinamide mononucleotide adenylyltransferase.

Figure 2.

Figure 2—figure supplement 1. NMNAT expression is lower in NmnatRNAi fly than wild-type control fly.

Figure 2—figure supplement 1.

Quantification of NMNAT intensity in glial cells or glial neoplasia area. Flies were expressing lacZ+lacZ or Rasv12+NmnatRNAi. Data are presented as median ± quartiles, n≥3. Significance level was established by one-way ANOVA post hoc Bonferroni test. ****p≤0.0001. NMNAT, nicotinamide mononucleotide adenylyltransferase.
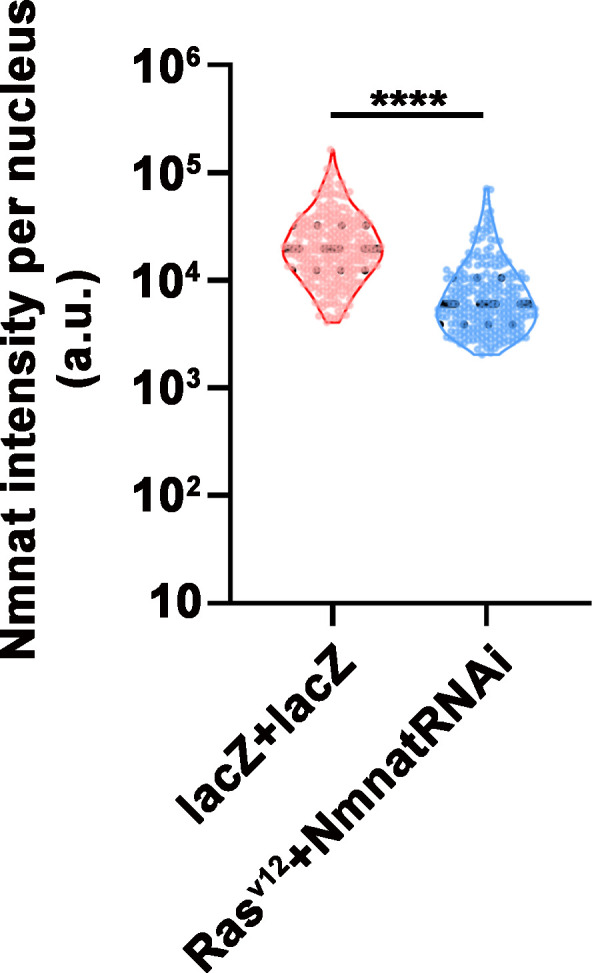
Figure 2—figure supplement 2. NMNAT downregulation in glial cells does not affect brain morphology in adult fly.

Figure 2—figure supplement 2.

Brains of two DAE flies with glial expression of GFP+GFP or GFP+NmnatRNAi were probed for Repo (red), Nmnat (white), and DAPI (blue). The third and fourth rows are high magnification of the boxed areas in the second row. Scale bars, 30 µm. NMNAT, nicotinamide mononucleotide adenylyltransferase.
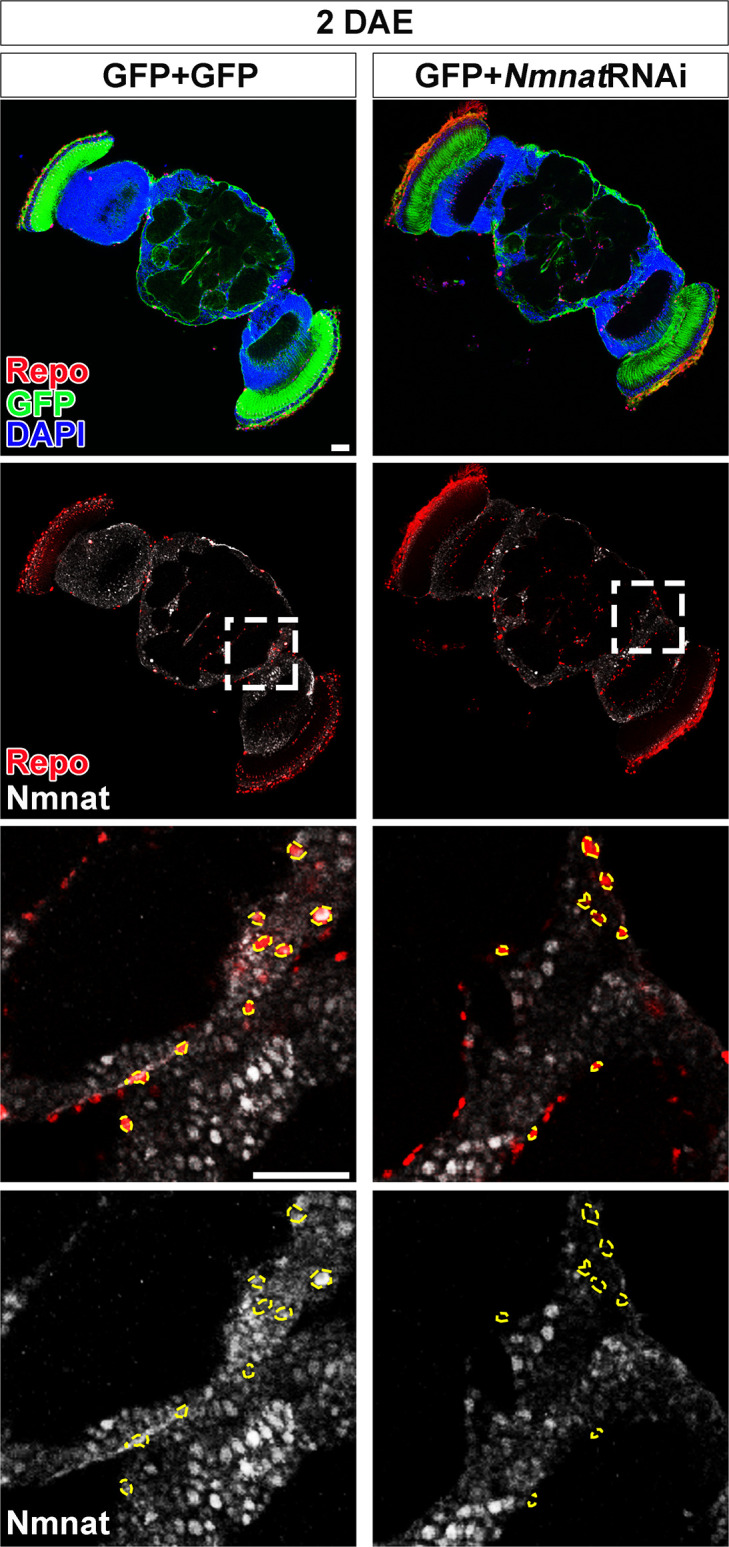
Figure 2—figure supplement 3. NMNAT-PCWR has no NAD+ synthesis enzyme activity.

Figure 2—figure supplement 3.

(A) Diagram of the continuous coupled enzyme assay where NAD+ synthesized by NMNAT is reduced to NADH by alcohol dehydrogenase (ADH). The production of NADH is measured by absorbance at 340 nm. NMNAT activity (units per milligram of recombinant protein) is calculated from the linear progression curve by the formula at the bottom, where Coβ-NADH, the extinction coefficient of β-NADH at 340 nm, is 6.22. (B, C) NAD+ synthesis activity of recombinant NMNAT-PCWT, NMNAT-PCWR, NMNAT-PCHA, and NMNAT-PD (B) was measured by the continuous coupling assay as shown in (A). Bovine serum albumin (BSA) was used as a negative control. Data are presented as mean ± s.d., n=4. NMNAT, nicotinamide mononucleotide adenylyltransferase.

Next, we tested whether upregulating NMNAT can promote glial neoplasia formation and growth. Drosophila has one Nmnat gene, expressing two protein isoforms through alternative splicing, a nuclear isoform Nmnat-PC and a cytosolic isoform Nmnat-PD. The Nmnat-PC (nuclear) and Nmnat-PD (cytoplasmic) isoforms share similar enzymatic activity but are differentially regulated under stress conditions (Ruan et al., 2015). In Rasv12-induced glial neoplasia, dramatically increased Nmnat is mainly observed in the nuclear region (Figure 1D and F), likely to be the Nmnat-PC (nuclear) isoform. To further evaluate the compartment-specific role of NMNAT during glial neoplasia formation, we generated flies expressing Rasv12 together with Nmnat-PC (nuclear) or Nmnat-PD (cytoplasmic). Consistent with the previous report, Nmnat-PC (nuclear) is highly enriched in the nucleus and colocalizes with the nuclear marker Repo, while Nmnat-PD is predominantly cytoplasmic (Ruan et al., 2015). Interestingly, overexpression of Nmnat-PC (nuclear), but not Nmnat-PD (cytoplasmic), significantly increased the total volumes of glial neoplasia (Figure 2B and C), while the number of glial neoplasia showed no significant difference among the groups (Figure 2D). The lethality of the flies (Figure 2E) was positively correlated with glial neoplasia size and overexpression of Nmnat-PC (nuclear) significantly increased the lethality.

To determine whether the enzyme activity of NMNAT is required for glial neoplasia tumorigenesis, we generated flies expressing an enzyme inactive mutant Nmnat-PC (nuclear) isoform (PCWR) where two key residues for substrate binding were mutated (Figure 2—figure supplement 3; Zhai et al., 2006). We found that Nmnat-PCWR (nuclear) overexpression did not significantly affect glial neoplasia volumes or numbers or survival outcome when compared to the control (Figure 2C–E). These results suggest that nuclear enzymatically active NMNAT promoted glial neoplasia growth.

NMNAT is essential to the proliferation of human glioma cells

We next examined the function of NMNAT in human glioma cell proliferation, specifically human NMNAT1 (nuclear) and NMNAT2 (cytoplasmic) (Berger et al., 2005). Since approximately 51% of glioma are mutated for p53, we included two glioma cell lines with different p53 status, U87MG with wild-type p53, and T98G with a gain-of-function M237I mutation (Van Meir et al., 1994), to dissect common mechanisms of the role of NMNAT in glioma cell growth. We determined NMNAT1 and NMNAT2 protein levels in human glioma cells and normal astroglia cells (SVG p12). Compared to SVG p12 cells, NMNAT1 and NMNAT2 are increased in both glioma cells T98G and U87MG (Figure 3—figure supplement 3). Next, we manipulated the expression of NMNAT by siRNA-mediated knockdown and plasmid-mediated overexpression in T98G cells and monitored real-time cell growth using the xCELLigence platform (Ke et al., 2011). Interestingly, we found T98G cell proliferation was drastically inhibited when either NMNAT1 or NMNAT2 was knocked down (Figure 3A). This observation was confirmed and extended in an MTT assay (van Meerloo et al., 2011), where NMNAT1 or NMNAT2 knockdown reduced cell proliferation (Figure 3—figure supplement 1). In contrast, overexpressing NMNAT1 or NMNAT2 promoted cell growth (Figure 3D). Moreover, we used a plate colony formation assay to determine clonogenic survival (Franken et al., 2006), and found that knockdown of NMNAT1 or NMNAT2 reduced the colony numbers of T98G, while overexpression of NMNAT1 or NMNAT2 increased colony formation (Figure 3B–F). These results are consistent with the genetic dependency on NMNAT observed in the fly glial neoplasia models, suggesting the conservation of NMNAT function in promoting glioma cell growth and proliferation.

Figure 3. NMNAT expression is essential to the proliferation of human GBM cells.

(A, D) The xCELLigence real-time cell analysis assay was used to monitor the growth index of T98G cells after NMNAT knockdown by transfecting siNMNAT1 or siNMNAT2, or after NMNAT overexpression by transfecting NMNAT1 or NMNAT2 plasmid. Cells transfected with siRNA control or DsRed were used as controls. (B, E) Colony formation assay was used to measure the colony formation capabilities of T98G cells after NMNAT knockdown by transfecting siNMNAT1 or siNMNAT2, or after NMNAT overexpression by transfecting NMNAT1 or NMNAT2. Cells transfected with siRNA control or DsRed were used as controls. (C, F) Quantification of the colony number in (B, E). Data are presented as mean ± s.d. n=3. Significance level was established by one-way ANOVA post hoc Bonferroni test. (G) T98G cell apoptosis was detected by flow cytometry after NMNAT knockdown. (H) Quantification of apoptotic cells rate of siRNA control, siNMNAT1-1, siNMNAT1-2, siNMNAT2-1, and siNMNAT2-2. The sum of Q2 and Q4 was quantified as apoptotic cells. Data are presented as mean ± s.d. n=4. Significance level was established by t-test. *p≤0.05; **p≤0.01; ***p≤ 0.001. GBM, glioblastoma multiforme; NMNAT, nicotinamide mononucleotide adenylyltransferase.

Figure 3—source data 1. siRNA sequences for NMNAT1/2 knockdown and primer sequences for PCR.

Figure 3.

Figure 3—figure supplement 1. T98G cells viability is inhibited after knockdown NMNAT1 or NMNAT2.

Figure 3—figure supplement 1.

(A) The confluency of T98G cells is decreased after transfected with siNMNAT1 or siNMNAT2 96 hr. (B) Cell viability 96 hr after transfection was measured by an MTT assay. Data are presented as mean ± s.d., n≥3. Significance level was established by one-way ANOVA post hoc Bonferroni test. (C) NMNAT1 and NMNAT2 transcript levels after siRNA transfection 72 hr. Data are normalized to siRNA control group. (D, E) NMNAT1 and NMNAT2 protein levels siRNA transfection 72 hr and quantification. Data are presented as mean ± s.d., n≥3. Significance level was established by one-way ANOVA post hoc Bonferroni test. *p≤0.05; **p≤0.01; ***p≤0.001; ****p≤0.0001.
Figure 3—figure supplement 1—source data 1. T98G cell viability was inhibited after knockdown NMNAT1 or NMNAT2.
Figure 3—figure supplement 2. Knockdown of NMNAT does not affect cell cycle.

Figure 3—figure supplement 2.

(A–E) Cell cycle was detected by flow cytometry after T98G cells was transfected with siRNA Control, siNMNAT1-1, siNMNAT1-2, siNMNAT2-1, and siNMNAT2-2, respectively. (F) Quantification of cells in each cell cycle phase. Data are presented as mean ± s.d., n=3. Significance level was established by one-way ANOVA post hoc Bonferroni test. NMNAT, nicotinamide mononucleotide adenylyltransferase.
Figure 3—figure supplement 3. NMNAT protein is upregulated in human glioma cells.

Figure 3—figure supplement 3.

SVG p12 is human glial cells. T98G and U87MG are human glioma cells. Proteins were extracted from cells were probed for NMNAT1, NMNAT2, and β-actin and quantification. NMNAT2 overexpression from U87MG cells was used as positive control. Data are presented as mean ± s.d., n=3. Significance level was established by t-test. *p≤0.05; **p≤0.01; ***p≤0.001. NMNAT, nicotinamide mononucleotide adenylyltransferase.
Figure 3—figure supplement 3—source data 1. NMNAT protein was upregulated in human glioma cells.

To further determine whether NMNAT is involved in glioma cell survival, we carried out a flow cytometric apoptosis detection assay through flow cytometry. We transfected siRNA targeting NMNAT into T98G cells and then analyzed Annexin V-FITC/PI by flow cytometric 72 hr post-transfection. Interestingly, we found that knockdown of NMNAT, at the knockdown rate of 40–50% for NMNAT1 or at 20–30% for NMNAT2, significantly increased the percentage of apoptotic cells, including early apoptotic and late apoptotic cells (Figure 3G and H). We also examined the cell cycle distribution of these cells. The cell cycle assay showed G2/M phase was only slightly increased in T98G cells with NMNAT1 knockdown (Figure 3—figure supplement 2). These results suggest that NMNAT promotes glioma cell growth mainly through inhibiting cell apoptosis.

Overexpression of NMNAT decreases caspase-3 activation in glioma

The cysteine-dependent proteases (caspases) are activated by upstream proteins to mediate apoptosis (Kurokawa and Kornbluth, 2009). Caspase-3 is the main effector protease cleaving a large number of substrates during apoptosis. Previous studies revealed that nuclear translocation and accumulation of caspase-3 play a critical role in the progression of apoptosis (Prokhorova et al., 2018). The caspase-mediated pathway is highly conserved in mammalian and Drosophila (Fuchs and Steller, 2011; Shi, 2001; Figure 4—figure supplement 1A). To validate the role of caspase pathway in Drosophila glial neoplasia, we examined tumor growth in flies with downregulation of DCP1, the homolog of mammalian caspase-3/7. In these flies, glial neoplasia volume was significantly increased (Figure 4—figure supplement 1B and C), suggesting the important role of caspase-mediated apoptosis in preventing Drosophila glial neoplastic growth. To test whether NMNAT regulates this process, we determined the localization and protein levels of caspase-3 in the glial neoplasms with overexpression of different Nmnat isoforms. We used Repo and DAPI to label the nuclei region and observed a significant decrease of caspase-3 levels in glial neoplasms that overexpress Nmnat-PC (nuclear), compared with those overexpressing lacZ, Nmnat-PCWR (nuclear), or Nmnat-PD (cytoplasmic) (Figure 4A and C). In addition, when we knocked down Nmnat in Rasv12-expressing glial cells, we observed significant nuclear enrichment of caspase-3 (Figure 4B and D). These results suggest that NMNAT is a negative regulator of glial neoplastic cell apoptosis in Drosophila.

Figure 4. Overexpression of NMNAT decreases caspase-3 activation in glial neoplasia.

(A) Glial neoplasia from files expressing lacZ, PC, PCWR, or PD were probed for Repo (red), F-actin (green), DAPI (blue), and caspase-3 (gray). The top row shows the whole glial neoplasia area. The second and third rows are the high magnification of the boxed areas in the first row. Yellow dashed lines indicate the nuclear area. (B) Glial neoplasia from flies expressing lacZ or Nmnat RNAi were probed for Repo (red), F-actin (green), DAPI (blue), and caspase-3 (gray). Yellow dot lines indicate glial neoplasia boundary in the Rasv12+lacZ group. Yellow dashed lines indicate the boundaries of the nucleus and cytoplasm. Scale bars, 10 µm. (C) Quantification of the percentage of nuclear caspase-3 intensity per glial neoplasia. Data are presented as mean ± s.d. n≥3. Significance level was established by one-way ANOVA post hoc Bonferroni test. (D) Quantification of the nuclear caspase-3 per glial cell. Data are presented as median ± quartiles, n≥3. Significance level was established by one-way ANOVA post hoc Bonferroni test. *p≤0.05. ****p≤0.0001. NMNAT, nicotinamide mononucleotide adenylyltransferase.

Figure 4.

Figure 4—figure supplement 1. Blocking caspase pathway in Rasv12 overexpressing fly.

Figure 4—figure supplement 1.

(A) Diagram of caspase pathway in mammalian and Drosophila. (B) Flies with Rasv12+lacZ, Rasv12+Diap1, Rasv12+p35, Rasv12+DCP1 RNAi, and Rasv12+DroncRNAi were probed for Repo (green) and F-actin (red). (C) Quantification of ratio of glial neoplasia volume in CNS. Data are presented as mean ± s.d., n>3. Significance level was established by t-test. *p≤0.05. CNS, central nervous system.

Next, we examined apoptosis and the activation of caspase-3 in human glioma cells. We found that knockdown of NMNAT led to increased nuclear caspase-3 (Figure 5A and C). Western blot analysis showed a specific increase of fully processed P17/19 species of cleaved caspase-3 (Figure 5D), indicating the activation of apoptosis (Porter and Jänicke, 1999). To examine the effect of overexpressing NMNAT on apoptosis, we employed cisplatin treatment to induce apoptosis as the basal level of apoptosis in T98G glioma cells is low (Kondo et al., 1995). Cisplatin significantly increased nuclear caspase-3 levels as expected. Interestingly, overexpression of either NMNAT1 or NMNAT2 reduced nuclear caspase-3 in cisplatin-induced apoptosis (Figure 5B and E), specifically the fully processed cleaved caspase species P17/19 as shown by Western blot analysis (Figure 5F). Taken together, these results suggest that NMNAT promotes glioma growth by inhibiting caspase-mediated apoptosis.

Figure 5. NMNAT decreases caspase-3 activation in human glioma cells.

(A) T98G cells were transfected with siNMNAT1 or siNMNAT2 and stained with DAPI (blue) and caspase-3 (white). (B) T98G cells were transfected with DsRed (red), DsRed-NMNAT1 (red), or DsRed-NMNAT2 (red), treated with cisplatin 8 hr after transfection, and stained with DAPI (blue) and caspase-3 (gray). The second and third rows are the high magnification of the boxed areas in the first row. In the third row, the intensity of caspase-3 is indicated by a heatmap (0–4095). Scale bars, 10 µm. (C) Quantification of nuclear caspase-3 intensity in (A). Data are presented as median ± quartiles, n≥100. Significance level was established by one-way ANOVA post hoc Bonferroni test. (E) Quantification of nuclear caspase-3 intensity in (B). Data are presented as median ± quartiles, n≥100. Significance level was established by one-way ANOVA post hoc Bonferroni test. (D, F) Proteins were extracted from T98G cells transfected with siRNA (D), plasmids and treated with cisplatin for 8 hr (F) for Western blot analysis. P17/19 was considered as cleaved caspase-3. β-actin was used as an internal control. ****p≤0.0001. NMNAT, nicotinamide mononucleotide adenylyltransferase.

Figure 5—source data 1. NMNAT decreased caspase-3 activation in human glioma cells.

Figure 5.

Figure 5—figure supplement 1. Membrane of Western blot analysis.

Figure 5—figure supplement 1.

Proteins were extracted from T98G cells transfected with siRNA (left), or plasmids and treated with cisplatin for 8 hr (right) for Western blot analysis. P32 was considered as pro-caspase-3. P17/19 was considered as cleaved caspase-3.
Figure 5—figure supplement 2. Cleaved caspase-3 is reduced after NMNAT overexpression.

Figure 5—figure supplement 2.

U87MG cells were treated with CDDP and probed for p53, caspase-3, and β-actin. NMNAT, nicotinamide mononucleotide adenylyltransferase.
Figure 5—figure supplement 2—source data 1. Cleaved Ccaspase-3 was reduced after NMNAT overexpression.

Overexpression of NMNAT increases DNA damage tolerance and decreases nuclear p53 in glial neoplasia

DNA instability is one of the hallmarks of cancer. Two common strategies cancer cells use to avoid the triggering cell apoptosis by DNA damage are hyperactivating DNA damage repair, and inactivating cell apoptosis initiation (Norbury and Zhivotovsky, 2004). Since NAD+ plays important regulatory roles in both DNA damage repair and cell apoptosis, and NAD+ synthase activity is required for glial neoplasia growth (Figure 2), we next examined the effect of NMNAT on the DNA damage pathway in glioma. We first determined DNA damage by using a phosphor-specific antibody to histone 2A variant (H2Av), a marker for DNA double-strand breaks (Lake et al., 2013). We observed a significant elevation of H2Av signal in Nmnat-PC (nuclear) overexpressing brains compared to that in Nmnat-PD (cytoplasmic), Nmnat-PCWR (nuclear), or lacZ overexpressing brains (Figure 6A), suggesting DNA damage level is higher in glial neoplasia with Nmnat-PC (nuclear) overexpression.

Figure 6. Nmnat-PC inhibits DNA damage-induced p53 activation in glial neoplasia.

Figure 6.

(A) Glial neoplasia from flies expressing lacZ, PC, PCWR, or PD were stained with H2Av (red), Repo (green), and F-actin (magenta). The second and third rows are high magnification of the boxed areas in the first row. In the third row, the intensity of H2Av is indicated by a heatmap (0–4095). (B) Glial neoplasia from flies expressing lacZ, PC, PCWR, or PD were stained with p53, Repo (green), F-actin (magenta), and DAPI (blue). The second and third rows are high magnification of the boxed areas in the first row. In the third row, the intensity of p53 is indicated by a heatmap (0–4095). Yellow dashed lines indicate the nuclear areas. Scale bars, 10 µm. (C) Quantification of H2Av intensity in Repo-positive cells. The black dashed line indicates the threshold. According to the lacZ group, value 20,000 is set as the threshold. Data are presented as median ± quartiles, n≥3. Significance level was established by one-way ANOVA post hoc Bonferroni test. (D) Quantification of nuclear p53 intensity. Data are presented as mean ± s.d., n≥3. Significance level was established by t-test. **p≤0.01; ***p≤0.001; ****p≤0.0001.

We next examined the distribution of endogenous p53 in glial neoplasia and found that while in control glial neoplasia cells (LacZ group), p53 was relatively evenly distributed with ~40% of p53 in the nucleus, a significantly reduced nuclear p53 pool (~20%) was found in Nmnat-PC (nuclear) overexpressing glial neoplasia cells (Figure 6B and D). Together with the observation of higher DNA damage levels in Nmnat-PC (nuclear) overexpressing glial neoplasia cells, these results indicate that Nmnat-PC (nuclear) expression potentially regulates p53 response to DNA damage, presumably to allow higher tolerance to DNA damage. p53 is a key player controlling cell fate in response to DNA damage: initiate DNA repair when there is limited DNA damage, and induce apoptosis when DNA damage is too severe (Roos and Kaina, 2013). To validate the role of p53 in glial neoplasia development in Drosophila, we examined the effect of a p53 inhibitor: pifithrin-α (PFT-α). PFT-α is reported to inhibit translocation of p53 and affect p53-related transactivation (Komarov et al., 1999; Leker et al., 2004; Murphy et al., 2004). We analyzed glial neoplasia tissue volume with GFP and DAPI staining in the CNS of flies (Figure 7A). The glial neoplasia volume was significantly increased in PFT-α-treated flies compared to that in DMSO-treated flies (Figure 7C). The increase in glial neoplasia volume was accompanied by a decrease in survival (Figure 7B), and the reduced cleaved caspase-3 intensity (Figure 7D). These results suggest p53 is critical for inhibiting glial neoplastic growth in Drosophila, and p53 inhibition phenocopies NMNAT overexpression in glial neoplasia growth. p53 depletion rescues NMNAT knockdown induced caspase-3 activation.

Figure 7. p53 inhibitor increases glial neoplasia volume in CNS and larvae lethality.

Figure 7.

(A) Flies expressing Rasv12 and CD8GFP were treated with DMSO or p53 inhibitor, respectively, stained with cleaved caspase-3 (red) and DAPI (blue). The first column is the whole CNS of flies. White dashed lines indicate the glial neoplasia areas. The second and third columns are high magnification of the boxed white areas in the first row. The intensity of cleaved caspase-3 is indicated by a heatmap (0–4095). Scale bars, 10 µm. (B) Survival rate of flies. (C) Quantification of ratio of glial neoplasia volumes in CNS. Data are presented as mean ± s.d., n≥3. Significance level was established by one-way ANOVA post hoc Bonferroni test. (D) Quantification of cleaved caspase-3 intensity. Data are presented as median ± quartiles, n≥3. Significance level was established by one-way ANOVA post hoc Bonferroni test. **p≤0.01; ****p≤0.0001. CNS, central nervous system.

To further assess the role of p53 in NMNAT knockdown-induced apoptosis, we examined the effects of p53 depletion combined with NMNAT knockdown in human glioma cells. We employed two approaches to reduce/deplete p53: siRNA transfection or shRNA lentiviral transduction in both U87MG and T98G cell lines. After p53 depletion, we carried out siNMNAT-mediated knockdown and probed for cleaved caspase-3 to examine the activation of apoptosis in both T98G and U87MG cells. Under all four conditions, two cell types and two modes of p53 depletion, we observed a consistent reduction of siNMNAT-induced apoptosis activation when p53 was depleted. As shown in Figure 8 (shRNA lentiviral knockdown) and Figure 8—figure supplement 1 (siRNA knockdown), cleaved caspase-3 expression level in p53 and NMNAT double knockdown cells was reduced compared to those in siNMNAT cells, suggesting that p53 depletion reduced significantly cleaved caspase-3 expression in NMNAT knockdown glioma cells. These results indicate p53 is a key mediator of NMNAT knockdown-induced apoptosis in glioma.

Figure 8. p53 depletion rescues NMNAT knockdown induced caspase-3 activation in glioma.

(A) Proteins were extracted from U87MG and T98G cells transfected with siNMNAT1/2 after knockdown of p53 or GFP by shRNA lentivirus transduction for Western blot analysis. β-actin was used as an internal control. (B) Quantification of cleaved caspase-3 in Western blot analysis. Data are presented as mean ± s.d., n≥4. Significance level was established by t-test. *p≤0.05; **p≤0.01; ****p≤0.0001. NMNAT, nicotinamide mononucleotide adenylyltransferase.

Figure 8—source data 1. p53 depletion rescued NMNAT knockdown-induced caspase-3 activation in glioma.

Figure 8.

Figure 8—figure supplement 1. p53 depletion rescues NMNAT knockdown induced caspase-3 activation in glioma.

Figure 8—figure supplement 1.

(A) Proteins were extracted from U87MG and T98G cells transfected with siRNA for Western blot analysis. β-actin was used as an internal control. (B) Quantification of cleaved caspase-3 in Western blot analysis. Data are presented as mean ± s.d., n≥4. Significance level was established by t-test. *p ≤0.05; **p≤0.01. NMNAT, nicotinamide mononucleotide adenylyltransferase.
Figure 8—figure supplement 1—source data 1. p53 depletion rescued NMNAT knockdown-induced caspase-3 activation in glioma.

NMNAT regulates PARylation and acetylation of p53

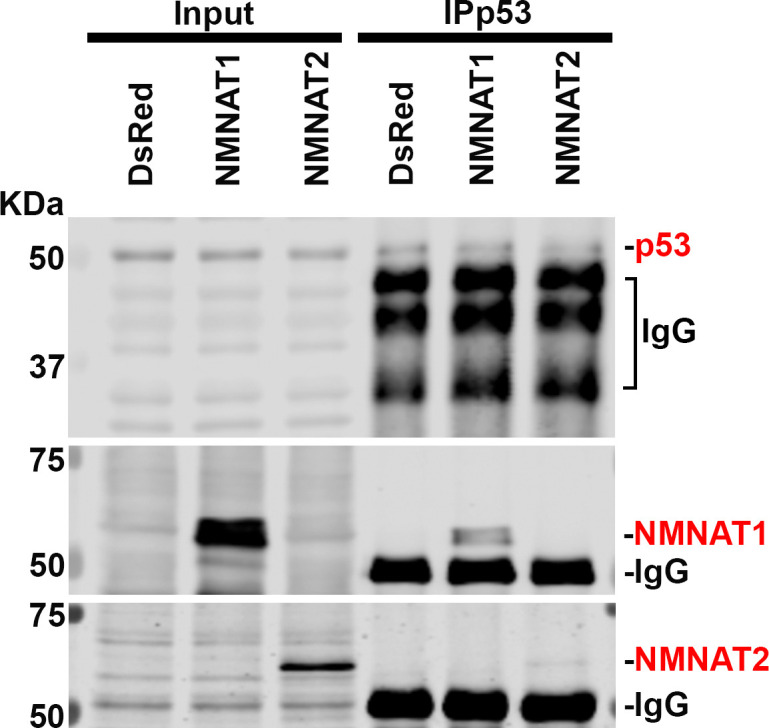
Our observations that NMNAT overexpression-induced higher tolerance to DNA damage and altered p53 response is intriguing. Maintaining functional DNA repair is critical for cancer cells to survive during rapid cell proliferation and the accompanying constant need for DNA replication. In response to DNA damage, PARP1 catalyzes NAD+-dependent PARylation of a large number of proteins (including p53), a process that is one of the largest NAD+ consumers in the nucleus (Fischbach et al., 2018; Kim et al., 2005). It has been shown that PARylated p53 has reduced stability and activity (Simbulan-Rosenthal et al., 1999). We hypothesize that NMNAT regulates PARylation in glioma cells. To test this hypothesis, we first examined the level of protein PARylation under NMNAT overexpression, and using dot blot analysis, we found that protein PARylation level was significantly increased in NMNAT1 or NMNAT2 overexpressing cells and significantly reduced with siRNA knockdown (Figure 9A and B and Figure 9—figure supplement 1). Next, we examined the protein-protein interaction among p53, NMNAT1, and PARP1 using immunoprecipitation. Interestingly, we detected PARP1 and NMNAT proteins in the p53-immunoprecipitated fraction (Figure 9C). Furthermore, although total p53 levels were not significantly affected by NMNAT expression, the level of PARP1 immunoprecipitated with p53 was increased with NMNAT overexpression (Figure 9C). We observed consistent results in U87MG cells that NMNAT interacts with p53 (Figure 9—figure supplement 2). These results suggest the presence of a trimeric p53/ NMNAT/PARP1 complex, and a potential role of NMNAT in promoting the trimeric complex formation.

Figure 9. NMNAT interacts with p53 and PARP1 and upregulates PARylation.

(A) Proteins were extracted from T98G cells transfected with plasmids for Western blot and dot blot analyses using anti-PAR antibody. (B) Quantification of PAR in Western blot analysis. Data are presented as mean ± s.d., n=4. Significance level was established by t-test. (C) Protein samples extracted from T98G cells transfected with DsRed, DsRed-NMNAT1, or NMNAT2 were immunoprecipitated (IP) with a p53 antibody and subjected to immunoblot (IB) analysis for p53, PARP1, NMNAT1, and NMNAT2. (D–G) T98G cells transfected with DsRed or DsRed-NMNAT1 were stained for DAPI (blue), p53 (green), or PARP1 (green). The second to the fourth rows are high magnification of the boxed area in the first row. The intensity (0–4095) of p53 or PARP is indicated in a heatmap (D2–G2) or surface plot (D2’–G2’). Scale bars, 10 µm. (H) Quantification of nuclear p53. Data are presented as median ± quartiles, n≥100. Significance level was established by one-way ANOVA post hoc Bonferroni test. (I) Quantification of PARP1 intensity. Data are presented as median ± quartiles, n≥100. Significance level was established by one-way ANOVA post hoc Bonferroni test. *p≤0.05. NS, not significant. NMNAT, nicotinamide mononucleotide adenylyltransferase.

Figure 9—source data 1. NMNAT interacts with p53 and PARP1 and upregulates PARylation.

Figure 9.

Figure 9—figure supplement 1. PARylation is reduced after NMNAT knockdown.

Figure 9—figure supplement 1.

Proteins were extracted from T98G cells transfected with siRNA for dot blot analysis using anti-PAR antibody and quantification. Data are presented as mean ± SD, n=3. Significance level was established by t-test. *p≤0.05; **p≤0.01. NMNAT, nicotinamide mononucleotide adenylyltransferase.
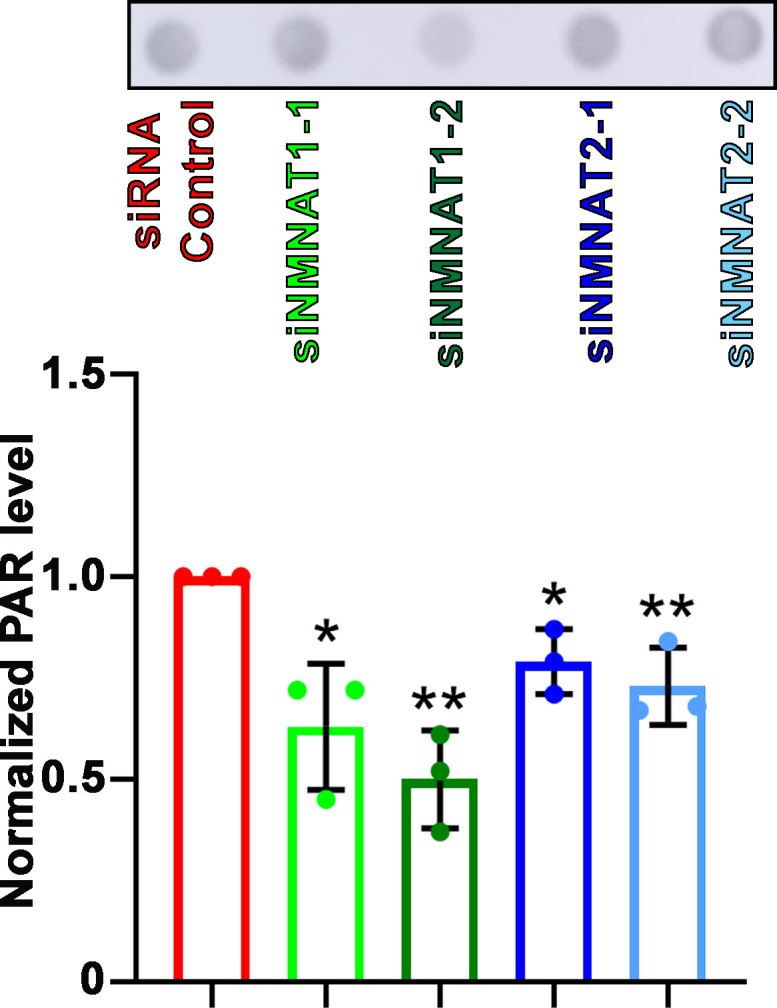
Figure 9—figure supplement 2. NMNAT interacts with p53 in U87MG.

Figure 9—figure supplement 2.

Protein samples extracted from U87MG cells transfected with DsRed, DsRed-NMNAT1, or DsRed-NMNAT2 were immunoprecipitated (IP) with a p53 antibody and subjected to immunoblot (IB) analysis for p53, PARP1, NMNAT1, and NMNAT2. NMNAT, nicotinamide mononucleotide adenylyltransferase.
Figure 9—figure supplement 2—source data 1. NMNAT interacts with p53 in U87MG.

To confirm and extend the biochemical analysis, we carried out immunofluorescent colocalization studies of T98G glioma cells expressing NMNAT1 and detected the colocalization of NMNAT1 with p53 (Figure 9E1) as well as of NMNAT1 with PARP1 (Figure 9G1). Consistent with Western blot analysis (Figure 9C), p53 protein level is not altered by NMNAT expression as p53 immunofluorescence intensity was similar between NMNAT1 expression cells and neighboring untransfected cells, or DsRed expressing control cells (Figure 9D2 and quantified in Figure 9H). Interestingly, the distribution of p53 changed from diffuse to clustered in NMNAT1-positive hotspots, as visualized by a fluorescence surface plot in Figure 9E2’. Similarly, PARP1 protein also clustered in NMNAT1-positive hotspots (Figure 9G2 and G2’), suggesting the close proximity of NMNAT, p53, and PARP1. In addition, in NMNAT-expressing cells, PARP1 levels exhibit a small but significant upregulation (Figure 9I). Collectively, these results suggest that NMNAT interacts with PARP1 and promotes PARylation of PARP1-targeting proteins, including p53, through increasing the local NAD+ availability.

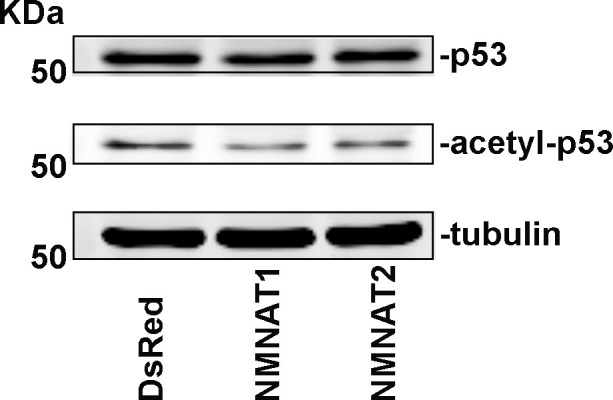
In addition to PARylation, p53 is modified by another NAD+-dependent posttranslational modification (PTM), deacetylation. p53 is acetylated by p300/CBP and deacetylated by SIRTs family of NAD+-dependent deacetylases (Vaziri et al., 2001). SIRT1 is the major deacetylase regulating p53 activity through deacetylation of p53 at K382, and hence inhibiting the p53-mediated apoptosis pathway (Cheng et al., 2003). NMNAT1 has been reported to interact with SIRT1 directly (Zhang et al., 2009). We determined the level of acetyl-p53 in cell extracts and through immunoprecipitating by anti-p53 antibodies from T98G glioma cells with or without NMNAT overexpression, and then probing for acetyl-p53 at K382. Interestingly, with NMNAT1 or NMNAT2 overexpression, acetyl-p53 was specifically reduced while total p53 levels remained the same (Figure 10A–C), although a stable complex of p53 and SIRT1 was not detected. It is interesting to note that endogenous SIRT1 expression was upregulated in NMNAT overexpressing cells (Figure 10D), suggesting a potential coregulation of NMNAT and SIRT1. Notably, similar results were observed in U87MG cells (Figure 10—figure supplement 1), suggesting a common effect of NMNAT on p53 modification. Collectively, these results show that NMNAT upregulation promotes the NAD+-dependent deacetylation of p53 and specifically reduces the pool of acetyl-p53.

Figure 10. NMNAT upregulates SIRT1 and reduces acetylation of p53.

(A) Protein samples extracted from T98G cells transfected with DsRed, DsRed-NMNAT1, or NMNAT2 were immunoprecipitated (IP) with a p53 antibody and probed for acetyl-p53 and SIRT1. Red asterisks (*) indicate the acetyle-p53 bands in input and IP-ed fractions. (B, C) Quantification of acetyl-p53 in p53-immunoprecipitated fraction (B) and input fraction (C). (D) Quantification of SIRT1. Data are presented as mean ± s.d., n=3. Significance level was established by one-way ANOVA post hoc Bonferroni test. *p≤0.05; **p≤0.01; ***p≤0.001. NMNAT, nicotinamide mononucleotide. adenylyltransferase.

Figure 10—source data 1. NMNAT upregulates SIRT1 and reduces acetylation of p53.
Figure 10—source data 2. NMNAT upregulates SIRT1 and reduces acetylation of p53.

Figure 10.

Figure 10—figure supplement 1. Acetyl-p53 is reduced after NMNAT overexpression in U87MG.

Figure 10—figure supplement 1.

U87MG cells were treated with CDDP and probed for p53, acetyl-p53, and tubulin. NMNAT, nicotinamide mononucleotide adenylyltransferase.
Figure 10—figure supplement 1—source data 1. Acetyl-p53 was reduced in U87MG cells under NMNAT overexpression conditions.

To further examine the disease-relevant role of NMNAT in glioma growth, we analyzed patient data from the Cancer Genome Atlas (TCGA) to determine how NMNAT expression levels affect survival in glioma and glioblastoma, using the gene expression profiling interactive platform, GEPIA (http://gepia.cancer- pku.cn/). A strong negative correlation between NMNAT1 expression and survival can be seen in patients with brain lower grade glioma (LGG), with elevated NMNAT1 expression significantly associated with a lower disease-free survival rate, both when comparing survival in the median high-low tumor expression patient groups (Figure 11A) and in the highest and lowest 10% expression groups (Figure 11B). In the aggressive form of glioma, glioblastoma multiforme (GBM), from which the T98G and U87MG cell lines are derived, high NMNAT1-expressing tumors (top 10%) again showed a significant correlation with more aggressive disease and poorer outcome (Figure 11C). However, NMNAT2 GBM expression levels did not correlate with patient survival (Figure 11D). These brain glioma patient data set results indicate the strong correlation between high NMNAT1 expression with lower survival and poorer clinical outcome. As both PARylation and deacetylation modifications of p53 have been reported to inactivate p53-mediated function and activity (Juan et al., 2000; Luo et al., 2000; Malanga et al., 1998; Simbulan-Rosenthal et al., 1999), collectively, our results suggest a model where NMNAT promote glioma growth through facilitating NAD+-dependent PTMs of p53 to ameliorate apoptosis (Figure 11E).

Figure 11. Correlation of tumor NMNAT expression levels with glioma progression.

(A, B) LGG (lower grade glioma) data set (GEPIA). Survival curves for patients with tumors expressing median (top 50% vs. bottom 50%) NMNAT1 levels (A), or top 10% versus bottom 10% levels (B), with associated log-rank p-values shown. Highly significant correlation of high NMNAT1 expression levels with poor patient survival and more aggressive disease. (C, D) GBM (glioblastoma multiform) data set (GEPIA). Survival curves for patients are shown, with tumors expressing top 10% versus bottom 10% NMNAT1 levels (C) and NMNAT2 (D) levels as well as associated log-rank p-values. High NMNAT1-expressing tumors have extremely poor relapse-free rates compared to low NMNAT1-expressing tumors. In contrast, no significant difference in survival is detected for NMNAT2 expression. (E) Model for NMNAT in glioma. In glioma cells, PAPR1 inhibits p53 activity by NAD+ dependent-poly(ADP-ribosyl)ation of p53 during DNA damage repair. NMNAT overexpression replenishes the NAD+ pool to promote poly(ADP-ribosyl)ation and deacetylation of p53, suppressing p53 induced apoptosis, thereby leading to glioma growth. NMNAT, nicotinamide mononucleotide adenylyltransferase.

Figure 11.

Figure 11—figure supplement 1. Summary of NMNAT1 and NMNAT2 alteration frequency in cancer types.

Figure 11—figure supplement 1.

Alteration of human NMNAT1 and NMNAT2 was queried in TCGA database (https://www.TCGA.com). 1522 cases with altered NMNAT1 and 931 cases with altered NMNAT2 across 32 projects are shown. NMNAT, nicotinamide mononucleotide adenylyltransferase.
Figure 11—figure supplement 2. Summary of NMNAT1 and NMNAT2 alteration frequency in cancer types.

Figure 11—figure supplement 2.

Alteration of human NMNAT1 and NMNAT2 was queried in cBioPortal database (https://www.cbioportal.com) separately. 10,967 samples in 35 cancer types are shown. NMNAT, nicotinamide mononucleotide adenylyltransferase.

Discussion

In this study, we identified a critical role of NMNAT in promoting glioma cell proliferation and growth in a model of Drosophila glial neoplasia and human glioma cell lines. We found that NMNAT promotes glioma growth by allowing a higher tolerance to DNA damage and inhibiting p53/caspase-mediated apoptosis. Mechanistically, upregulation of enzymatically active NMNAT promotes the NAD+-dependent PTMs of p53. Specifically, we detected upregulation of protein PARylation and the presence of a p53-NMNAT-PARP1 trimeric complex as well as decreased acetylation of p53 accompanied with increased SIRT1. Our findings support a tumorigenesis model where NMNAT proteins promote glioma growth through regulating NAD+-dependent PTM of p53, and driving cellular pools of p53 toward PARylated-p53 (inactive p53) and away from acetyl-p53 (active p53) to ameliorate DNA damage-triggered cell death under oncogenic stresses associated with tumor development (Figure 11E).

The advantages and potential of an in vivo Drosophila glial neoplasia

We adapted a glial neoplasia model in Drosophila using the UAS-Ras85Dv12 and repo-GAL4 driver system that induces overgrowth of glial cells to mimic glial neoplasia formation (Read et al., 2009). Although RAS alterations in human glioma occur at a lower frequency than some other higher frequency driver alterations (Brennan et al., 2013), our rationale for using mutant RAS overexpressing model in Drosophila was to study the effects of NMNAT on the broader common (rather than Ras-specific) processes underlying tumorigenic development in a validated glioma model in Drosophila. It will be an important future direction to establish Drosophila models using other high-frequency glioma drivers. Since all Drosophila glia express Repo, we can easily monitor the formation of Rasv12-driven glial neoplasia in the brain by GFP reporter, Repo, and F-actin labeling. In fluorescence imaging, normal brains typically have two to three layers of Repo-positive cells visible in each section (Figure 1B). Therefore, any tissue mass consisting of more than three layers of glia would be atypical and potentially tumor-like. We analyzed glial neoplasia with three key criteria: cell type (Repo-positive), cell number (more than three layers with at least 400), and tissue size (volume of at least 12.4×103 μm3). Combined with our high-resolution imaging capability, these criteria allow us to distinguish tumor from non-glial neoplasia tissue with high confidence and to analyze glial neoplasia in the most robust and reproducible manner. In Rasv12 expressing flies, we observed glial neoplasia occurred extensively in the brain and VNC.

In addition to the morphological phenotypes, we found that glial neoplasia reduced the animal survival rate. Specifically, the total volume of glial neoplasia tissue is positively correlated with the severity of reduced animal survival rate. Such correlation allows the use of high-resolution in vivo morphological imaging as a strong predictor of pathological outcome and a powerful tool to identify genetic modulators of tumorigenesis as we have done in this study, and potential pharmacological modulators for cancer therapy in the future.

NMNAT-mediated NAD+ biosynthesis promotes glioma growth

Our results show that NMNAT expression promotes glioma growth but is likely dispensable for its initiation, as NMNAT overexpression alone did not trigger tumorigenesis. Our results showed that the enzymatic function of NMNAT is required for glioma growth. This finding is not surprising given the fundamental role of NAD+ as a signaling cofactor that regulates cancer metabolism through its coenzymatic function in the redox reactions underlying essential bioenergetic pathways, including glycolysis, the TCA cycle, and oxidative phosphorylation (Hanahan and Weinberg, 2000). While NAMPT is the rate-limiting enzyme, NMNAT is downstream of NAMPT and directly regulates the level of NAD+ by catalyzing the reversible reaction of NAD+ synthesis. The direction of the reaction, forward (NAD+ production) or reverse (NAD+ breakdown), is dependent upon the availability of subtracts. Therefore, NMNAT functions as a cellular metabolic sensor and maintains the homeostasis of NAD+ pools.

NAD+ is highly compartmentalized, with each subcellular NAD+ pool differentially regulated and preferentially involved in distinct NAD+-dependent signaling or metabolic events (Zhu et al., 2019). Compartment-localized NMNAT isoforms contribute to the maintenance of subcellular NAD+ pools. In mammals, NMNAT1 is nuclear and NMNAT2 is cytoplasm-localized (Berger et al., 2005). Our analysis of the public glioma cancer data set GEPIA identified a strong negative correlation between NMNAT1 expression and disease-free survival in patients with brain LGG as well as the progressive GBM. These findings have several implications. First, the critical requirement for nuclear NAD+-consuming events in tumor growth demands a constant supply of nuclear NAD+ pool by nuclear-localized NMNAT. Indeed, as our results show, NAD+-dependent PARylation and deacetylation of proteins including p53 underlies the mechanism of tumorigenesis. Second, the difference in the tumor-promoting effects of nuclear vs. cytoplasmic NMNAT isoforms may inform cellular metabolic needs and genotoxic load. Interestingly, the CBio portal databases show NMNAT1 and NMNAT2 genes appear to be amplified in distinct cancer types (Figure 11—figure supplements 1 and 2). Future work is required to identify the specific roles of NMNAT1 and NMNAT2 in different cancer types.

During the submission of this manuscript, two groups reported the distinct roles of NMNAT1 and NMNAT2 in acute myeloid leukemia and ovarian cancer respectively (Challa et al., 2021; Shi et al., 2021). Shi et al., 2021 showed that NMNAT1-mediated NAD+ metabolism regulates p53 acetylation and enables acute myeloid leukemia (AML) to evade apoptosis (Shi et al., 2021). Challa et al., 2021 showed that NMNAT2-mediated cytosolic NAD+ synthesis regulates ribosome ADP-ribosylation to maintain protein homeostasis in ovarian cancer (Challa et al., 2021). It is important to note that in mammalian cells, nuclear and cytoplasmic NMNATs can regulate each other’s activity, likely through feedback from dynamic pool of substrates NMN and ATP, as overexpressing cytoplasmic NMNAT may exhaust the supply of NMN therefore repress nuclear NAD+ synthesis (Ryu et al., 2018). Consequently, altering the nuclear NAD+ pool may regulate gene transcription and influence cell differentiation or proliferation state (Ryu et al., 2018). Our observation of the specific upregulation of endogenous nuclear NMNAT upon oncogenic RAS-expression further supports the hypothesis that nuclear and cytoplasmic NMNAT react differently in stress conditions and likely be important in different stages of tumor growth.

NAD+-mediated posttranslational modifications of P53: a balancing act

PARylation, phosphorylation, acetylation, and ubiquitination are PTMs that have been shown to regulate the stability and activity of p53 (Bode and Dong, 2004). Among the most common PTMs of p53, PARylation and acetylation are both NAD+-consuming processes mediated by NAD+-dependent enzymes, PARPs, and SIRTs (Lee et al., 2012; Vaziri et al., 2001). When PARP1 activity is induced in the DNA damage response process, extensive protein PARylation occurs and many proteins including p53 and DNA repair machinery components are PARylated (Amé et al., 2004; Fischbach et al., 2018). Numerous studies have shown that PARylation of p53 may inhibit p53-mediated function, including cell cycle arrest and apoptosis (Kanai et al., 2007; Simbulan-Rosenthal et al., 1999; Simbulan-Rosenthal et al., 2001). With abundant NAD+ supply, PARylation is an efficient way to repair DNA damage and ensure cell survival; whereas under conditions of insufficient NAD+ supply, apoptosis is induced (Herceg and Wang, 2001). In response to DNA damage, the activity of p53 is also modulated by acetylation. Acetyl-p53 is resistant to degradation by ubiquitination and has higher stability, and therefore can exert longer effects of growth arrest, senescence, and apoptosis (Li et al., 2002). NAD+-dependent PARylation and acetylation have the opposite effects on p53 activity, where PARylation inhibits p53 activity and acetylation prolongs p53 activity. NAD+ thus plays a critical role in balancing the pro-apoptotic activity of p53. NMNAT1 regulates functions of NAD+-dependent enzymes such as SIRT1 and PARP1 (Zhang et al., 2009; Zhang et al., 2012). Interestingly, our results identified a trimeric complex of NMNAT-PARP1-p53 and increased PARP1 and SIRT1, which supports the model that NMNAT recruits NAD+-utilizing enzymes, including PARP1 and SIRT1, together with protein substrates, and locally supply NAD+ for NAD+-dependent protein modification. Such an NMNAT-PTM modifying enzyme-protein substrate trimeric protein complex will not only sustain the local supply of NAD+ but also facilitate and expedite the modification process.

It is important to note that p53 is not the only target for PARylation and deacetylation regulation. The role of NMNAT in PARylation of other target proteins has also been indicated. For example, it has been shown that decreased NMNAT1 expression caused nuclear NAD+ deficiency and subsequently reduced PARylation of multifunctional nuclear protein CCCTC-binding factor, leading to epigenetic silencing of tumor suppressor genes (Henderson et al., 2017). As noted above, the most recent study showed increased NMNAT2 mediated cytosolic NAD+ synthesis activity supports mono(ADP-ribosyl)ation (MARylation) through PARP-16 in ribosome (Challa et al., 2021). These reports together with our findings support a specific role of NAD+ in modulating tumorigenesis through regulating PTMs, including PARylation and deacetylation. Our findings in both in vivo and in vitro models highlight NMNAT’s roles in promoting glioma development. Specifically, the direct interaction we identified among p53, NMNAT, and PARP1 has important implications regarding the utility of NMNAT as a potential target for glioma therapy. Because the protein-protein interaction interface of NMNAT-PARP1-p53 could provide allosteric targeting of NMNAT, in addition to its enzyme pocket, this may open new possibilities for alternative inhibitors of NAD+-dependent pathway with less toxicity.

It should be noted that although T98G cells carry a gain-of-function p53 mutation (M237I) in the DNA binding domain, this mutation does not affect the sites of PARylation and acetylation (Yamamoto and Iwakuma, 2018; Yi et al., 2013). Moreover, prior studies support the ability of cells harboring this p53 mutant to undergo apoptosis, which can be abrogated by p53 inhibition (Enns et al., 2004). Our findings that NMNAT similarly affects p53 modification in either wild-type (U87MG) or mutant p53 (T98G) cells suggest NAD+-dependent PARylation or deacetylation of p53 is independent of the p53 [M237I] mutation. Indeed recent studies have shown that mutant p53 proteins retain the ability to induce apoptosis despite losing tumor-suppressive transactivation functionality (Timofeev et al., 2019). Further studies will be required to fully understand the effects of NMNAT on p53 transcription factor function.

In conclusion, our studies have identified NMNAT as an NAD+ synthase that plays an essential role in regulating the function and activation of p53 during DNA damage-induced apoptosis in glioma cells. These results support the development of specific NMNAT inhibitors as potentially efficacious therapeutic agents in cancers with upregulated NMNAT levels.

Materials and methods

Fly stocks and culture

Flies were maintained at 25°C room temperature with standard medium. The following lines were used in this study obtained from the Bloomington Drosophila Stock Center: (1) The driver used in all experiments: repo-GAL4; (2) UAS-Rasv12 (II); (3) UAS-Rasv12 (III); (4) UAS-Nmnat RNAi (III); (5) UAS-p35; (6) UAS-Diap1; (7) UAS-Dronc RNAi; and (8) UAS-DCP1 RNAi. UAS-Drosophila melanogaster Nmnat (UAS-PC, UAS-PCWR, UAS-PD) were generated in the laboratory.

Fly treatment

Larvae were collected and treated with 100 μM of Pifithrin-α (Sigma-Aldrich, P4359) with standard medium at 25°C room temperature.

Human glioma cell line culture and treatment

T98G and U87MG (human glioma cells) cell lines were purchased from the American Type Culture Collection (ATCC; CRL-1609). SVG p12 cell line was from Dr. Michal Toborek (University of Miami). Cells were maintained in Eagle’s Minimum Essential Medium (EMEM; Sigma-Aldrich, M0325) supplemented with 10% fetal bovine serum (FBS; ATCC, 30–2020). Cells were cultured at 37°C, 5% CO2. To induce apoptosis, cells were treated with 50 μM of cisplatin for 8 hr (Sigma-Aldrich, 232120).

Antibodies

The following commercially available antibodies were used: anti-Repo (1:250, DSHB, 8D12), anti-Caspase-3 (1:250 for Immunocytochemistry of fly brain, 1:1000 for Western blot analysis, Cell Signaling Technology, 9665), anti-Cleaved Caspase-3 (1:1000, Santa Cruz, 9661), anti-H2AvD (1:50, Rockland, 600-401-914), anti-p53(E-5) (1:50, Santa Cruz, sc-74573), p53(DO-1) (1:1000, Santa Cruz, sc-126), anti-Drosophila Nmnat (1:3000), anti-NMNAT1 (1:1000, Abcam, ab45548), anti-NMNAT1 (1:1000, Santa Cruz, 271557), anti-NMNAT2 (1:500, Abcam, ab56980), anti-PARP1 (1:1000, Santa Cruz, sc-8007), anti-pADPr (1:1000, Santa Cruz, sc-56198), anti-SIRT1 (1:1000, Cell Signaling Technology, 2492), anti-acetyl-p53 (1:1000, Cell Signaling Technology, 2525), anti-β-actin (1:10,000, Sigma-Aldrich, A1978), and anti-tubulin (1:300, Abcam, ab15246). The secondary antibodies conjugated to Alexa 488/546/647 (1:250, Invitrogen), or near-infrared (IR) dye 700/800 (1:5000, LI-COR Biosciences). HRP-anti-mouse and HRP-anti-rabbit (1:5000, Thermo Fisher Scientific).

Plasmid construction

Four recombinant plasmids were generated for this study: pDsRed, pDsRed-NMNAT1, pDsRed-NMNAT2, NMNAT1, and NMNAT2.

RNA interference

Small interference RNA sequences targeting human NMNAT were purchased (GenePharma). The siRNA sequences were listed in Supplementary (Figure 3—figure supplement 2).

shRNA knockdown

Stable p53 knockdown was performed using the pLKO lentiviral shRNA system. Lentiviral supernatant production was carried out in HEK 293T cells and transduction of target U87MG and T98G cells with either the shp53 or the control shGFP supernatant was performed as described previously (Rai et al., 2009). The following validated shRNA target sequences (Burton et al., 2013); (Patel et al., 2015) were used:

  • shGFP: 5′-GCAAGCTGACCCTGAAGTTCA-3′

  • shp53: 5′-GACTCCAGTGGTAATCTACTT-3′

Transduced cells were selected in 2.5 µg/ml puromycin-containing culture media for a minimum period of 5–7 days (corresponding to the time taken for untransduced cells to die completely in selection media).

Real-time RT-PCR

The total RNA was extracted by TRIzol reagent (Invitrogen) from T98G cells according to the manufacturer’s protocol. cDNA was synthesized from RNA with a cDNA Reverse Transcription Kit (Applied Biosystems). RNA was performed using a Real-Time System and SYBR Green Kit (Applied Biosystems). Relative gene expression was compared to actin as an internal control. The primers used in detection were listed in the Supplementary (Figure 3—figure supplement 2).

Cells transfection

Cells for transfection were seeded in a six-well culture vessel (VWR) containing EMEM media with 10% FBS for 24 hr. Plasmids or siRNA were transfected with transfection reagent (jetPRIME). Gene expression was measured by Western blot analysis and real-time qPCR after cells were transfected at 48 hr.

Immunocytochemistry of cells

Cells were grown on 22 mm glass coverslips (VWR). After treatment, cells were rinsed three times with phosphate-buffered saline (PBS), fixed for 15 min in 4% paraformaldehyde, washed three times with PBS, and permeabilized with 0.4% Triton X-100 in PBS for 5 min. After three times washing in PBS, blocking was performed by incubation in 5% normal goat serum in PBTX (PBS with 0.1% Triton X-100) at 37°C for 30 min. Incubation with primary antibodies was performed in 5% goat serum in PBTX at 37°C for 2 hr. Next, cells were washed three times with PBS and incubated for 1 hr at 37°C with secondary antibodies in 5% goat serum in PBTX. Then, after three times washing with PBS, cells were stained with 4′,6-diamidino-2-phenylindole (DAPI, 1:300, Invitrogen) at 37°C for 5 min in PBTX solution. The cells were washed three times with PBS, and the coverslips were mounted on glass slides with VECTASHIELD Antifade Mounting Medium (Vector Laboratories) and kept at 4°C before imaging.

Immunocytochemistry of fly brain

The larval brains were dissected in PBS (pH 7.4), and fixed in PBS with 4% formaldehyde for 15 min. After the brains were washed in PBS containing 0.4% (v/v) Triton X-100 (PBTX) for 15 min three times, the brains were incubated with primary antibodies diluted in 0.4% PBTX with 5% normal goat serum overnight. Then, secondary antibodies were at room temperature for 1 hr, followed by DAPI (1:300, Invitrogen) staining for 10 min. Brains were mounted on glass slides with VECTASHIELD Antifade Mounting Medium (Vector Laboratories) and kept at 4°C before imaging.

Confocal image acquisition and image analysis

Confocal microscopy was performed with an Olympus IX81 confocal microscope coupled with ×10, ×20 air lens or ×40, ×60 oil immersion objectives, and images were processed using FluoView 10-ASW (Olympus). Specifically, Figure 7B and C were analyzed using the ImageJ interactive 3D surface Plot plugin.

Western blot analysis

Proteins were extracted from cells in RIPA (radioimmunoprecipitation assay) buffer 1 mM protease inhibitor cocktail (Sigma-Aldrich). Samples were heated at 100°C for 10 min in a 4× loading buffer. Proteins were separated on a Bis-Tris gel and transferred to nitrocellulose membranes. Then, membranes were blocked with blocking buffer (Rockland) for 1 hr at room temperature. Primary antibodies were incubated at 4°C overnight and secondary antibodies were incubated for 1 hr at room temperature. Images were processed on an Odyssey Infrared Imaging System or Amersham Imager 600 and analyzed using Image Studio software or ImageJ.

Dot blot analysis

Proteins were extracted from cells in RIPA buffer 1 mM protease inhibitor cocktail (Sigma-Aldrich). Proteins were loaded with same amount on PVDF membranes. Then, membranes were blocked with Casine buffer for 1 hr at room temperature. Primary antibodies were incubated at 4°C overnight and secondary antibodies were incubated for 1 hr at room temperature. Images were processed on an Amersham Imager 600 and analyzed using ImageJ software.

Cell proliferation test

Cells were seeded into the E-Plate 96 (ACEA) with the same confluence per well. Then, the plate was incubated at 37°C in 5% CO2 for about 100 hr. The instrument was used to monitor the cell growth index. The cell growth curve was drawn with the value of each group from xCELLigence RTCA SP instrument.

Colony formation assay

Cells were seeded with 1000 per well in a six-well plate containing 2 ml medium and replaced medium every 2 days. Cells were washed with 1 ml PBS three times and fixed with 1 ml formaldehyde for 15 min. After washed with PBS, cells were stained in 0.1% crystal violet buffer (Sigma-Aldrich) for 15 min. Cells were washed with pure water gently, and plates were put at room temperature to dry. Images were processed on an Amersham Imager 600 and analyzed using ImageJ software.

Immunoprecipitation

Proteins were extracted from cells in RIPA buffer. Proteins were incubated with Protein-A beads (Thermo Fisher Scientific) conjugated with anti-p53 antibody or Mouse IgG at 4°C overnight with gentle shaking. After removing the supernatant, the bead pellets were collected and suspended with lysis buffer. Proteins were heated with loading buffer for 10 min at 100°C for loading to gel.

Flow cytometry

Cells were prepared according to cell cycle and cell apoptosis detection kits (BD Pharmingen) after knockdown of NMNAT 72 hr. AnnexinV:PI gating was selected and analyzed to divide the data into quadrants, where Q3 was considered as viable, Q4 as early apoptosis, and Q2 as end stage apoptosis and death.

Statistics

For each statistical test, biological sample size (n), and p-value are indicated in the corresponding figure legends. All data in this manuscript are shown as mean ± SD or median ± quartiles (specified in figure legends). t-test was used to compare between two groups, and one-way ANOVA with Bonferroni’s post hoc test was applied to compare among three or more groups. Data were analyzed with Prism (GraphPad Software). Specifically, fly survival data were analyzed by the Chi-square test in R.

Acknowledgements

The authors thank V Chavez Perez, Qin Yang, and Ling Zhang for technical expertise; and Joun Park for manuscript comments. The authors thank the FACS core facility at Sylvester Comprehensive Cancer Center, and Shannon Jacqueline Saigh for technical support. This research was supported by the Taishan Scholar Project of Shandong Province, the Science and Technology Support Program for Youth Innovation in Universities of Shandong (2019KJM009), the National Natural Science Foundation of China (82073888), the Top Talents Program for One Case Discussion of Shandong Province, Bohai rim Advanced Research Institute for Drug Discovety (LX211011), and the Sylvester Comprehensive Cancer Center.

Funding Statement

The funders had no role in study design, data collection and interpretation, or the decision to submit the work for publication.

Contributor Information

Hongbo Wang, Email: hongbowangyt@163.com.

R Grace Zhai, Email: gzhai@miami.edu.

Patrik Verstreken, KU Leuven, Belgium.

Jonathan A Cooper, Fred Hutchinson Cancer Research Center, United States.

Funding Information

This paper was supported by the following grants:

  • National Natural Science Foundation of China 82073888 to Hongbo Wang.

  • Science and technology support program for youth innovation in universities of Shandong 2019KJM009 to Hongbo Wang.

  • Sylvester Comprehensive Cancer Center to Rong Grace Zhai, Priyamvada Rai.

  • Bohai Rim Advanced Research Institute for Drug Discovery (LX211011) to Hongbo Wang.

Additional information

Competing interests

No competing interests declared.

No competing interests declared.

Author contributions

Data curation, Formal analysis, Investigation, Methodology, Writing – original draft, Writing – review and editing.

Data curation, Investigation, Methodology, Writing – review and editing.

Data curation, Formal analysis, Investigation, Methodology, Writing – original draft, Writing – review and editing.

Methodology, Resources, Writing – review and editing.

Data curation, Methodology, Resources, Writing – review and editing.

Investigation, Methodology.

Data curation, Writing – review and editing.

Conceptualization, Funding acquisition, Project administration, Resources, Writing – review and editing.

Conceptualization, Data curation, Formal analysis, Funding acquisition, Investigation, Project administration, Supervision, Writing – original draft, Writing – review and editing.

Additional files

Transparent reporting form
Source data 1. Original data file.
elife-70046-supp1.xlsx (399.3KB, xlsx)

Data availability

All data generated or analysed during this study are included in the manuscript and supporting files. Source data files have been provided.

References

  1. Amé J-C, Spenlehauer C, de Murcia G. The PARP superfamily. BioEssays. 2004;26:882–893. doi: 10.1002/bies.20085. [DOI] [PubMed] [Google Scholar]
  2. Arvanitis D, Malliri A, Antoniou D, Linardopoulos S, Field JK, Spandidos DA. Ras p21 expression in brain tumors: elevated expression in malignant astrocytomas and glioblastomas multiforme. In Vivo. 1991;5:317–321. [PubMed] [Google Scholar]
  3. Barbacid M. ras genes. Annual Review of Biochemistry. 1987;56:779–827. doi: 10.1146/annurev.bi.56.070187.004023. [DOI] [PubMed] [Google Scholar]
  4. Berger F, Lau C, Dahlmann M, Ziegler M. Subcellular compartmentation and differential catalytic properties of the three human nicotinamide mononucleotide adenylyltransferase isoforms. The Journal of Biological Chemistry. 2005;280:36334–36341. doi: 10.1074/jbc.M508660200. [DOI] [PubMed] [Google Scholar]
  5. Bode AM, Dong Z. Post-translational modification of p53 in tumorigenesis. Nature Reviews. Cancer. 2004;4:793–805. doi: 10.1038/nrc1455. [DOI] [PubMed] [Google Scholar]
  6. Brazill JM, Cruz B, Zhu Y, Zhai RG. Nmnat mitigates sensory dysfunction in a Drosophila model of paclitaxel-induced peripheral neuropathy. Disease Models & Mechanisms. 2018a;11:e032938. doi: 10.1242/dmm.032938. [DOI] [PMC free article] [PubMed] [Google Scholar]
  7. Brazill JM, Zhu Y, Li C, Zhai RG. Quantitative Cell Biology of Neurodegeneration in Drosophila Through Unbiased Analysis of Fluorescently Tagged Proteins Using ImageJ. Journal of Visualized Experiments. 2018b;138:58041. doi: 10.3791/58041. [DOI] [PMC free article] [PubMed] [Google Scholar]
  8. Brennan CW, Verhaak RGW, McKenna A, Campos B, Noushmehr H, Salama SR, Zheng S, Chakravarty D, Sanborn JZ, Berman SH, Beroukhim R, Bernard B, Wu C-J, Genovese G, Shmulevich I, Barnholtz-Sloan J, Zou L, Vegesna R, Shukla SA, Ciriello G, Yung WK, Zhang W, Sougnez C, Mikkelsen T, Aldape K, Bigner DD, Van Meir EG, Prados M, Sloan A, Black KL, Eschbacher J, Finocchiaro G, Friedman W, Andrews DW, Guha A, Iacocca M, O’Neill BP, Foltz G, Myers J, Weisenberger DJ, Penny R, Kucherlapati R, Perou CM, Hayes DN, Gibbs R, Marra M, Mills GB, Lander E, Spellman P, Wilson R, Sander C, Weinstein J, Meyerson M, Gabriel S, Laird PW, Haussler D, Getz G, Chin L, TCGA Research Network The somatic genomic landscape of glioblastoma. Cell. 2013;155:462–477. doi: 10.1016/j.cell.2013.09.034. [DOI] [PMC free article] [PubMed] [Google Scholar]
  9. Brooks CL, Gu W. How does SIRT1 affect metabolism, senescence and cancer? Nature Reviews. Cancer. 2009;9:123–128. doi: 10.1038/nrc2562. [DOI] [PMC free article] [PubMed] [Google Scholar]
  10. Burton DGA, Giribaldi MG, Munoz A, Halvorsen K, Patel A, Jorda M, Perez-Stable C, Rai P. Androgen deprivation-induced senescence promotes outgrowth of androgen-refractory prostate cancer cells. PLOS ONE. 2013;8:e68003. doi: 10.1371/journal.pone.0068003. [DOI] [PMC free article] [PubMed] [Google Scholar]
  11. Cancer Genome Atlas Research Network Comprehensive genomic characterization defines human glioblastoma genes and core pathways. Nature. 2008;455:1061–1068. doi: 10.1038/nature07385. [DOI] [PMC free article] [PubMed] [Google Scholar]
  12. Challa S, Khulpateea BR, Nandu T, Camacho CV, Ryu KW, Chen H, Peng Y, Lea JS, Kraus WL. Ribosome ADP-ribosylation inhibits translation and maintains proteostasis in cancers. Cell. 2021;184:4531–4546. doi: 10.1016/j.cell.2021.07.005. [DOI] [PMC free article] [PubMed] [Google Scholar]
  13. Chen HY, Shao CJ, Chen FR, Kwan AL, Chen ZP. Role of ERCC1 promoter hypermethylation in drug resistance to cisplatin in human gliomas. International Journal of Cancer. 2010;126:1944–1954. doi: 10.1002/ijc.24772. [DOI] [PubMed] [Google Scholar]
  14. Cheng HL, Mostoslavsky R, Saito S, Manis JP, Gu Y, Patel P, Bronson R, Appella E, Alt FW, Chua KF. Developmental defects and p53 hyperacetylation in Sir2 homolog (SIRT1)-deficient mice. PNAS. 2003;100:10794–10799. doi: 10.1073/pnas.1934713100. [DOI] [PMC free article] [PubMed] [Google Scholar]
  15. Chiarugi A, Dölle C, Felici R, Ziegler M. The NAD metabolome--a key determinant of cancer cell biology. Nature Reviews. Cancer. 2012;12:741–752. doi: 10.1038/nrc3340. [DOI] [PubMed] [Google Scholar]
  16. Cui CH, Qi J, Deng QW, Chen RH, Zhai DY, Yu JL. Nicotinamide Mononucleotide Adenylyl Transferase 2: A Promising Diagnostic and Therapeutic Target for Colorectal Cancer. BioMed Research International. 2016;2016:1–8. doi: 10.1155/2016/1804137. [DOI] [PMC free article] [PubMed] [Google Scholar]
  17. Enns L, Bogen KT, Wizniak J, Murtha AD, Weinfeld M. Low-dose radiation hypersensitivity is associated with p53-dependent apoptosis. Molecular Cancer Research. 2004;2:557–566. [PubMed] [Google Scholar]
  18. Fischbach A, Krüger A, Hampp S, Assmann G, Rank L, Hufnagel M, Stöckl MT, Fischer JMF, Veith S, Rossatti P, Ganz M, Ferrando-May E, Hartwig A, Hauser K, Wiesmüller L, Bürkle A, Mangerich A. The C-terminal domain of p53 orchestrates the interplay between non-covalent and covalent poly(ADP-ribosyl)ation of p53 by PARP1. Nucleic Acids Research. 2018;46:804–822. doi: 10.1093/nar/gkx1205. [DOI] [PMC free article] [PubMed] [Google Scholar]
  19. Franken NAP, Rodermond HM, Stap J, Haveman J, van Bree C. Clonogenic assay of cells in vitro. Nature Protocols. 2006;1:2315–2319. doi: 10.1038/nprot.2006.339. [DOI] [PubMed] [Google Scholar]
  20. Freeman MR. Drosophila Central Nervous System Glia. Cold Spring Harbor Perspectives in Biology. 2015;7:a020552. doi: 10.1101/cshperspect.a020552. [DOI] [PMC free article] [PubMed] [Google Scholar]
  21. Fuchs Y, Steller H. Programmed cell death in animal development and disease. Cell. 2011;147:742–758. doi: 10.1016/j.cell.2011.10.033. [DOI] [PMC free article] [PubMed] [Google Scholar]
  22. Garten A, Schuster S, Penke M, Gorski T, de Giorgis T, Kiess W. Physiological and pathophysiological roles of NAMPT and NAD metabolism. Nature Reviews. Endocrinology. 2015;11:535–546. doi: 10.1038/nrendo.2015.117. [DOI] [PubMed] [Google Scholar]
  23. Goodenberger ML, Jenkins RB. Genetics of adult glioma. Cancer Genetics. 2012;205:613–621. doi: 10.1016/j.cancergen.2012.10.009. [DOI] [PubMed] [Google Scholar]
  24. Guha A, Feldkamp MM, Lau N, Boss G, Pawson A. Proliferation of human malignant astrocytomas is dependent on Ras activation. Oncogene. 1997;15:2755–2765. doi: 10.1038/sj.onc.1201455. [DOI] [PubMed] [Google Scholar]
  25. Hanahan D, Weinberg RA. The hallmarks of cancer. Cell. 2000;100:57–70. doi: 10.1016/s0092-8674(00)81683-9. [DOI] [PubMed] [Google Scholar]
  26. Hanahan D, Weinberg RA. Hallmarks of cancer: the next generation. Cell. 2011;144:646–674. doi: 10.1016/j.cell.2011.02.013. [DOI] [PubMed] [Google Scholar]
  27. Henderson DJP, Miranda JL, Emerson BM. The β-NAD+ salvage pathway and PKC-mediated signaling influence localized PARP-1 activity and CTCF Poly(ADP)ribosylation. Oncotarget. 2017;8:64698–64713. doi: 10.18632/oncotarget.19841. [DOI] [PMC free article] [PubMed] [Google Scholar]
  28. Herceg Z, Wang ZQ. Functions of poly(ADP-ribose) polymerase (PARP) in DNA repair, genomic integrity and cell death. Mutation Research. 2001;477:97–110. doi: 10.1016/s0027-5107(01)00111-7. [DOI] [PubMed] [Google Scholar]
  29. Juan LJ, Shia WJ, Chen MH, Yang WM, Seto E, Lin YS, Wu CW. Histone deacetylases specifically down-regulate p53-dependent gene activation. The Journal of Biological Chemistry. 2000;275:20436–20443. doi: 10.1074/jbc.M000202200. [DOI] [PubMed] [Google Scholar]
  30. Kanai M, Hanashiro K, Kim SH, Hanai S, Boulares AH, Miwa M, Fukasawa K. Inhibition of Crm1-p53 interaction and nuclear export of p53 by poly(ADP-ribosyl)ation. Nature Cell Biology. 2007;9:1175–1183. doi: 10.1038/ncb1638. [DOI] [PubMed] [Google Scholar]
  31. Ke N, Wang X, Xu X, Abassi YA. The xCELLigence system for real-time and label-free monitoring of cell viability. Methods in Molecular Biology. 2011;740:33–43. doi: 10.1007/978-1-61779-108-6_6. [DOI] [PubMed] [Google Scholar]
  32. Kim MY, Zhang T, Kraus WL. Poly(ADP-ribosyl)ation by PARP-1: `PAR-laying’ NAD+ into a nuclear signal. Genes & Development. 2005;19:1951–1967. doi: 10.1101/gad.1331805. [DOI] [PubMed] [Google Scholar]
  33. Knobbe CB, Reifenberger J, Reifenberger G. Mutation analysis of the Ras pathway genes NRAS, HRAS, KRAS and BRAF in glioblastomas. Acta Neuropathologica. 2004;108:467–470. doi: 10.1007/s00401-004-0929-9. [DOI] [PubMed] [Google Scholar]
  34. Komarov PG, Komarova EA, Kondratov RV, Christov-Tselkov K, Coon JS, Chernov MV, Gudkov AV. A chemical inhibitor of p53 that protects mice from the side effects of cancer therapy. Science. 1999;285:1733–1737. doi: 10.1126/science.285.5434.1733. [DOI] [PubMed] [Google Scholar]
  35. Kondo S, Barna BP, Morimura T, Takeuchi J, Yuan J, Akbasak A, Barnett GH. Interleukin-1 beta-converting enzyme mediates cisplatin-induced apoptosis in malignant glioma cells. Cancer Research. 1995;55:6166–6171. [PubMed] [Google Scholar]
  36. Kurokawa M, Kornbluth S. Caspases and kinases in a death grip. Cell. 2009;138:838–854. doi: 10.1016/j.cell.2009.08.021. [DOI] [PMC free article] [PubMed] [Google Scholar]
  37. Lake CM, Holsclaw JK, Bellendir SP, Sekelsky J, Hawley RS. The development of a monoclonal antibody recognizing the Drosophila melanogaster phosphorylated histone H2A variant (γ-H2AV) G3: Genes, Genomes, Genetics. 2013;3:1539–1543. doi: 10.1534/g3.113.006833. [DOI] [PMC free article] [PubMed] [Google Scholar]
  38. Lee MH, Na H, Kim EJ, Lee HW, Lee MO. Poly(ADP-ribosyl)ation of p53 induces gene-specific transcriptional repression of MTA1. Oncogene. 2012;31:5099–5107. doi: 10.1038/onc.2012.2. [DOI] [PubMed] [Google Scholar]
  39. Leker RR, Aharonowiz M, Greig NH, Ovadia H. The role of p53-induced apoptosis in cerebral ischemia: effects of the p53 inhibitor pifithrin alpha. Experimental Neurology. 2004;187:478–486. doi: 10.1016/j.expneurol.2004.01.030. [DOI] [PubMed] [Google Scholar]
  40. Li M, Luo J, Brooks CL, Gu W. Acetylation of p53 inhibits its ubiquitination by Mdm2. The Journal of Biological Chemistry. 2002;277:50607–50611. doi: 10.1074/jbc.C200578200. [DOI] [PubMed] [Google Scholar]
  41. Li HQ, Feng ZQ, Wu WZ, Li J, Zhang JQ, Xia TY. SIRT3 regulates cell proliferation and apoptosis related to energy metabolism in non-small cell lung cancer cells through deacetylation of NMNAT2. International Journal of Oncology. 2013;43:1420–1430. doi: 10.3892/ijo.2013.2103. [DOI] [PMC free article] [PubMed] [Google Scholar] [Retracted]
  42. Lucena-Cacace A, Otero-Albiol D, Jiménez-García MP, Muñoz-Galvan S, Carnero A. NAMPT Is a Potent Oncogene in Colon Cancer Progression that Modulates Cancer Stem Cell Properties and Resistance to Therapy through Sirt1 and PARP. Clinical Cancer Research. 2018;24:1202–1215. doi: 10.1158/1078-0432.CCR-17-2575. [DOI] [PubMed] [Google Scholar]
  43. Luo J, Su F, Chen D, Shiloh A, Gu W. Deacetylation of p53 modulates its effect on cell growth and apoptosis. Nature. 2000;408:377–381. doi: 10.1038/35042612. [DOI] [PubMed] [Google Scholar]
  44. Malanga M, Pleschke JM, Kleczkowska HE, Althaus FR. Poly(ADP-ribose) binds to specific domains of p53 and alters its DNA binding functions. The Journal of Biological Chemistry. 1998;273:11839–11843. doi: 10.1074/jbc.273.19.11839. [DOI] [PubMed] [Google Scholar]
  45. Molenaar RJ, Radivoyevitch T, Maciejewski JP, van Noorden CJF, Bleeker FE. The driver and passenger effects of isocitrate dehydrogenase 1 and 2 mutations in oncogenesis and survival prolongation. Biochimica et Biophysica Acta. 2014;1846:326–341. doi: 10.1016/j.bbcan.2014.05.004. [DOI] [PubMed] [Google Scholar]
  46. Morrison DK. MAP Kinase Pathways. Cold Spring Harbor Perspectives in Biology. 2012;4:a011254. doi: 10.1101/cshperspect.a011254. [DOI] [PMC free article] [PubMed] [Google Scholar]
  47. Murphy PJM, Galigniana MD, Morishima Y, Harrell JM, Kwok RPS, Ljungman M, Pratt WB. Pifithrin-alpha inhibits p53 signaling after interaction of the tumor suppressor protein with hsp90 and its nuclear translocation. The Journal of Biological Chemistry. 2004;279:30195–30201. doi: 10.1074/jbc.M403539200. [DOI] [PubMed] [Google Scholar]
  48. Norbury CJ, Zhivotovsky B. DNA damage-induced apoptosis. Oncogene. 2004;23:2797–2808. doi: 10.1038/sj.onc.1207532. [DOI] [PubMed] [Google Scholar]
  49. Ohanna M, Cerezo M, Nottet N, Bille K, Didier R, Beranger G, Mograbi B, Rocchi S, Yvan-Charvet L, Ballotti R, Bertolotto C. Pivotal role of NAMPT in the switch of melanoma cells toward an invasive and drug-resistant phenotype. Genes & Development. 2018;32:448–461. doi: 10.1101/gad.305854.117. [DOI] [PMC free article] [PubMed] [Google Scholar]
  50. Pan LZ, Ahn DG, Sharif T, Clements D, Gujar SA, Lee PWK. The NAD+ synthesizing enzyme nicotinamide mononucleotide adenylyltransferase 2 (NMNAT-2) is a p53 downstream target. Cell Cycle. 2014;13:1041–1048. doi: 10.4161/cc.28128. [DOI] [PMC free article] [PubMed] [Google Scholar]
  51. Patel A, Burton DGA, Halvorsen K, Balkan W, Reiner T, Perez-Stable C, Cohen A, Munoz A, Giribaldi MG, Singh S, Robbins DJ, Nguyen DM, Rai P. MutT Homolog 1 (MTH1) maintains multiple KRAS-driven pro-malignant pathways. Oncogene. 2015;34:2586–2596. doi: 10.1038/onc.2014.195. [DOI] [PMC free article] [PubMed] [Google Scholar]
  52. Porter AG, Jänicke RU. Emerging roles of caspase-3 in apoptosis. Cell Death and Differentiation. 1999;6:99–104. doi: 10.1038/sj.cdd.4400476. [DOI] [PubMed] [Google Scholar]
  53. Prokhorova EA, Kopeina GS, Lavrik IN, Zhivotovsky B. Apoptosis regulation by subcellular relocation of caspases. Scientific Reports. 2018;8:12199. doi: 10.1038/s41598-018-30652-x. [DOI] [PMC free article] [PubMed] [Google Scholar]
  54. Pylaeva E, Harati MD, Spyra I, Bordbari S, Strachan S, Thakur BK, Höing B, Franklin C, Skokowa J, Welte K, Schadendorf D, Bankfalvi A, Brandau S, Lang S, Jablonska J. NAMPT signaling is critical for the proangiogenic activity of tumor-associated neutrophils. International Journal of Cancer. 2019;144:136–149. doi: 10.1002/ijc.31808. [DOI] [PubMed] [Google Scholar]
  55. Qi L, Yu H-Q, Zhang Y, Ding L-J, Zhao D-H, Lv P, Wang W-Y, Xu Y. A Comprehensive Meta-analysis of Genetic Associations Between Key Polymorphic Loci in DNA Repair Genes and Glioma Risk. Molecular Neurobiology. 2017;54:1314–1325. doi: 10.1007/s12035-016-9725-5. [DOI] [PubMed] [Google Scholar]
  56. Qi J, Cui C, Deng Q, Wang L, Chen R, Zhai D, Xie L, Yu J. Downregulated SIRT6 and upregulated NMNAT2 are associated with the presence, depth and stage of colorectal cancer. Oncology Letters. 2018;16:5829–5837. doi: 10.3892/ol.2018.9400. [DOI] [PMC free article] [PubMed] [Google Scholar]
  57. Rai P, Onder TT, Young JJ, McFaline JL, Pang B, Dedon PC, Weinberg RA. Continuous elimination of oxidized nucleotides is necessary to prevent rapid onset of cellular senescence. PNAS. 2009;106:169–174. doi: 10.1073/pnas.0809834106. [DOI] [PMC free article] [PubMed] [Google Scholar]
  58. Rajasekhar VK, Viale A, Socci ND, Wiedmann M, Hu X, Holland EC. Oncogenic Ras and Akt signaling contribute to glioblastoma formation by differential recruitment of existing mRNAs to polysomes. Molecular Cell. 2003;12:889–901. doi: 10.1016/s1097-2765(03)00395-2. [DOI] [PubMed] [Google Scholar]
  59. Read R, Cavenee WK, Furnari FB, Thomas JB, Rulifson E. A Drosophila Model for EGFR-Ras and PI3K-Dependent Human Glioma. PLOS Genetics. 2009;5:e1000374. doi: 10.1371/journal.pgen.1000374. [DOI] [PMC free article] [PubMed] [Google Scholar]
  60. Read R. D. Drosophila melanogaster as a model system for human brain cancers. Glia. 2011;59:1364–1376. doi: 10.1002/glia.21148. [DOI] [PMC free article] [PubMed] [Google Scholar]
  61. Reddy PS, Umesh S, Thota B, Tandon A, Pandey P, Hegde AS, Balasubramaniam A, Chandramouli BA, Santosh V, Rao MRS, Kondaiah P, Somasundaram K. PBEF1/NAmPRTase/Visfatin: a potential malignant astrocytoma/glioblastoma serum marker with prognostic value. Cancer Biology & Therapy. 2008;7:663–668. doi: 10.4161/cbt.7.5.5663. [DOI] [PubMed] [Google Scholar]
  62. Roos WP, Kaina B. DNA damage-induced cell death: from specific DNA lesions to the DNA damage response and apoptosis. Cancer Letters. 2013;332:237–248. doi: 10.1016/j.canlet.2012.01.007. [DOI] [PubMed] [Google Scholar]
  63. Ruan K, Zhu Y, Li C, Brazill JM, Zhai RG. Alternative splicing of Drosophila Nmnat functions as a switch to enhance neuroprotection under stress. Nature Communications. 2015;6:10057. doi: 10.1038/ncomms10057. [DOI] [PMC free article] [PubMed] [Google Scholar]
  64. Ryu KW, Nandu T, Kim J, Challa S, DeBerardinis RJ, Kraus WL. Metabolic regulation of transcription through compartmentalized NAD + biosynthesis. Science. 2018;360:eaan5780. doi: 10.1126/science.aan5780. [DOI] [PMC free article] [PubMed] [Google Scholar]
  65. Sampath D, Zabka TS, Misner DL, O’Brien T, Dragovich PS. Inhibition of nicotinamide phosphoribosyltransferase (NAMPT) as a therapeutic strategy in cancer. Pharmacology & Therapeutics. 2015;151:16–31. doi: 10.1016/j.pharmthera.2015.02.004. [DOI] [PubMed] [Google Scholar]
  66. Shi Y. A structural view of mitochondria-mediated apoptosis. Nature Structural Biology. 2001;8:394–401. doi: 10.1038/87548. [DOI] [PubMed] [Google Scholar]
  67. Shi X, Jiang Y, Kitano A, Hu T, Murdaugh RL, Li Y, Hoegenauer KA, Chen R, Takahashi K, Nakada D. Nuclear NAD + homeostasis governed by NMNAT1 prevents apoptosis of acute myeloid leukemia stem cells. Science Advances. 2021;7:30. doi: 10.1126/sciadv.abf3895. [DOI] [PMC free article] [PubMed] [Google Scholar]
  68. Simanshu DK, Nissley DV, McCormick F. RAS Proteins and Their Regulators in Human Disease. Cell. 2017;170:17–33. doi: 10.1016/j.cell.2017.06.009. [DOI] [PMC free article] [PubMed] [Google Scholar]
  69. Simbulan-Rosenthal CM, Rosenthal DS, Luo R, Smulson ME. Poly(ADP-ribosyl)ation of p53 during apoptosis in human osteosarcoma cells. Cancer Research. 1999;59:2190–2194. [PubMed] [Google Scholar]
  70. Simbulan-Rosenthal CM, Rosenthal DS, Luo RB, Samara R, Jung M, Dritschilo A, Spoonde A, Smulson ME. Poly(ADP-ribosyl)ation of p53 in vitro and in vivo modulates binding to its DNA consensus sequence. Neoplasia. 2001;3:179–188. doi: 10.1038/sj.neo.7900155. [DOI] [PMC free article] [PubMed] [Google Scholar]
  71. Song TJ, Yang L, Kabra N, Chen LH, Koomen J, Haura EB, Chen JD. The NAD+ synthesis enzyme nicotinamide mononucleotide adenylyltransferase (NMNAT1) regulates ribosomal RNA transcription. The Journal of Biological Chemistry. 2013;288:20908–20917. doi: 10.1074/jbc.M113.470302. [DOI] [PMC free article] [PubMed] [Google Scholar]
  72. Tateishi K, Wakimoto H, Iafrate AJ, Tanaka S, Loebel F, Lelic N, Wiederschain D, Bedel O, Deng G, Zhang B, He T, Shi X, Gerszten RE, Zhang Y, Yeh J-RJ, Curry WT, Zhao D, Sundaram S, Nigim F, Koerner MVA, Ho Q, Fisher DE, Roider EM, Kemeny LV, Samuels Y, Flaherty KT, Batchelor TT, Chi AS, Cahill DP. Extreme Vulnerability of IDH1 Mutant Cancers to NAD+ Depletion. Cancer Cell. 2015;28:773–784. doi: 10.1016/j.ccell.2015.11.006. [DOI] [PMC free article] [PubMed] [Google Scholar]
  73. Timofeev O, Klimovich B, Schneikert J, Wanzel M, Pavlakis E, Noll J, Mutlu S, Elmshäuser S, Nist A, Mernberger M, Lamp B, Wenig U, Brobeil A, Gattenlöhner S, Köhler K, Stiewe T. Residual apoptotic activity of a tumorigenic p53 mutant improves cancer therapy responses. The EMBO Journal. 2019;38:e102096. doi: 10.15252/embj.2019102096. [DOI] [PMC free article] [PubMed] [Google Scholar]
  74. Tso C-L, Shintaku P, Chen J, Liu Q, Liu J, Chen Z, Yoshimoto K, Mischel PS, Cloughesy TF, Liau LM, Nelson SF. Primary glioblastomas express mesenchymal stem-like properties. Molecular Cancer Research. 2006;4:607–619. doi: 10.1158/1541-7786.MCR-06-0005. [DOI] [PubMed] [Google Scholar]
  75. Uhlén M, Fagerberg L, Hallström BM, Lindskog C, Oksvold P, Mardinoglu A, Sivertsson Å, Kampf C, Sjöstedt E, Asplund A, Olsson I, Edlund K, Lundberg E, Navani S, Szigyarto CA-K, Odeberg J, Djureinovic D, Takanen JO, Hober S, Alm T, Edqvist P-H, Berling H, Tegel H, Mulder J, Rockberg J, Nilsson P, Schwenk JM, Hamsten M, von Feilitzen K, Forsberg M, Persson L, Johansson F, Zwahlen M, von Heijne G, Nielsen J, Pontén F. Proteomics. Tissue-based map of the human proteome. Science. 2015;347:1260419. doi: 10.1126/science.1260419. [DOI] [PubMed] [Google Scholar]
  76. Uhlen M, Zhang C, Lee S, Sjöstedt E, Fagerberg L, Bidkhori G, Benfeitas R, Arif M, Liu Z, Edfors F, Sanli K, von Feilitzen K, Oksvold P, Lundberg E, Hober S, Nilsson P, Mattsson J, Schwenk JM, Brunnström H, Glimelius B, Sjöblom T, Edqvist P-H, Djureinovic D, Micke P, Lindskog C, Mardinoglu A, Ponten F. A pathology atlas of the human cancer transcriptome. Science. 2017;357:660. doi: 10.1126/science.aan2507. [DOI] [PubMed] [Google Scholar]
  77. van Meerloo J, Kaspers GJL, Cloos J. Cell sensitivity assays: the MTT assay. Methods in Molecular Biology. 2011;731:237–245. doi: 10.1007/978-1-61779-080-5_20. [DOI] [PubMed] [Google Scholar]
  78. Van Meir EG, Kikuchi T, Tada M, Li H, Diserens AC, Wojcik BE, Huang HJ, Friedmann T, de Tribolet N, Cavenee WK. Analysis of the p53 gene and its expression in human glioblastoma cells. Cancer Research. 1994;54:649–652. [PubMed] [Google Scholar]
  79. Vaziri H, Dessain SK, Ng Eaton E, Imai SI, Frye RA, Pandita TK, Guarente L, Weinberg RA. hSIR2(SIRT1) functions as an NAD-dependent p53 deacetylase. Cell. 2001;107:149–159. doi: 10.1016/s0092-8674(01)00527-x. [DOI] [PubMed] [Google Scholar]
  80. Wesseling P, Capper D. WHO 2016 Classification of gliomas. Neuropathology and Applied Neurobiology. 2018;44:139–150. doi: 10.1111/nan.12432. [DOI] [PubMed] [Google Scholar]
  81. Wu M, Pastor-Pareja JC, Xu T. Interaction between Ras(V12) and scribbled clones induces tumour growth and invasion. Nature. 2010;463:545–548. doi: 10.1038/nature08702. [DOI] [PMC free article] [PubMed] [Google Scholar]
  82. Yamamoto S, Iwakuma T. Regulators of Oncogenic Mutant TP53 Gain of Function. Cancers. 2018;11:E4. doi: 10.3390/cancers11010004. [DOI] [PMC free article] [PubMed] [Google Scholar]
  83. Yan H, Parsons DW, Jin G, McLendon R, Rasheed BA, Yuan W, Kos I, Batinic-Haberle I, Jones S, Riggins GJ, Friedman H, Friedman A, Reardon D, Herndon J, Kinzler KW, Velculescu VE, Vogelstein B, Bigner DD. IDH1 and IDH2 mutations in gliomas. The New England Journal of Medicine. 2009;360:765–773. doi: 10.1056/NEJMoa0808710. [DOI] [PMC free article] [PubMed] [Google Scholar]
  84. Yi YW, Kang HJ, Kim HJ, Kong Y, Brown ML, Bae I. Targeting mutant p53 by a SIRT1 activator YK-3-237 inhibits the proliferation of triple-negative breast cancer cells. Oncotarget. 2013;4:984–994. doi: 10.18632/oncotarget.1070. [DOI] [PMC free article] [PubMed] [Google Scholar]
  85. Zhai RG, Cao Y, Hiesinger PR, Zhou Y, Mehta SQ, Schulze KL, Verstreken P, Bellen HJ. Drosophila NMNAT maintains neural integrity independent of its NAD synthesis activity. PLOS Biology. 2006;4:e416. doi: 10.1371/journal.pbio.0040416. [DOI] [PMC free article] [PubMed] [Google Scholar]
  86. Zhang T, Berrocal JG, Frizzell KM, Gamble MJ, DuMond ME, Krishnakumar R, Yang T, Sauve AA, Kraus WL. Enzymes in the NAD+ salvage pathway regulate SIRT1 activity at target gene promoters. The Journal of Biological Chemistry. 2009;284:20408–20417. doi: 10.1074/jbc.M109.016469. [DOI] [PMC free article] [PubMed] [Google Scholar]
  87. Zhang T, Berrocal JG, Yao J, DuMond ME, Krishnakumar R, Ruhl DD, Ryu KW, Gamble MJ, Kraus WL. Regulation of poly(ADP-ribose) polymerase-1-dependent gene expression through promoter-directed recruitment of a nuclear NAD+ synthase. The Journal of Biological Chemistry. 2012;287:12405–12416. doi: 10.1074/jbc.M111.304469. [DOI] [PMC free article] [PubMed] [Google Scholar]
  88. Zhu Y, Liu J, Park J, Rai P, Zhai RG. Subcellular compartmentalization of NAD+ and its role in cancer: A sereNADe of metabolic melodies. Pharmacology & Therapeutics. 2019;200:27–41. doi: 10.1016/j.pharmthera.2019.04.002. [DOI] [PMC free article] [PubMed] [Google Scholar]

Editor's evaluation

Patrik Verstreken 1

The authors found that NMNAT binds to p53 and that p53 is post-translationally regulated to control apoptosis in glioma models. Work found that depletion of NMNAT1 and NMNAT2 inhibits and that overexpression of the enzymes promotes glioma growth. Furthermore, depletion of NMNAT1/2 increases apoptosis and overexpression of the enzymes inhibits apoptosis upon cisplatin treatment. This is an exciting mechanism that extends NAD biology, p53 regulation, and the field of glioma pathogenesis.

Decision letter

Editor: Patrik Verstreken1
Reviewed by: Yun Fan2

In the interests of transparency, eLife publishes the most substantive revision requests and the accompanying author responses.

[Editors’ note: the authors submitted for reconsideration following the decision after peer review. What follows is the decision letter after the first round of review.]

Thank you for submitting your work entitled "NMNAT promotes glioma growth through enhancing poly(ADP-ribosyl)ation of p53 to inhibit apoptosis" for consideration by eLife. Your article has been reviewed by 3 peer reviewers, and the evaluation has been overseen by a Reviewing Editor and a Senior Editor. The following individual involved in review of your submission has agreed to reveal their identity: Yun Fan (Reviewer #2).

Our decision has been reached after consultation between the reviewers. Based on these discussions and the individual reviews below, we regret to inform you that your work in its current form will not be considered for publication in eLife. However, the reviewers did find the work interesting and raised a number of substantial issues that I have summarised below. If you are able to address the issues in full, we would be happy to consider a much revised version of your paper as a new submission.

Summary:

This paper by the Zhai lab shows that NMNAT is necessary and sufficient for glioma growth in an in vivo fly model and in an in vitro cell culture model. The most exciting aspect of this work is the mechanistic insight showing that NMNAT is responsible for the parylation and acetylation of the tumor suppressor p53. The paper concludes that this action of NMNAT inhibits p53/caspase-mediated apoptosis and thus promotes glioma growth. This is new and of interest, but at the moment also too preliminary. The reviewers recommend a number of essential experiments. The full reviews are also included below and we welcome any additional (non-essential) work you believe you can add as well as textual and figure changes in response to their questions:

Essential issues:

1) Increase the quality of the parylation and acetylation blots by 'cleaning up' the bots, quantifying them and showing specificity:

The most mechanistic and exciting finding in this manuscript is the demonstration that overexpression of NMNAT led to increased parylation and decreased acetylation of p53. Both of these manipulations would inhibit p53-induced apoptosis. This is the most important result in the paper, but unfortunately the data are not convincing. There is no quantification of this effect. Worse yet, a single lane of each is shown, and is not even obvious by eye. First, the band that is claimed to be PAR-p53 is faint and is near the huge IgG band (get some beads with antibody covalently attached so you don't have this band). Second, this blot is full of bands-what is the proof that this band is PAR-p53? Finally, once the band is validated, then it must be repeated multiple times and quantified. The acetyl-p53 blot is also unconvincing. There are many bands, with no validation that the band labeled as acetyl-p53 is actually acetyl-p53. Again, a single blot is shown, and nothing is quantified. Indeed, even by eye it is not clear that NMNAT1 has any effect.

2) The biochemistry should also be done under conditions of NMNAT loss of function (in Figure 7):

There is a second issue with figure 7. Unlike the other studies in the manuscript, these experiments are only done with overexpression. The authors should test knockdown of the NMNATs in these paradigms. Since they have demonstrated that knockdown and overexpression of NMNATs have opposite effects on glioma cell growth, then if this is the mechanism, they should also have opposite effects on p53 posttranslational modifications. Of course, all of these experiments will require quantification.

3) To provide more direct evidence for the role of p53 and caspases in glioma development in Drosophila; both issues can be tested using Drosophila genetics:

a) Does apoptosis play a critical role to restrict RasV12-induced glioma development in Drosophila? Notably, the cleaved Caspase-3 antibody indicates the activity of Dronc, the initiator caspase in Drosophila, which has non-apoptotic functions. Also, a recent paper actually suggests that expression of RasV12 blocks activation of apoptosis in epithelial tissues (Perez et al., eLife 2017, 6: e26747). It is therefore important to show whether blocking apoptosis or caspase activity enhances glioma progression.

b) Test if is p53 required for activation of caspases in RasV12-induced glioma and in response to loss-of-NMNAT (Figure 4B)?

4) Properly discuss the limitations of the fly model (as indicated by the third reviewer), both the use of a Ras model in flies that is a model of only 2% of glioma and second to use the term glial neoplasia instead of glioma (or use glioma model).

5) Look in to TCGA or other databases (Human Protein Atlas, Ivy Foundation Atlas, Gliovis, etc) to check if NMNAT is upregulated in human tumors.

Reviewer #1:

This study investigates the role of the NAD biosynthetic enzyme NMNAT in glioma growth. While prior studies have highlighted the important role of the NAD biosynthetic pathway in glioma, this is the first to investigate NMNAT. Using both an in vivo fly model and in vitro cell culture model, the authors find that knockdown of NMNAT inhibits and overexpression of NMNAT promotes glioma growth. Since a role for NAD synthesis is expected, this is not a surprising finding. Indeed, I raise a number of issues below about the specificity of the findings. However, the authors go on to do a potentially interesting mechanistic analysis, claiming that NMNAT overexpression regulates the parylation and acetylation of p53. If these findings are validated (see #4 and #5 below), I think this will be an important and exciting contribution to the field.

1) In figure 2A the authors claim that the "increase in NMNAT" is required for glioma growth, but their experiment is to knockdown NMNAT. They don't make clear if this is back to wild type levels, or well below wild type levels. If well below, then they cannot conclude that it is the "increase" of NMNAT that matters-instead it just might be that you need NMNAT for a glioma to grow. Testing if a NMNAT heterozygote suppresses could test their hypotheses better, or carefully quantifying the effect of knockdown compared to wild types could also help.

2) More broadly, it is not surprising that you need NMNAT for glioma growth as you likely need many essential metabolic enzymes for fast growing cells to grow. It would be helpful to test the specificity of these findings. This should be done in two ways. First, is NMNAT necessary for healthy cells to grow. This could be checked by using the same RNAi in clones in imaginal discs-is growth inhibited? The second question to address is whether there is anything selective about NMNAT loss. Do other genes in the NAD biosynthetic pathway also block glioma growth?

3) Figure 3 addresses the same issue of NMNAT dependence in a human glioma cell line model. Specificity issues again apply. Why does knockdown of either of two NMNAT genes give the same strong phenotype? The authors make a big point about compartmentalization of NAD biosynthesis, and yet here they get the same phenotype from the nuclear and cytoplasmic variants of NMNAT. What are the effects of each of these manipulations on the level of NAD? Does an equivalent drop in NAD induced by inhibiting the pathway via other means (using Nampt inhibitors) give the same phenotype?

4) The most mechanistic and exciting finding in this manuscript is the demonstration that overexpression of NMNAT led to increased parylation and decreased acetylation of p53. Both of these manipulations would inhibit p53-induced apoptosis. This is the most important result in the paper, but unfortunately the data are not convincing. There is no quantification of this effect. Worse yet, a single lane of each is shown, and is not even obvious by eye. First, the band that is claimed to be PAR-p53 is faint and is near the huge IgG band (get some beads with antibody covalently attached so you don't have this band). Second, this blot is full of bands-what is the proof that this band is PAR-p53? Finally, once the band is validated, then it must be repeated multiple times and quantified. The acetyl-p53 blot is also unconvincing. There are many bands, with no validation that the band labeled as acetyl-p53 is actually acetyl-p53. Again, a single blot is shown, and nothing is quantified. Indeed, even by eye it is not clear that NMNAT1 has any effect.

5) There is a second issue with figure 7. Unlike the other studies in the manuscript, these experiments are only done with overexpression. The authors should test knockdown of the NMNATs in these paradigms. Since they have demonstrated that knockdown and overexpression of NMNATs have opposite effects on glioma cell growth, then if this is the mechanism, they should also have opposite effects on p53 posttranslational modifications. Of course, all of these experiments will require quantification.

Reviewer #2:

This manuscript addressed an important knowledge gap in the field – roles of the Nicotinamide mononucleotide adenylyltransferase (NMNAT) in promoting glioma progression, by using both Drosophila in vivo models and cultured human glioma cells.

The authors first determined that NMNAT is upregulated in glioma induced by activated Ras (RasV12) in Drosophila. Further loss- and gain-of-function analyses showed that NMNAT, particularly its nuclear isoform, inhibits nuclear expression of Caspases, the proteases activating apoptosis, and p53, the key mediator of DNA damage responses, therefore promotes glioma development. From these, the authors conclude that NMNAT accelerates glioma progression by inhibiting p53/caspase-mediated apoptosis. Importantly, although not exactly same in my view, similar principles underlying functions of NMNAT apply to human glioma cells. The authors convincingly showed that, in these cells, NMNAT suppresses the nuclear enrichment of Caspase-3 and activation of apoptosis. Interestingly, NMNAT regulates activity of p53 via posttranslational modifications including PARylation and acetylation, but not the total level of p53. Overall, these findings are novel and are of interest to the broad readership of eLife.

However, direct evidence showing roles of p53 and caspases in glioma development in Drosophila is missing in the manuscript. To my knowledge, these have not been characterized in the field hence are critical to support the conclusions made.

Along this line, my concerns are as follows:

1) Does apoptosis play a critical role to restrict RasV12-induced glioma development in Drosophila? Notably, the cleaved Caspase-3 antibody indicates the activity of Dronc, the initiator caspase in Drosophila, which has non-apoptotic functions. Also, a recent paper actually suggests that expression of RasV12 blocks activation of apoptosis in epithelial tissues (Perez et al., eLife 2017, 6: e26747). It is therefore important to show whether blocking apoptosis or caspase activity enhances glioma progression.

2) Is p53 required for activation of caspases in RasV12-induced glioma and in response to loss-of-NMNAT (Figure 4B)?

Reviewer #3:

NMNAT promotes glioma growth through enhancing poly(ADP-ribosyl)ation of p53 to inhibit apoptosis – Paper Review Using a Drosophila glioma model and follow-up studies in human glioma cell lines, Liu et al. uncovered the requirement of NMNAT in glioma progression.

One concern is the genetics of the model system chosen. This manuscript focuses on Ras using a Drosophila model. However, mutations in Ras proteins, such as HRAS, are limited in human glioma tumors. In omic studies such as TCGA, there are very few genomic alterations in human glioma (2% or less in HRAS, KRAS, and NRAS). This is likely because driver alterations affecting the RAS pathway lie upstream of RAS itself, and this is different than other solid tumors, as the authors cite in the manuscript. This significantly limits the scope and impact of the findings and should be addressed in some way.

Another concern is the authors use of glioma nomenclature. Drosophila models do not get true "gliomas" as defined by neuropathological criteria for humans and other animals, so the language in the paper describing their glioma model should change to "neoplastic glia," "glial neoplasia" or add the qualifier "model" in their sentences to better distinguish between human and fly biology for this disease. Flies can only model certain aspects of gliomas, such as the genetic basis of neoplastic glial transformation.

Is NMNAT upregulated in tumor specimens from human glioma patients? The authors could query TCGA or other databases (Human Protein Atlas, Ivy Foundation Atlas, Gliovis, etc) to compare the expression levels of NMNAT mRNA and protein between gliomas of different grade and between gliomas with and without mutations in Ras pathway components. These databases are publicly available and this analysis could be done without any benchwork. Or, if they are able to do benchwork, they could compare protein levels in normal human neural stem cells or astrocytes vs glioma cell lines.

This study may benefit from additional studies on DNA damage such as a comet assay or even looking at whether there are cell cycle changes as a result of modified p53 function.

Figure 2E – Manuscript states that Nmnat-PC increased lethality, but the graph is for survival at different life stages. This is confusing, particularly because some of the samples exceed 100% with the way the error bars are presented. This graph should be reformatted to show % lethal broken down by lethal stage.

Figure 3 – Colony formation assays are not sufficient to demonstrate growth defects in the glioma cells. Additional independent methods that support these results should be shown. FACS profiling would be appropriate. Also, at least one other glioma cell line that is Ras-dependent should be tested and results from those cells should be shown as well. Why were T98G cells chosen? What is the rationale for using those cells? Were there any other cells tested that yielded negative results? If so, results from those cells may be informative if they are P53 null (many glioma cell lines are P53 null).

Figure 5B – this is an unusual way to quantify cell death in glioma cells. A more representative way would be to quantify the percentage of caspase-positive cells rather than the intensity of caspase staining per cell, which is a much more transient and variable thing. Perhaps the authors already have this data and can change the parameters of their data analysis?

Figure 7A – I would argue only NMNAT2 overexpression is the only condition that increases p53 PARylation. Band intensity could be quantified to better support the author's conclusions.

Figure S1: There is no criteria set forth to define pre-tumor vs. glioma areas. Are there molecular markers for these regions? Are those markers conserved between human and flies? The presence of excess cells in some regions of the brain is not really sufficient to distinguish between pre-neoplastic and neoplastic cells in the fly brain.

[Editors’ note: the authors submitted for reconsideration following the decision after peer review. What follows is the decision letter after the second round of review.]

Thank you for resubmitting the paper entitled "NMNAT promotes glioma growth through regulating post-translational modifications of p53 to inhibit apoptosis" for further consideration by eLife. Your revised article has been evaluated by a Senior Editor and a Reviewing Editor. We are sorry to say that we have decided that this submission will not be considered further for publication by eLife.

The revised paper has been seen by a reviewer who can judge the Drosophila work in your manuscript and by a reviewer who can judge the p53 biology. In the discussion among the reviewers there were serious concerns regarding tools and conclusions that pertain to the p53 biology that you present to the point that the reviewers recommended to not move forward with the manuscript. More specifically, the last section of reviewer 2's main comments that the p53 in glioma cell lines that you used differ in their p53 status (based on published literature, we couldn't find that you checked this yourself), but show a similar phenotype, and that this is not compatible with the model you suggest was a the reason for rejection. I realise this is a revised version and I am very sorry to have to bring this news to you.

Reviewer #1:

The authors have worked very hard to address all of my concerns and those of the other reviewers. The manuscript is much improved and much more convincing.

I am satisfied with the changes made in this revised version.

Reviewer #2:

Liu et al. investigate the role of the NAD+ synthases NMNAT1 and NMNAT2 in glioma survival to test whether these enzymes are promising targets for therapeutic interventions. The authors employ a glial neoplasia developing Drosophila model and the two human glioma cell line models T98G and U87MG. Their data show that depletion of NMNAT1 and NMNAT2 inhibits and overexpression of the enzymes promotes glioma growth. Moreover, the authors show that depletion of NMNAT1/2 increased apoptosis while overexpression of the enzymes inhibited apoptosis upon cisplatin treatment. Mechanistically, the authors propose that NMNAT1/2 physically interact with p53 and PARP1 to drive PARylation and deacetylation of p53, ultimately leading to reduced p53 activity.

I find substantial parts of the underlying data not convincing (see below). I felt that the authors overinterpreted poor or insufficiently controlled data, jumped to conclusions from ambiguous results, and exaggerated several conclusions.

Together, I cannot recommend the manuscript for publication.

I am not fully convinced by the growth data presented by the authors. Publicly available data (www.DepMap.org) do not indicate that glioma cell lines are particularly sensitive to NMNAT1 or NMNAT2 depletion. Controls for si-mediated protein reduction in the cell lines are missing throughout and a second siControl could be helpful.

The PARylation data is not convincing. A methods part is missing that explains how PARylation was analyzed. Total PAR or PAR overlay assay? The latter would be crucial to claim p53 PARylation, the former is critical for statements on PARylation in general. The authors claim that NMNAT1/2 form a complex with p53 and PARP1 to facilitate PARylation, but it is unclear whether they refer to only p53 PARylation or also PARylation in general.

The authors draw conclusions on p53 activity from signals that are known to be regulated by various pathways (e.g. apoptosis). Instead, it would be crucial to test for the expression of p53 targets (e.g. MDM2, BBC3, GADD45A) to investigate p53 activity. Yet, given that the p53 status differs between T98G (mutant p53) and U87MG (wild-type p53) cells (van Meir et al., 1994 Cancer Res), the authors' growth data, which are similar for T98G and U87MG, demonstrate that the potential effect elicited by NMNAT1/2 is independent of. Moreover, all p53 interaction data shown using T98G data reflect mutant p53, which is known to have potentially different binding partners than wild-type p53. In general, the fact that T98G harbor mutant p53 turns most parts of the manuscript upside down that deal with mechanistics.

Figure 1: why is Nmnat not color-coded?

Figure 3G: The AnnexinV:PI gating is strange. For comparison see https://images.bio-rad-antibodies.com/kit/annexin-v-kit-antibody-kit-annex100-image2-600w.jpg.

Western blot signals are often saturated, which hinders proper readout.

Figures 5A, B, D, and F miss NMNAT1 and NMNAT2 as crucial controls.

Figures 5D and F: All lanes display cisplatin-treated samples? If so, controls without cisplatin treatment are missing.

Figure 8A and Figure 8—figure supplement 1: PARylation of what? Controls are missing.

Figure 8C: Specificity of the NMNAT2 antibody is not convincing.

Figure 9A: It is unclear why the authors IP p53 to blot acetyl-p53. Acetyl-p53 can be immunoblotted with whole cell lysates, as demonstrated by the authors (input lanes). Loading of IPs is more difficult to control, thus the signal from the input lanes are more important and actually do not show changes in acetyl-p53 upon NMNAT overexpression.

Figure 9C: What is quantified here? 9B apparently is based on the p53 IP lanes. But 9C appears to be based on the input lanes. Cherry picking?

Figure 3—figure supplement 3: NMNAT2 blot is out of focus.

Figure 5—figure supplement 2: reduction of cleaved cas3 upon NMNAT1 overexpression is not convincing. siNMNAT1/2 are missing. Immunoblots for NMNAT1/2 are missing.

Figure 9—figure supplement 1: What is shown in this Figure? Whole cell lysates or p53 IPs? Why do the authors use only lysate or IP here but both in Figure 9A? The reduction is not convincing. No cisplatin control is missing. siNMNAT1/2 are missing.

Immunoblots for NMNAT1/2 are missing.

[Editors’ note: further revisions were suggested prior to acceptance, as described below.]

Thank you for resubmitting your work entitled "NMNAT promotes glioma growth through regulating post-translational modifications of p53 to inhibit apoptosis" for further consideration by eLife. Your revised article has been evaluated by Jonathan Cooper (Senior Editor) and a Reviewing Editor.

There is consensus that the manuscript has been much improved but there are some remaining issues that need to be addressed, as outlined below:

We would like you to submit a final paper that includes:

1) Data indicating that NMNAT1/2 interacts with p53 also in the U87MG p53 wild-type line;

2) Data that tests if p53 depletion rescues the apoptosis-inducing effect of siNMNAT in both cell lines they use (T98G and U87MG);

3) Toning down claims on PARylation at different locations in the manuscript.

Reviewer #2:

The authors provided a revised version addressing most concerns that I raised. However, some key points in the authors' study still require supportive data.

– The NMNAT-PARP1-p53 interaction:

Previously, I raised the concern that protein interaction with mutant p53 not always translates into an interaction with wild-type p53. The present M237I mutant reportedly possesses neomorphic functions. Given that the NMNAT1/2-p53 interaction is an integral part of the model proposed by the authors, I would like to reiterate that I find it crucial to corroborate this interaction also in the p53 wild-type line U87MG.

– The NMNAT-p53-apoptosis mechanism:

Following my concern that much of the authors' data on p53 was generated using a mutant p53 cell line (T98G), the authors explain that they intentionally included both wild-type and mutant p53 cell systems and clarify their strategy to the reader in the revised version, such as by adding a respective sentence to the Discussion section "Our findings that NMNAT similarly affects p53 modification in either wild-type (U87MG) or mutant p53 (T98G) cells suggest NAD+-dependent PARylation or deacetylation of p53 is independent of the p53 [M237I] mutation. Indeed recent studies have shown that mutant p53 proteins retain the ability to induce apoptosis despite losing tumor-suppressive transactivation functionality (Timofeev et al., 2019)".

Notably, Timofeev et al., 2019 refers to the p53 mutant R181E (R178E in mice). p53 mutants are known to differ. The M237I mutant present in the authors' T98G cell line, for example, did not display residual apoptosis-driving function when it was tested in a different study (Boettcher et al., 2019 Science). Given that the authors propose reduced p53-dependent apoptosis to be a key mechanism by which NMNAT promotes glioma growth, it is crucial to show that there actually is p53-dependent apoptosis occurring in the authors' experimental setup, i.e. by adding data on sip53 in Figure 3G showing whether p53 depletion can indeed rescue the apoptosis-inducing effect of siNMNAT in both T98G and U87MG cells. Given the importance to the authors' mechanistic model and the different experimental setup, it is insufficient to only refer to the findings by Enns et al., 2004.

– The NMNAT-p53-PARylation mechanism:

The authors convincingly demonstrate that NMNAT1/2 affect total PAR levels in the cell (Figure 8A and B, Figure 8-supplement 1). Key points in the authors' model include (1) that PARylation of p53 is induced by NMNAT1/2 (abstract, headlines, Figure 10E) and (2) that complex formation with p53 is important for NMNAT1/2 to facilitate PARylation (abstract). Supportive data for these points, however, is missing.

1) I would like to reiterate that it is crucial to provide data on NMNAT-dependent p53 PARylation. I.e. by blotting for PAR in p53 IPs (Figure 8C or 9A), in both T98G and U87MG.

2) To support the authors' point that "NMNAT forms a complex with p53 and PTM enzyme PARP1 to facilitate PARylation" (abstract), it is crucial to show whether p53 indeed is required for NMNAT-dependent PARylation, i.e. whether p53 depletion affects NMNAT-dependent PARylation in both T98G and U87MG (Figures 8A and 8-supplement 1).

eLife. 2021 Dec 17;10:e70046. doi: 10.7554/eLife.70046.sa2

Author response


[Editors’ note: the authors resubmitted a revised version of the paper for consideration. What follows is the authors’ response to the first round of review.]

Essential issues:

1) Increase the quality of the parylation and acetylation blots by 'cleaning up' the bots, quantifying them and showing specificity:

The most mechanistic and exciting finding in this manuscript is the demonstration that overexpression of NMNAT led to increased parylation and decreased acetylation of p53. Both of these manipulations would inhibit p53-induced apoptosis. This is the most important result in the paper, but unfortunately the data are not convincing. There is no quantification of this effect. Worse yet, a single lane of each is shown, and is not even obvious by eye. First, the band that is claimed to be PAR-p53 is faint and is near the huge IgG band (get some beads with antibody covalently attached so you don't have this band). Second, this blot is full of bands-what is the proof that this band is PAR-p53? Finally, once the band is validated, then it must be repeated multiple times and quantified. The acetyl-p53 blot is also unconvincing. There are many bands, with no validation that the band labeled as acetyl-p53 is actually acetyl-p53. Again, a single blot is shown, and nothing is quantified. Indeed, even by eye it is not clear that NMNAT1 has any effect.

Measured PARylation level and quantified. (Fig. 8 A, B). Showed specific acetylated p53 blots and quantified. (Fig. 9 and Fig. 9_figure supplement 1).

2) The biochemistry should also be done under conditions of NMNAT loss of function (in Figure 7):

There is a second issue with figure 7. Unlike the other studies in the manuscript, these experiments are only done with overexpression. The authors should test knockdown of the NMNATs in these paradigms. Since they have demonstrated that knockdown and overexpression of NMNATs have opposite effects on glioma cell growth, then if this is the mechanism, they should also have opposite effects on p53 posttranslational modifications. Of course, all of these experiments will require quantification.

Measured PARylation after Knockdown of NMNAT1/2. (Fig. 8_figure supplement 1).

3) To provide more direct evidence for the role of p53 and caspases in glioma development in Drosophila; both issues can be tested using Drosophila genetics:

a) Does apoptosis play a critical role to restrict RasV12-induced glioma development in Drosophila? Notably, the cleaved Caspase-3 antibody indicates the activity of Dronc, the initiator caspase in Drosophila, which has non-apoptotic functions. Also, a recent paper actually suggests that expression of RasV12 blocks activation of apoptosis in epithelial tissues (Perez et al., eLife 2017, 6: e26747). It is therefore important to show whether blocking apoptosis or caspase activity enhances glioma progression.

Examined the functional effects of Caspase on Rasv12 induced glioma. (Fig. 4_figure supplement 1). Inhibited caspase pathway genetically in Rasv12 overexpressing fly and determined the consequence by glial neoplasia volume.

b) Test if is p53 required for activation of caspases in RasV12-induced glioma and in response to loss-of-NMNAT (Figure 4B)?

Examined the effects of p53 on Rasv12 induced glioma. (Fig. 7) p53 inhibitor feeding in Rasv12 overexpressing fly, and determined the consequence by glial neoplasia volume, survival and cleaved caspase activity.

4) Properly discuss the limitations of the fly model (as indicated by the third reviewer), both the use of a Ras model in flies that is a model of only 2% of glioma and second to use the term glial neoplasia instead of glioma (or use glioma model).

1. Added in the discussion part.

2. Used the correct nomenclature of “glial neoplasia” instead of “glioma” in the text.

5) Look in to TCGA or other databases (Human Protein Atlas, Ivy Foundation Atlas, Gliovis, etc) to check if NMNAT is upregulated in human tumors.

Added figure supplement. (Fig. 10_figure supplement 1-2)

Reviewer #1:

This study investigates the role of the NAD biosynthetic enzyme NMNAT in glioma growth. While prior studies have highlighted the important role of the NAD biosynthetic pathway in glioma, this is the first to investigate NMNAT. Using both an in vivo fly model and in vitro cell culture model, the authors find that knockdown of NMNAT inhibits and overexpression of NMNAT promotes glioma growth. Since a role for NAD synthesis is expected, this is not a surprising finding. Indeed, I raise a number of issues below about the specificity of the findings. However, the authors go on to do a potentially interesting mechanistic analysis, claiming that NMNAT overexpression regulates the parylation and acetylation of p53. If these findings are validated (see #4 and #5 below), I think this will be an important and exciting contribution to the field.

We thank the reviewer for recognizing the significance of our findings. In this revised version, we have comprehensively characterized the cellular and biochemical mechanisms underlying the effects of NMNAT on promoting glioma growth in both fly model and human glioma cell model. Specifically, we identified the role of NMNAT in regulating the NAD+-dependent post-translational modifications of p53: PARylation and deacetylation.

1) In figure 2A the authors claim that the "increase in NMNAT" is required for glioma growth, but their experiment is to knockdown NMNAT. They don't make clear if this is back to wild type levels, or well below wild type levels. If well below, then they cannot conclude that it is the "increase" of NMNAT that matters-instead it just might be that you need NMNAT for a glioma to grow. Testing if a NMNAT heterozygote suppresses could test their hypotheses better, or carefully quantifying the effect of knockdown compared to wild types could also help.

We would like to clarify that our data support the conclusion that “NMNAT is required for glioma growth”. This is supported by both loss of function (knockdown) and gain of function (overexpression) experiments.

In the knockdown experiment, we carefully analyzed the knockdown level following the reviewer’s suggestion and found that the level of NMNAT in flies with Rasv12 overexpression and NMNAT RNAi is lower than that of wild-type flies (Figure 2_figure supplement 3).

In the revised manuscript, we clarified the conclusion to avoid confusion. The new version reads; on page 7, “These results suggest that nuclear enzymatically active NMNAT promoted glial neoplasia growth.”

2) More broadly, it is not surprising that you need NMNAT for glioma growth as you likely need many essential metabolic enzymes for fast growing cells to grow. It would be helpful to test the specificity of these findings. This should be done in two ways. First, is NMNAT necessary for healthy cells to grow. This could be checked by using the same RNAi in clones in imaginal discs-is growth inhibited? The second question to address is whether there is anything selective about NMNAT loss. Do other genes in the NAD biosynthetic pathway also block glioma growth?

We thank the reviewer for bringing up this important point. Indeed, it is expected that metabolic enzymes are essential for cell growth, especially fast-growing cancer cells. However, identifying the molecular mechanism of the requirement is critical for targeted anti-cancer therapy. Our previous work has shown that NMNAT as NAD+ biosynthetic enzyme is essential for organism survival, as loss of NMNAT causes organismal lethality but not cell death (Zhai et al., 2006). We carried out the RNAi experiment as suggested by the reviewer and found that RNAi-mediated knockdown of NMNAT in normal glial cells (without Rasv12 expression) did not result in growth inhibition (Figure 2_figure supplement 1), suggesting NMNAT is not essential for healthy cell survival.

Regarding the second question on other genes in the NAD+ biosynthetic pathway for glioma growth, significant research effort has been invested in targeting the NAD+ synthetic pathway, especially the rate-limiting enzyme NAMPT. Several studies have shown that NAMPT is critical for glioma progression (Guo et al., 2019; Lucena-Cacace, Otero-Albiol, Jimenez-Garcia, Peinado-Serrano, and Carnero, 2017; Lucena-Cacace, Umeda, Navas, and Carnero, 2019). However, the clinical outcomes of NAMPT inhibitors as chemotherapy have been largely disappointing, which begs the mechanist investigation of the NAD+ pathway in glioma and the consideration of alternative targets (Sampath, Zabka, Misner, O'Brien, and Dragovich, 2015). We included this information in the introduction, as this very point is the primary motivation of our work.

In the revised manuscript, we extended the description of this point in the introduction, on page 4, in the paragraph starts with “Disappointingly, several clinical trials of NAMPT inhibitors have failed due to low efficacy and high toxicities, which demands the urgent consideration of an alternative target in the NAD+ metabolic pathway.”

3) Figure 3 addresses the same issue of NMNAT dependence in a human glioma cell line model. Specificity issues again apply. Why does knockdown of either of two NMNAT genes give the same strong phenotype? The authors make a big point about compartmentalization of NAD biosynthesis, and yet here they get the same phenotype from the nuclear and cytoplasmic variants of NMNAT. What are the effects of each of these manipulations on the level of NAD? Does an equivalent drop in NAD induced by inhibiting the pathway via other means (using Nampt inhibitors) give the same phenotype?

The reviewer touched on an important point. The concept of local/compartmentalized NAD+ synthesis has been proposed based on two main observations, first, the relatively short half-life and diffusion radius of NAD+, and second, the compartment-specific localization of several NAD+ synthetic enzymes including NMNAT. Precise measurement of the compartmental concentration of NAD+ has been challenging (Rechsteiner, Hillyard, and Olivera, 1976; van Roermund, Elgersma, Singh, Wanders, and Tabak, 1995). It is estimated that mitochondria have the highest level of NAD+, around 250 uM, while the nucleus and cytosol share a similar concentration of NAD+, around 100 uM, given the large size of nuclear pores that is permissible for the exchange of NAD+ and metabolic substrates (Alano et al., 2007; Camacho-Pereira et al., 2016). Furthermore, it has been shown that in mammalian cells, nuclear and cytoplasmic NMNATs can regulate each other’s activity, likely through feedback from a dynamic pool of substrates NMN and ATP, as overexpressing cytoplasmic NMNAT may exhaust the supply of NMN, therefore, repress nuclear NAD+ synthesis (Ryu et al., 2018). These studies highlight the complexity of the regulation of cellular NAD+ levels, which includes the contribution from localized synthetic and catabolic enzymes, as well as the dynamic influences from neighboring cellular compartments.

To probe at this complexity, we included both nuclear and cytoplasmic NMNATs in all of our analyses in both Drosophila and glioma cell lines experimental models. We found that in the Drosophila model in vivo, nuclear NMNAT (PC) showed a visibly stronger effect in promoting cell growth than cytoplasmic NMNAT (PD), while knocking down either of two NMNAT genes in glioma cell lines resulted in similar effects of inhibiting cell growth. It is possible that the different effects between nuclear and cytoplasmic NMNATs were below the detection limit of our analysis. Taken together, our results suggest that localized NAD+ biosynthesis is important to glioma tumorigenesis, and there is a dynamic and complex interaction between the cytoplasmic and nuclear pools of NAD+ metabolites.

As mentioned in the comment addressing the previous concern (#2), NAMPT inhibitors have been explored as chemotherapy agents but did not result in clinical success (Sampath et al., 2015). While NAMPT is a uni-directional enzyme, synthesizing NMN (nicotinamide mononucleotide), NMNAT is downstream of NAMPT and directly regulates the level of NAD+ by catalyzing the reversible reaction of NAD+ synthesis. The direction of the reaction, forward (NAD+ production) or reverse (NAD+ breakdown), is dependent upon the availability of subtracts. Therefore, NMNAT functions as a cellular metabolic sensor and maintains the homeostasis of NAD+ pools. NAMPT inhibition would only result in a reduction in NMN and subsequently NAD+, NMNAT inhibition could have much more complex consequences of metabolic homeostasis. For these reasons, we did not include NAMPT inhibitors in our study but rather focused on NMNAT and its downstream functional consequences.

In the revised manuscript, we extended the discussion in addressing this series of questions in the Discussion section, on page 14, in the paragraph starts with “While NAMPT is a uni-directional enzyme, synthesizing NMN (nicotinamide mononucleotide), NMNAT is downstream of NAMPT and directly regulates the level of NAD+ by catalyzing the reversible reaction of NAD+ synthesis.”

4) The most mechanistic and exciting finding in this manuscript is the demonstration that overexpression of NMNAT led to increased parylation and decreased acetylation of p53. Both of these manipulations would inhibit p53-induced apoptosis. This is the most important result in the paper, but unfortunately the data are not convincing. There is no quantification of this effect. Worse yet, a single lane of each is shown, and is not even obvious by eye. First, the band that is claimed to be PAR-p53 is faint and is near the huge IgG band (get some beads with antibody covalently attached so you don't have this band). Second, this blot is full of bands-what is the proof that this band is PAR-p53? Finally, once the band is validated, then it must be repeated multiple times and quantified. The acetyl-p53 blot is also unconvincing. There are many bands, with no validation that the band labeled as acetyl-p53 is actually acetyl-p53. Again, a single blot is shown, and nothing is quantified. Indeed, even by eye it is not clear that NMNAT1 has any effect.

We thank the reviewer for the suggestion. Indeed, the post-translational modification of p53 is one of the most exciting findings, and also the most technically challenging. Due to their transient nature, the PTMs could be difficult to detect consistently. We took the reviewer’s criticism to heart and have expanded the biochemical characterization of NAD+-dependent PTMs, PARylation, and deacetylation. We employed multiple complementary approaches for each PTM and the new results were included in Figure 8, Figure 9, and Figure 9_figure supplement 1.

For PARylation, since there is no antibody available to specifically detect PAR-p53, we used two approaches to address this question. First, we assessed total PARylation level in cells with or without NMNAT overexpression and found that total PARylation is increased with NMNAT overexpression (Figure 8 A, B), suggesting that NMNAT promotes protein PARylation in general. Second, to probe the probability of p53 PARylation, we immunoprecipitated p53 and probed for the PARylation enzyme PARP1 (Figure 8C). We found that the p53, PARP1, and NMNAT forms a trimeric complex that was stable in immunoprecipitation. Importantly we found that endogenous PARP1 expression was upregulated in NMNAT overexpressing cells suggesting a co-regulation of NMNAT and PARP1 to facilitate the NAD+-dependent PARylation. These biochemical results were corroborated by the immunofluorescent imaging analysis where cells overexpressing NMNAT showed a higher level of PARP1 colocalizing with p53 (Figure 8 D-I). Together, these results support our hypothesis that p53 PARylation is increased in NMNAT overexpressing cells.

For NAD+-dependent deacetylation, we took advantage of an available acetyl-p53 specific antibody that detects acetylated p53 at residue K382. The NAD+-dependent deacetylation of p53 at K382 is mediated by SIRT1 (Cheng et al., 2003; Vaziri et al., 2001). We observed a significant reduction of acetylated-p53 levels in NMNAT overexpressing cells, and interestingly, a concomitant increase of SIRT1. We have added a new figure (Figure 9) to show the western analysis and quantifications. Our results suggest a co-regulation of NMNAT and SIRT1 to facilitate the NAD+dependent deacetylation of p53. To rule out a potential cell-line specific effect, we examined the acetylation of p53 in another human glioma cell line U87MG and observed a similar reduction in acetylp53 in NMNAT expressing cells (Figure 9_figure supplement 1).

5) There is a second issue with figure 7. Unlike the other studies in the manuscript, these experiments are only done with overexpression. The authors should test knockdown of the NMNATs in these paradigms. Since they have demonstrated that knockdown and overexpression of NMNATs have opposite effects on glioma cell growth, then if this is the mechanism, they should also have opposite effects on p53 posttranslational modifications. Of course, all of these experiments will require quantification.

To address this point raised by the reviewer, we carried out NMNAT knockdown experiments and examine the cellular consequences of NMNAT reduction and found reduction of PARylation in siRNA knockdown cells. The results and quantification were included in a new figure (Figure 8_figure supplement 1).

Reviewer #2:

This manuscript addressed an important knowledge gap in the field – roles of the Nicotinamide mononucleotide adenylyltransferase (NMNAT) in promoting glioma progression, by using both Drosophila in vivo models and cultured human glioma cells.

The authors first determined that NMNAT is upregulated in glioma induced by activated Ras (RasV12) in Drosophila. Further loss- and gain-of-function analyses showed that NMNAT, particularly its nuclear isoform, inhibits nuclear expression of Caspases, the proteases activating apoptosis, and p53, the key mediator of DNA damage responses, therefore promotes glioma development. From these, the authors conclude that NMNAT accelerates glioma progression by inhibiting p53/caspase-mediated apoptosis. Importantly, although not exactly same in my view, similar principles underlying functions of NMNAT apply to human glioma cells. The authors convincingly showed that, in these cells, NMNAT suppresses the nuclear enrichment of Caspase-3 and activation of apoptosis. Interestingly, NMNAT regulates activity of p53 via posttranslational modifications including PARylation and acetylation, but not the total level of p53. Overall, these findings are novel and are of interest to the broad readership of eLife.

However, direct evidence showing roles of p53 and caspases in glioma development in Drosophila is missing in the manuscript. To my knowledge, these have not been characterized in the field hence are critical to support the conclusions made.

We thank the reviewer for recognizing the significance of our findings. We have followed the reviewer’s recommendation and carried out additional analyses on the roles of p53 and caspase in the Drosophila model. The new results were included in the new figures (Figure 4_figure supplement 1 and Figure 7). These additions have greatly strengthened the mechanistic analysis and further supported our findings.

Along this line, my concerns are as follows:

1) Does apoptosis play a critical role to restrict RasV12-induced glioma development in Drosophila? Notably, the cleaved Caspase-3 antibody indicates the activity of Dronc, the initiator caspase in Drosophila, which has non-apoptotic functions. Also, a recent paper actually suggests that expression of RasV12 blocks activation of apoptosis in epithelial tissues (Perez et al., eLife 2017, 6: e26747). It is therefore important to show whether blocking apoptosis or caspase activity enhances glioma progression.

We thank the reviewer for bringing up this important point. We have followed the suggestion and performed a series of genetic experiments in Drosophila. We blocked apoptosis or caspase activity in Rasv12 overexpressing glial tissue by either overexpressing apoptosis inhibitor Diap1, or p35; or knocking down apoptosis initiator Dronc (Dronc-RNAi) and DCP1 (DCP1-RNAi). We next quantified glial neoplasia volume and found that indeed blocking apoptosis or caspase activity enhances glial neoplasia progression. We included the results in a new figure, Figure 4_figure supplement 1.

Regarding the issue with the caspase-3 antibody, we would like to point out that the caspase-3 antibody we used (Figure 4) recognizes both pro-caspase-3 (non-apoptotic activity) and cleaved caspase3 (apoptotic activity). As shown in Figure 4_figure supplement 1, the caspase pathway is conserved in mammals and fly. Dronc is homologue of caspase-9 in human. The caspase-3 antibody we used cannot recognize Dronc. We quantified the nuclear caspase-3 as the activated caspase-3 to indicate apoptotic levels.

2) Is p53 required for activation of caspases in RasV12-induced glioma and in response to loss-of-NMNAT (Figure 4B)?

We thank the reviewer for raising this interesting question. To answer this question, we carried out a p53 inhibitor feeding experiment in fly to assess the requirement of p53 in the activation of caspase in Rasv12-induced glial neoplasia. We found that inhibiting p53 promoted glial neoplasia volume, reduced cleaved caspase-3 levels, and reduced fly survival rate (Figure 7), suggesting the requirement of p53 in the activation of caspases in RasV12-induced glial neoplasia.

We attempted to carry out the experiment of inhibiting p53 in RasV12-induced glial neoplasia in the loss of NMNAT background, however, this combination of genetic manipulation resulted in early lethality that precluded any meaningful analysis.

Collectively, our results suggest that p53 is required for activation of caspases in RasV12-induced glial neoplasia and p53 inhibition phenocopies NMNAT (nuclear PC) overexpression in promoting glial neoplasia tumorigenesis. We included this important result in a new figure in the revision (Figure 7).

Reviewer #3:

NMNAT promotes glioma growth through enhancing poly(ADP-ribosyl)ation of p53 to inhibit apoptosis – Paper Review Using a Drosophila glioma model and follow-up studies in human glioma cell lines, Liu et al. uncovered the requirement of NMNAT in glioma progression.

One concern is the genetics of the model system chosen. This manuscript focuses on Ras using a Drosophila model. However, mutations in Ras proteins, such as HRAS, are limited in human glioma tumors. In omic studies such as TCGA, there are very few genomic alterations in human glioma (2% or less in HRAS, KRAS, and NRAS). This is likely because driver alterations affecting the RAS pathway lie upstream of RAS itself, and this is different than other solid tumors, as the authors cite in the manuscript. This significantly limits the scope and impact of the findings and should be addressed in some way.

We thank the reviewer for pointing out the concern on the RAS driver. We agree that indeed RAS alterations in human glioma occur in much lower frequency than some high alteration genes such as IDH and EGFR. Our rationale for using mutant RAS overexpressing model in Drosophila was to probe the shared (rather than Ras-specific) fundamental mechanisms in glial neoplasia. To support our finding in Drosophila, we have performed experiments in multiple human glioma cell lines and observed similar phenotypes that were consistent with those observed in vivo in fly models. It would be important to establish Drosophila models using other high-frequency glioma drivers, and we plan to include them in the future.

In the revision, we have included this point in the discussion, on page 13, in paragraph starts with “We adapted a glial neoplasia in Drosophila using the UAS-Ras85Dv12 and repo-GAL4 driver system that induces overgrowth of glial cells to mimic glial neoplasia formation.”

Another concern is the authors use of glioma nomenclature. Drosophila models do not get true "gliomas" as defined by neuropathological criteria for humans and other animals, so the language in the paper describing their glioma model should change to "neoplastic glia," "glial neoplasia" or add the qualifier "model" in their sentences to better distinguish between human and fly biology for this disease. Flies can only model certain aspects of gliomas, such as the genetic basis of neoplastic glial transformation

We thank the reviewer for the suggestion and took the criticism to heart. We followed the suggestion and corrected the nomenclature to ‘glial neoplasia’ throughout the revised manuscript.

Is NMNAT upregulated in tumor specimens from human glioma patients? The authors could query TCGA or other databases (Human Protein Atlas, Ivy Foundation Atlas, Gliovis, etc) to compare the expression levels of NMNAT mRNA and protein between gliomas of different grade and between gliomas with and without mutations in Ras pathway components. These databases are publicly available and this analysis could be done without any benchwork. Or, if they are able to do benchwork, they could compare protein levels in normal human neural stem cells or astrocytes vs glioma cell lines.

We thank the reviewer for this insightful question. We have queried CBioportal and TCGA databases for NMNAT expression in different types of cancers We found high alterations of NMNAT1 and NMNAT2 in multiple cancers. Especially, we found that NMNAT2 is amplified in multiple cancers. (Figure 10_figure supplement 1-2).

To address this comment regarding NMNAT protein expression levels in glioma, we analyzed NMNAT protein levels in a human astroglia cell line (SVG p12), glioma cell lines T98G, and U87MG, and found that NMNAT1 and NMNAT2 were consistently upregulated in glioma cells compared to normal astrocytes (Figure 3_figure supplement 3).

This study may benefit from additional studies on DNA damage such as a comet assay or even looking at whether there are cell cycle changes as a result of modified p53 function.

We thank the reviewer for the suggestion. Using flow cytometry FACS analysis, we have examined the cell cycle (Figure 3_figure supplement 2) and apoptosis (Figure 3 G, H) of glioma cells with or without NMNAT knockdown. Our results suggest that loss of NMNAT did not affect cell cycle, however significantly increased the percentage of apoptotic and pro-apoptotic cells. These results support our model that NMNAT promotes glioma growth through inhibiting apoptosis. This analysis greatly strengthened our conclusion, and we added the apoptosis results to the main figure (Figure 3 G, H), and the cell cycle results to a new supplementary figure (Figure 3_figure supplement 2).

Figure 2E – Manuscript states that Nmnat-PC increased lethality, but the graph is for survival at different life stages. This is confusing, particularly because some of the samples exceed 100% with the way the error bars are presented. This graph should be reformatted to show % lethal broken down by lethal stage.

We have revised the figure as suggested (Figure 2E).

Figure 3 – Colony formation assays are not sufficient to demonstrate growth defects in the glioma cells. Additional independent methods that support these results should be shown. FACS profiling would be appropriate. Also, at least one other glioma cell line that is Ras-dependent should be tested and results from those cells should be shown as well. Why were T98G cells chosen? What is the rationale for using those cells? Were there any other cells tested that yielded negative results? If so, results from those cells may be informative if they are P53 null (many glioma cell lines are P53 null).

We agree with this criticism and have expanded our studies as suggested to include another human glioma cell line (U87MG). The analyses on U87MG cells showed similar results consistent with our conclusion. The results on U87MG cells were included in Figure 5_figure supplement 2 and Figure 9_figure supplement 1.

As stated in the description to the previous comment above, we carried out FACS profiling analysis on cell cycle and apoptosis of glioma cells with or without NMNAT knockdown. Our results suggest that loss of NMNAT did not affect cell cycle (Figure 3_figure supplement 2), however significantly increased the percentage of apoptotic and pro-apoptotic cells (Figure 3 G, H).

Figure 5B – this is an unusual way to quantify cell death in glioma cells. A more representative way would be to quantify the percentage of caspase-positive cells rather than the intensity of caspase staining per cell, which is a much more transient and variable thing. Perhaps the authors already have this data and can change the parameters of their data analysis?

In Figure 5B, we have analyzed caspase-3 immunofluorescence to show activated caspase-3 levels in cells. To further determine the apoptosis, we have performed FACS profiling on cell apoptosis (Figure 3 G, H).

Figure 7A – I would argue only NMNAT2 overexpression is the only condition that increases p53 PARylation. Band intensity could be quantified to better support the author's conclusions.

We recognize the importance of this concern. As described in response to a similar concern raised by reviewer 1, we have carefully examined the NAD+-dependent posttranslational modification of p53, including PARylation and (de)acetylation. We employed multiple complementary approaches for quantitatively analyzing each PTM and the new results were included in Figure 8, Figure 9, and Figure 9_figure supplement 1.

Figure S1: There is no criteria set forth to define pre-tumor vs. glioma areas. Are there molecular markers for these regions? Are those markers conserved between human and flies? The presence of excess cells in some regions of the brain is not really sufficient to distinguish between pre-neoplastic and neoplastic cells in the fly brain.

We thank the reviewer for this comment and took this criticism to heart. We have carefully revised the description with regards to nomenclature and definitions to make it clear and consistent. We have defined the criteria for glial neoplasia and the workflow for quantitative analysis of tumor area in vivo in the beginning in Figure 1 and Figure 1_figure supplement 1.

References

Alano, C. C., Tran, A., Tao, R., Ying, W. H., Karliner, J. S., and Swanson, R. A. (2007). Differences among cell types in NAD(+) compartmentalization: A comparison of neurons, astrocytes, and cardiac myocytes. Journal of Neuroscience Research, 85(15), 3378-3385. doi:10.1002/jnr.21479

Brazill, J. M., Cruz, B., Zhu, Y., and Zhai, R. G. (2018). Nmnat mitigates sensory dysfunction in a Drosophila model of paclitaxel-induced peripheral neuropathy. Dis Model Mech, 11(6). doi:10.1242/dmm.032938

Brazill, J. M., Zhu, Y., Li, C., and Zhai, R. G. (2018). Quantitative Cell Biology of Neurodegeneration in Drosophila Through Unbiased Analysis of Fluorescently Tagged Proteins Using ImageJ. JoveJournal of Visualized Experiments(138). doi:ARTN e58041 10.3791/58041

Camacho-Pereira, J., Tarrago, M. G., Chini, C. C. S., Nin, V., Escande, C., Warner, G. M.,... Chini, E. N. (2016). CD38 Dictates Age-Related NAD Decline and Mitochondrial Dysfunction through an SIRT3-Dependent Mechanism. Cell Metabolism, 23(6), 1127-1139. doi:10.1016/j.cmet.2016.05.006

Cheng, H. L., Mostoslavsky, R., Saito, S., Manis, J. P., Gu, Y., Patel, P.,... Chua, K. F. (2003). Developmental defects and p53 hyperacetylation in Sir2 homolog (SIRT1)-deficient mice. Proc Natl Acad Sci U S A, 100(19), 10794-10799. doi:10.1073/pnas.1934713100

Guo, Q., Han, N., Shi, L., Yang, L., Zhang, X., Zhou, Y.,... Zhang, M. (2019). NAMPT: A potential prognostic and therapeutic biomarker in patients with glioblastoma. Oncol Rep, 42(3), 963-972. doi:10.3892/or.2019.7227

Lucena-Cacace, A., Otero-Albiol, D., Jimenez-Garcia, M. P., Peinado-Serrano, J., and Carnero, A. (2017). NAMPT overexpression induces cancer stemness and defines a novel tumor signature for glioma prognosis. Oncotarget, 8(59), 99514-99530. doi:10.18632/oncotarget.20577

Lucena-Cacace, A., Umeda, M., Navas, L. E., and Carnero, A. (2019). NAMPT as a DedifferentiationInducer Gene: NAD(+) as Core Axis for Glioma Cancer Stem-Like Cells Maintenance. Frontiers in Oncology, 9. doi:ARTN 292 10.3389/fonc.2019.00292

Rechsteiner, M., Hillyard, D., and Olivera, B. M. (1976). Turnover at nicotinamide adenine dinucleotide in cultures of human cells. J Cell Physiol, 88(2), 207-217. doi:10.1002/jcp.1040880210

Ryu, K. W., Nandu, T., Kim, J., Challa, S., DeBerardinis, R. J., and Kraus, W. L. (2018). Metabolic regulation of transcription through compartmentalized NAD(+) biosynthesis. Science, 360(6389). doi:ARTN eaan5780 10.1126/science.aan5780

Sampath, D., Zabka, T. S., Misner, D. L., O'Brien, T., and Dragovich, P. S. (2015). Inhibition of nicotinamide phosphoribosyltransferase (NAMPT) as a therapeutic strategy in cancer. Pharmacology and Therapeutics, 151, 16-31. doi:10.1016/j.pharmthera.2015.02.004 van Roermund, C. W., Elgersma, Y., Singh, N., Wanders, R. J., and Tabak, H. F. (1995). The membrane of peroxisomes in Saccharomyces cerevisiae is impermeable to NAD(H) and acetyl-CoA under in vivo conditions. Embo Journal, 14(14), 3480-3486.

Vaziri, H., Dessain, S. K., Eagon, E. N., Imai, S. I., Frye, R. A., Pandita, T. K.,... Weinberg, R. A. (2001). hSIR2(SIRT1) functions as an NAD-dependent p53 deacetylase. Cell, 107(2), 149-159. doi:Doi 10.1016/S0092-8674(01)00527-X

Zhai, R. G., Cao, Y., Hiesinger, P. R., Zhou, Y., Mehta, S. Q., Schulze, K. L.,... Bellen, H. J. (2006). Drosophila NMNAT maintains neural integrity independent of its NAD synthesis activity. PLoS Biol, 4(12), e416. doi:10.1371/journal.pbio.0040416

[Editors’ note: The authors appealed the second decision. What follows is the authors’ response to the second round of review.]

Reviewer #2:

Liu et al. investigate the role of the NAD+ synthases NMNAT1 and NMNAT2 in glioma survival to test whether these enzymes are promising targets for therapeutic interventions. The authors employ a glial neoplasia developing Drosophila model and the two human glioma cell line models T98G and U87MG. Their data show that depletion of NMNAT1 and NMNAT2 inhibits and overexpression of the enzymes promotes glioma growth. Moreover, the authors show that depletion of NMNAT1/2 increased apoptosis while overexpression of the enzymes inhibited apoptosis upon cisplatin treatment. Mechanistically, the authors propose that NMNAT1/2 physically interact with p53 and PARP1 to drive PARylation and deacetylation of p53, ultimately leading to reduced p53 activity.

I find substantial parts of the underlying data not convincing (see below). I felt that the authors overinterpreted poor or insufficiently controlled data, jumped to conclusions from ambiguous results, and exaggerated several conclusions.

Together, I cannot recommend the manuscript for publication.

We appreciate the reviewer’s critical evaluation of our manuscript. We recognized the issues with the description of data and methods as the reviewer pointed out, and a lack of clarity in the writing of results and discussions, especially the sections on human cell models that have resulted in the reviewer’s criticism. Below, we address each of the main concerns that the reviewer stated above, and at the bottom, we include a point-to-point rebuttal for the specific points and questions that the reviewer listed. The revised text and figures are highlighted in blue font in the manuscript.

We are confident that our revision will resolve the ambiguity and confusion, and present a more comprehensive and inclusive model of the role of NMNAT proteins in promoting glioma progression. We thank the reviewer for bringing up their point of view and the opportunity of improving our manuscript in its accuracy and reach in the field of glioma biology.

Notably, during the preparation and submission of our manuscript, Lee Kraus group (UT Southwestern) has also been working on the role of NMNAT in cancers and just published the paper below in Cell on July 19, 2021.

[Ribosome ADP-ribosylation inhibits translation and maintains proteostasis in cancers. Challa S, Khulpateea BR, Nandu T, Camacho CV, Ryu KW, Chen H, Peng Y, Lea JS, Kraus WL. Cell. 2021 Jul 19:S0092-8674(21)00831-X. doi: 10.1016/j.cell.2021.07.005. Online ahead of print. PMID: 34314702]

This paper showed that NMNAT2-mediated cytosolic NAD+ synthesis plays an essential role in ovarian cancer by regulating translation and maintaining protein homeostasis through supporting the catalytic activity of the mono(ADP-ribosyl) transferase (MART) PARP-16, which mono(ADP-ribosyl)ates (MARylates) ribosomal proteins. Their finding of the role of NMNAT in protein (ribosome) ADP-ribosylation directly complements our discovery of the role of NMNAT in NAD+ dependent PTM in glioma.

In addition, Daisuke Nakada group (Baylor) published the paper showing NMNAT1 mediated NAD+ metabolism enables acute myeloid leukemia (AML) to evade apoptosis.

[Nuclear NAD+ homeostasis governed by NMNAT1 prevents apoptosis of acute myeloid leukemia stem cells. Shi X, Jiang Y, Kitano A, Hu T, Murdaugh RL, Li Y, Hoegenauer KA, Chen R, Takahashi K, Nakada D. Sci Adv. 2021 Jul 21;7(30):eabf3895. doi: 10.1126/sciadv.abf3895. Print 2021 Jul. PMID: 34290089.]

Collectively, our manuscript and these two recent papers reveal a common mechanism of NMNAT in promoting cancer growth. Importantly, our manuscript carried out a side-by-side comparative analysis of the role of nuclear vs. cytosolic NMNAT (NMNAT1 and NMNAT2) in promoting the progression of glioma, a fatal cancer, and identified the stronger effect of nuclear NMNAT and its detailed molecular mechanism. These two recent publications further indicate the significance and timeliness of our work.

I am not fully convinced by the growth data presented by the authors. Publicly available data (www.DepMap.org) do not indicate that glioma cell lines are particularly sensitive to NMNAT1 or NMNAT2 depletion. Controls for si-mediated protein reduction in the cell lines are missing throughout and a second siControl could be helpful.

Regarding the growth data and NMNAT in publicly available datasets (such as DepMap.org), we analyzed DepMap.org as suggested and in a similar manner as in Shi et al. 2021 Sci Adv (above paper) (Author response table 1). We found a weak dependence for NMNAT1 and no significant effect for NMNAT2 in glioma cells lines, U87MG or T98G. As a comparison, we also analyzed the gene effect of NMNAT2 in OVCAR3 cells used in Challa et al. 2021 Cell above and as per the CERES score, found no dependence of NMNAT2 in OVCA3 cells, although the published paper clearly shows a functional effect of NMNAT2 in OVCA3 cell growth in ovarian cancer. Analysis of the specific cell lines used in the Shi et al. 2021 Science Advances paper shows their dependency scores are comparable to ours for NMNAT1 (Author response table 1) .

Author response table 1. Gene effect analysis using DepMap.

org dataset

Manuscript Cancer Cell Line Gene Gene effect (CERES) Expression (Log2(TPM+1))
Liu et al. (2021). bioRxiv.(this manuscript) Glioma T98G NMNAT1NMNAT2 -0.427-0.0177 2.872.29
U87MG NMNAT1NMNAT2 -0.1590.156 3.15.74
Challa et al. (2021). Cell Ovarian OVCAR3 NMNAT1NMNAT2 -0.2190.0989 3.264.18
Shi et al. (2021).Science Advances Acute myeloid leukaemia MOLM13 NMNAT1NMNAT2 -0.33-0.00213 2.310.189
OCIAML2 NMNAT1NMNAT2 0.0588 0.0624 0.8881.52

This supports the notion that findings of negative or weak gene dependency in DepMap datasets do not, in and of themselves, exclude the gene in question’s possible role in cancer growth and progression, and that other parameters and empirical analyses are required to identify the gene’s function in a specific cancer model.

To further examine disease-relevant role of NMNAT in glioma growth, we analyzed the public glioma cancer dataset GEPIA. A strong negative correlation between NMNAT1 expression and survival can be seen in patients with brain lower grade glioma correlation, where patients of higher NMNAT1 expression showed lower survival rate, either the top 50% expression compared to bottom 50% (Figure 11A) or the top 10% expression level compared to the bottom 10% expression (Figure 11B). In the aggressive form of glioma, glioblastoma multiforme (GBM), from which the T98G and U87MG cell lines were derived, the NMNAT1 high expression level (top 10%) showed strong correlation with more aggressive disease and poorer outcome, while NMNAT2 expression level did not correlate with the survival of the aggressive GBM (Figure 11C, D). The brain glioma patient dataset clearly indicates the strong correlation between high NMNAT1 expression with lower survival and poorer clinical outcome. These clinical data are consistent with our findings that NMNAT1 depletion has stronger adverse effects on glioma cell growth vs. NMNAT2 depletion, and higher levels of NMNAT1 promote glioma progression.

Our study provided the mechanism underlying this clinical observation, and identified the effects of NMNAT specifically on promoting glioma growth, without being an oncogene since NMNAT expression alone did not induce glioma initiation. In human glioma cell models, using loss of function (knockdown) and gain of function (overexpression) experiments (MTT assay, growth curve, colony formation), we found NMNAT is required for human glioma cell proliferation without affecting cell cycle control (Figure 3_figure supplement 2). For overexpression experiments, we used DsRed as expression control and for knockdown experiments, we used scrambled siRNA as controls (Figure 3_table supplement 1).

Revision:

1. We have included the GEPIA dataset analysis in a main figure (Figure 10A-D), and revised the discussion to address the implication in glioma tumor initiation vs. progression.

2. We have provided western blot results showing siRNA-mediated protein reduction to complement the PCR result provided for siRNA efficiency (Figure 3_figure supplement 1D and E).

The PARylation data is not convincing. A methods part is missing that explains how PARylation was analyzed. Total PAR or PAR overlay assay? The latter would be crucial to claim p53 PARylation, the former is critical for statements on PARylation in general. The authors claim that NMNAT1/2 form a complex with p53 and PARP1 to facilitate PARylation, but it is unclear whether they refer to only p53 PARylation or also PARylation in general.

We used four approaches to detect and analyze PARylation; (i) anti-PAR dot blotting to probe for total PARylation of all proteins, (ii) western blot analysis of total PAR-proteins in cell lysates, (iii) cell imaging with anti-PAR antibody, and (iv) analysis of PARP1 localization and interaction with NMNAT and p53. We found that (1) NMNAT as NAD+ synthase increases cellular total PARylation level (Figure 8), and (2) NMNAT expression enhanced the interaction with PARP1 and p53 (Figure 8). Given the trimeric complex formation among NMNAT, PARP1 and p53, and the upregulation of endogenous PARP1 expression in NMNAT overexpressing cells, our findings suggest a co-regulation of NMNAT and PARP1 to facilitate the NAD+-dependent PARylation process and p53 is one of the target proteins of PARylation. These data are consistent with the above-mentioned paper (Challa et al. 2021 Cell), and further expand the significance and relevance of the NMNAT mediated protein modifications in cancers.

Revision:

1. Revised methods description of PARylation analysis (page 22).

2. We revised the conclusion to include the broad effects of PARylation and to clarify p53 as one of the targets of PARylation (page 11-12).

3. Added the anti-PAR western blot data of total cell lysates (Figure 8A and B).

The authors draw conclusions on p53 activity from signals that are known to be regulated by various pathways (e.g. apoptosis). Instead, it would be crucial to test for the expression of p53 targets (e.g. MDM2, BBC3, GADD45A) to investigate p53 activity. Yet, given that the p53 status differs between T98G (mutant p53) and U87MG (wild-type p53) cells (van Meir et al., 1994 Cancer Res), the authors' growth data, which are similar for T98G and U87MG, demonstrate that the potential effect elicited by NMNAT1/2 is independent of. Moreover, all p53 interaction data shown using T98G data reflect mutant p53, which is known to have potentially different binding partners than wild-type p53. In general, the fact that T98G harbor mutant p53 turns most parts of the manuscript upside down that deal with mechanistics.

Regarding p53 activity and the p53 status in T98G and U87MG cells. Our findings of similar effects of NMNAT on p53 modification in either wild-type (U87MG) or mutant p53 (T98G) cells, suggest NAD+-dependent PARylation or deacetylation of p53 is independent of the p53 [M237I] mutation. This is a gain-of-function mutation in the DNA binding domain that retains the ability of p53 to be modified by acetylation and PARylation as the mutation does not affect the sites of these PTMs (Yamamoto and Iwakuma, 2018; Yi et al., 2013). Furthermore, there is ample literature characterizing apoptosis induction in the T98G line, including through p53-dependent mechanisms (eg. (Enns, Bogen, Wizniak, Murtha, and Weinfeld, 2004) shows the p53 inhibitor pifithrin can inhibit apoptosis in irradiated T98G cells). Indeed, recent studies have shown that mutant p53 can retain the ability to induce apoptosis despite losing tumor-suppressive transactivation functionality (Timofeev et al., 2019). The Timofeev et al. study is one of several lines of emerging data on the complexity of p53 mutants with regards to their retained ability to enact similar functions as wildtype p53, and it can no longer be generalized that mutant p53 will necessarily have different binding partners than wild-type p53, in the face of contrary evidence (as provided by us here with regards to NMNAT p53 interactions).

Because approximately 51% of glioma are mutated for p53, we intentionally designed a comparative analysis using two different glioma cell lines with different p53 status to dissect common mechanisms of the role of NMNAT in glioma cell growth through modulating global NAD+-dependent protein modification. The common apoptosis-inhibitory effect of NMNAT expression we report on both cell lines does not exclude NAD+-dependent modifications on proteins (other than p53) that play important tumor growth-regulatory roles, in addition to p53. The ribosomal proteins shown in the above-mentioned paper (Challa et al. 2021 Cell) are a potential example. Regardless, our use of lines with differing p53 mutational status here is a strength, showing the pervasive utility of targeting NMNAT, rather than a weakness of our study.

What our findings collectively show for the first time is a role for NMNAT in glioma progression through regulating the NAD+-dependent post-translational modifications of proteins PARylation and deacetylation, with p53 as one of the targets.

Figure 1: why is Nmnat not color-coded?

We used gray scale for Nmnat channel in Figure 1 in order to highlight the upregulation of NMNAT protein in Rasv12 overexpressing glial cells.

Figure 3G: The AnnexinV:PI gating is strange. For comparison see https://images.bio-rad-antibodies.com/kit/annexin-v-kit-antibody-kit-annex100-image2-600w.jpg.

We used the apoptosis detection kit from BD Biosciences and followed the specific instructions (https://www.bdbiosciences.com/en-us/products/reagents/flow-cytometry-reagents/research-reagents/panels-multicolor-cocktails-ruo/fitc-annexin-v-apoptosis-detection-kit-i.556547). The AnnexinV:PI gating was selected to divide the data in quadrants, where Q3 was considered as viable, Q4 as early apoptosis and Q2 as end stage apoptosis and death. The Figure 3H indicates the sum of Q4 and Q2 of each group. We originally segmented the P4 and P5 boxes in Q2 to highlight the apoptotic cell population that increased dramatically after siRNA mediated NMNAT reduction. However, since we included the entire Q2 in quantification, we have removed P4 and P5 segments to improve the clarity of the results.

Revision: We have removed P4 and P5 segmentation (Figure 3G) and provided the details of analysis including gating criteria in the methods section and figure legends (page 8 and page 23).

Western blot signals are often saturated, which hinders proper readout.

Figures 5A, B, D, and F miss NMNAT1 and NMNAT2 as crucial controls.

We have provided the mRNA level efficiency of siRNA (Figure 3_figure supplement 1C).

Revision: We have added the western analysis of NMNAT protein level (Figure 3_figure supplemental 1D and E).

Figures 5D and F: All lanes display cisplatin-treated samples? If so, controls without cisplatin treatment are missing.

In this Figure, cisplatin was used to induce apoptosis only in the NMNAT overexpression experiment (Figure 5B) to observe the potential reduction of apoptosis by NMNAT. In NMNAT knockdown experiment (Figure 5A and 5D), cisplatin is not used because we expect to observe a potential increase with NMNAT knockdown.

Revision: To clarify this point, we have included the detailed information in Figure 5 figure legend and main text (page 9).

Figure 8A and Figure 8—figure supplement 1: PARylation of what? Controls are missing.

Figure 8A detected PARylation of total protein in cell extracts using anti-PAR antibody. We determined protein concentration and loaded same amount proteins of each group. DsRed expressing cells were used as controls.

Revision: We have included the detailed information in Figure 8 figure legend and main text (page 11).

Figure 8C: Specificity of the NMNAT2 antibody is not convincing.

We used the NMNAT2 specific antibody (Abcam AB56980). We identified the NMNAT2 protein bands by the NMNAT2 overexpression lane (Figure 8C input lane).

Figure 9A: It is unclear why the authors IP p53 to blot acetyl-p53. Acetyl-p53 can be immunoblotted with whole cell lysates, as demonstrated by the authors (input lanes). Loading of IPs is more difficult to control, thus the signal from the input lanes are more important and actually do not show changes in acetyl-p53 upon NMNAT overexpression.

We used p53 IP experiment to serve two purposes; (i) to probe the potential interaction of p53 with deacetylation enzyme SIRT1, and (ii) to clearly identify the acetylated-p53 protein bands. Indeed as the reviewer suggested, we can quantify using the input lanes in addition to the IP-ed p53.

Revision: We have quantified acetyl-p53 in the input lanes (Figure 9C).

Figure 9C: What is quantified here? 9B apparently is based on the p53 IP lanes. But 9C appears to be based on the input lanes. Cherry picking?

Figure 9B quantifies the acetyl-p53 immunoprecipitated by anti-p53 antibody. Figure 9C quantifies the endogenous level of SIRT1 in cell lysates as in the input lanes. Since we did not detect any interaction between p53 and SIRT1, we determined the level of endogenous SIRTs in input. As indicated in the response to last point, we IP-ed p53 to avoid the nonspecific bands shown in the total lysate. The quantifications included in this figure were justified given the experimental feasibility. We strongly believe the criticism of ‘cherry picking’ is unfounded.

Revision: We have quantified acetyl-p53 in the input lanes (Figure 9C).

Figure 3—figure supplement 3: NMNAT2 blot is out of focus.

Our western analyses were all carried out using Li-COR infrared fluorescence scans. There should be no ‘focusing’ involved.

Revision: we have replaced the figure with a full blot with better appearance (Figure 3_figure supplement 3).

Figure 5—figure supplement 2: reduction of cleaved cas3 upon NMNAT1 overexpression is not convincing. siNMNAT1/2 are missing. Immunoblots for NMNAT1/2 are missing.

Figure 5 and the accompanying supplemental figures were addressing the effect of overexpression NMNAT in caspase-mediated apoptosis. We have shown in the previous figures that loss of NMNAT1/2 result in cell death.

Figure 9—figure supplement 1: What is shown in this Figure? Whole cell lysates or p53 IPs? Why do the authors use only lysate or IP here but both in Figure 9A? The reduction is not convincing. No cisplatin control is missing. siNMNAT1/2 are missing.

Immunoblots for NMNAT1/2 are missing.

In Figure 9—figure supplement 1, we used whole cell lysates as indicated in the figure legend. Figure 9A is on T98G cells where p53 (mutant) is expressed at a high level. However, the U87MG cells have low expression level of p53 (wildtype) as shown in Figure 5_supplemnet 2. Cisplatin treatment was used only used in U87MG cells to induce p53 expression level to allow the analysis of the posttranslational modification of p53.

References

Enns, L., Bogen, K. T., Wizniak, J., Murtha, A. D., and Weinfeld, M. (2004). Low-dose radiation hypersensitivity is associated with p53-dependent apoptosis. Molecular Cancer Research, 2(10), 557-566. Retrieved from <Go to ISI>://WOS:000224650800004

Timofeev, O., Klimovich, B., Schneikert, J., Wanzel, M., Pavlakis, E., Noll, J.,… Stiewe, T. (2019). Residual apoptotic activity of a tumorigenic p53 mutant improves cancer therapy responses. Embo Journal, 38(20), e102096. doi:10.15252/embj.2019102096

Yamamoto, S., and Iwakuma, T. (2018). Regulators of Oncogenic Mutant TP53 Gain of Function. Cancers (Basel), 11(1). doi:10.3390/cancers11010004

Yi, Y. W., Kang, H. J., Kim, H. J., Kong, Y., Brown, M. L., and Bae, I. (2013). Targeting mutant p53 by a SIRT1 activator YK-3-237 inhibits the proliferation of triple-negative breast cancer cells. Oncotarget, 4(7), 984-994. doi:10.18632/oncotarget.1070

[Editors’ note: what follows is the authors’ response to the third round of review.]

There is consensus that the manuscript has been much improved but there are some remaining issues that need to be addressed, as outlined below:

We would like you to submit a final paper that includes:

1) Data indicating that NMNAT1/2 interacts with p53 also in the U87MG p53 wild-type line;

We have carried out the immunoprecipitation experiment as suggested and detected the interaction between p53 and NMNAT1/2 in U87MG cells. Using an anti-p53 antibody, we immunoprecipitated p53 from U87MG cell lysates and probed for NMNAT1 and NMNAT2. As shown in the figure included, we detected NMNAT1 and 2 in the p53-IP fraction, suggesting that NMNAT1/2 interacts with wildtype p53. We have added this figure as Figure 9_figure supplement 2.

2) Data that tests if p53 depletion rescues the apoptosis-inducing effect of siNMNAT in both cell lines they use (T98G and U87MG);

To address this point, we have used two approaches to reduce/deplete p53: siRNA transfection or shRNA lentivirus transduction in both cell lines. After p53 depletion, we carried out siNMNAT knockdown and probed for cleaved caspase3 to examine the activation of apoptosis in both T98G and U87MG cells. Under all four conditions, two cell types and two modes of p53 depletion, we observed consistent reduction of siNMNAT-induced apoptosis activation when p53 is depleted. As shown in the figures included, cleaved caspase3 expression level in p53 and NMNAT double knockdown cells was reduced compared to those in siNMNAT cells. These observations support that p53 is required for the apoptosis-inducing effect of siNMNAT in both cell lines. We have included the data with shRNA lentivirus transduction as a new figure (Figure 8) and the data with siRNA transfection as a supplemental figure (Figure 8—figure supplement 1).

3) Toning down claims on PARylation at different locations in the manuscript.

We recognize the importance of accurate interpretation of our results and, following this suggestion, we have revised the entire manuscript. Specifically, we have made the following changes.

1) Abstract. We have revised the sentence, “Interestingly, NMNAT forms a complex with p53 and PTM enzyme PARP1 to facilitate PARylation. PARylation and deacetylation reduce p53 pro-apoptotic activity, indicating that regulation of p53 post-translational modifications is a key mechanism by which NMNAT promotes glioma growth” to “Since PARylation and deacetylation reduce p53 pro-apoptotic activity, modulating p53 post-translational modifications could be a key mechanism by which NMNAT promotes glioma growth”.

2) Figure 9. We revised the title “NMNAT interacts with PARP1 and upregulates PARylation of p53” to “NMNAT interacts with p53 and PARP1 and upregulates PARylation”.

3) Results. We revise the conclusion in the paragraph about PARylation, line 289, “Collectively, these results suggest NMNAT regulates p53 modification by complexing with p53 and PARP1, thus potentially increasing the local NAD+ availability to promote PARylation with high efficiency” to “Collectively, these results suggest NMNAT interacts with PARP1 and promotes PARylation of PARP1 targeting proteins, like p53, potentially through increasing the local NAD+ availability”.

4) Discussion. We revised the sentences in the first paragraph, line 329, “Mechanistically, upregulation of enzymatically active NMNAT promotes the NAD+-dependent post-translational modifications of p53, and specifically increases the PARylation of p53 and reduces the acetylation of p53. Furthermore, we detected presence of a p53-NMNAT-PARP1 trimeric complex as well as increased SIRT1, suggesting a highly efficient NAD+-dependent post-translational modification process facilitated by the NAD+ synthase function of NMNAT” to “Mechanistically, upregulation of enzymatically active NMNAT promotes the NAD+-dependent post-translational modifications of p53. Specifically, we detected upregulation of protein PARylation and the presence of a p53-NMNAT-PARP1 trimeric complex and decreased acetylation of p53 accompanied with increased SIRT1”.

Reviewer #2:

The authors provided a revised version addressing most concerns that I raised. However, some key points in the authors' study still require supportive data.

– The NMNAT-PARP1-p53 interaction:

Previously, I raised the concern that protein interaction with mutant p53 not always translates into an interaction with wild-type p53. The present M237I mutant reportedly possesses neomorphic functions. Given that the NMNAT1/2-p53 interaction is an integral part of the model proposed by the authors, I would like to reiterate that I find it crucial to corroborate this interaction also in the p53 wild-type line U87MG.

We have carried out the immunoprecipitation experiment as suggested and detected the interaction between p53 and NMNAT1/2 in U87MG cells. Using anti-p53 antibody, we immunoprecipitated p53 from U87MG cell lysates and probed for NMNAT1 and NMNAT2. We detected NMNAT1 and 2 in the p53-IP fraction, suggesting the interaction of NMNAT1/2 with wildtype p53.

Revision: we have added a new figure to show this result (Figure 9_figure supplement 2).

– The NMNAT-p53-apoptosis mechanism:

Following my concern that much of the authors' data on p53 was generated using a mutant p53 cell line (T98G), the authors explain that they intentionally included both wild-type and mutant p53 cell systems and clarify their strategy to the reader in the revised version, such as by adding a respective sentence to the Discussion section "Our findings that NMNAT similarly affects p53 modification in either wild-type (U87MG) or mutant p53 (T98G) cells suggest NAD+-dependent PARylation or deacetylation of p53 is independent of the p53 [M237I] mutation. Indeed recent studies have shown that mutant p53 proteins retain the ability to induce apoptosis despite losing tumor-suppressive transactivation functionality (Timofeev et al., 2019)".

Notably, Timofeev et al., 2019 refers to the p53 mutant R181E (R178E in mice). p53 mutants are known to differ. The M237I mutant present in the authors' T98G cell line, for example, did not display residual apoptosis-driving function when it was tested in a different study (Boettcher et al., 2019 Science). Given that the authors propose reduced p53-dependent apoptosis to be a key mechanism by which NMNAT promotes glioma growth, it is crucial to show that there actually is p53-dependent apoptosis occurring in the authors' experimental setup, i.e. by adding data on sip53 in Figure 3G showing whether p53 depletion can indeed rescue the apoptosis-inducing effect of siNMNAT in both T98G and U87MG cells. Given the importance to the authors' mechanistic model and the different experimental setup, it is insufficient to only refer to the findings by Enns et al., 2004.

We appreciate the reviewer’s concern. To address this point, we have used two approaches to reduce/deplete p53: siRNA transfection or shRNA lentivirus transduction in both cell lines. After p53 depletion, we carried out siNMNAT knockdown and probed for cleaved caspase3 to examine the activation of apoptosis in both T98G and U87MG cells. Under all four conditions, two cell types and two modes of p53 depletion, we observed consistent reduction of siNMNAT-induced apoptosis activation by p53 depletion. As shown in the figures included, cleaved caspase3 expression level in p53 and NMNAT double knockdown cells was reduced compared to that in siNMNAT cells. These observations support that p53 is required for the apoptosis-inducing effect of siNMNAT in both cell lines. We have included the data with shRNA lentivirus transduction as a new figure (Figure 8) and the data with siRNA transfection as a supplemental figure (Figure 8—figure supplement 1).

Revision: we have added two new figures to show the result (Figure 8 and Figure 8_figure supplement 1).

– The NMNAT-p53-PARylation mechanism:

The authors convincingly demonstrate that NMNAT1/2 affect total PAR levels in the cell (Figure 8A and B, Figure 8-supplement 1). Key points in the authors' model include (1) that PARylation of p53 is induced by NMNAT1/2 (abstract, headlines, Figure 10E) and (2) that complex formation with p53 is important for NMNAT1/2 to facilitate PARylation (abstract). Supportive data for these points, however, is missing.

1) I would like to reiterate that it is crucial to provide data on NMNAT-dependent p53 PARylation. I.e. by blotting for PAR in p53 IPs (Figure 8C or 9A), in both T98G and U87MG.

We thank the reviewer for the suggestion. Due to their transient nature, the PARylation of p53 could be difficult to detect consistently. Since there is no antibody available to specifically detect PAR-p53, we used two approaches to address this question. First, we assessed total PARylation level in cells with or without NMNAT overexpression and found that total PARylation is increased with NMNAT overexpression (Figure 9 A, B), suggesting that NMNAT promotes protein PARylation in general. Second, to probe the probability of p53 PARylation, we immunoprecipitated p53 and probed for the PARylation enzyme PARP1 (Figure 9C). We found that the p53, PARP1, and NMNAT form a trimeric complex that was stable in immunoprecipitation both in T98G and U87MG. Importantly, we found that endogenous PARP1 expression was upregulated in NMNAT overexpressing cells suggesting a co-regulation of NMNAT and PARP1 to facilitate the NAD+-dependent PARylation. These biochemical results were corroborated by the immunofluorescent imaging analysis where cells overexpressing NMNAT showed a higher level of PARP1 colocalizing with p53 (Figure 9 D-I). Together, these results support our hypothesis that p53 PARylation is increased in NMNAT overexpressing cells, although we acknowledge that future studies with specific antibodies to directly detect the p53 PARylation is required for confirmation.

2) To support the authors' point that "NMNAT forms a complex with p53 and PTM enzyme PARP1 to facilitate PARylation" (abstract), it is crucial to show whether p53 indeed is required for NMNAT-dependent PARylation, i.e. whether p53 depletion affects NMNAT-dependent PARylation in both T98G and U87MG (Figures 8A and 8-supplement 1).

Our findings suggest NMNAT interacts with PARP1 to facilitate NAD+-dependent PARP1-mediated PARylation, and p53 is likely one of many target proteins of NMNAT-dependent PARylation. Whether p53 regulates NMNAT-dependent PARylation would be an interesting topic for future investigation.

We recognize the importance of accurate interpretation of our results and followed this suggestion and have revised the entire manuscript. We have toned down our conclusions as follows:

1) we revise the sentence in abstract, “Interestingly, NMNAT forms a complex with p53 and PTM enzyme PARP1 to facilitate PARylation. PARylation and deacetylation reduce p53 pro-apoptotic activity, indicating that regulation of p53 post-translational modifications is a key mechanism by which NMNAT promotes glioma growth” to “Since PARylation and deacetylation reduce p53 pro-apoptotic activity, modulating p53 post-translational modifications could be a key mechanism by which NMNAT promotes glioma growth”.

2) we revise the Figure 9 title “NMNAT interacts with PARP1 and upregulates PARylation of p53” to “NMNAT interacts with p53 and PARP1 and upregulates PARylation”.

3) we revise the conclusion in the paragraph of Results about PARylation, page 12, “Collectively, these results suggest NMNAT regulates p53 modification by complexing with p53 and PARP1, thus potentially increasing the local NAD+ availability to promote PARylation with high efficiency” to “Collectively, these results suggest NMNAT interacts with PARP1 and promotes PARylation of PARP1 targeting proteins, like p53, potentially through increasing the local NAD+ availability”.

4) we revise the sentences in the first paragraph of Discussion, page 14, “Mechanistically, upregulation of enzymatically active NMNAT promotes the NAD+-dependent post-translational modifications of p53, and specifically increases the PARylation of p53 and reduces the acetylation of p53. Furthermore, we detected presence of a p53-NMNAT-PARP1 trimeric complex as well as increased SIRT1, suggesting a highly efficient NAD+-dependent post-translational modification process facilitated by the NAD+ synthase function of NMNAT” to “Mechanistically, upregulation of enzymatically active NMNAT promotes the NAD+-dependent post-translational modifications of p53. Specifically, we detected upregulation of protein PARylation and the presence of a p53-NMNAT-PARP1 trimeric complex and decreased acetylation of p53 accompanied with increased SIRT1”.

Associated Data

    This section collects any data citations, data availability statements, or supplementary materials included in this article.

    Supplementary Materials

    Figure 3—source data 1. siRNA sequences for NMNAT1/2 knockdown and primer sequences for PCR.
    Figure 3—figure supplement 1—source data 1. T98G cell viability was inhibited after knockdown NMNAT1 or NMNAT2.
    Figure 3—figure supplement 3—source data 1. NMNAT protein was upregulated in human glioma cells.
    Figure 5—source data 1. NMNAT decreased caspase-3 activation in human glioma cells.
    Figure 5—figure supplement 2—source data 1. Cleaved Ccaspase-3 was reduced after NMNAT overexpression.
    Figure 8—source data 1. p53 depletion rescued NMNAT knockdown-induced caspase-3 activation in glioma.
    Figure 8—figure supplement 1—source data 1. p53 depletion rescued NMNAT knockdown-induced caspase-3 activation in glioma.
    Figure 9—source data 1. NMNAT interacts with p53 and PARP1 and upregulates PARylation.
    Figure 9—figure supplement 2—source data 1. NMNAT interacts with p53 in U87MG.
    Figure 10—source data 1. NMNAT upregulates SIRT1 and reduces acetylation of p53.
    Figure 10—source data 2. NMNAT upregulates SIRT1 and reduces acetylation of p53.
    Figure 10—figure supplement 1—source data 1. Acetyl-p53 was reduced in U87MG cells under NMNAT overexpression conditions.
    Transparent reporting form
    Source data 1. Original data file.
    elife-70046-supp1.xlsx (399.3KB, xlsx)

    Data Availability Statement

    All data generated or analysed during this study are included in the manuscript and supporting files. Source data files have been provided.


    Articles from eLife are provided here courtesy of eLife Sciences Publications, Ltd

    RESOURCES