Abstract
Circadian rhythms align physiological functions with the light-dark cycle through oscillatory changes in the abundance of proteins in the clock transcriptional program. Timely removal of these proteins by different proteolytic systems is essential to circadian strength and adaptability. Here we show a functional interplay between the circadian clock and chaperone-mediated autophagy (CMA), whereby CMA contributes to the rhythmic removal of clock machinery proteins (selective chronophagy) and to the circadian remodeling of a subset of the cellular proteome. Disruption of this autophagic pathway in vivo leads to temporal shifts and amplitude changes of the clock-dependent transcriptional waves and fragmented circadian patterns, resembling those in sleep disorders and aging. Conversely, loss of the circadian clock abolishes the rhythmicity of CMA, leading to pronounced changes in the CMA-dependent cellular proteome. Disruption of this circadian clock/CMA axis may be responsible for both pathways malfunctioning in aging and for the subsequently pronounced proteostasis defect.
Keywords: aging, chaperones, circadian rhythms, light-dark cycle, lysosomes, proteostasis, protein targeting, protein degradation, proteomics
One Sentence Summary:
Oscillatory lysosomal activity for disposal of the components of the cellular clock is essential to sustain organismal circadian rhythms
Introduction
Circadian rhythms align physiology and behavior with the daily light-dark cycle1-3. The circadian molecular clock involves a transcriptional-translational feedback loop that generates rhythmicity4. Translational, post-translational, and epigenetic mechanisms determine the strength and adaptability of the clock5,6. Positive clock elements, CLOCK, and BMAL1 drive rhythmic expression of multiple genes, including their negative regulators PER1/2/3 and CRY1/27 and the regulatory stabilizing components Reverb and Ror 8. Besides this transcriptional regulation, orderly timekeeping requires timely degradation of the clock-related proteins9,10. Some clock proteins are degraded by the proteasome11-13 or macroautophagy14,15. However, additional proteostasis components with different activation times may be required to attain periodicity.
Here, we focus on chaperone-mediated autophagy (CMA) that drives degradation of selective proteins into lysosomes16. HSC7017 binds CMA substrates and targets them to the lysosome-associated membrane protein type 2A (LAMP2A or L2A)18, the CMA receptor that also mediates substrate translocation into the lysosome19 assisted by luminal HSC7020. The described timely remodeling of the cellular proteome by CMA16 drove us to explore circadian properties of CMA and its participation in timely cycling degradation of clock components.
Results
Components of the primary clock undergo cyclic CMA
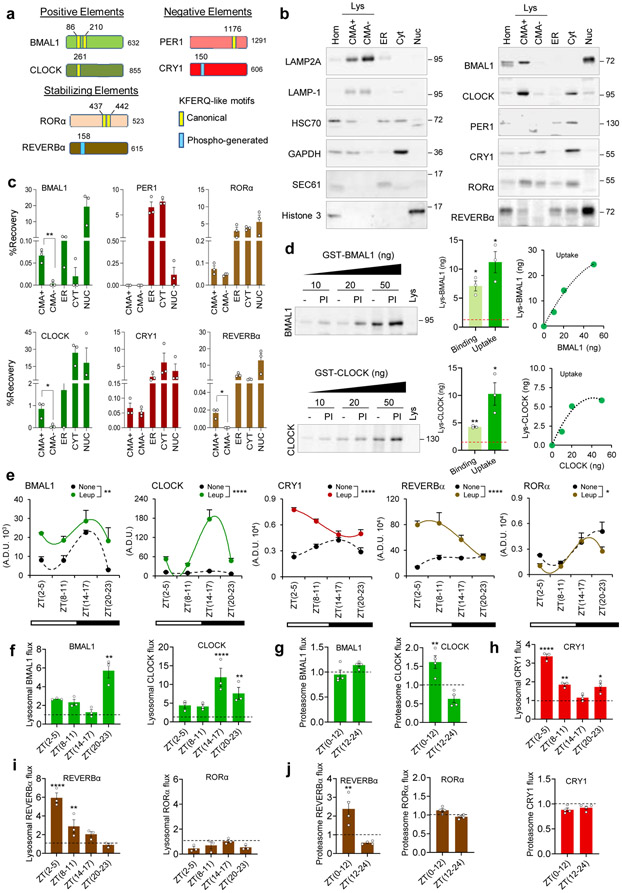
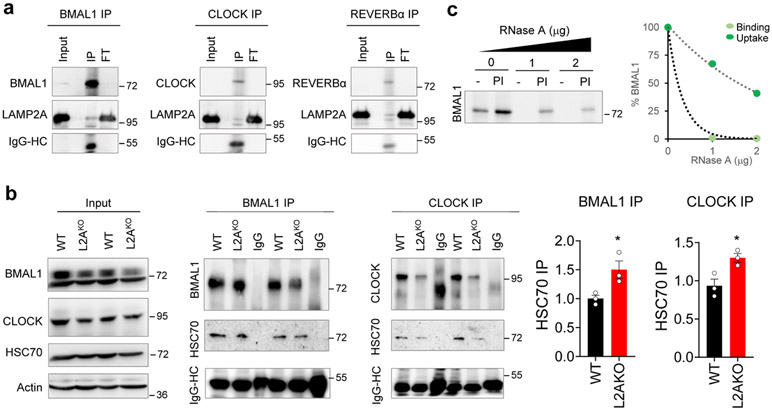
Most clock proteins bear pentapeptide motifs21 for CMA lysosomal targeting (Fig. 1a). We found preferential association of BMAL1 and CLOCK with the sub-group of rat liver lysosomes active for CMA (contain HSC70 and the CMA substrate GAPDH) isolated during the cycle’s light phase compared with lysosomes involved in other types of autophagy (which contain LAMP2A but not HSC7022, 23) (Fig. 1b shows 2.2±0.1 fold and 6.3±0.8 fold enrichment for BMAL1 and CLOCK in CMA-active lysosomes, respectively and Fig. 1c shows the percentage of cellular amount of each clock component recovered in lysosomes after correcting by the total volume of each fraction). REVERBα was also only detected in CMA-active lysosomes, albeit at lower levels, CRY1 and RORα displayed equal distribution between CMA-active and -inactive lysosomes and PER1 did not associate with lysosomes at this time (Fig. 1b,c). Clock proteins with higher association with CMA-active lysosomes interacted with cytosolic HSC70 and L2A at this time (Extended Data Fig. 1a,b). Using isolated intact lysosomes in vitro to recapitulate CMA binding and uptake steps23, we found that, as other CMA substrates, both BMAL1 and CLOCK can be directly taken up by lysosomes in a saturable fashion (Fig. 1d) and their lysosomal association is competed by co-incubation with the CMA substrate RNase A (Extended Data Fig. 1c), supporting that they all use the same CMA internalization lysosomal complex. Thus, BMAL1 and CLOCK fulfill all the criteria of CMA substrates: presence of a KFERQ-like targeting motif, preferential association with CMA-active lysosomes, binding to HSC70 and LAMP2A, and direct translocation into isolated lysosomes, where other proteolytic systems are absent16.
Fig. 1. Components of the molecular clock are degraded in lysosomes via CMA.
a, Canonical (yellow) and phosphorylation generated (blue) CMA-targeting motifs in mammalian clock proteins. b, Immunoblot for circadian clock proteins in rat liver homogenates (Hom), lysosomes (Lys) active (+) or not (−) for CMA, ER, cytosol (Cyt) and nuclear fractions (Nuc). Left: markers for lysosomes (LAMP2A and LAMP1), CMA+ lysosomes (HSC70), cytosol (GAPDH), ER (SEC61) and nucleus (Histone 3). c, Percentage of the positive (green), negative (red) and stabilizing (brown) clock elements recovered in each fraction relative to their total cellular content. n=3 rats. d, Immunoblot of BMAL1 (top) and CLOCK (bottom) associated with lysosomes pre-incubated or not with protease inhibitors (PI) and then incubated with recombinant BMAL1 and CLOCK. Lysosomal binding and uptake (middle) and uptake upon incubation with increasing protein concentrations (right). n=3 independent experiments. e-j, Temporal changes of clock elements in lysosomes from mice injected or not with leupeptin (e, f, h, i) or in homogenates of mice injected or not with MG262 (g, h, j) calculated from blots in Extended Data Fig. 2f, i, respectively. n=3 mice per CT and treatment in e-j. Individual values (c,d,f-j) and mean±s.e.m are shown. One-way ANOVA was used in c to determine differences in recovery among fractions and unpaired two-tailed t test (shown here) to determine differences between CMA+ and CMA− lysosomes. One sample t and Wilcoxon test with hypothetical value of 1 for binding and uptake was used in d. Two-way ANOVA followed by Bonferroni's multiple comparisons post-hoc test was used in e-j. Significant differences between untreated and leupeptin treated samples are shown in e (graph legend) and the specific times at which flux was significantly different are marked in f-j. Statistical analysis was performed in all panels but only significant differences are labeled in the graphs as significant for *p<0.05, **p<0.01 and ****p<0.0001. Numerical source data, statistics and exact p values and unprocessed blots are available as source data.
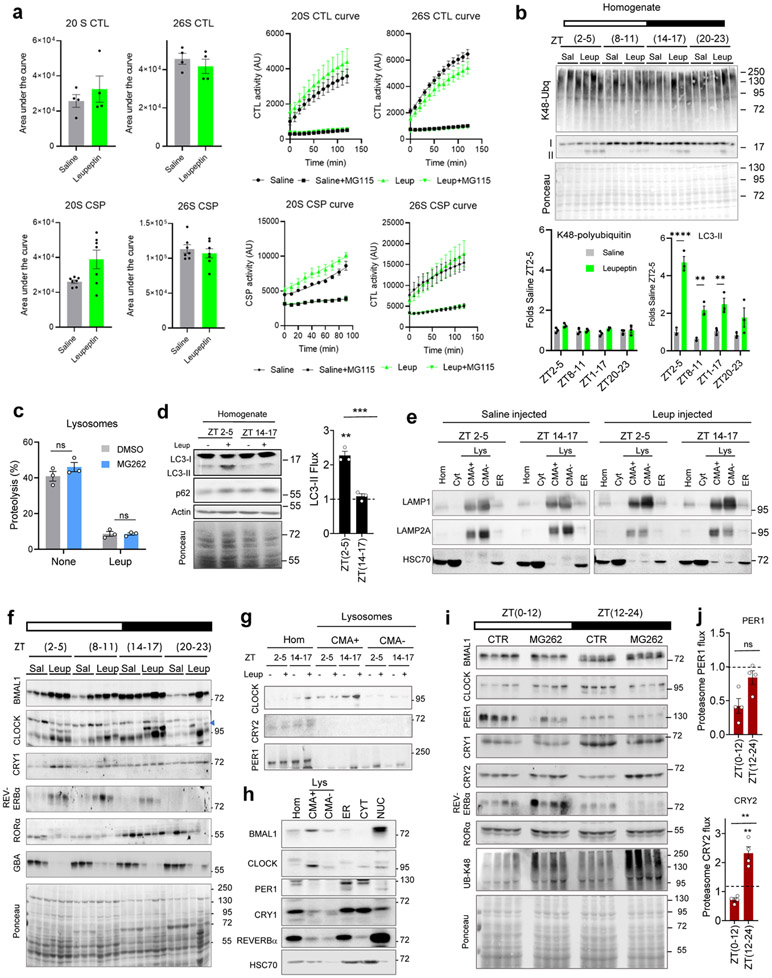
Degradation of several circadian proteins through the ubiquitin-proteasome system24-28 and macroautophagy has been reported14,15 using different experimental models under various conditions, thus making difficult to determine in vivo timing and relative contribution of each of these proteolytic pathways under physiological conditions. CMA has not been previously taken into consideration. We analyzed proteasome and lysosomal degradation of clock elements in liver under physiological conditions (normal 12:12 light and dark cycle) at different times (Zeitgeber times (ZT)) in mice injected with leupeptin, to block lysosomal proteolysis, or with the proteasome inhibitor MG262. We confirmed that leupeptin did not inhibit proteasome-mediated proteolysis (Extended Data Fig. 2a,b) and MG262 did not modify lysosomal proteolytic capacity (Extended Data Fig. 2c). Degradation of macroautophagy proteins LC3-II and p62, used as positive control for leupeptin efficacy, confirms the previously described higher macroautophagy activity during the light cycle29. Lysosomes isolated from livers of mice injected or not with leupeptin allow measuring degradation of any protein by its increase in the leupeptin-treated lysosomes relative to untreated. As previously described23, leupeptin prevents the rapid degradation of HSC70 in CMA− lysosomes making its levels comparable to CMA+ lysosomes (Extended Data Fig. 2e). We found that the time of maximal lysosomal degradation was different for each clock component in support of selectivity in their lysosomal targeting (Fig. 1e,f,h,i and Extended Data Fig. 2f). Lysosomal degradation of BMAL1 and CLOCK was primarily nocturnal, while degradation of REVERBα, an inhibitor of BMAL1 transcription, is diurnal (Fig. 1e,f,i). CRY1 degradation, also more noticeable in the light period (Fig. 1e,h), occurs likely through two autophagic pathways, considering CRY1 equal abundance in CMA-active and -inactive lysosomes (Fig. 1b,c) and its reported macroautophagy degradation14. CRY2 and PER1 did not associate with lysosomes throughout the light/dark cycle (Extended Data Fig. 2g), and despite RORα cyclic lysosomal association, we did not detect its degradation at any time (Fig. 1e,i).The distribution of clock proteins between CMA-active and inactive lysosomes during the dark period (Extended Data Fig. 2h) revealed still a clear preference of BMAL1 and CLOCK for CMA-active lysosomes, but not of REVERBα (Extended Data Fig. 2h), in agreement with its higher lysosomal degradation during the day (Fig. 2i).
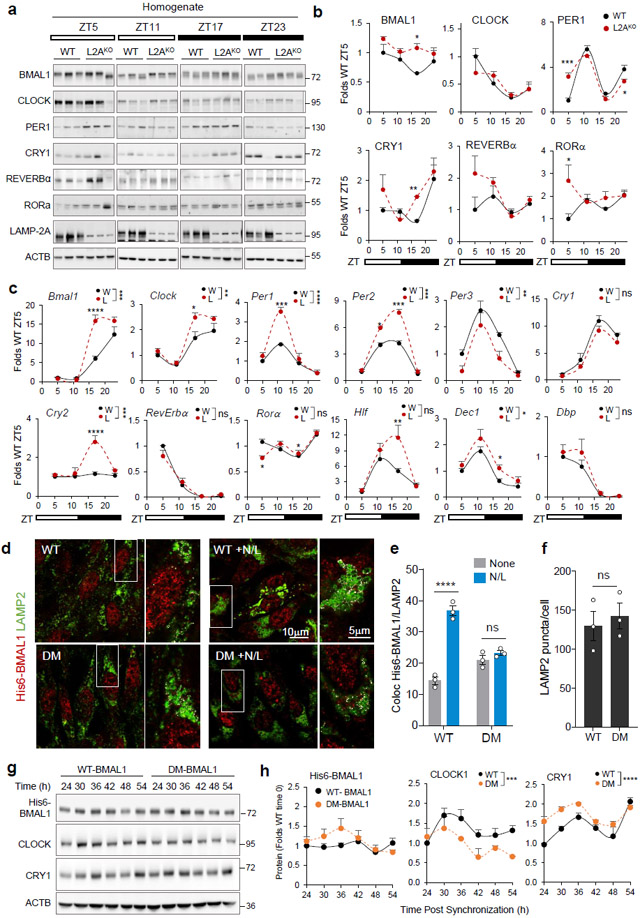
Fig. 2. Blockage of CMA disrupts the molecular clock.
a, Immunoblot of wild-type (WT, W) and LAMP2A knockout mice (L2AKO, L) livers collected at the indicated Zeitgeber times (ZT). Actin is shown as loading control, and LAMP2A to confirm KO. (Note: the anti-L2A antibody recognizes a non-specific protein in liver30, 31). ZT5 and ZT17 samples and ZT11 and ZT23 samples were run in the same membrane and all membranes contained a common sample for normalization across membranes. b, Temporal changes of clock proteins in a expressed as fold levels in WT at ZT5. n=3 mice per ZT and genotype. c, Temporal changes in clock components mRNA levels in the same animal groups as a. Values were normalized to TBP as housekeeping gene and are expressed as fold levels in WT at ZT5. n=3 mice per ZT and genotype. d, Immunofluorescence for LAMP2 (green) and His6 tag (red) in NIH3T3 cells stably expressing wild-type (WT) BMAL1 histidine tagged (His6) or the same protein mutated in its two CMA-targeting motifs (DM). Where indicated 20mM NH4Cl, 100μM leupeptin (N/L) was added to prevent lysosomal proteolysis. Insets: boxed area with colocalized pixels (white) at higher magnification. e, f, Fraction of His6-BMAL1 colocalizing with LAMP2 (Mander’s Coefficient - M1) (e) and average number of LAMP2 fluorescent puncta (f) in cells as in d. n=3 independent experiments (30 cells were quantified per experiment and the mean value of puncta per cell per experiment was used for statistics). g, Immunoblot for clock elements in cells expressing WT or DM-BMAL1 collected at the indicated times after dexamethasone-synchronization. Actin is shown as loading control. h, Levels of the indicated clock elements in experiments as in g. n=4 independent experiments. Individual values (e,f) and mean±s.e.m are shown. Unpaired two tailed t test was used in f and two-way ANOVA followed by Bonferroni’s multiple comparison post-hoc tests in b, c, e and h. Significant differences by genotype or mutation are indicated in the legends in c and g, respectively. Differences were significant for *p<0.05, **p<0.01, ***p<0.001 and ****p<0.0001. ns = not significant. Numerical source data, statistics and exact p values and unprocessed blots are available as source data.
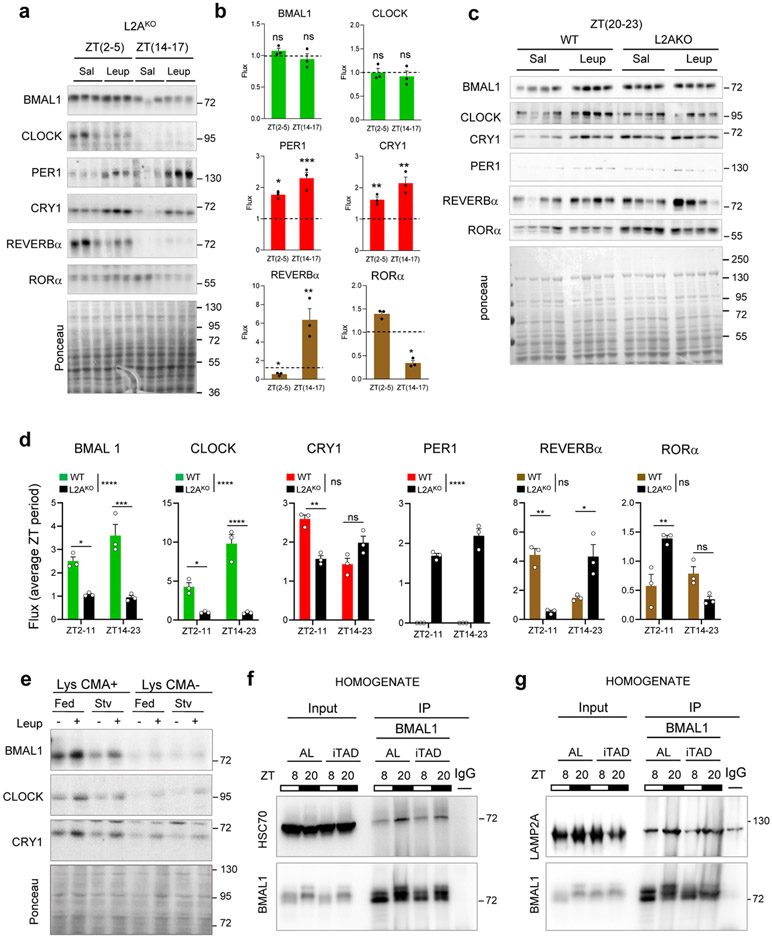
To confirm the contribution of CMA, we performed similar experiments in CMA-deficient mice (L2AKO)30, 31 and found lysosomal degradation of CLOCK and BMAL1 completely abolished in these mice, while other elements are still degraded (Extended Data Fig. 3a-d). As previously shown for CMA substrates32, a higher fraction of CLOCK and BMAL1 remains bound to HSC70 in L2AKO mice due to the loss of the CMA receptor (Extended Data Fig. 1b). Interestingly, although REVERBα was still degraded in lysosomes, we noticed a shift from the light to the dark period (Extended Data Fig. 3d), supportive of its rerouting from one autophagic pathway to another in these mice.
In contrast to the coupling of nutrition and circadian clock of macroautophagy33, CMA degradation of clock proteins is not nutritionally regulated as: i) it occurs at different points through the light/dark cycle; ii) the nocturnal degradation of BMAL1 and CLOCK in CMA-active lysosomes did not change if animals were starved for 24h (Extended Data Fig. 3e); iii) in animals under time-restricted feeding (fed at two times during the day ZT1-3 and ZT10-12 both, outside the early nocturnal time when ad libitum animals consume 85% of their food) interaction of BMAL1 with the CMA components (LAMP2A and HSC70) was, expectedly, higher at the nocturnal time when BMAL1 is preferentially degraded by CMA (Extended Data Fig. 3f,g).
After inhibition of the proteasome for 12h, minimum time previously reported required to see degradation of clock proteins34, we did not find proteasome-dependent degradation in liver for BMAL1, RORα, CRY1, or PER1, despite proteasomal inhibition being four times longer than inhibition of lysosomal proteolysis (Fig. 1g,h,j and Extended Data Fig. 2i,j) . CRY2 was efficiently degraded by the proteasome in the dark period and CLOCK during the light period, in contrast with its observed nocturnal lysosomal degradation. REVERBα was the only analyzed protein that was degraded by both pathways during the light period, but proteasomal degradation was only a third of the amount degraded by lysosomes (Fig. 1i,j and Extended Data Fig. 2i). These findings support cooperation among different proteolytic systems in the control of cycling of hepatic circadian clock proteins and a prominent role for CMA in the degradation of positive clock elements.
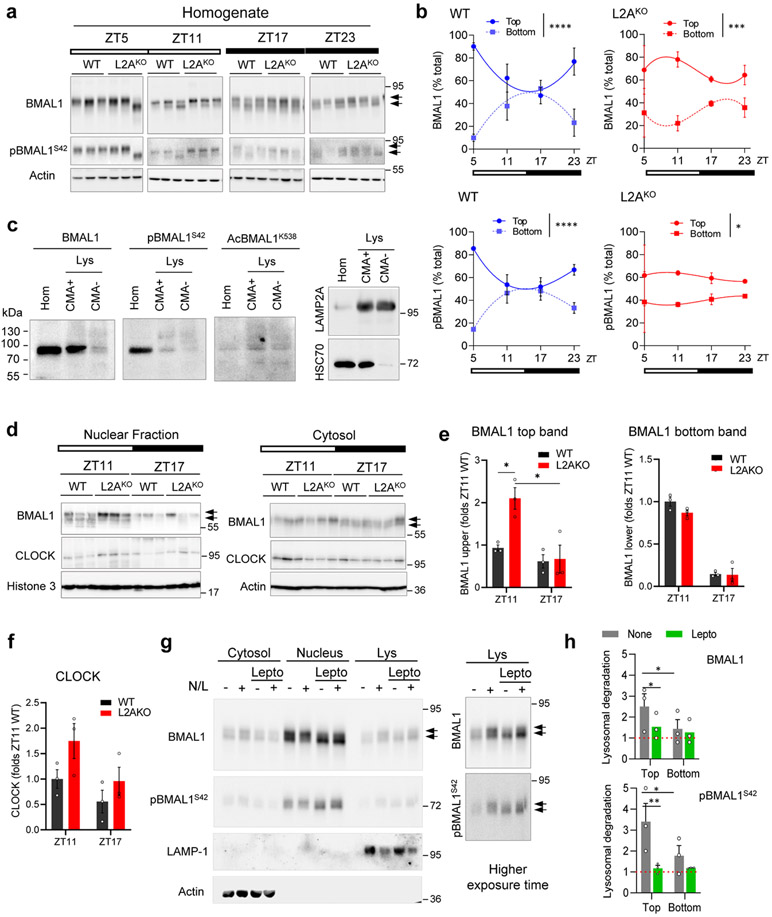
To characterize the pool of BMAL1 targeted for CMA, we analyzed the electrophoretic properties of BMAL1 that resolved as two bands of different molecular weight (~10kDa apart). The relative contribution of these two bands to the total cellular BMAL1 content changed with the light/dark cycle in control mice but displayed attenuated fluctuation in L2AKO mice livers (Fig. 2a, shown also in Extended Data Fig. 4a,b for comparative purposes). Extensive phosphorylation (22 sites) of BMAL135 regulates its nuclear shuttling, transcriptional and translational activities and stability36. Both BMAL1 bands were recognized by an antibody against pBMAL1S42, a phosphorylation detected in BMAL1 translocating from the nucleus to cytoplasm36 (Extended Data Fig. 4a,b). However, since i) the most noticeable increase in L2AKO livers was in the top BMAL1 band, and this increase was less pronounced for pBMAL1S42, and ii) the enrichment of BMAL1 in CMA-active lysosomes was less evident for pBMAL1S42 (Extended Data Fig. 4c), we concluded that this phosphorylation may not be linked to BMAL1 CMA degradation. Acetylation of BMAL1 in lysine 538, known to modulate its function and phosphorylation state37,38, did not seem to contribute to its CMA targeting either since AcBMAL1K538 distributed equally between CMA-active and -inactive lysosomes (Extended Data Fig. 4c). The higher molecular weight form of BMAL1 and CLOCK in L2AKO mice livers at ZT11 accumulate preferentially in the nuclear fraction, but not the cytosol (Extended Data Fig. 4d-f), supporting that the increase in nuclear BMAL1 was not a mere consequence of higher cytosolic content, but rather it was the one undergoing CMA degradation. In fact, blockage of nuclear export with leptomycin in cultured cells significantly reduced the amount of BMAL1 degraded in lysosomes, mostly of the higher molecular weight form (Extended Data Fig. 4g,h). Similar nuclear retention upon CMA blockage has been described for another nuclear CMA substrate, Chk139, in support of tight coordination of nuclear export of CMA substrates with CMA capacity.
Blockage of CMA disrupts the circadian clock
Livers of the L2AKO mice30, 31 displayed alterations in content and day/light cycle changes for several of the circadian proteins (Fig. 2a,b). Accumulation of BMAL1 and REVERBα in CMA-incompetent livers peak at the times of their maximal lysosomal degradation in wild-type mice (Fig. 1f,i). Levels of PER1 or RORα, that do not undergo CMA degradation (Fig. 2a,b), were also altered L2AKO mice, likely as secondary result of the transcriptional dysregulation associated with BMAL1 level changes. L2AKO mice displayed abnormal transcriptional cycling of circadian genes whose expression has been shown to oscillate in circadian manner in the liver40 (Fig. 2c).
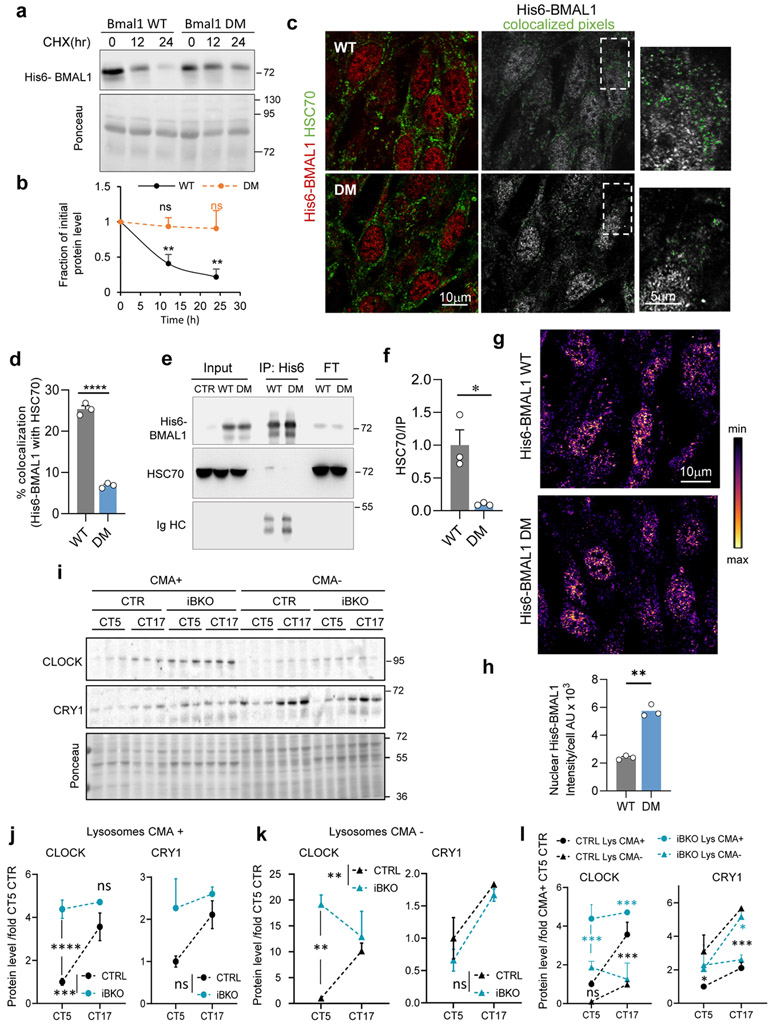
Failure to degrade the positive circadian elements by CMA was sufficient to alter circadian protein rhythm. We prevented CMA of the single non-redundant circadian protein BMAL1 in vitro by mutating its two canonical CMA-targeting motifs (86QIEKR90) and (210KVKEQ214) (double mutant; DM) (Fig. 2d-h and Extended Data Fig. 5). When expressed in cells, DM-BMAL1 was more stable than WT BMAL1 (Extended Data Fig. 5a,b) due to its lower degradation in lysosomes, as lysosomal abundance (colocalization with LAMP2) of WT-BMAL1 but not DM-BMAL1 increased upon inhibition of lysosomal proteolysis (Fig. 2d-f). As expected, DM-BMAL1 also showed reduced colocalization and binding with HSC70 (Extended Data Fig. 5c-f). Reduced CMA degradation of DM-BMAL1 associated with higher nuclear levels (Extended Data Fig. 5g,h) and subsequent differences in levels and cycling for CLOCK and CRY1 in circadian-synchronized cells expressing DM-BMAL1, when compared to cells expressing WT-BMAL1 (Fig. 2g,h). Changes in cycling of CLOCK and CRY1 induced by DM-BMAL1 are not due to BMAL1 being required for their lysosomal degradation, as CLOCK and CRY1 are still detected in lysosomes even in absence of BMAL1 (isolated from the inducible Bmal1 knockout mouse (iBKO)) (Extended Data Fig. 5i-l). The increased cycling amplitude of CRY1 (Fig. 2g,h) is likely due to direct transcriptional upregulation by DM-BMAL1 accumulating in the nucleus (Extended Data Fig. 5g,h); whereas the consistently lower CLOCK levels and reduced cycling amplitude (Fig. 2g,h) could be a combination of similar BMAL1-dependent transcriptional changes in Clock expression, along with the reported effect of BMAL1 on CLOCK protein stability, whereby heterodimerization CLOCK-BMAL1 drives its degradation41.
Overall, these findings confirm that failure to degrade BMAL1 via CMA is sufficient to change the cycling properties of the clock elements, in support of a regulatory role of CMA on the circadian clock.
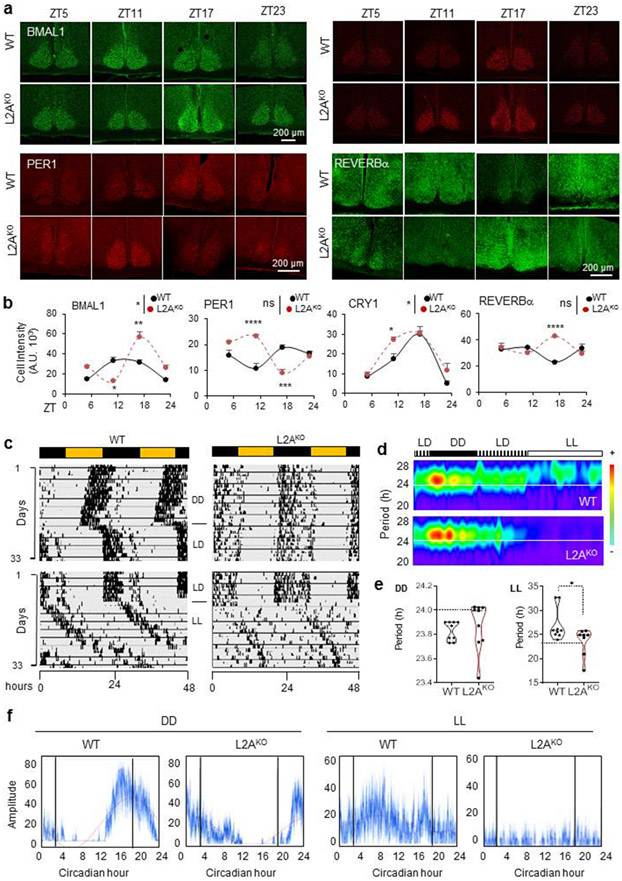
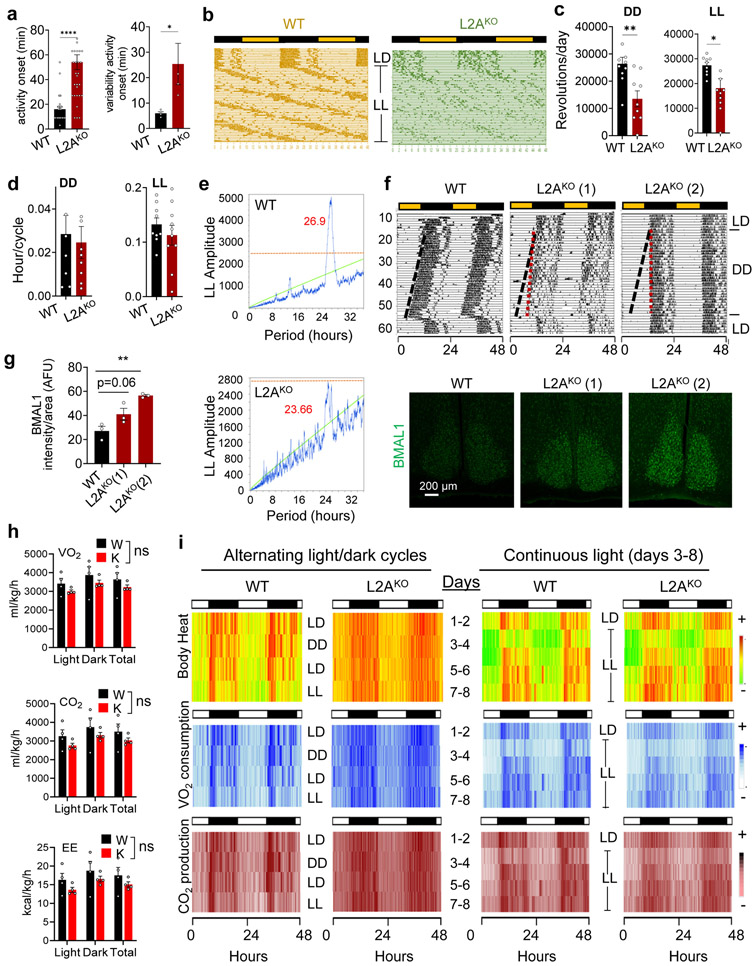
Since abundance and cycling levels of BMAL1, CRY1, PER1, and REVERBα were also altered at specific times in L2AKO mice suprachiasmatic nucleus (SCN), the central circadian pacemaker (Fig. 3a,b), we compared the circadian behaviors of L2AKO mice in running wheels under free running period42. L2AKO mice displayed overall less activity, decreased robustness of activity rhythm and reduced adaptation in the absence of light cues (Fig. 3c-f and Extended Data Fig. 6a-d). Instead of shortening and lengthening of the free running period in continuous dark or light, respectively, the period persisted close to 24h in L2AKO mice (Fig. 3e and Extended Data Fig. 6e show weaker periodicity peaks in L2AKO mice). We found association between the severity of the behavior phenotype in L2AKO mice and their BMAL1 abundance in SCN (Extended Data Fig. 6f,g). At 4 months, L2AKO mice do not show yet any overt metabolic phenotype when maintained in normal diet and 12h light/dark cycle, with an average O2 consumption, CO2 production and energy expenditure comparable to WT (Extended Data Fig. 6h). However, heatmap of the average values for each experimental group revealed less defined cyclic transitions and failure to adapt to changes in light:dark periodicity in several metabolic parameters, even more pronounced in mice maintained in continuous light (Extended Data Fig. 6i).
Fig. 3. CMA-defective mice display disturbances in circadian patterns.
a, Immunostaining for BMAL1, PER1, CRY1 and REVERBα in the suprachiasmatic nucleus region (SCN) of brains of wild-type (WT) or LAMP2A knockout mice (L2AKO) at the indicated Zeitgeber times (ZT). b, Quantification of the average fluorescent intensity per cell in the SCN area in images as the ones shown in a. n=3 mice per ZT and genotype. c, Double-plotted actograms of WT and L2AKO mice subjected to the light manipulations indicated in the middle for the number of days indicated on the left. LD, 12:12 light:dark; DD, continuous dark; LL, continuous light. d, Representative Morlet Wavelet of WT and L2AKO mice under the same conditions as in c. e, Average free running circadian period in the DD (left) and LL (right) cycles. n=9 WT mice per condition and 9 (for DD) and 8 (for LL) L2AKO mice. f, Representative activity profile of WT and L2AKO mice for an average 10 cycle in DD (left) or LL (right). The red line is a sine-fit to the waveform indicating the rhythm of these mice. Individual values (e) and mean±s.e.m are shown. Unpaired two-tailed t test was used in e and two-way ANOVA test followed by Bonferroni’s multiple comparisons test post-hoc test was used for b. Significant differences by genotype across the ZT are shown in the legends. Differences were significant for *p<0.05, **p<0.01 and ****p<0.0001. ns = not significant. Numerical source data, statistics and exact p values are available as source data.
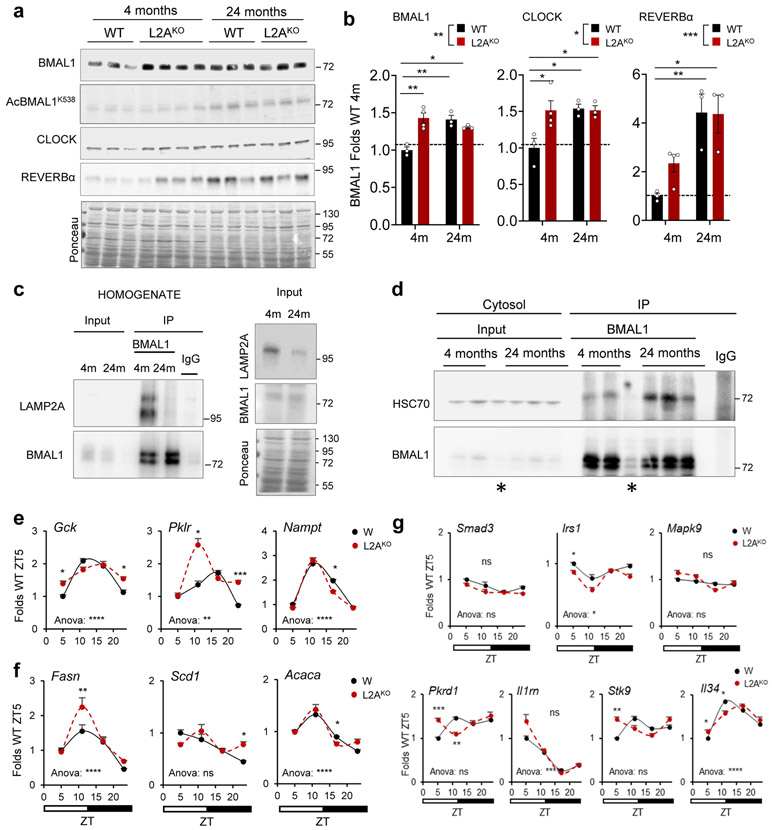
Since CMA activity decreases with age30,43,44 and CMA-deficient mice phenocopy features of aging30, 45-47, we investigated the relation between CMA decline and circadian disturbances in aging. Added to the circadian behavior similarities between L2AKO mice and old WT mice (reduced activity, increased fragmentation, and longer onset time (Fig. 3c-f and Extended Data Fig. 6)), we found that young L2AKO mice recapitulated changes in clock protein levels of old mice (Extended Data Fig. 7a,b). However, they did not display the previously reported increase in AcBMAL1K538 with age48 observed in the WT old mice (3.2±.17 folds increase) further confirming that CMA of BMAL1 is independent of its acetylation state (Extended Data Fig. 7a). In agreement with reduced CMA of BMAL1 with age, we found a marked reduction in the amount of BMAL1 bound to L2A in old mice (Extended Data Fig. 7c; note the lower total L2A levels in old mice responsible for reduced CMA with age43, 44). As for other CMA substrates31, 32, a higher fraction of BMAL1 remained bound to HSC70 in old mice, due to lower ability of lysosomes to perform CMA (Extended Data Fig. 7d). Furthermore, young L2AKO mice reproduced part of the described adaptive reprograming of the circadian transcriptome in liver of old mice49,50 with 10 out of 13 selected representative genes with known reprogramed circadian expression in old mice49, 50 also displaying changes in young L2AKO mice livers (Extended Data Fig. 7e-g).
In summary, young L2AKO mice phenocopy aspects of aging circadian dysregulation in support that age-dependent CMA decline may contribute to circadian disruption in old organisms.
CMA circadian activity is under BMAL1 regulation
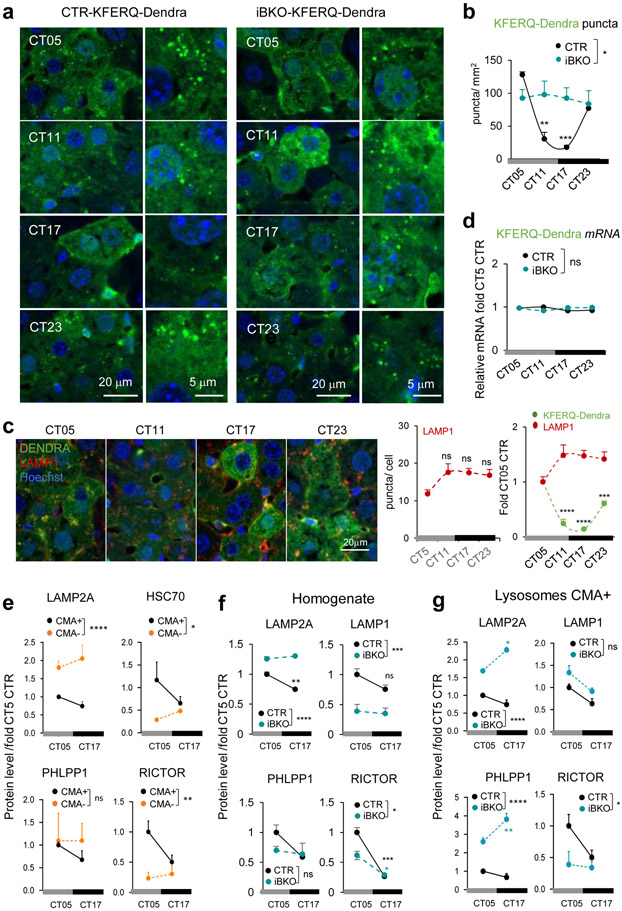
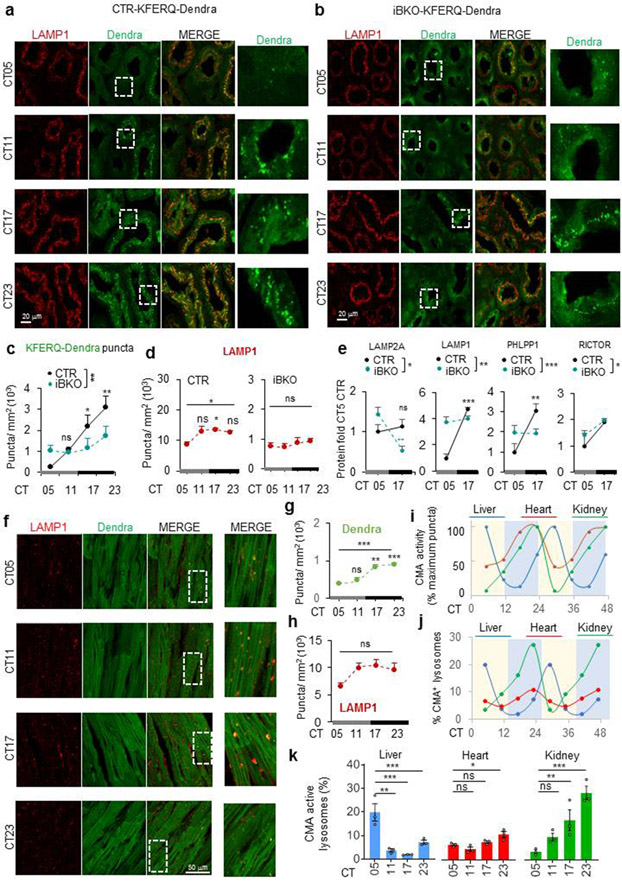
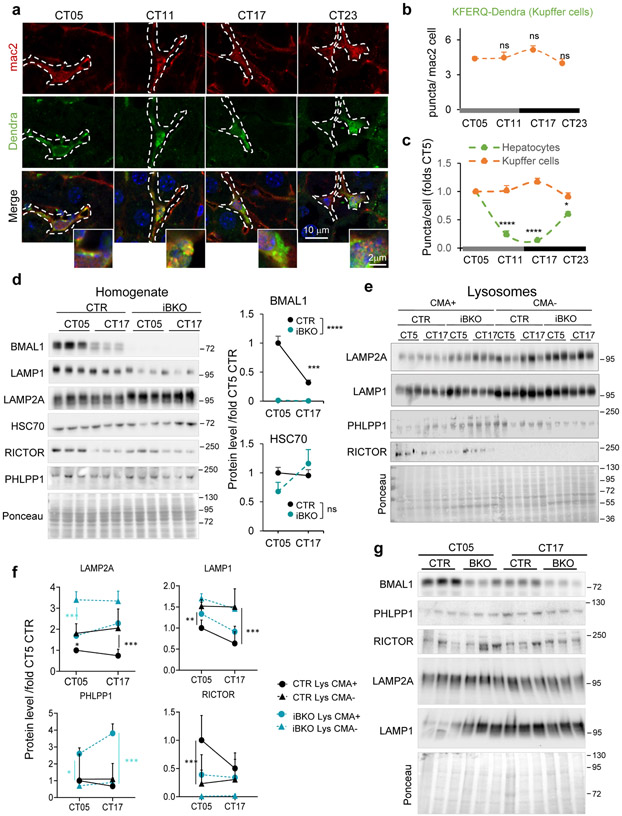
To further understand the CMA and circadian clock relationship, we analyzed if CMA activity was circadian taking advantage of the recently developed CMA reporter mouse model (KFERQ-Dendra mouse)51. All experiments were performed in the absence of light cues to determine true circadian changes in CMA activity. Hepatocyte CMA activity, quantified as the association of the fluorescent CMA reporter with lysosomes (Dendra+ puncta per cell), changed across circadian time (CT; complete darkness) with zenith and nadir around CT5 and CT17, respectively (Fig. 4a,b), which differs from the reported diurnal zenith for hepatic macroautophagy52. Co-staining with the endolysosomal marker LAMP1 confirmed Dendra+ puncta as lysosomes and relatively constant number of hepatocyte lysosomes throughout the cycle (Fig. 4c). Interestingly, other hepatic cells such as Kupffer cells (mac2+) displayed relatively constant CMA activity throughout the circadian cycle (Extended Data Fig. 8a-c).
Fig. 4. CMA displays BMAL1-dependent circadian activity in liver.
a, Immunofluorescence for Dendra in liver sections from KFERQ-Dendra mice control (CTR) or knockout for BMAL1 (iBKO) at the indicated circadian times (CT). Nuclei are highlighted with DAPI. Right shows higher magnification inserts. b, Quantification of the number of Dendra+ puncta per mm2 of liver section in images as the ones shown in a. n=4 mice per CT and genotype. c, Immunofluorescence for Dendra (green) and LAMP1 (red) in liver sections from KFERQ-Dendra mice at the indicated circadian times (CT). Nuclei are highlighted with Hoechst staining. Right: quantification of the number of LAMP1+ puncta per cell section and LAMP1+ and Dendra+ puncta expressed as fold in CT5 (arbitrary value of 1). n=3 mice per CT and genotype. d, Dendra mRNA levels normalized to TBP as housekeeping gene in the same livers at the indicated times. Values are expressed relative to values at CT05 that was given a value of 1. n=4 mice per CT and genotype. e, Levels of the indicated proteins in CMA active (+) and inactive (−) lysosomes isolated from control mice at CT05 and CT17 calculated by densitometry of blots as the ones shown in Extended Data Fig. 8e. n=6 mice per CT. f, g, Levels of the indicated proteins in total liver homogenates (f) and in CMA-active lysosomes (g) isolated from livers of CTR and iBKO mice at CT05 or CT17 calculated by densitometry of blots as the ones shown in Extended Data Fig. 8d and e, respectively. Values are shown relative to values in CTR mice at CT05. n=6 mice per CT and genotype (in f and g). All values are mean+s.e.m. Two-way ANOVA test followed by Tukey HSD post-hoc tests (c left, e-g) or by Bonferroni’s (b,c right and d) or Tukey’s (e-g) multiple comparisons post-hoc tests were used. Significant differences between lysosomal type or genotypes are shown in the legends and between times in the graphs. *p<0.05, **p<0.01, ***p<0.001 and ****p<0.0001. ns = not significant. Numerical source data, statistics and exact p values are available as source data.
Disruption of the circadian clock, by crossing the KFERQ-Dendra mice with an inducible Bmal1 knockout mouse (iBKO), led to loss of liver rhythmic CMA activity, in support of bidirectional CMA/circadian clock regulation (Fig. 4a,b and Extended Data Fig. 8d-f). Dendra expression did not change across time or genotype in support of degradation being responsible for the observed rhythmicity (Fig. 4d). Lower lysosomal levels of LAMP2A and HSC70 and of the CMA positive regulator PHLPP1/SCOP (SCN circadian oscillatory protein) coincided with the nadir of CMA activity at CT17 (Fig. 4e). Unexpectedly, lysosomal levels of the negative CMA regulator RICTOR were also lower at this time-point (Fig. 4e), following its overall cellular decrease (Fig. 4f) and suggesting that nutritional and circadian CMA are under different negative regulators. Changes in lysosomal LAMP2A, PHLPP1 and RICTOR levels are unique for the CMA-active lysosomes and differ from those in other lysosomal subpopulations (Fig. 4g and Extended Data Fig. 8e,f). Changes in CMA effectors were almost abolished or followed a reverse pattern in iBKO livers (Fig. 4f,g and Extended Data Fig. 8f), where interestingly, overall levels of LAMP2A (but not LAMP1) and PHLPP1 were consistently higher than WT (Fig. 4f,g and Extended Data Fig. 8f).
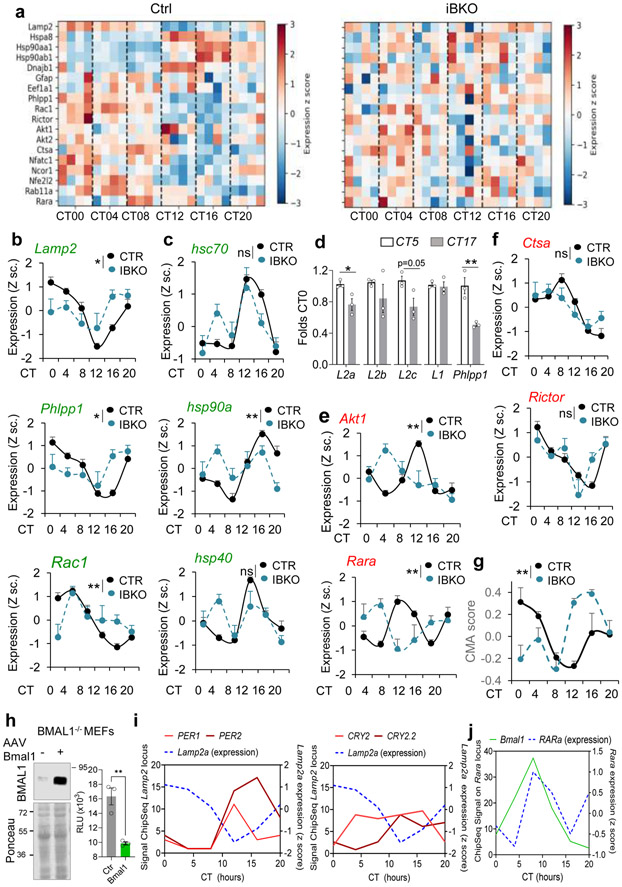
Contrary to the predominantly posttranscriptional regulation of CMA by nutrients53, circadian CMA activity seems to be transcriptionally regulated. Analysis of expression of genes involved in CMA54 from an RNA-Seq dataset of livers from mice kept under constant darkness55 confirmed cycling properties for both effectors and regulators (Fig. 5a-e). Decreased transcription of specific effectors, such as PHLPP1, Rac1 and Lamp2a (but not other Lamp2 isoforms or Lamp1 that are not required for CMA) (Fig. 5a-d) and upregulation of two negative CMA regulators (RARα and AKT1) (Fig. 5e,f) precedes the CMA activity decrease at CT17. Using a recently developed algorithm that predicts the CMA output from the transcriptional expression of each component of the CMA network45, we confirmed cycling of the CMA transcriptional program whose changes precede (about 4h) (Fig. 5g) changes in CMA activity (Fig. 4a,b). The impact of BMAL1 ablation on the CMA transcriptional network, was not homogeneous, with some CMA components displaying changes in transcriptional amplitude and/or a temporal shift while others not being significantly altered (Fig. 5a-f). Loss of rhythmicity of CMA activity in the liver of the iBKO mice (Fig. 4a,b) is likely a consequence of this transcriptional desynchrony among positive and negative regulators of CMA that results in attenuated CMA transcriptional score right before the maximal CMA activity peak (Fig. 5g). Although CMA components are still transcribed in iBKO mice, and some of them even at higher levels, disruption of the CMA machinery stoichiometry (also supported by the protein data in Fig. 4g), likely leads to CMA rhythmicity loss.
Fig. 5. BMAL1 regulates circadian CMA activity in liver at the transcriptional level.
a, Heatmap of the transcriptional activity of CMA-related genes from RNA-seq data of livers from control mice (CTR) and mice knockout for BMAL1 (iBKO) kept under constant darkness36. b-f, Normalized expression of known CMA effectors (b and c) and negative regulators (e and f), from the mice in a. n=4 mice per CT and genotype (in b,c,e,f and g). mRNA levels for the indicated spliced variants of Lamp2 in livers of mice at the circadian times of maximal and minimal CMA activity (d). Transcription changes for Lamp1 as an example of other lysosomal membrane proteins and PHLPP1 as a positive control of cycling genes are shown. Values are expressed relative to those in CT5 (arbitrary value of 1). n=3 mice per CT. g, CMA activation score in the same animals as in a, calculated from the transcriptional expression of the components of the CMA network. n=3 mice per CT and genotype. h, Lamp2a promoter expression in Bmal1-deficient MEFs co-transfected with a Lamp2a promoter luciferase reporter plasmid and a control plasmid or a plasmid overexpressing Bmal1 (+). Immunoblot for BMAL1 in the transfected cells (left) and luciferase activity measured 16h post-transfection (right). Values are expressed as relative luciferase units (RLU). n=3 independent experiments. i, Binding of the negative circadian elements PER1, 2 (left) and CRY2 (two binding sites) to the lamp2 locus in mouse liver. Signals for ChipSeq experiments as reported in56 at different time points. Expression of Lamp2a at the same times is shown as blue discontinuous line. j, Binding of Bmal1 to the RARα locus in mouse liver. Signals for ChipSeq experiments as reported in56 at different time points. Expression of RARα at the same times is shown as blue discontinuous line, n=3 mice per CT in i and j. Individual values (d,h) and mean±s.e.m are shown. Two-way ANOVA test to determine significance of the interaction between time and genotype (b,c,e,f,g) and unpaired two tailed t test (d, h) were used. *p<0.05, **p<0.01. ns = not significant. Numerical source data, statistics and exact p values and unprocessed blots are available as source data.
We found that BMAL1 is a negative regulator of lamp2a expression, as it repressed lamp2a transcription in cells expressing a luciferase reporter for the Lamp2 promoter39 (Fig. 5h). To identify the mediators of this repression, we analyzed data from previous ChipSeq experiments at different time points56 and found that the negative regulators PER1 and PER2, whose expression depends on BMAL1, bind the Lamp2 locus at the nadir of lower expression of Lamp2a (Fig. 5i; CRY2 binding is shown for comparison). Furthermore, we found that BMAL1 binds to the locus of the retinoic acid receptor alpha (Rara), a well-known negative regulator of CMA57, early in the light cycle, which coincides with the peak of maximum RARα expression and precedes decrease in Lamp2a expression (Fig. 5j). Our findings highlight that BMAL1 regulates the circadian changes in CMA activity through cyclic repression of Lamp2a, the limiting component of this pathway.
We found that the circadian properties of CMA are tissue and cell type-dependent. Instead of the CT5 zenith of CMA in hepatocytes, maximal CMA activity was detected at CT23 in kidney tubular cells and cardiac tissue (Fig. 6). Glomeruli CMA activity was instead negligible throughout the light/dark cycle. As in hepatocytes, CMA cycling was independent of changes in the number of endolysosomes in these tissues (Fig. 6d,h). However, we identified tissue-dependent differences in the fraction of total lysosomes engaged in CMA (LAMP1 vesicles also positive for KFERQ-dendra) (Fig. 6j,k). The highest percentage of CMA-active lysosomes was detected at their peaks of maximal CMA activity, whereas percentage of CMA-active lysosomes in heart remained unchanged during the light/dark cycle (Fig. 6j,k). Liver and kidney may reach their maximal CMA activation through recruitment of other lysosomes to perform CMA, as described before in other conditions58, but heart may rely more on increased activity per lysosome. We confirmed that BMAL1 was also required to maintain the circadian properties of CMA in kidney as kidneys from iBKO mice showed attenuated changes in CMA activity (Fig. 6b), and reverse patterns in the changes of cellular levels of CMA components such as LAMP2A and PHLPP1 (Fig. 6e and Extended Data Fig. 8g).
Fig. 6. Circadian cycling of CMA activity is tissue specific.
a-f, Immunofluorescence for Dendra and LAMP1 in kidney (a, b) and heart (f) sections from KFERQ-Dendra mice control (CTR) (a,f) or knockout for BMAL1 (iBKO) (b) at the indicated circadian times (CT). Individual and merged channels are shown. Right shows higher magnification inserts of the boxed area. Quantification of the number of Dendra+ (c, g) and of LAMP1+ puncta (d, h) per mm2 area in the tissues shown. n=3 mice per CT and genotype (in c and d) and per CT (in g and h). e, Levels of the indicated proteins in kidney homogenates of CTR and iBKO mice at CT05 or CT17 calculated by densitometry of blots as the ones shown in Extended Data Fig. 8g. n=6 mice per CT and genotpe. i, Changes in CMA activity throughout the circadian cycle in the indicated tissues relative to their maximum period of activity (that was given a value of 100). Data originates from images as the ones shown in Fig. 4a and Fig. 6a,f. n=3 mice per CT. j, k, Percentage of CMA-active lysosomes calculated as the fraction of LAMP1+ puncta also Dendra+ in liver, heart and kidney at the indicated times calculated from images as the ones shown in Fig. 4a and Fig. 6a,f. n=3 mice per CT. Data for each tissue (k) and overlapping of changes in CMA activity throughout the circadian cycles in the three tissues (j) are shown. Individual values (h) and mean±s.e.m are shown. One-way ANOVA test followed by Tukey’s (d,g,h) or Dunnett’s (k) multiple comparisons post-hoc and two-way ANOVA test followed by Tukey’s (c) or Sidak’s multiple comparisons post-hoc tests (e) were used. Significant differences among all conditions are shown above the line and of each time point with CT05 are shown in the graph. *p<0.05, **p<0.01 and ***p<0.001. ns = not significant. Numerical source data, statistics and exact p values are available as source data.
The circadian CMA-dependent sub-proteome
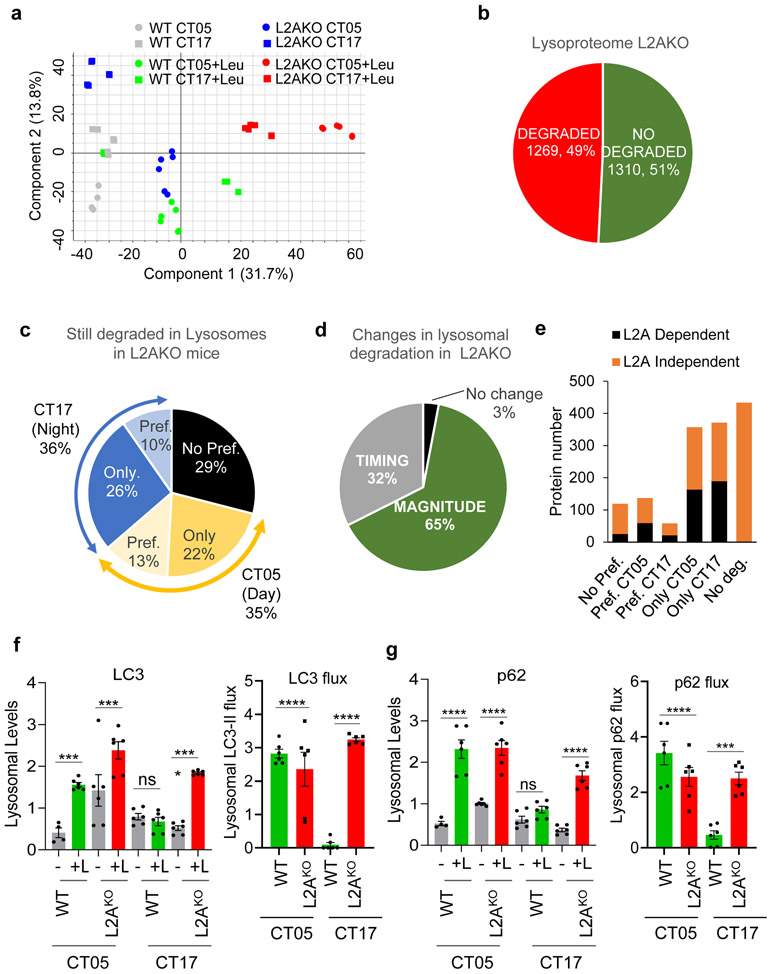
To gain a better understanding of the functional impact of CMA cycling and place it in the context of other types of lysosomal degradation, we performed quantitative differential proteomics of lysosomes isolated from livers of WT mice in absence of light cues at the points of maximal (CT5) and minimal (CT17) CMA activity, and from L2AKO mice, where we have previously demonstrated that lysosomal properties (integrity, pH, enzymatic load) and activity of other lysosomal proteolysis pathways (macroautophagy, endocytosis) remain fully functional31. Lysosomal protein degradation was detected as increase (≥1.5 fold) in protein abundance in lysosomes upon leupeptin injection and CMA substrates identified as those depending on L2A for this degradation.
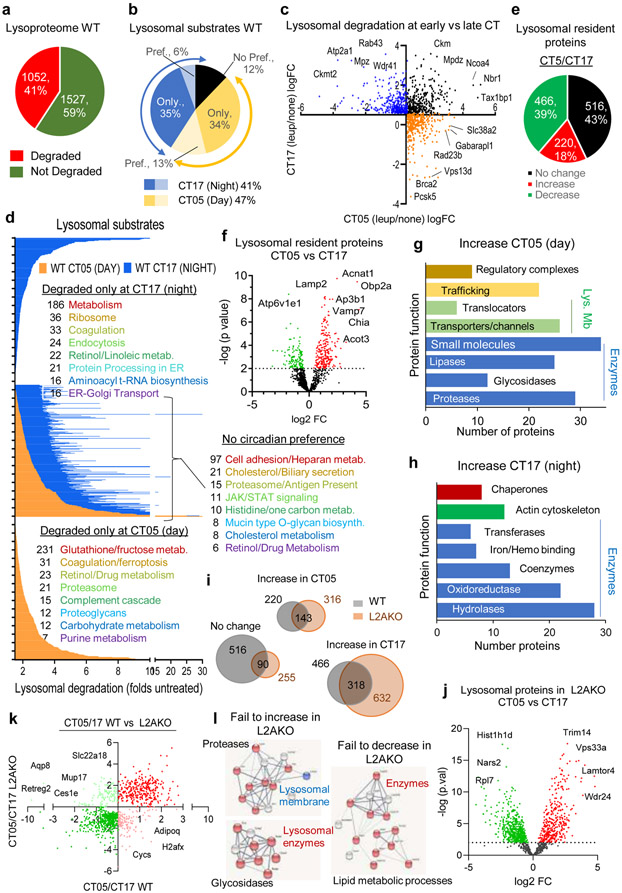
Out of the 2,579 proteins detected in lysosomes, 1,052 proteins were lysosomal substrates and of these, 12% did not show cyclic degradation, 47% were degraded preferentially at CT05 (with 34% only degraded in CT05) and 41% at CT17 (with 35% only degraded at CT17) (Fig. 7a,b). Despite similar in number (Fig. 7c), the type of proteins degraded in lysosomes in both phases was, for the most part, very different. STRING and IPA analyses demonstrated enrichment of proteins involved in cell adhesion/matrix remodeling, biliary secretion and antigen presentation among lysosomal substrates lacking a circadian pattern, whereas proteins involved in regulation of protein synthesis (protein processing in the ER, ribosome), coagulation and endocytosis were degraded at the early CT, and those involved in glucose metabolism, ferroptosis, and ubiquitin-proteasome pathway at the late CT (Fig. 7d and Supplementary Tables 1-3). Lysosomal constituents (detected in lysosomes but not degraded) also displayed cyclic changes in their abundance (Fig. 7e,f). Levels of some hydrolases (proteases, lipases, glycosidases), membrane proteins, associated proteins involved in vesicular trafficking, and components of the mTOR-lysosomal regulatory complex were higher early in the circadian cycle (Fig. 7g); whereas other enzymes, chaperones, and components of the actin cytoskeleton were detected at higher levels in CT17 (Fig. 7h and Supplementary Table 4).
Fig. 7. Cyclic changes in the lysosomal proteome and impact of CMA blockage on lysosomal-resident proteins.
Comparative proteomics of liver lysosomes from leupeptin injected or not mice isolated at CT05 (day) or CT17 (night). n=3 mice per CT and treatment (in a-h) and 3 mice per CT and genotype (in i-l). a,b, Percentage and number of proteins undergoing degradation (increase >1.5 folds after leupeptin treatment) (a) or showing preferential (Pref.) degradation or not during the day or night (b). c, Log2 fold change (LogFC) in lysosomal degradation rates in CT05 vs CT17. No preference for time of degradation (black) and degraded only during the day (orange) or night (blue). d, Degradation rate (as fold levels in lysosomes from untreated mice) of proteins in lysosomes isolated at CT05 (orange) or CT17 (blue). Enriched functional groups and number of proteins per group from proteins degraded at the indicated times is shown on the right. e-h, Lysosomal proteins that do not undergo degradation. Percentage and number of proteins detected at higher (red) or lower (green) levels during the day (e) and log2FC between CT05 and CT17 against their negative log10 transformed p values (f). Proteins with p>0.01 increasing (red) or decreasing (green) levels during the day. Enriched functional terms from lysosomal proteins with increased levels during the day (g) or the night (h). i-l, Comparison of lysosomal proteins that do not undergo degradation in WT and L2AKO mouse liver lysosomes isolated at CT05 (day) or CT17 (night). Venn diagram with number of proteins (i) and volcano plot of log2FC between CT05 and CT17 in L2AKO mice lysosomes (j). LogFC in levels of lysosome-resident proteins between CT05 and CT17 in WT compared to L2AKO mice (k). Proteins that increase during the day (red) or night (green) or fail to increase during the day (pink) or night (light green) in L2AKO mice. STRING analysis of functional terms of proteins with changing timing in their lysosomal abundance in L2AKO mice compared to WT mice (l). Unpaired two-tailed t test was used in f and j. All GO terms are statistically enriched with p<0.001. Numerical source data, statistics and exact p values are available as source data.
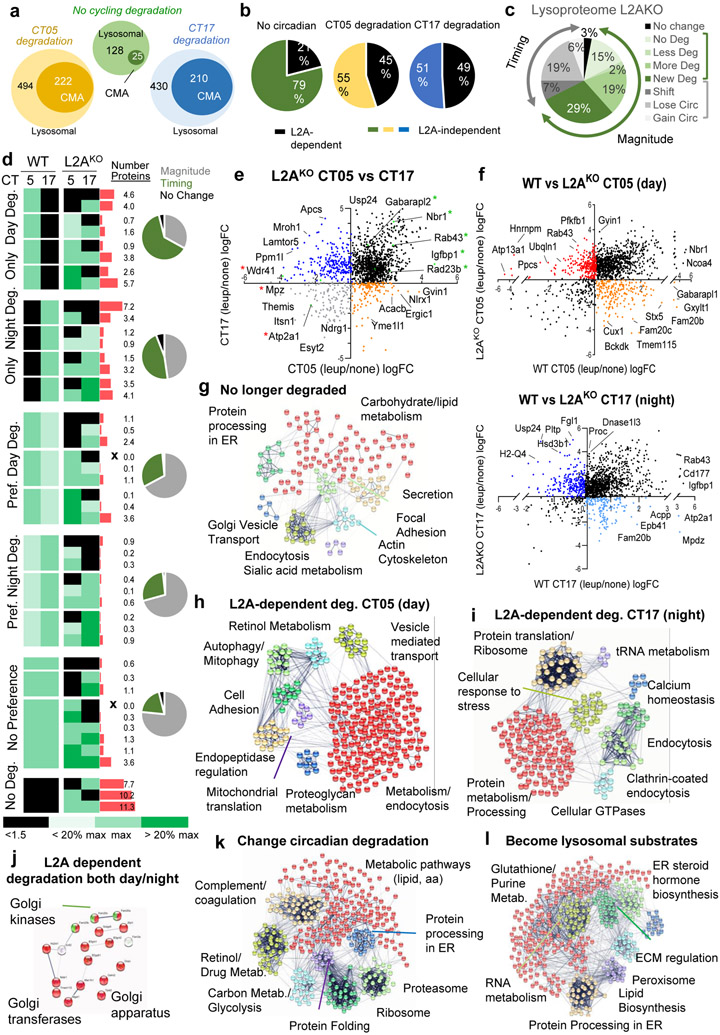
Comparison with lysosomes from L2AKO mice to identify CMA substrates (after confirming clustering of animals by genotype, treatment, and time in the circadian cycle (Extended Data Fig. 9a)), revealed similar percentage of lysosomal resident proteins in both WT and L2AKO mice (Extended Data Fig. 9b). Proteins no longer degraded in L2AKO mice lysosomes (CMA substrates) were almost half of the proteins with circadian lysosomal degradation, but only a small fraction of those without circadian preference (Fig. 8a,b, Supplementary Tables 5, 6 and Extended Data Fig. 9c). CMA blockage induced changes in degradation rates and in the timing of degradation in a large fraction of proteins (Fig. 8c,d and Extended Data Fig. 9d,e). We found that 91% of proteins no longer degraded in lysosomes upon CMA blockage contained CMA-targeting motifs, but while canonical motifs (built in the amino acid sequence) accounted for more than half (54%) of motifs in CMA substrates with no circadian preference, for those with diurnal or nocturnal preference in CMA degradation, only 24% were canonical motifs and 76% were generated through posttranslational modifications (phosphorylation and acetylation in the day group and mostly phosphorylation in the night group).
Fig. 8. CMA contributes to circadian remodeling of the proteome.
Comparative proteomics of liver lysosomes from leupeptin injected or not wild-type (WT) or LAMP2A knockout mice (L2AKO) isolated at circadian time CT05 (day) or CT17 (night). n=3 mice per CT, genotype and treatment group throughout the figure. a, Number of proteins undergoing lysosomal degradation (increase >1.5 folds after leupeptin treatment) or degradation through CMA (no longer increase upon leupeptin treatment in L2AKO mice) with preferential degradation or not at CT05 or CT17. b, Percentage of proteins degraded in a L2A-dependent (CMA) or -independent manner. c, Percentage of lysosomal proteins changing in magnitude or timing of degradation in L2AKO mice compared to WT. d, Heatmap of the differences in lysosomal degradation rates and timing between WT and L2AKO mice. Black: absence of degradation. Green color gradient: maximal degradation time and changes in >20% from maximal degradation. Red bars: percentage of total proteins in each group. X: no proteins in a group. Pie charts: percentage of proteins with differences in magnitude or time of degradation in each group in L2AKO mice. e, Log2 fold change (Log2FC) in rates of lysosomal degradation for individual proteins during the day and night cycle in L2AKO mice. Black: no cycle preference. Orange and blue: degraded only during the day or night, respectively. Grey: no longer degraded. Labels show examples of proteins in each group. f, Rates of lysosomal degradation (in LogFC) during the day (top) or night (bottom) in WT against L2AKO mice. Black: Proteins with preserved degradation time. Color: proteins displaying shifts in degradation time. g-l, STRING analysis for proteins no longer degraded in lysosomes in L2AKO mice (g), proteins displaying L2A-dependent degradation during the day (h) or during the night (i), proteins showing LAMP2A-dependent degradation both at CT05 and CT17 (j), proteins that change the time of their degradation upon LAMP2A ablation (k) and proteins degraded only in lysosomes from L2AKO mice but not from WT mice (l). All GO terms are statistically enriched with p<0.001. Numerical source data, statistics and exact p values are available as source data.
Added to proteins no longer degraded in lysosomes from L2AKO mice, we found a subset of proteins that displayed accelerated degradation and a third group degraded at similar rates, but at a different time (equally degraded throughout the cycle (19%) or shifted between nocturnal and diurnal degradation (7%)) (Fig. 8c, Supplementary Tables 6, 7 and Extended Data Fig. 9e)). Changes in rate and timing of lysosomal degradation and the percentage of proteins in each group are summarized in Fig. 8d, and comparison of proteins differentially degraded in the early or late part of the circadian cycle between WT and L2AKO mice in Fig. 8e,f. These findings support that upon CMA failure, substrate proteins may be rerouted to other autophagic pathways affecting both their rate and time of degradation.
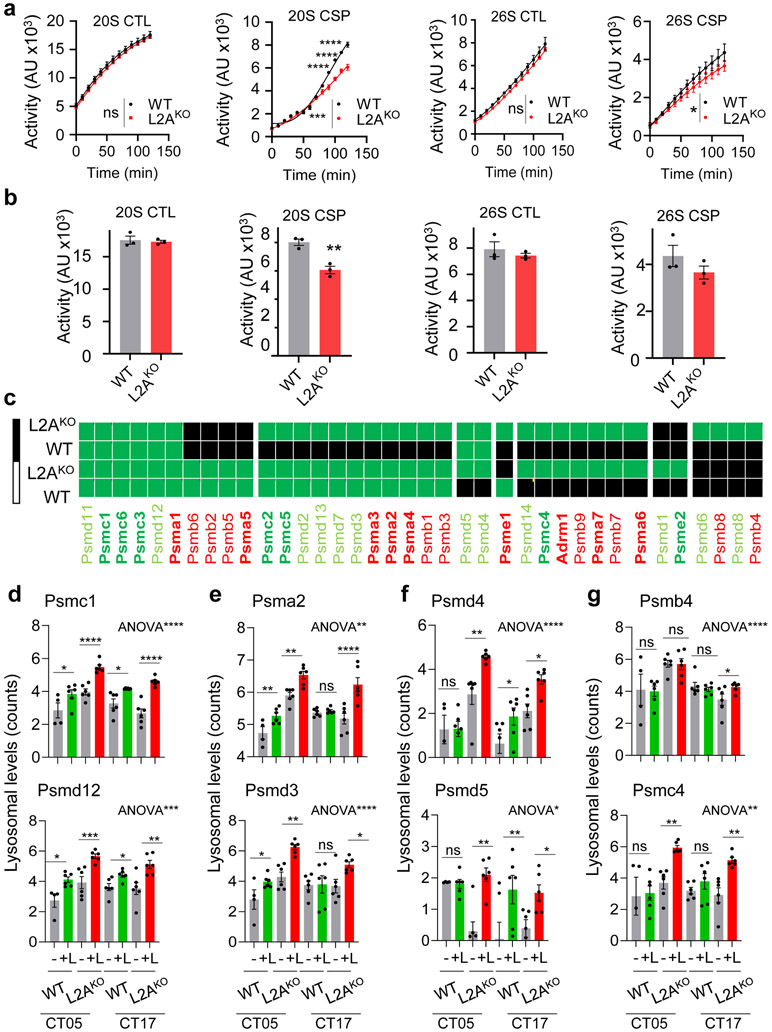
Enrichment analysis of GO terms on proteins no longer degraded in lysosomes in CMA-incompetent mice revealed contribution to carbohydrate and lipid metabolism, regulation of the ER-Golgi secretory pathway/endocytosis, and to actin cytoskeleton and focal adhesion (Fig. 8g). CMA substrates preferentially degraded during the early part of the circadian cycle included a large group of metabolism-related proteins31, and proteins involved in vesicular transport, cell-to-cell adhesion, and proteolysis (mitophagy and cytosolic endopeptidases) (Fig. 8h). Late in the circadian cycle, CMA substrates included proteins involved in metabolism, but mostly protein processing/translation and tRNA metabolism, in cellular response to stress, regulation of calcium homeostasis and regulation of endocytosis (Fig. 8i). A small group of proteins involved in Golgi homeostasis displayed L2A-dependent degradation throughout the circadian cycle (Fig. 8j). Proteins in which CMA blockage imposed a shift in their time of degradation were mostly involved in different steps of protein biology (translation, folding, processing in the ER, and proteasome) (Fig. 8k). Some proteins not degraded in lysosomes in WT mice become lysosomal substrates in L2AKO mice; their degradation may be secondary to cellular consequences of CMA blockage such as, increased oxidative and ER stress and compensatory upregulation of macroautophagy31,59 since they fell in those categories (Fig. 8l). Indeed, we found that the reported increased macroautophagy activity in L2AKO mice livers31 was due to its activation during the night phase, a time when it is normally less active (Extended Data Fig. 9f,g). Although the 26S proteasome catalytic activities remained unchanged in L2AKO mice, we noticed discrete but consistent changes in the 20S proteasome caspase-like activity (Extended Data Fig.10a,b). Rerouting in L2AKO mice of some of the proteasome subunits normally degraded by CMA to other degradation pathways (shown in Extended Data Fig. 10c-g) could be behind these changes. Circadian changes of some of the lysosomal resident proteins, mostly in enzymes, were also altered and instead of decreasing in abundance in the late phase of the circadian cycle, they persisted elevated throughout (Fig. 7i-l).
Discussion
We have identified reciprocal regulation between CMA and the circadian clock, whereby CMA activity is temporally orchestrated by circadian rhythm and, conversely, degradation of circadian proteins by CMA influences circadian output.
Timely removal of clock proteins by CMA, in coordination with other proteolytic systems11,14, appears necessary for alignment of the internal timekeeping system to the light:dark environment60. Differences in timing and regulation of the proteolytic systems may drive clock proteins targeting to them. For example, BMAL1 degradation by CMA occurs cyclically in a nutrition-independent manner and different time than its in vitro degradation by macroautophagy during ferroptosis15. Upon failure of one degradation pathway, clock proteins are still eliminated through re-routing to a different one, but this leads to a shift in their degradation timing. This temporal shift in degradation of the clock components, explains why even in absence of CMA we still observe some level of cycling of the clock elements although with abnormal cycling amplitude.
Our study reveals that CMA loss changes abundance of some cellular proteins which should affect their downstream functions. Other substrate proteins do not accumulate upon CMA blockage due to re-routing and compensation among autophagic pathways31,66,67, but the shift in degradation time, will terminate their function at an abnormal time with subsequent cellular negative impact. For proteins usually present in large protein complexes, where only subunits bearing KFERQ-like motifs undergo CMA degradation70, we propose that untimely degradation of those subunits by other proteolytic systems, may alter stoichiometry of the assembled complexes and, consequently, their functionality.
The tight interplay identified in this work between CMA and the clock machinery could explain some of the similarities between CMA-deficient mice and Bmal1KO mice, such as, the metabolic dysregulation that leads to changes in glucose metabolism and contributes to both models becoming insulin-insensitive and glucose-intolerant 68.
CMA activity declines with age and in neurodegenerative diseases44,61,62, all conditions associated with circadian abnormalities63-65. The discovery that CMA contributes to regulate peripheral and central circadian clock identifies it as a possible future therapeutic target to restore normal rhythms in old organisms and prevent the detrimental health effects associated with circadian rhythm fragmentation.
Online Methods
Animals
All animal procedures were performed under established animal study protocols approved by the Institutional Animal Care and Use Committee at the Albert Einstein College of Medicine. Four months male Wistar rats (Charles River Laboratories) and C57BL/6J male mice (4m and 24m from the NIA Aged Rodent Colony) were used. L2A knockout mice were generated by insemination of a wild-type female with spermatozoids from L2A floxed to excise this gene in all tissues in the offspring30,31. Congenic C57BL/6J background KFERQ-Dendra mice were created by back-crossing for more than 10 generations the original FVB KFERQ-Dendra mice51 generated by donor egg injection in wild-type FVB mice using the pRP.ExSi plasmid backbone with the insert coding for 11 amino acids including the KFERQ sequence of RNaseA in frame with the sequence of Dendra2 under the hybrid promoter CAGG. To generate BMAL1KO mice expressing KFERQ-Dendra, Bmal1f/f mice (Jackson stock number: 007668) crossed with the tamoxifen-inducible Cre (R26-CreERT2, Jackson stock number: 008463) were crossed with KFERQ-Dendra mice. At 3m of age (unless otherwise specified), Bmal1f/f-EsrCre-KFERQ-Dendra mice were treated with 4 intraperitoneal (i.p.) injections of tamoxifen 20mg/kg b.w. on alternate days to knockout Bmal1 (iBKO). Bmal1f/f KFERQ-Dendra littermate mice treated with tamoxifen under the same conditions served as controls (Ctrl).
All rodents were fed ad libitum and maintained at 19-23°C 30-60% relative humidity and timer-controlled light/dark cycles (in not otherwise stated, cycles were 12h light: 12h darks). For mice kept in regular light/dark cycle timing of experiments are indicated using Zeitgeber time (ZT) based on the light on and off time of the room. For mice kept in constant conditions (either continuous light L:L or continuous dark D:D), times are reported using the circadian time (CT). Rats were fasted with water ad libitum for 48h before fractionation experiments. For circadian studies, mice were euthanized, and tissues collected every 6h for a 24h period. For the time points during the dark period, mice were dissected in a dark room under dim red light to avoid disturbance of circadian rhythms. To study lysosomal protein degradation in vivo, mice were i.p. injected with a single dose of leupeptin (Sigma L5793; 40mg/kg b.w. in saline (0.9%NaCl)) or only saline and tissues were collected 3h after the injection. To study proteasome-dependent degradation in vivo, mice were i.p. injected with a single dose of MG262 (APExBIO A8179, 5mmol/kg b.w.) dissolved in 60% dimethyl sulfoxide (DMSO) or only DMSO (vehicle) and tissues were collected 12h after the injection. Animals were randomly attributed to the time point groups and to the protease inhibitors and saline groups.
For the isocaloric Twice-a-Day Feeding (ITAD)71 mice were subjected to daily feeding for a period of 6 months. ITAD-fed mice consumed the same amount of food as the control ad libitum (Ad-lib)-fed mice but were acclimatized to only eat during the two-2h feeding windows each day, i.e., between 8–10am (ZT1-3) and 5–7pm (ZT10-12). Isocaloric food consumption between both groups was ensured by determining that the amount of food consumed within the two-2h windows by ITAD mice was equal to the food consumed by the Ad-lib group in the preceding 24h.
Behavior rhythm monitoring and metabolic phenotyping
Circadian activity measurements were obtained with running wheel cages in ventilated, light-sealed cabinets (Actimetrics). Cages contained infrared photo beam detectors to record wheel rotations. Light scheduling was controlled by the Clocklab software suite (Actimetrics, v.5), which also was used to compile data sampled at 5min intervals. Actograms were acquired using Actiview Biological Rhythm Analysis software (Mini-Mitter, v.1.2). Metabolic measurements (oxygen consumption, carbon dioxide production, food intake, and locomotor activity) were obtained continuously every 8m using open-circuit indirect calorimetry system (Comprehensive Lab Animal Monitoring Systems; Columbus Instruments) for 8 days in the following sequence, 2 days light:dark (LD), 2 days continuous dark (DD), two days LD and 2 days continuous light (LL). Where indicated, 2 days in a normal LD cycle and 8 days in LL were used.
Cell culture and Treatments
Mouse fibroblasts (NIH3T3; American Type Culture Collection CRL-1658) and Mouse Embryonic Fibroblast (MEF) were cultured to full confluence in a 37°C incubator with 5% CO2 in complete Dulbecco’s modified Eagle’s medium (DMEM, Sigma) supplemented with 10% heat-inactivated newborn calf serum (HyClone), 1% penicillin/streptomycin/fungizone (Invitrogen). Cells were transfected using Lipofectamine 3000 (ThermoFisher Scientific), and where indicated, synchronized using 100nM dexamethasone72. In the protein degradation flux assays, cells were treated with lysosomal inhibitors ammonium chloride (20mM; American Bioanalytical) and leupeptin (100μM; Fisher Scientific) for the indicated times. In the luciferase-Lamp2a promoter assay, BMAL1-deficient MEFs were subjected to nucleofection using the Amaxa electroporation system with the T20 program and Nucleofector 2 formulation specific for MEFs (Lonza). MEFs were co-transfected either with or without 2μg of a BMAL1 expression vector along with 2.5μg of pGL3 Luciferase reporter vector containing bases −500 to −1700 of the murine Lamp2 promoter47 and 0.5μg of Renilla Luciferase plasmid to serve as internal control. All cells were harvested 16h post-transfection and assayed for Luciferase reporter activity with a Dual Luciferase Assay System (Promega) on a Lumistar Galaxy microplate-reading Luminometer (BMG Technologies) with each lysate loaded and read in triplicate.
Cellular subfractionation
Mouse and rat liver lysosomes were isolated after homogenization and differential centrifugation to obtain a light mitochondrial/lysosomal fraction that was then subjected to ultracentrifugation in a discontinuous metrizamide density gradient to separate CMA-active and CMA-inactive lysosomes23. Lysosomal integrity after isolation was determined by measuring enzymatic β-hexosaminidase activity in the extralysosomal media73. Cytosol and endoplasmic reticulum (ER) were obtained after centrifugation of the supernatant of post-light mitochondrial/lysosomal fraction sedimentation at 100,000g for 1h at 4°C. The supernatant was the cytosolic fraction, and the pellet was resuspended in 0.25M sucrose and collected as ER fraction. Nuclear fractions were prepared from liver homogenates pelleted at 6,800g for 5min and resuspended in 5ml of lysis solution 1 (50mM Tris-HCl pH7.6, 150mM NaCl, 1mM EDTA, 1mM EGTA, 10% Glycerol, and 0.5% NP-40). The resulting suspension was incubated on ice for 15min, centrifuged at 1,000g at 4°C for 5min, and the pellet washed with 0.25M sucrose twice to remove potential cytoplasmic contaminants. The pellet was then resuspended in lysis solution 2 (50mM Tris-HCl pH7.6, 500mM NaCl, 1mM EDTA, 1mM EGTA, 10% Glycerol, and 1% NP-40) and sonicated 3 times at 15% power for 5sec. The resulting solution was then centrifuged at 16,000g for 10min and the supernatant collected as the nuclear fraction. All solutions were supplemented with protease inhibitor (10mM leupeptin, 10mM 4-(2-aminoethyl) benzenesulfonyl fluoride hydrochloride, 1mM pepstatin, 100mM EDTA) and phosphatase inhibitor cocktails 2 (Sigma P5726) and 3 (Sigma P0044). Recovery of specific proteins in each fraction was calculated by determining the total amount of each protein in the homogenate and in the isolated fractions (volume x protein concentration (μg/μl)) x (densitometric value/μg protein loaded), and then calculating the percentage of the total amount of protein in the homogenate detected in each fraction.
Antibodies
The dilutions and sources of antibodies used for immunoblot (IB), immunoprecipitation (IP), and immunofluorescence (IF) in this study are summarized in Supplementary Table 9.
Immunoblot and co-Immunoprecipitation
Cell lysates were prepared in RIPA buffer (150mM NaCl, 1% NP-40, 0.5% NaDoc, 0.1% SDS, 50mM Tris pH8) containing protease and phosphatase inhibitors. Protein concentration was measured by the method of Lowry using bovine serum albumin as a standard74 and samples were subjected to SDS-PAGE and immunoblotting after transfer onto nitrocellulose membranes using standard procedures. Proteins were visualized by using peroxidase-conjugated secondary antibodies and chemiluminescent reagent (PerkinElmer) in a G-box Chemi XX6 (Imagen). Unsaturated images were used for densitometry with the ImageJ (NIH) software (v.2.1.0). When all samples did not fit in the same gel, all gels included 2 lanes (one on either side) with the same sample across gels. The average intensity of these 2 flanking lanes in each blot was used to calculate the factor by which all the lanes in a blot were multiplied to normalize with other blots. In addition, different grouping of samples and loading order were used in experiments from different days to confirm that comparisons were valid. For co-immunoprecipitation, isolated lysosomes were resuspended in co-immunoprecipitation (co-IP) buffer (20mM MOPS, 0.3M sucrose, 0.5% NP40 pH7.3), incubated on ice for 10min and centrifuged at 16,000g for 15min at 4°C. The solubilized proteins were incubated with the indicated primary antibodies for 4h under continuous rotation. Protein A/G Plus agarose (Santa Cruz, sc-2003) was added for an additional 1h, and after extensive washing, immunoprecipitated proteins were eluted. Co-immunoprecipitation was performed in cell lysates, homogenates and cytosolic tissue fractions using 25mM Tris (pH7.2), 150mM NaCl, 5mM MgCl2, 0.5% NP-40, 1 mM DTT, 5% glycerol and protease inhibitors using standard procedures. Equal protein amount of each fraction was incubated with primary antibody (2μg) overnight followed by incubation with protein A/G Plus agarose as mentioned above.
CMA in vitro transport assay
Lysosomal binding and uptake of recombinant GST-BMAL1 (Novus Biologicals H00000406) and GST-CLOCK (Novus Biologicals H00009575) were performed using an in vitro system with isolated lysosomes75. Briefly, lysosomes preincubated or not with a cocktail of protease inhibitors for 10min on ice were incubated with the recombinant proteins in 20mM MOPS, 0.3M sucrose buffer for 20min at 37°C. At the end of the incubation, lysosomes were collected by centrifugation and subjected to SDS-PAGE and immunoblotting. Protein associated with untreated lysosomes represented binding and uptake was calculated as the difference of protein present in lysosomes treated with protease inhibitors after discounting binding.
Proteolytic activities
Proteolytic capacity of isolated lysosomes was assayed in an acid buffer (10mMMES pH5.5) after disrupting the lysosomal membrane with 0.01% Triton by incubating them with a pool of radiolabeled cytosolic proteins75. Proteasome caspase-like and chymotrypsin-like activities were assayed using fluorescence probes. Liver homogenates (0.01-0.05mg proteins) diluted 1:2 in reaction buffer were incubated with AMC-tagged fluorogenic peptides specific for each activity at 37°C for 5min. Fluorescence readings were taken in 10min intervals for 2h using 350nm excitation and 440nm emission wavelengths. An AMC standard fluorescence curve was used to convert fluorescence units to free AMC moles. In some wells SDS was added to differentiate 20S and 26S activities and MG115 to discard non-proteasome degradation of the probes.
Site-directed mutagenesis
Mutagenesis was performed on BMAL1 in the pcDNA3 backbone (pBMPC3)76 from Addgene (plasmid 31367) using the Q5 Site-Directed Mutagenesis Kit (New England BioLabs, E0552S). To change QIEKR to AAEKR and KVKEQ to KVKAA, the following 40 base pair primers were used to amplify pBMPC3: Site 1: Q86A; I87A: F-5’-GCTGAAAAGAGGCGTCGGGACAAAATGAACAGTTTCATTG-3’ and R-5’-GGCACTGTGGGCCTCCCTTGCATTCTTGATCCTTCCTTGG-3’ and Site 2: E213A; Q214A: F-5’-GCCCTATCTTCCTCGGACACTGCGCCCCGGGAGCGACTCA-3’ and R-5’-TGCCTTAACTTTGGCAATATCTxTTTGGATGCAGGTAGTCA-3’. 2X KLD Reaction Buffer (2.5μl), PCR reaction (0.5μl), distilled water (1.5μl) and KLD Enzyme Mix (0.5μl) were incubated at room temperature for 5min and used for the transformation of E. coli DH5alpha using standard procedures.
RNA Isolation and qPCR Analyses
Total RNA was isolated with the Trizol Reagent (Invitrogen) and using the RNeasy Plus kit (Qiagen) according to manufacturer’s instructions. Genomic DNA was excluded using a gDNA Eliminator Spin Column (Qiagen). Total RNA was reverse transcribed into cDNA using Superscript II (Invitrogen), and quantitative RT-PCR analyses was performed using Power SYBR Green PCR Master Mix (Applied Biosystems) on a StepOne Plus Real-Time PCR System (Applied Biosystems) using the following forward (F) and reverse (R) primers in Supplementary Table 10. Thermal cycling conditions used were according to the instruction of the SYBR Green mix protocol, and relative mRNA abundance was calculated using the comparative delta-Ct method with TATA-binding protein as reference gene. Resulting product specificity was confirmed by melting curve analysis, and primer pair efficiency was calculated by generating a standard curve using serial dilutions of standard. The mRNA expression in experimental samples was represented as fold-change compared to expression in controls (assigned a value of 1). All reactions were performed in triplicate. CMA activation score45 was calculated after attributing a weight and directionality to the 19 components of the CMA network54. The score was calculated as the weighted/directed average of expression counts of every element of the CMA network.
Cell imaging
Cells grown on coverslips were fixed for 4min with ice-cold methanol to preserve membrane-associated protein and precipitate the soluble fraction, permeabilized and blocked with 1% BSA, 0.01% Triton X-100 in phosphate buffer saline (PBS). Incubation with primary and secondary antibody conjugated to Alexa Fluor 488 or Alexa Fluor 647 (Invitrogen) in 0.1% BSA in PBS was performed at room temperature for 1h each. Coverslips were mounted in DAPI-Fluoromount-G (Southern Biotechnology) (ThermoFisher Scientific) to stain the nucleus. Where indicated nuclei were highlighted with Hoechst. Images were acquired with a Leica TCS SP8 (Leica Microsystem) with a ×63 objective and 1.4 numerical aperture using the Leica LAS-X software (v.3.7.4) for image acquisition. All images were prepared using Adobe Photoshop CS3 (Adobe Systems, v.22.5.1) and analyzed with ImageJ (NIH) software (v.2.1.0). The JACoP plugin in ImageJ was used to determine the percentage of co-localization after the thresholding of individual frames and the Colocalization Finder function was used to mark colocalized pixels77. Normal IgG control and secondary antibody only were used as control.
Perfusion, fixation and sectioning of tissues
Mice were perfused with sterile 0.9% saline, and tissues were harvested and fixed using buffered zinc formalin (Z-FIX; Annatech Ltd., 171) at room temperature overnight. For brain sections, tissues were placed in 30% sucrose in PBS, snap-frozen in 2-methylbutane (Sigma) and stored at −80°C. Brain tissues were sectioned into 50μm slices with a Leica CM3050s cryostat, and free-floating slices were preserved in 0.1% (w/v) sodium azide at 4°C, until immunostaining. Liver, heart and kidney tissues, were fixed overnight and then stored in 0.1% (w/v) sodium azide in PBS at 4°C. Sections (40μm) were cut with a Leica VT 1000S vibratome.
Immunostaining of tissues, confocal laser scanning microscopy, and quantitative analysis
All tissue sections were washed 3 times in PBS (5min each) and permeabilized and blocked in 3% BSA, 0.5% Triton X-100 in PBS for 2h at RT. Slices were incubated overnight at 4°C with primary antibody followed by 1h with secondary antibodies conjugated with Alexa Fluor 488 or 647 (Invitrogen) diluted in 1% BSA, 5% NGS, 0.3% Triton X-100 in PBS. After PBS washing, slides were counterstained with Hoechst 33342 (1:2000; Invitrogen, H3570) for 20min at RT. Sections incubated with IgG control or secondary antibody alone were used as control. Confocal images were acquired using a Leica TCS SP8 (Leica Microsystem) microscope using a 10x (NA 0.40) objective in the case of the SCN brain regions and 40x (NA 1.3) objective to maximize puncta visualization in tissues from KFERQ-Dendra mice or immunostained for LAMP1. Images were taken in the same organ regions (hepatic lobule from the central vein for liver, cortical region for kidney or left ventricle wall for heart). Exposure and image acquisition settings were identical for all comparable sections. Narrow-band filters were used to avoid autofluorescence. Quantification was performed in serial confocal stacks maximum projected/flattened into one 8-bit 2D images using FIJI/ImageJ software (NIH) (v.2.1.0). To quantify fluorescent puncta in livers of KFERQ-Dendra mice, cell profiles were outlined with a trace tool and background fluorescence was discounted using a threshold tool. In the case of whole tissue sections, average number of Dendra-positive puncta were quantified per tissue area. When cell profiles were traced, Dendra-positive puncta were quantified per cell area. To ensure valid comparisons of signal intensities among various images, all images and all colors were processed using identical software settings. Dendra-positive puncta were not detectable in non-transgenic mice51.
Proteomic analysis
Lysosome samples were solubilized in 5% SDS, 50 mM TEAB pH7.55 and protein concentration determined with the micro BCA method with BSA as standard. Then, 10μg of each sample were digested using Protifi™ S-Trap™ Mini Spin Column Digestion Protocol. Briefly, proteins were reduced and alkylated (15mM TCEP, 25mM CAA) 1h at 45°C in the dark, SDS removed using 90% methanol in 100mM TEAB and proteins were digested with 50μl of trypsin in 50mM TEAB pH7.55 (Trypzean, Sigma, protein:enzyme ratio 1:25, 16h at 37°C). Resulting peptides were eluted from S-Trap columns, speed-vac dried, re-dissolved in 25μl of 0.5% formic acid and analyzed without further desalting. LC-MS/MS was done by coupling an UltiMate 3000 RSLCnano LC system to a Q Exactive HFx mass spectrometer (Thermo Fisher Scientific). Two microliters of peptides were loaded into a trap column (Acclaim™ PepMap™ 100 C18 LC Columns 5μm, 20mm length) for 3min at a flow rate of 10μl/min in 0.1% FA. Then, peptides were transferred to an EASY-Spray PepMap RSLC C18 column (Thermo) (2μm, 75μm x 50cm) operated at 45°C and separated using a 60min effective gradient (buffer A: 0.1% FA; buffer B: 100% ACN, 0.1% FA) at a flow rate of 250nL/min. The gradient used was, from 4% to 6% of buffer B in 2min, from 6% to 33% B in 58min, plus 10 additional minutes at 98% B. Peptides were sprayed at 1.8kV into the mass spectrometer via the EASY-Spray source and the capillary temperature was set to 300°C. The mass spectrometer was operated in a data-dependent mode, with an automatic switch between MS and MS/MS scans using a top 12 method (Intensity threshold ≥ 3.6e5, dynamic exclusion of 20 sec and excluding unassigned charges, +1 and > +6). MS spectra were acquired from 350 to 1400m/z with a resolution of 60,000 FWHM (200m/z). Ion peptides were isolated using a 1.6 Th window and fragmented using higher-energy collisional dissociation (HCD) with a normalized collision energy of 27. MS/MS spectra resolution was set to 15,000 (200m/z). The ion target values were 3e6 for MS (maximum IT of 25ms) and 1e5 for MS/MS (maximum IT of 22msec). Raw files were processed with MaxQuant (v 1.6.7.0) using the standard settings against a mouse protein database (UniProtKB/TrEMBL, 53449 sequences) supplemented with commonly found laboratory contaminant protein sequences. Carbamidomethylation of cysteines was set as a fixed modification whereas oxidation of methionines and protein N-term as variable modifications. Minimal peptide length was set to 7 amino acids and a maximum of two tryptic missed-cleavages were allowed. Results were filtered at 0.01 FDR (peptide and protein level). For label free quantification match between runs option was enabled. Afterwards, the “proteinGroups.txt” file was loaded in Prostar (v1.14) using the intensity values for further statistical analysis. A global normalization of log2-transformed intensities across samples was performed using the LOESS function. Missing values were imputed using the algorithms SLSA (for partially observed values) and DetQuantile (for values missing on an entire condition). Differential analysis was done using the empirical bayes statistics limma. Proteins with a p-value < 0.05 and a log2 ratio filling the criteria explained in the main text were defined as regulated. The FDR was estimated to be below 5% by Benjamini-Hochberg. Pathway analysis was performed using the IPA software (Ingenuity Systems, v.68752261) and STRING database (https://stringdb.org/; v.11.0 and v.11.5).
Statistics and reproducibility
All numerical results are reported as mean + SEM from a minimum of 3 different experiments (exact number is indicated in the legend to the figures). Tissue collection and isolation of organelles were performed on different days to evaluate reproducibility of the findings, but when possible, samples from different days were immunoblotted in the same membrane to allow for better comparison. Whenever that was not possible, a normalizing sample lane was included in all membranes as described in the previous section. Basic data handling was done in Microsoft Excel. In cases of single comparisons, the statistical significance of the difference between experimental groups was determined using two-tailed unpaired Student’s t test with the Prism GraphPad software (v.8 and v.9). In cases of multiple means, comparisons by one-way analysis of variance (ANOVA) followed by the Bonferroni’s or, where indicated, Tukey’s, Dunnett’s or Sidak’s post-hoc tests were used to determine statistical significance. For studies on protein binding and uptake in the in vitro reconstituted system and of degradation rate (expressed in fold changes relative to untreated) a one sample t and Wilcoxon test was used setting the hypothetical value to 1. Differences were considered statistically significant for p <0.05 except for the proteomic analysis where only values with p <0.01 in the compared groups were used. Power analysis was used to determine the number of animals required for each analysis based on the average values of enrichment and recovery for the specific fractions using endogenous markers for each compartment (for the isolated fractions), the previous differences that we have found when manipulating CMA in the in vitro system (for the analysis of CMA components/activity), and observations of circadian behavior of the same strain of mice previously reported (for circadian metabolic studies). With the calculated sample size and a two-sided type 1 error rate of 5% it was predicted >80% power to detect effects >1.5 in the parameters analyzed. None of the animals were excluded from the study. No data were excluded for the analysis of any experiment included in this work. For the studies involving animals receiving inhibitors of lysosomal or proteasomal degradation, or those injected with tamoxifen for gene deletion, animals were randomly allocated to vehicle or drug groups according to their genotype using the "SELECT BETWEEN RANGE" function in Microsoft Excel. For the rest of animal studies animal randomization was not required because all animals were subjected to the same interventions (changes in light:dark cycle) and groups were only based on genotype. Breeding was set to have in all litters control wild type and knock-out (LAMP2 or BMAL1 KO mice), allowing for comparisons among littermates. For the studies involving cell in culture or in vitro assays with purified organelles, treatment groups were attributed randomly between wells and plates to account for well or tube positioning effects. Blinding was used for quantification in all image-based analysis and for behavioral and functional tests whenever the pooling of animals was not required. In instances required pooling of different animals for isolation of enough lysosomes to validate the results of the proteome analysis the genotype group needs to know what livers could be homogenized together to obtain the size pellet required for lysosomal isolation. For the rest of studies blinding was lifted only for the final statistical analysis.
Materials availability
Animal models, cells lines and plasmids generated in this study will be provided upon request under both-parties signed institutional materials transfer agreements.
Data availability
The proteomic data is deposited at ProteomeXchange via the PRIDE partner repository with the dataset identifier PXD019704. All main figures (1-8) and Extended Data figures (1-10) have associated raw data included in the corresponding source data files. There are not restrictions on availability of data presented in this study.
Extended Data
Extended Data Fig. 1. Circadian proteins display properties of bona fide CMA substrates.
a. Representative immunoblot for LAMP2A from rat liver lysosomes immunoprecipitated for BMAL1 (left), CLOCK (middle), or REVERBα (right). The heavy chain (HC) of IgG used in the immunoprecipitation is shown. Input is 5% amount used for IP. b. Representative immunoblots for HSC70 from wild-type (WT) or LAMP2A knockout (L2AKO) cell lysates immunoprecipitated for BMAL1 or CLOCK. Heavy chain (HC) for IgG used in the immunoprecipitation is shown. Input is 5% concentration used for IP. Right, quantification of HSC70 normalized by the amount of BMAL1 or CLOCK immunoprecipitated. An increase in the amount of CMA substrates bound at a given time to HSC70, similar to the one observed here for BMAL1 and CLOCK, has previously been described upon blockage of CMA. n=3 independent experiments. Individual values (b) and mean+s.e.m are shown. Unpaired two-tailed t test was used, and differences were significant for *p<0.05. c. Representative immunoblot of competition of BMAL1 lysosomal uptake by ribonuclease A (RNase A). Left: representative immunoblot. Right: effect of increasing concentrations of RNase A on binding and uptake of 20ng of BMAL1. Numerical source data, statistics and exact p values and unprocessed blots are available as source data.
Extended Data Fig. 2. Circadian lysosomal and proteasomal protein degradation in liver.
a. Chymotrypsin-like (CTL) and caspase-like (CSP) activities of the 20S and 26S proteasome in livers from mice injected with saline (Sal) or leupeptin (Leup; 40mg/kg b.w.) 3h before tissue collection. Area under the curve after discounting residual MG115-resistent activity (left) and time-course kinetics (right) are shown. n=4 (CTL), 7 (CSP) mice. b. Top: Immunoblot from livers from mice treated as in a collected at the indicated Zeitgeber times (ZT). Ponceau staining is shown as loading control. Bottom: Levels of K48-polyubiquitinated proteins (left) and LC3-II (right) relative to ZT2-5 saline injected. n=3 mice per ZT and treatment. c. Proteolytic activity of liver lysosomes from mice injected with MG262 in 60% dimethyl sulfoxide (DMSO) or only DMSO (control; CTR) and incubated with a pool of radiolabeled proteins with or without leupeptin. n=3 mice per treatment. d. Left: Representative immunoblot of homogenate of mice injected (+) or not (−) with leupeptin (leup) as in a. Right: LC3-II flux (fold increase upon leupeptin injection). n=3 mice per ZT. e-g. Immunoblot of liver homogenates (Hom), lysosomes (Lys) active (+) or not (−) for CMA, ER, and cytosol (Cyt) (e), CMA+ lysosomes (f) and CMA+ and CMA (−) lysosomes (g) isolated from mice treated as in a. Loading controls for f are in e. h. Immunoblot of rat liver fractions at ZT17 to compare with ZT5 (Fig. 1b). i. Immunoblot of liver homogenates from mice treated as in c. UB-K48 is used as a control for efficacy of MG262 injection. j. Proteasome degradation of PER1 and CRY2 (>1.5 fold increase upon MG262 injection) at each time. n=4 mice per ZT. Dotted line: no degradation. Individual values (a-d,j) and mean+s.e.m are shown. Unpaired t-test (a left) and Two-way ANOVA followed by Sidak (a right, b and c) or Bonferroni’s (c, d, j) multiple comparisons post-hoc tests were used Differences were significant for *p<0.05, **p<0.01, ***p<0.001 and ****p<0.0001. ns=not significant. Numerical source data, statistics and exact p values and unprocessed blots are available as source data.
Extended Data Fig. 3. Lysosomal degradation of clock proteins is dependent on CMA but independent of the nutritional status.
a. Immunoblot of liver homogenates from LAMP2A knockout mice (L2AKO) intraperitoneally injected (i.p.) with saline (Sal) or a single dose of leupeptin 3h before tissue collection at the indicated circadian times (ZT). b. Lysosomal flux for the indicated circadian proteins calculated as the increase in >1.5 folds above the dotted line (value 1) upon leupeptin injection. n=3 mice per ZT. c. Immunoblot of livers from WT and L2AKO mice treated as in a and collected at ZT(20-23), time of maximal BMAL1 and CLOCK lysosomal degradation, and run in the same membrane for comparative purposes. d. Lysosomal flux for the indicated proteins in WT and L2AKO mice livers from blots in Extended Data Fig. 2f and 3a,c. n=3 mice per ZT and genotype. A lane with the same sample in all gels was used for normalization across membranes. Note that PER1 was not detected in WT lysosomes (Extended Data Fig. 2g). e. Immunoblot for the indicated proteins in CMA-active lysosomes (Lys CMA+) and CMA-inactive lysosomes (Lys CMA−) from mice fed ad libitum or starved for 24h (Stv) and injected or not with leupeptin. A representative immunoblot is shown (the experiment was replicated 3 times). f,g. Immunoblot for HSC70 (f) and LAMP2A (g) of BMAL1 immunoprecipitated (IP) from liver homogenates of mice fed ad libitum (AL) or maintained in an isocaloric twice-a-day feeding (iTAD) during the light time for 6 months collected at ZT8 and ZT20. The experiment was repeated 3 times. Individual values and mean+s.e.m are shown. Two-way ANOVA followed by Bonferroni's multiple comparisons post-hoc test was used to determine differences in protein flux at each time in L2AKO mice (b) and differences between genotypes (d). Differences in flux between both ZT are shown in the legend and between genotypes on top of the bars. Absolute protein levels are included in the raw data file. *p<0.05, **p<0.01, ***p<0.001 and ****p<0.0001. ns = not significant. Numerical source data, statistics and exact p values and unprocessed blots are available as source data.
Extended Data Fig. 4. Properties of CMA targeted BMAL1.
a. Immunoblot for BMAL1 phosphorylated on serine 42 (pBMAL1S42) in wild-type (WT, W) and LAMP2A knockout mice (L2AKO, L) livers at the indicated Zeitgeber times (ZT). Total BMAL1 and actin immunoblots from Fig. 2a are shown here for comparison. Arrows: BMAL1 bands of different electrophoretic mobility. All membranes contained a common sample for normalization across membranes. b. Levels of the two bands of total (top) and pBMAL1S42 (bottom) in WT (left) and L2AKO mice (right) from immunoblots as in a. Values are percentage of total BMAL1 contributed by each band. n=3 mice per ZT. c. Immunoblot for total BMAL1, pBMAL1S42 and BMAL1 acetylated on lysine 538 (AcBMAL1K538) in mouse liver homogenates (Hom) and lysosomes (Lys) active (+) or not (−) for CMA at the time of maximal BMAL1 lysosomal degradation. LAMP2A and HSC70 from the same fractions are shown on the right. d. Immunoblot of nuclear (left) and cytosolic fractions (right) from WT and L2AKO mice livers collected at the indicated Zeitgeber times (ZT), n=3 mice per ZT and genotype. Actin is shown as cytosolic loading control and Histone 3 as marker of the nuclear fraction. e, f. Levels of the top (left) and bottom (right) bands of BMAL1 (e) and of CLOCK (f) shown in d. Values are folds of ZT11 WT (arbitrary value of 1). n=3 mice per ZT and genotype in e and f. g. Immunoblot for total BMAL1 and pBMAL1S42 in fractions from synchronized NIH3T3 cells cultured or not with leptomycin to block nuclear export and (+) ammonium chloride and leupeptin (N/L) to block lysosomal degradation. Right: higher exposure of lysosome lanes. h. Lysosomal degradation (fold increase upon N/L) of the top and bottom BMAL1 (top) and pBMAL1S42 bands (bottom) in cells in g. Red dotted line: no degradation. n=3 mice per treatment. Individual values (e,f,h) and mean+s.e.m are shown. Two-way ANOVA followed by Bonferroni's multiple comparisons post-hoc test was used. *p<0.05, **p<0.01, ***p<0.001 and ****p<0.0001. Numerical source data, statistics and exact p values and unprocessed blots are available as source data.
Extended Data Fig. 5. Expression of BMAL1 protein mutated in the CMA-targeting motifs.
a. Immunoblot for His6 tag of NIH3T3 cells stably expressing His6-tagged BMAL1 wild-type (WT) or mutated in both CMA-targeting motifs (DM) at the indicated times after addition of cycloheximide (CHX) to stop protein synthesis. Ponceau is shown as loading control. b. Quantification of BMAL1 in experiments as in a. Values are expressed as fraction of the initial BMAL1 remaining at each time. n=3 independent experiments. c. Immunofluorescence for HSC70 (green) and His6 tag (red) in NIH3T3 cells stably expressing WT and DM BMAL1. Merged channels and colocalization mask are shown. Insets: boxed areas at higher magnification. d. Fraction of His6-BMAL1 colocalizing with HSC70 (Mander’s Coefficient - M1), n=3 independent experiments. e. Co-immunoprecipitation (IP) of HSC70 with BMAL1 in the same cells. Input and flow through (FT) are also shown. f. Amount of HSC70 co-immunoprecipitated with BMAL1 expressed as folds that in WT (arbitrary value of 1), n=3 independent experiments. g. Immunofluorescence for His6 tag in cells as in c. Image shows pseudocolor by gradient intensity. h. Intensity of nuclear BMAL1 in images as in g. n=3 independent experiments (55 cells were quantified per experiment and the mean value of intensity in each experiment was used for statistics). i-l. Immunoblot for CLOCK and CRY1 in lysosomes active (+) or not (−) for CMA isolated from livers of WT or BMAL1 knockout mice (iBKO) at the indicated CT times (i). Quantification of the levels of both proteins in CMA+ (j) and CMA− (k) lysosomes and in the four fractions (l) together for comparative purposes from fractions as the ones in I. Values are expressed as fold those in fractions from CT5 WT. n=3 mice per CT and genotype (in j, k and l). Individual values (d,f,h) and mean+s.e.m are shown. Two-way ANOVA followed by Bonferroni’s (b, j, k) or Tukey’s (l) post-hoc test for multiple variable comparisons and two-sided unpaired T-test (d, f, h) were used. *p<0.05, **p<0.01, ***p<0.001 and ****p<0.0001. ns = not significant. Numerical source data, statistics and exact p values and unprocessed blots are available as source data.
Extended Data Fig. 6. Free running behavior and metabolic characteristics of CMA-deficient mice.
a. Average activity onset relative to light offset (left) and variability of activity onset (right) of wild-type (WT) and LAMP-2A knock out mice (L2AKO) under 12:12 light:dark (LD) cycle. n=32 recordings in 4 mice per genotype (left) and n=4 mice per genotype (right). b. Representative actograms of WT and L2AKO mice during continuous light exposure (LL) n=9 mice per genotype. c, d. Average wheel running revolutions per day (c) and strength of rhythmicity (d) of WT and L2AKO mice in continuous dark (DD) or light (LL), n=10 (WT) and 9 (L2AKO) mice in c and d. e. Representative chi-square periodogram of WT and L2AKO mice in LL. The mean period is in red. n=9 mice per genotype. Significance level (above green line) with chi-squared threshold of 0.001. Orange dotted line: peak period of L2AKO mice (weaker periodicity than WT). f. Double-plotted actograms of WT and L2AKO mice with moderate (1) or severe (2) disruption of circadian properties at the indicated light conditions. Discontinuous lines: corrective shift in response to continuous darkness in WT (black) or L2AKO mice (red). Bottom: BMAL1 immunostaining of SCN at ZT17 in the mice of the actograms shown on top. g. Average intensity per area of BMAL1 staining in SCN of WT and L2AKO mice separated by the severity of their actogram changes, n=3 mice per group. h. Average value during the LD cycles or throughout a 24h period (total) of O2 consumption, CO2 production and energy expenditure (EE) in WT or L2AKO mice. n=4 mice per genotype. i. Median body heat production, VO2 consumption and CO2 production plots from WT and L2AKO mice, n=4 mice per genotype, subjected to alternating light/dark cycles each 2 days (left) or continuous light for 8 days (right). Data is single plotted in two-day intervals. Individual values and mean+s.e.m are shown. Unpaired two tailed t test (a, c and d), one-way (g) and two-way (h) ANOVA followed by Bonferroni’s multiple comparisons post-hoc test were used. *p<0.05, **p<0.01, ***p<0.001. ns: not significant. Numerical source data, statistics and exact p values are available as source data.
Extended Data Fig. 7. Changes in clock components and in the circadian transcriptome with age in mice with active or inactive CMA activity.
a. Immunoblot for the indicated proteins in livers from 4m and 24m old wild-type (WT) and LAMP2A knockout (L2AKO) mice. n=3 (WT) and 4 (L2AKO) mice per age. Ponceau staining is shown as loading control. b. Levels of the indicated proteins in the same mice obtained by densitometric quantification of immunoblots as in a. Values are expressed as fold levels in 4m old WT (dotted line) n=3 (WT) and 4 (L2AKO) mice per age. Animals were analyzed at ZT2 to catch the end of the nocturnal degradation of BMAL1 and CLOCK and the beginning of the diurnal degradation of REVERBα. c, d. Co-immunoprecipitation of LAMP2A (c) and HSC70 (d) with BMAL1 in livers of 4m and 24m old mice. * sample lost during processing. Experiments were repeated 3 times. e-g. Temporal changes in the mRNA of representative genes involved in carbohydrate (e), lipid metabolism (f) and in cytokine and interleukin signaling (g) shown to undergo reprograming of their circadian expression in old mice in the liver of young WT (W) or L2AKO (L) mice at the indicated ZT times. n=3 mice per ZT and genotype. Individual values (b) and mean+s.e.m are shown. Two-way ANOVA test followed by Tukey's multiple comparisons post-hoc test was used in b, and by multiple two-sided unpaired t-test in e-g. In b, significant differences between genotypes are marked in the legend and differences with 4m WT in the graph. In e-g, significant differences between genotypes are marked in the graph and ANOVA indicates p value for time differences. *p<0.05, **p<0.01, ***p<0.001 and ****p<0.0001. ns: not significant. Numerical source data, statistics and exact p values and unprocessed blots are available as source data.
Extended Data Fig. 8. Cell-type and tissue-specific changes in hepatic CMA activity during the light/dark cycle in different liver cells.
a. Immunofluorescence for Dendra and mac2 (to label hepatic Kupffer cells) in liver sections from KFERQ-Dendra mice at the indicated circadian times (CT). Nuclei are highlighted with Hoechst. Individual and merged channels are shown. Insets: higher magnification images. Dotted white line: Kupffer cells profile. b. Quantification of Dendra+ puncta per mac2+ cell section. n=3 mice per CT (50 cells were quantified per mouse and the mean value of puncta per cell in each mouse was used for statistics). c. Quantification of temporal changes in Dendra+ puncta number in hepatocytes and Kupffer cells relative to CT05 values (arbitrary value of 1). n=3 mice per CT (65 cells of each type were quantified per mouse and the mean value of puncta per cell in each mouse was used for statistics). d. Immunoblot of homogenate from control (CTR) and BMAL1 knockout (iBKO) mice livers at two circadian times (CT). Ponceau staining is shown as loading control. Right: Quantification of BMAL1 and HSC70, n=3 mice per CT and genotype. e,f. Immunoblot of lysosomes active (+) or inactive (−) for CMA isolated from livers of CTR and iBKO mice (e). Ponceau staining is shown as loading control. Quantification of immunoblots as the ones shown in e (f). n = 6 (CTR) and 3 (iBKO) mice per CT. g. Immunoblot for the indicated proteins in homogenate from kidneys of control (CTR) and BMAL1 knockout (iBKO) mice at two circadian times (CT). Three mice per condition are shown. Ponceau staining is shown as loading control. All values are mean+s.e.m. One-way ANOVA test followed by Tukey HSD post-hoc tests (b) or two-way ANOVA test followed by Bonferroni’s (c) or Tukey’s (d,f) (post-hoc tests for multiple variable comparisons were used. Significant differences between genotypes are shown in the legend and between times in the graph in d. Significant differences between CMA+ and CMA− lysosomes for each genotype are marked in the graph in f and between lysosomes, times and genotype are summarized in the raw data file. *p<0.05, **p<0.01, ***p<0.001 and ****p<0.0001. ns = not significant. Numerical source data, statistics and exact p values and unprocessed blots are available as source data.
Extended Data Fig. 9. Changes in the cyclic degradation of macroautophagy components upon CMA blockage.
Comparative differential proteomics of lysosomes from livers of wild-type (WT) or LAMP2A knockout mice (L2AKO) injected or not with leupeptin (Leu) and isolated at circadian time CT05 (day) or CT17 (night). All values are from n=3 mice per CT, genotype and treatment group. a. Principal component analysis showing the multivariate variation among the different genotype, time, and treatment groups. b. Percentage and number of proteins undergoing or not lysosomal degradation (increase upon leupeptin treatment). c. Preferences in degradation time of the subset of proteins degraded in lysosomes from L2AKO mice. d. Percentage of proteins in lysosomes from L2AKO mice displaying changes in their rate (magnitude) or time (timing) of degradation. e. Number of proteins in lysosomes according to their preference in degradation time and their dependence on the presence of LAMP2A in lysosomes. f,g. Lysosomal degradation of macroautophagy proteins LC3 (f) and p62 (g) calculated from the proteomic data. Graphs show quantification of levels of each of the proteins in lysosomes isolated from mice untreated (−) or injected with leupeptin (+L) (left) and lysosomal flux for both proteins calculated as differences in their lysosomal abundance between untreated or leupeptin injected mice (right). n=3 mice per CT, genotype and treatment with technical replicates for each one. Individual values per mouse (f,g) and mean+s.e.m are shown. Two-way ANOVA test followed by Bonferroni’s (f, g) post-hoc test (for multiple variable comparisons) was used. Differences were significant for ***p<0.001 and ****p<0.0001. ns = not significant. Numerical source data, statistics and exact p values are available as source data.
Extended Data Fig. 10. Changes in proteasome components upon CMA blockage.
a, b. Chymotrypsin-like (CTL) and caspase-like (CSP) activities of the 20S and 26S proteasome in livers from WT or L2AKO mice. Time-course kinetics (a) and area under the curve (b) are shown. n=3 mice per genotype in a and b. c-g. Lysosomal degradation of proteasome subunits in the same mice. c shows heatmaps of degradation (green) or not (black) at the two time points and d-g shows changes in lysosomal levels of the indicated proteasome proteins as representative examples of the 4 identified patterns: subunits with comparable degradation and cycling in WT and L2AKO mice (d), subunits preferentially degraded during the day (e) or during the night (f) in WT mice that become continuously degraded in L2AKO mice, and subunits normally not degraded in lysosomes that become now lysosomal substrates (g). n=3 mice per CT, genotype and treatment with technical replicates for each one. Individual values per mouse and mean+s.e.m are shown. Two-way ANOVA test followed by Bonferroni’s (a) or Sidak’s (d-g) post-hoc tests (for multiple variable comparisons), and two-sided unpaired T-test (b) were used. Differences were significant for *p<0.05, **p<0.01, ***p<0.001 and ****p<0.0001. ns = not significant. Numerical source data, statistics and exact p values are available as source data.
Supplementary Material
Supplementary Table S1. Proteins degraded in lysosomes only in the early part of the circadian cycle (CT05). Logarithm of fold change (logFC) in protein levels upon injection of leupeptin and p values calculated using unpaired two-tailed t test.
Supplementary Table S2. Proteins degraded in lysosomes only in the late part of the circadian cycle (CT17). Logarithm of fold change (logFC) in protein levels upon injection of leupeptin and p values calculated using unpaired two-tailed t test.
Supplementary Table S3. Proteins degraded in lysosomes both in the early and late part of the circadian cycle. Logarithm of fold change (logFC) in protein levels upon injection of leupeptin and p values calculated using unpaired two-tailed t test.
Supplementary Table S4. Lysosome-resident proteins which display circadian cyclic changes in their lysosomal abundance. Logarithm of fold change (logFC) in lysosomal levels during day (D) and night (N) for proteins that do not undergo degradation in lysosomes and p values calculated using unpaired two-tailed t test.
Supplementary Table S5. Proteins no longer degraded in lysosomes from LAMP2A knockout mice. Logarithm of fold change (logFC) in protein levels upon injection of leupeptin and p values and p values calculated using unpaired two-tailed t test.
Supplementary Table S6. Proteins degraded in a LAMP2A dependent manner during the early or late part of the circadian cycle. Logarithm of fold change (logFC) in protein levels upon injection of leupeptin and p values and p values calculated using unpaired two-tailed t test.
Supplementary Table S7. Proteins that lose cyclic degradation in LAMP2A knockout mice. Logarithm of fold change (logFC) in protein levels upon injection of leupeptin and p values calculated using unpaired two-tailed t test.
Supplementary Table S8. Proteins that become lysosomal substrates only in LAMP2A knockout mice. Logarithm of fold change (logFC) in protein levels upon injection of leupeptin and p values calculated using unpaired two-tailed t test.
Supplementary Table S9. Antibodies used in this work, working dilution, company and catalog number.
Supplementary Table S10.Sequence of forward (F) and reverse (R) primers used for qPCR.
Acknowledgments
We thank S. Tiano for excellent technical support with animal maintenance and biochemical procedures, Dr. Julio Madrigal-Matute for early assistance in the analysis of the lysoproteome, the Analytical Image and Animal Physiology Cores of the Albert Einstein College of Medicine for assistance with image acquisition and analysis and metabolic behavior measurements, respectively. Circadian running wheel procedures were performed with assistance from The Neurobehavior Testing Core at UPenn/ITMAT and IDDRC at CHOP/Penn.
Funding:
This work was supported by grants from the National Institutes of Health AG021904, AG054108, DK098408 (to AMC), RF1AG043517 (to RS), AG031782 (to AMC, RS and FM) and the generous support of the Rainwaters Foundation and the JPB Foundation (to AMC), the Glenn Foundation (to AMC and FM), the Ikerbasque, Basque Foundation for Science, Bilbao, Spain (to JM) and U54 HD086984 (U Penn/IDDRC core) and AG038072 (Einstein Animal Physiology Core). YRJ was supported by NIH training grant T32GM007491, GJK by NIH training grants T32GM007288 and T32GM007491, and MJ by NIH training grant T32HL14445. The CNIO Proteomics Unit lab is a member of Proteored, PRB3 and is supported by grant PT17/0019, of the PE I+D+i 2013-2016, funded by ISCIII and ERDF.
Abbreviations:
- BMAL1
Brain and Muscle ARNT-Like 1
- CMA
chaperone-mediated autophagy
- CRY
Cryptochrome Circadian Regulator
- CT
circadian time
- HSC
heat shock cognate protein
- LAMP
lysosome-associated membrane protein
- LC3
light chain protein 3
- PER
Period Circadian Regulator
- REVERBα
Nuclear Receptor Subfamily 1 Group D Member 1
- RORα
retinoic acid receptor-related orphan receptors
- ZT
Zeitgeber time
Footnotes
Competing interests
AMC is the founder and serves in the Scientific Board of Selphagy (a program under LifeBiosciences) and she consults for Generian Pharmaceuticals and Cognition Therapeutics. The rest of the authors declare no competing interests in relation with this work.
References
- 1.Dunlap JC Molecular bases for circadian clocks. Cell 96, 271–290 (1999). [DOI] [PubMed] [Google Scholar]
- 2.Bass J & Takahashi JS Circadian integration of metabolism and energetics. Science 330, 1349–1354 (2010). [DOI] [PMC free article] [PubMed] [Google Scholar]
- 3.Mohawk JA, Green CB & Takahashi JS Central and peripheral circadian clocks in mammals. Annu Rev Neurosci 35, 445–462 (2012). [DOI] [PMC free article] [PubMed] [Google Scholar]
- 4.Lowrey PL & Takahashi JS Genetics of circadian rhythms in Mammalian model organisms. Adv Genet 74, 175–230 (2011). [DOI] [PMC free article] [PubMed] [Google Scholar]
- 5.King DP et al. Positional cloning of the mouse circadian clock gene. Cell 89, 641–653 (1997). [DOI] [PMC free article] [PubMed] [Google Scholar]
- 6.Lee C, Etchegaray JP, Cagampang FR, Loudon AS & Reppert SM Posttranslational mechanisms regulate the mammalian circadian clock. Cell 107, 855–867 (2001). [DOI] [PubMed] [Google Scholar]
- 7.Gekakis N et al. Role of the CLOCK protein in the mammalian circadian mechanism. Science 280, 1564–1569 (1998). [DOI] [PubMed] [Google Scholar]
- 8.Cho H et al. Regulation of circadian behaviour and metabolism by REV-ERB-alpha and REV-ERB-beta. Nature 485, 123–127 (2012). [DOI] [PMC free article] [PubMed] [Google Scholar]
- 9.Brown SA, Kowalska E & Dallmann R (Re)inventing the circadian feedback loop. Dev Cell 22, 477–487 (2012). [DOI] [PubMed] [Google Scholar]
- 10.Stojkovic K, Wing SS & Cermakian N A central role for ubiquitination within a circadian clock protein modification code. Front Mol Neurosci 7, 69 (2014). [DOI] [PMC free article] [PubMed] [Google Scholar]
- 11.Gatfield D & Schibler U Physiology. Proteasomes keep the circadian clock ticking. Science 316, 1135–1136 (2007). [DOI] [PubMed] [Google Scholar]
- 12.Liu J et al. Distinct control of PERIOD2 degradation and circadian rhythms by the oncoprotein and ubiquitin ligase MDM2. Sci Signal 11 (2018). [DOI] [PubMed] [Google Scholar]
- 13.Siepka SM et al. Circadian mutant Overtime reveals F-box protein FBXL3 regulation of cryptochrome and period gene expression. Cell 129, 1011–1023 (2007). [DOI] [PMC free article] [PubMed] [Google Scholar]
- 14.Toledo M et al. Autophagy Regulates the Liver Clock and Glucose Metabolism by Degrading CRY1. Cell Metab 28, 268–281.e264 (2018). [DOI] [PMC free article] [PubMed] [Google Scholar]
- 15.Yang M et al. Clockophagy is a novel selective autophagy process favoring ferroptosis. Sci Adv 5, eaaw2238 (2019). [DOI] [PMC free article] [PubMed] [Google Scholar]
- 16.Kaushik S & Cuervo AM The coming of age of chaperone-mediated autophagy. Nat Rev Mol Cell Biol 19, 365–381 (2018). [DOI] [PMC free article] [PubMed] [Google Scholar]
- 17.Chiang H, Terlecky S, Plant C & Dice JF A role for a 70-kilodalton heat shock protein in lysosomal degradation of intracellular proteins. Science 246, 382–385 (1989). [DOI] [PubMed] [Google Scholar]
- 18.Cuervo AM & Dice JF A receptor for the selective uptake and degradation of proteins by lysosomes. Science 273, 501–503 (1996). [DOI] [PubMed] [Google Scholar]
- 19.Bandyopadhyay U, Sridhar S, Kaushik S, Kiffin R & Cuervo AM Identification of regulators of chaperone-mediated autophagy. Mol Cell 39, 535–547 (2010). [DOI] [PMC free article] [PubMed] [Google Scholar]
- 20.Agarraberes F, Terlecky S & Dice J An intralysosomal hsp70 is required for a selective pathway of lysosomal protein degradation. J Cell Biol 137, 825–834 (1997). [DOI] [PMC free article] [PubMed] [Google Scholar]
- 21.Dice JF Peptide sequences that target cytosolic proteins for lysosomal proteolysis. Trends Biochem Sci 15, 305–309 (1990). [DOI] [PubMed] [Google Scholar]
- 22.Bandyopadhyay U, Kaushik S, Varticovski L & Cuervo AM The chaperone-mediated autophagy receptor organizes in dynamic protein complexes at the lysosomal membrane. Mol Cell Biol 28, 5747–5763 (2008). [DOI] [PMC free article] [PubMed] [Google Scholar]
- 23.Cuervo AM, Dice JF & Knecht E A population of rat liver lysosomes responsible for the selective uptake and degradation of cytosolic proteins. J Biol Chem 272, 5606–5615 (1997). [DOI] [PubMed] [Google Scholar]
- 24.Gatfield D & Schibler U Proteasomes Keep the Circadian Clock Ticking. Science 316, 1135 (2007). [DOI] [PubMed] [Google Scholar]
- 25.Chen S et al. Ubiquitin-conjugating enzyme UBE2O regulates cellular clock function by promoting the degradation of the transcription factor BMAL1. J Biol Chem 293, 11296–11309 (2018). [DOI] [PMC free article] [PubMed] [Google Scholar]
- 26.D' Alessandro M et al. Stability of Wake-Sleep Cycles Requires Robust Degradation of the PERIOD Protein. Curr Biol 27, 3454–3467.e3458 (2017). [DOI] [PMC free article] [PubMed] [Google Scholar]
- 27.DeBruyne JP, Baggs JE, Sato TK & Hogenesch JB Ubiquitin ligase Siah2 regulates RevErbalpha degradation and the mammalian circadian clock. Proc Natl Acad Sci U S A 112, 12420–12425 (2015). [DOI] [PMC free article] [PubMed] [Google Scholar]
- 28.Zhao X et al. Circadian Amplitude Regulation via FBXW7-Targeted REV-ERBα Degradation. Cell 165, 1644–1657 (2016). [DOI] [PMC free article] [PubMed] [Google Scholar]
- 29.Ma D, Panda S & Lin JD Temporal orchestration of circadian autophagy rhythm by C/EBPβ. The EMBO journal 30, 4642–4651 (2011). [DOI] [PMC free article] [PubMed] [Google Scholar]
- 30.Schneider JL et al. Loss of hepatic chaperone-mediated autophagy accelerates proteostasis failure in aging. Aging Cell 14, 249–264 (2015). [DOI] [PMC free article] [PubMed] [Google Scholar]
- 31.Schneider JL, Suh Y & Cuervo AM Deficient chaperone-mediated autophagy in liver leads to metabolic dysregulation. Cell Metab 20, 417–432 (2014). [DOI] [PMC free article] [PubMed] [Google Scholar]
- 32.Kaushik S & Cuervo AM Degradation of lipid droplet-associated proteins by chaperone-mediated autophagy facilitates lipolysis. Nat Cell Biol 17, 759–770 (2015). [DOI] [PMC free article] [PubMed] [Google Scholar]
- 33.Pastore N et al. Nutrient-sensitive transcription factors TFEB and TFE3 couple autophagy and metabolism to the peripheral clock. Embo j 38 (2019). [DOI] [PMC free article] [PubMed] [Google Scholar]
- 34.Kisselev AF & Goldberg AL Proteasome inhibitors: from research tools to drug candidates. Chem Biol 8, 739–758 (2001). [DOI] [PubMed] [Google Scholar]
- 35.Hornbeck PV et al. PhosphoSitePlus, 2014: mutations, PTMs and recalibrations. Nucleic Acids Res 43, D512–520 (2015). [DOI] [PMC free article] [PubMed] [Google Scholar]
- 36.Brenna A & Albrecht U Phosphorylation and Circadian Molecular Timing. Frontiers in Physiology 11 (2020). [DOI] [PMC free article] [PubMed] [Google Scholar]
- 37.Nakahata Y et al. The NAD+-dependent deacetylase SIRT1 modulates CLOCK-mediated chromatin remodeling and circadian control. Cell 134, 329–340 (2008). [DOI] [PMC free article] [PubMed] [Google Scholar]
- 38.Hirayama J et al. CLOCK-mediated acetylation of BMAL1 controls circadian function. Nature 450, 1086–1090 (2007). [DOI] [PubMed] [Google Scholar]
- 39.Park C, Suh Y & Cuervo AM Regulated degradation of Chk1 by chaperone-mediated autophagy in response to DNA damage. Nat Commun 6, 6823 (2015). [DOI] [PMC free article] [PubMed] [Google Scholar]
- 40.Lowrey PL & Takahashi JS Mammalian circadian biology: elucidating genome-wide levels of temporal organization. Annu Rev Genomics Hum Genet 5, 407–441 (2004). [DOI] [PMC free article] [PubMed] [Google Scholar]
- 41.Kwon I et al. BMAL1 shuttling controls transactivation and degradation of the CLOCK/BMAL1 heterodimer. Molecular and cellular biology 26, 7318–7330 (2006). [DOI] [PMC free article] [PubMed] [Google Scholar]
- 42.Jud C, Schmutz I, Hampp G, Oster H & Albrecht U A guideline for analyzing circadian wheel-running behavior in rodents under different lighting conditions. Biol Proced Online 7, 101–116 (2005). [DOI] [PMC free article] [PubMed] [Google Scholar]
- 43.Cuervo AM & Dice JF Age-related decline in chaperone-mediated autophagy. J Biol Chem 275, 31505–31513 (2000). [DOI] [PubMed] [Google Scholar]
- 44.Zhang C & Cuervo AM Restoration of chaperone-mediated autophagy in aging liver improves cellular maintenance and hepatic function. Nat Med 14, 959–965 (2008). [DOI] [PMC free article] [PubMed] [Google Scholar]
- 45.Bourdenx M et al. Chaperone-mediated autophagy prevents collapse of the neuronal metastable proteome. Cell 184, 2696–2714 e2625 (2021). [DOI] [PMC free article] [PubMed] [Google Scholar]
- 46.Dong S et al. Chaperone-mediated autophagy sustains haematopoietic stem-cell function. Nature 591, 117–123 (2021). [DOI] [PMC free article] [PubMed] [Google Scholar]
- 47.Valdor R et al. Chaperone-mediated autophagy regulates T cell responses through targeted degradation of negative regulators of T cell activation. Nat Immunol 15, 1046–1054 (2014). [DOI] [PMC free article] [PubMed] [Google Scholar]
- 48.Chang H-C & Guarente L SIRT1 Mediates Central Circadian Control in the SCN by a Mechanism that Decays with Aging. Cell 153, 1448–1460 (2013). [DOI] [PMC free article] [PubMed] [Google Scholar]
- 49.Solanas G et al. Aged Stem Cells Reprogram Their Daily Rhythmic Functions to Adapt to Stress. Cell 170, 678–692.e620 (2017). [DOI] [PubMed] [Google Scholar]
- 50.Sato S et al. Circadian Reprogramming in the Liver Identifies Metabolic Pathways of Aging. Cell 170, 664–677.e611 (2017). [DOI] [PMC free article] [PubMed] [Google Scholar]
- 51.Dong S et al. Monitoring spatiotemporal changes in chaperone-mediated autophagy in vivo. Nat Commun 11, 645–645 (2020). [DOI] [PMC free article] [PubMed] [Google Scholar]
- 52.Ma Q et al. Age-related autophagy alterations in the brain of senescence accelerated mouse prone 8 (SAMP8) mice. Exp Gerontol 46, 533–541 (2011). [DOI] [PubMed] [Google Scholar]
- 53.Cuervo AM & Dice JF Regulation of lamp2a levels in the lysosomal membrane. Traffic 1, 570–583 (2000). [DOI] [PubMed] [Google Scholar]
- 54.Kirchner P et al. Proteome-wide analysis of chaperone-mediated autophagy targeting motifs. PLoS Biol 17, e3000301 (2019). [DOI] [PMC free article] [PubMed] [Google Scholar]
- 55.Yang G et al. Timing of expression of the core clock gene Bmal1 influences its effects on aging and survival. Science translational medicine 8, 324ra316–324ra316 (2016). [DOI] [PMC free article] [PubMed] [Google Scholar]
- 56.Koike N et al. Transcriptional architecture and chromatin landscape of the core circadian clock in mammals. Science 338, 349–354 (2012). [DOI] [PMC free article] [PubMed] [Google Scholar]
- 57.Anguiano J et al. Chemical modulation of chaperone-mediated autophagy by retinoic acid derivatives. Nat Chem Biol 9, 374–382 (2013). [DOI] [PMC free article] [PubMed] [Google Scholar]
- 58.Cuervo AM, Knecht E, Terlecky SR & Dice JF Activation of a selective pathway of lysosomal proteolysis in rat liver by prolonged starvation. Am J Physiol 269, C1200–1208 (1995). [DOI] [PubMed] [Google Scholar]
- 59.Kiffin R, Bandyopadhyay U & Cuervo A Oxidative stress and autophagy. Antioxid Redox Signal 8, 152–162 (2006). [DOI] [PubMed] [Google Scholar]
- 60.Pittendrigh CS Circadian rhythms and the circadian organization of living systems. Cold Spring Harb Symp Quant Biol 25, 159–184 (1960). [DOI] [PubMed] [Google Scholar]
- 61.Cuervo AM, Stefanis L, Fredenburg R, Lansbury PT & Sulzer D Impaired degradation of mutant alpha-synuclein by chaperone-mediated autophagy. Science 305, 1292–1295 (2004). [DOI] [PubMed] [Google Scholar]
- 62.Caballero B et al. Interplay of pathogenic forms of human tau with different autophagic pathways. Aging Cell 17, doi: 10.1111/acel.12692. (2018). [DOI] [PMC free article] [PubMed] [Google Scholar]
- 63.Abbott SM & Videnovic A Chronic sleep disturbance and neural injury: links to neurodegenerative disease. Nat Sci Sleep 8, 55–61 (2016). [DOI] [PMC free article] [PubMed] [Google Scholar]
- 64.Kondratova AA & Kondratov RV The circadian clock and pathology of the ageing brain. Nat Rev Neurosci 13, 325–335 (2012). [DOI] [PMC free article] [PubMed] [Google Scholar]
- 65.Mattis J & Sehgal A Circadian Rhythms, Sleep, and Disorders of Aging. Trends Endocrinol Metab 27, 192–203 (2016). [DOI] [PMC free article] [PubMed] [Google Scholar]
- 66.Kaushik S, Massey A, Mizushima N & Cuervo AM Constitutive Activation of Chaperone-mediated Autophagy in Cells with Impaired Macroautophagy. Mol Biol Cell 19, 2179–2192 (2008). [DOI] [PMC free article] [PubMed] [Google Scholar]
- 67.Massey AC, Kaushik S, Sovak G, Kiffin R & Cuervo AM Consequences of the selective blockage of chaperone-mediated autophagy. Proc Nat Acad Sci USA 103, 5905–5910 (2006). [DOI] [PMC free article] [PubMed] [Google Scholar]
- 68.Zhou B et al. CLOCK/BMAL1 regulates circadian change of mouse hepatic insulin sensitivity by SIRT1. Hepatology 59, 2196–2206 (2014). [DOI] [PubMed] [Google Scholar]
- 69.Salvador N, Aguado C, Horst M & Knecht E Import of a cytosolic protein into lysosomes by chaperone-mediated autophagy depends on its folding state. J Biol Chem 275, 27447–27456 (2000). [DOI] [PubMed] [Google Scholar]
- 70.Cuervo AM, Palmer A, Rivett AJ & Knecht E Degradation of proteasomes by lysosomes in rat liver. Eur J Biochem 227, 792–800 (1995). [DOI] [PubMed] [Google Scholar]
- 71.Martinez-Lopez N et al. System-wide Benefits of Intermeal Fasting by Autophagy. Cell Metab 26, 856–871 e855 (2017). [DOI] [PMC free article] [PubMed] [Google Scholar]
- 72.Balsalobre A et al. Resetting of circadian time in peripheral tissues by glucocorticoid signaling. Science 289, 2344–2347 (2000). [DOI] [PubMed] [Google Scholar]
- 73.Storrie B & Madden E Isolation of subcellular organelles. Meth Enzymol 182, 203–225 (1990). [DOI] [PubMed] [Google Scholar]
- 74.Lowry O, Rosebrough N, Farr A & Randall R Protein measurement with the Folin phenol reagent. J Biol Chem 193, 265–275 (1951). [PubMed] [Google Scholar]
- 75.Juste YR & Cuervo AM Analysis of Chaperone-Mediated Autophagy. Methods Mol Biol 1880, 703–727 (2019). [DOI] [PMC free article] [PubMed] [Google Scholar]
- 76.Ye R, Selby CP, Ozturk N, Annayev Y & Sancar A Biochemical analysis of the canonical model for the mammalian circadian clock. J Biol Chem 286, 25891–25902 (2011). [DOI] [PMC free article] [PubMed] [Google Scholar]
- 77.Bolte S & Cordelieres FP A guided tour into subcellular colocalization analysis in light microscopy. Journal of microscopy 224, 213–232 (2006). [DOI] [PubMed] [Google Scholar]
Associated Data
This section collects any data citations, data availability statements, or supplementary materials included in this article.
Supplementary Materials
Supplementary Table S1. Proteins degraded in lysosomes only in the early part of the circadian cycle (CT05). Logarithm of fold change (logFC) in protein levels upon injection of leupeptin and p values calculated using unpaired two-tailed t test.
Supplementary Table S2. Proteins degraded in lysosomes only in the late part of the circadian cycle (CT17). Logarithm of fold change (logFC) in protein levels upon injection of leupeptin and p values calculated using unpaired two-tailed t test.
Supplementary Table S3. Proteins degraded in lysosomes both in the early and late part of the circadian cycle. Logarithm of fold change (logFC) in protein levels upon injection of leupeptin and p values calculated using unpaired two-tailed t test.
Supplementary Table S4. Lysosome-resident proteins which display circadian cyclic changes in their lysosomal abundance. Logarithm of fold change (logFC) in lysosomal levels during day (D) and night (N) for proteins that do not undergo degradation in lysosomes and p values calculated using unpaired two-tailed t test.
Supplementary Table S5. Proteins no longer degraded in lysosomes from LAMP2A knockout mice. Logarithm of fold change (logFC) in protein levels upon injection of leupeptin and p values and p values calculated using unpaired two-tailed t test.
Supplementary Table S6. Proteins degraded in a LAMP2A dependent manner during the early or late part of the circadian cycle. Logarithm of fold change (logFC) in protein levels upon injection of leupeptin and p values and p values calculated using unpaired two-tailed t test.
Supplementary Table S7. Proteins that lose cyclic degradation in LAMP2A knockout mice. Logarithm of fold change (logFC) in protein levels upon injection of leupeptin and p values calculated using unpaired two-tailed t test.
Supplementary Table S8. Proteins that become lysosomal substrates only in LAMP2A knockout mice. Logarithm of fold change (logFC) in protein levels upon injection of leupeptin and p values calculated using unpaired two-tailed t test.
Supplementary Table S9. Antibodies used in this work, working dilution, company and catalog number.
Supplementary Table S10.Sequence of forward (F) and reverse (R) primers used for qPCR.
Data Availability Statement
The proteomic data is deposited at ProteomeXchange via the PRIDE partner repository with the dataset identifier PXD019704. All main figures (1-8) and Extended Data figures (1-10) have associated raw data included in the corresponding source data files. There are not restrictions on availability of data presented in this study.


