Abstract
Hypothesis:
This study tests the hypothesis that it is possible to find tone or noise vocoders that sound similar and result in similar speech perception scores to a cochlear implant (CI). This would validate the use of such vocoders as acoustic models of CIs. We further hypothesize that those valid acoustic models will require a personalized amount of frequency mismatch between input filters and output tones or noise bands.
Background:
Noise or tone vocoders have been used as acoustic models of CIs in hundreds of publications but never been convincingly validated.
Methods:
Acoustic models were evaluated by single-sided deaf CI users who compared what they heard with the CI in one ear to what they heard with the acoustic model in the other ear. We evaluated frequency-matched models (both all-channel and 6-channel models, both tone and noise vocoders) as well as self-selected models that included an individualized level of frequency mismatch.
Results:
Self-selected acoustic models resulted in similar levels of speech perception and similar perceptual quality as the CI. These models also matched the CI in terms of perceived intelligibility, harshness, and pleasantness.
Conclusion:
Valid acoustic models of CIs exist, but they are different from the models most widely used in the literature. Individual amounts of frequency mismatch may be required to optimize the validity of the model. This may be related to the basalward frequency mismatch experienced by postlingually deaf patients after cochlear implantation.
Introduction
Animal models are important for understanding human physiology and pathophysiology because they allow experiments that would be impractical or ethically forbidden in humans. However, knowledgeable biologists always scrutinize the validity of their animal models because they know they do not always faithfully reproduce the human condition. Similarly, acoustic models can be extremely useful for the study of cochlear implants (CIs). Acoustic models allow manipulations that would not be feasible otherwise. For example, one can simulate different intracochlear electrode locations, different amounts of tonotopic frequency mismatch, different patterns of neural survival, or different amounts of spread of excitation- and all of these can be done within-listener. Unfortunately, the validity of acoustic models of CIs has not received sufficient attention. The present study is an attempt to better determine which specific flavors of acoustic models may better approximate speech perception with a CI.
Acoustic models have been used in numerous studies to simulate the percepts elicited by cochlear implants 1. They separate the incoming signal into different channels using a bank of bandpass filters. The envelope of each channel is then extracted, just as in CI speech processing, and used to modulate output sounds, which are typically tones or noise bands. Each noise band (or tone) presented to a normal ear is intended to mimic the percept elicited by stimulation of a given intracochlear electrode. Historically, acoustic models using 6–8 channels and using analysis filters that are frequency-matched to the output sounds have been thought to provide a good representation of cochlear implant perception because they allow naïve normal hearing listeners to reach levels of speech perception that are comparable to those obtained by experienced CI users 2–5. However, this similarity in speech perception represents an extremely weak level of validation because it can be achieved by using absolutely any type of signal processing that includes one parameter that degrades the input enough to reach the desired level. Other than this rough and superficial similarity in speech perception scores, acoustic models of CIs have not been convincingly validated. In fact, Laneau et al. 6 found that even a vocoder that was specifically designed to mimic pitch discrimination performance of CI subjects yielded pitch perception results that were different from those seen in at least some CI users or some testing conditions. Studies by Dorman et al. 7–9 show that 6–8 channel frequency-matched acoustic models sound quite dissimilar to the implant, and alternative acoustic models are required to enhance sound similarity to the CI 10.
The first major motivation for the present study is to validate acoustic models of CIs. A unique type of validation has become possible with the advent of single-sided deaf (SSD) patients who have a CI in one ear and normal hearing in the other ear 10–14. These patients allow a direct, within-subject perceptual comparison of the output of acoustic models to the stimulation provided by a CI 7–10,15,16. Previous studies have attempted to validate acoustic models based on either perceptual similarity or speech recognition. This study aims to determine whether both goals can be achieved simultaneously.
The present study also goes beyond validation by allowing individual participants to modify acoustic models to improve their similarity with the CI. This is intended as a step towards answering one of the most basic questions one may have with respect to CIs: what do they sound like? All we have so far is qualitative descriptions from patients: the implant sounds “like Minnie Mouse” or “like Darth Vader,” or “nothing like speech,” (or even, in rare cases, the CI is reported to sound almost identical to the acoustic model (Dorman et al. 7), and these percepts change as a function of CI experience. Tantalizing as they are, these comments are difficult to interpret. A careful analysis of the acoustic models that SSD patients find to be most similar to the CI may reveal important insights about electrical stimulation of the auditory system.
Most acoustic models used in the literature use frequency-matched analysis filters and output sounds (but see Laneau et al. 6, Dorman et al. 9 and Karoui et al. 15). In other words, the center frequency of each analysis filter is identical to the center frequency of the output noise band or to the output tone. This represents an optimistic and unvalidated premise: that the place pitch elicited by stimulating intracochlear electrodes is equal to the center frequency of the corresponding analysis filter. In fact, studies of electroacoustic pitch matching contradict this hypothesis in many cases, particularly in postlingually deaf users shortly after initial stimulation 17,18 and when electrode insertions are shallower 19–21.
The precise extent to which human listeners may or may not be able to adapt to mismatch between the normal physiological frequency-place function and that imposed by the CI is still an open question. Numerous studies have examined the amount of frequency-place mismatch at different times after initial stimulation, and the extent to which auditory plasticity in humans may or may not be sufficient to overcome it 17,19,22, but the vast majority of these studies have used nonspeech stimuli or (in a few cases) simple speech sounds like vowels 23,24. The present study provides new information assessing frequency mismatch based on the sound quality of complete spoken sentences, which is an interesting complement to previous studies in terms of ecological validity.
Methods
1). Participants:
Fourteen adult SSD CI users were tested between one and four times (for a total of 31 sessions) at different time points after initial stimulation. All participants had clinical maps programmed with the default frequency allocation tables for their respective devices. The median estimated duration of deafness was 1.12 years. See Appendix A for more information. All procedures were in accordance with NYU IRB approval #10–00702.
2). Types of acoustic models
Participants were tested using five types of acoustic models. Two of them were six-channel vocoders. The 6 CH. T model used output tones whereas the 6 CH. N model used output noise bands. Analysis filters for these two model types spanned the 188–7938 Hz range, and the six output sounds were frequency-matched to the six analysis filters. The exact frequency boundaries can be found in Svirsky, et al. (2015)25, Table II. Two additional types of acoustic models used the same number of channels and the same filter bandwidth for each channel as in the participant’s clinical CI map. The ALL CH T model used tones and the ALL CH N model used noise bands. Again, analysis filters and noise bands (or tones) were perfectly frequency-matched. The fifth type of acoustic model (named self-selected or SS) was individualized for each participant following the procedure described below. The analysis filters were fixed, identical to each participant’s clinical CI map (just like for ALL CH. T and ALL CH N. models). Thus, twenty-two channel filter banks were used for most Cochlear™ users, 16-channel filter banks for Advanced Bionics™ users, and 12-channel filter banks for MED-EL™ users. The output noise bands or tones were self-selected by each participant.
A large number of possible models were created that used a wide range of possible values for the low- and high-frequency edges of the output sounds. These are listed in Appendix B for the case when no channels are turned off. Additional information about processing for acoustic models is also included in Appendix B.
3). Acoustic Model Selection Task
Participants used a method-of-adjustment procedure to select the acoustic model that sounded “most similar” to the implant. This involved adjusting the low and high frequency edges of the output sounds used in tone and noise band models, and then determining which self-selected acoustic model (tone or noise band) was perceptually most similar to the CI.
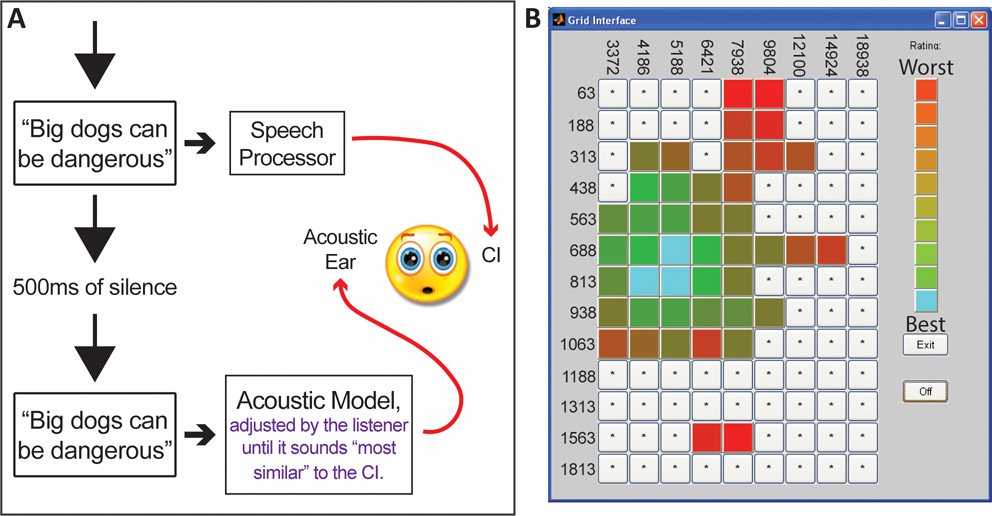
The selection procedure is illustrated in Figure 1. One HINT sentence (either “Big dogs can be dangerous” or “The player lost a shoe”) 26 was preprocessed using each acoustic model described in Appendix B and was presented to both ears successively, separated by a 500 ms pause (Fig. 1A). The first presentation was unmodified, presented to the CI processor via direct audio input with the microphone deactivated, and the second presentation was processed with an acoustic model and presented through the loudspeaker to the normal hearing ear. Stimuli presented to the speech processor were initially set at a comfortable listening level and stimuli presented to the acoustic hearing ear were initially set to 65 dB SPL-C. Then, loudness balancing was completed between the ears, by adjusting the input to the speech processor as needed.
Figure 1:
Figure 1A illustrates the self-selection process. A sentence is first presented to the CI ear via direct audio input. Then the same sentence is processed by an acoustic model and presented to the normal hearing ear. Participants adjusted output noise bands or tones to obtain a “self-selected” acoustic model. The analysis filter bank was fixed and identical to the participant’s clinical map. Figure 1B shows the grid of 117 acoustic models used for acoustic model self-selection by Cochlear™ CI users. Within the grid, the minimum frequency was denoted by the row (ranging from 63 Hz to 1,813 Hz in this case), and the maximum frequency was denoted by the column (ranging from 3,372 Hz to 18,938 Hz). The color rating scale is to the right of the grid, with an example of a participant’s ratings shown throughout the grid. Similar grids were used for MED-EL™ and Advanced Bionics™ CI users.
Participants explored different acoustic models by clicking different squares in the grid (see Fig. 1B). Moving vertically across rows (up/down) adjusted the low frequency edge of the acoustic model noise bands (or tones) and horizontal movement across columns (right/left) adjusted the high frequency edge (see Appendix B). Participant first selected a general grid area and then the specific square that corresponded to the acoustic model most similar to the CI. A color system was used to keep track of participant responses, with light blue being most similar to the CI (Fig. 1B).
The frequency range of self-selected models’ output sounds was compared to the standard frequency allocation specific to each manufacturer using the Wilcoxon one-sample signed rank test. This was done to estimate the amount of frequency mismatch for the whole data set and for each participant group, both for the high- and low-frequency edges of the self-selected models. Additionally, a Kruskal-Wallis One Way ANOVA on Ranks (necessary because data were not normally distributed) was used to compare the three participant subgroups. Lastly, the reliability of acoustic model selection was indirectly evaluated by comparing selections obtained with tone and with noise models (see Appendix C).
4). Similarity Rating Questionnaires
Participants rated acoustic models using a two-section questionnaire (see Appendix D) while continually listening to sentences, first presented unmodified to the CI ear and then processed with the appropriate acoustic models presented to the normal hearing ear. In the first section, participants indicated how similar each acoustic model type was to the CI. Similarity ratings were then compared using repeated measures ANOVA plus Dunnett’s multiple comparisons test. In the second section, each model was rated on four different dimensions: intelligibility, pleasantness, harshness, and loudness. Wilcoxon signed rank tests were used to determine whether the four dimension ratings were significantly different for each acoustic model type and for each question.
5). Speech Testing
Eight participants completed speech testing under six conditions: acoustically, using each one of the five acoustic model types, and using only the CI via direct audio input. Tests included either two 50-word lists of CNC-30 words 27 per condition (for five participants) or a 20-sentence AzBio 28 list per condition (for the other three participants). There is one AzBIO missing value from one participant in the ALL CH T condition. Repeated measures ANOVA plus Dunnett’s multiple comparisons tests were used to determine which acoustic model conditions were significantly different from the CI condition.
6). Joint analysis of similarity and speech perception scores
Similarity ratings and speech perception scores were plotted in a two-dimensional space and the 95% confidence ellipses were calculated for each acoustic model condition. The calculations were made using our own modification of a Matlab script by Vincent Spruyt 29.
Results
1). Self-selected acoustic models
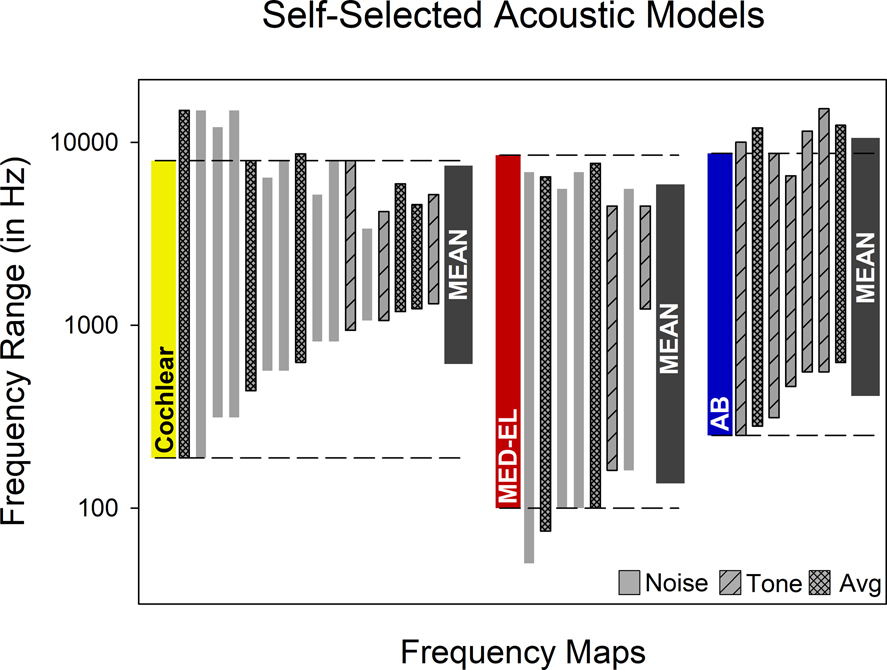
The frequency ranges of self-selected models are shown in Figure 2. For 12 sessions, a noise model was the top self-selected; for 10 sessions it was a tone model; and for the remaining 9 sessions the tone and noise self-selected models were judged equal so the average is reported in this figure. All participants selected an acoustic model that used output tone or noise bands with a different frequency range than the analysis filters. This means that, without exception, the self-selected models were not frequency matched. The low frequency edge of the self-selected noise bands or tones was significantly higher than the corresponding clinical frequency allocation tables. The median mismatch was +252 Hz (p < 0.001). When considering individual manufacturers, the difference was significant for Cochlear™ users (median mismatch = +571 Hz; p < 0.0001) and Advanced Bionics™ users (median mismatch= +237 Hz; p < 0.05), but not for MED-EL™ users. One Way ANOVA on Ranks indicated that the three subgroups were not equivalent (p=0.002), and post-hoc comparisons showed that this was due to a significant difference between the Cochlear™ and MED-EL™ groups (p<0.05). In contrast to the low frequency results, the high frequency edge of the self-selected acoustic models was not significantly different from that of the corresponding clinical frequency allocation tables for the whole group, or for the Cochlear™ or Advanced Bionics™ subgroups. The self-selected high frequency noise bands or tones was significantly lower than the high frequency edge for the MED-EL™ subgroup (p<0.01), but the difference was only 0.24 octaves.
Figure 2:
Self-selected acoustic models for each of 31 test sessions. Standard frequency ranges (analysis filters) are shown for each manufacturer. Each participant selection represents the frequency range associated with the self-selected output tones or noise bands. The legend indicates if the participant self-selected a tone or noise model as being most similar to the CI, or if the best tone and noise models were equally rated and the average was used. The geometric means of participant selections are shown for each manufacturer.
2). Acoustic model validation: similarity ratings and speech perception
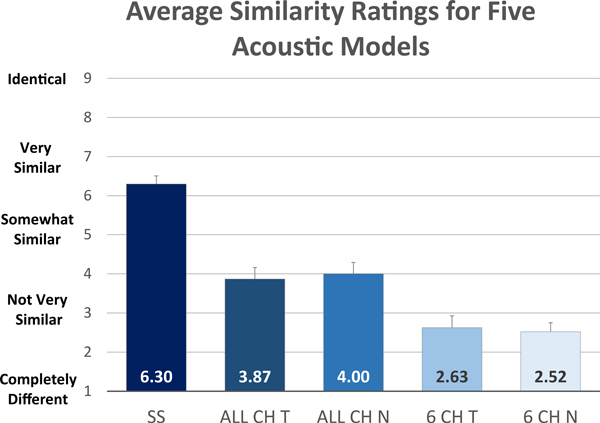
Overall, self-selected acoustic models were rated significantly more similar to CIs (higher rating) than the other acoustic models (P<0.001; see Fig. 3). The average rating for self-selected models was 6.3 which falls between descriptors of 5 (“somewhat similar”) and 7 (“very similar”). In contrast, the other acoustic models received lower average scores. ALL CH T had an average rating of 3.9, ALL CH N an average rating of 4.0. The 6 CH models had even lower scores, 2.5 for 6 CH. T and 2.9 for 6 CH N. Recall that a rating of 1 is “completely different” and a rating of 3 is “not very similar.” Out of 30 testing sessions with ratings, 93% of sessions had the self-selected model rated highest (most similar to the CI). Out of these sessions, 18% also had another model rated the same as the self-selected model.
Figure 3:
Similarity ratings for five acoustic models. Self-selected (SS) models were rated significantly more similar to the CI than all-channel frequency-matched tone and noise models (ALL CH T and ALL CH N) and 6-channel frequency-matched tone and noise models (6 CH T and 6 CH N).
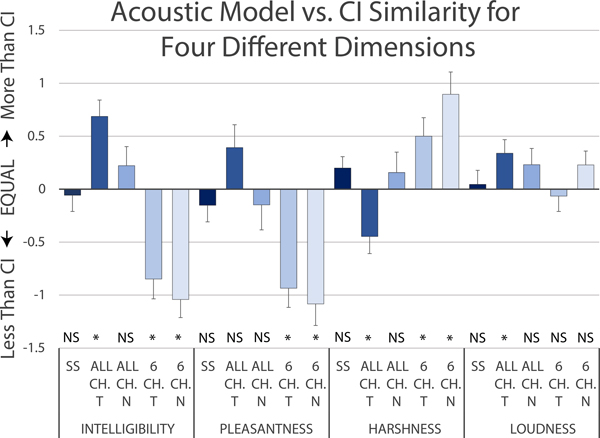
Figure 4 shows comparison ratings between the CI and all five types of acoustic models across four acoustic dimensions. For an ideal acoustic model that sounded exactly like the CI we would expect all these ratings to be zero. All-channel tone models were deemed more intelligible (median = +1, p < 0.001), less harsh (median = −0.5, p < 0.05), and louder (median = +0.25, p < 0.05) than the CI. Six-channel tone models were deemed less intelligible (median = −1, p < 0.001), less pleasant (median = −1, p = 0.0001) and harsher (median = +1, p < 0.05) than the CI. Six-channel noise models were deemed less intelligible (median = −1, p < 0.0001), less pleasant (median = −1.25, p < 0.0001), and harsher (median = +1, p < 0.001) than the CI. On the other hand, for both self-selected and all-channel noise acoustic models, none of the acoustic dimensions were rated significantly different from the CI.
Figure 4:
Ratings of similarity between each acoustic model type and the CI across four dimensions. The five acoustic model types are self-selected (SS), all-channel frequency-matched tone and noise models (ALL CH T and ALL CH N) and 6 channel frequency-matched tone and noise models (6 CH T and 6 CH N). A positive rating indicated the acoustic model was more intelligible, pleasant, harsh, or loud than the CI ear. A negative rating indicated the CI was more intelligible, pleasant, harsh, or loud than the acoustic model.
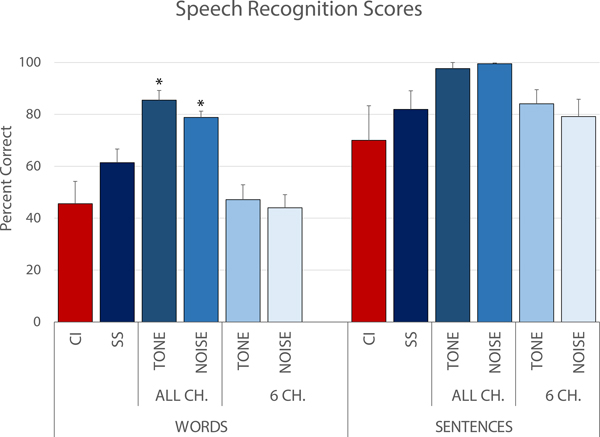
All-channel frequency-matched models resulted in overestimation of both word and sentence recognition compared to CI scores (see Fig. 5). For CNC-30 word results, CI scores were significantly lower than ALL CH T (40% difference, p < 0.0001) and ALL CH N models (33% difference, p <0.001). Speech scores for the 6-channel frequency-matched models and for the self-selected models were relatively closer to those obtained with the CI, when compared to the ALL CH models.
Figure 5:
Speech recognition scores for CNC-30 words (n=5) and AzBio sentences (n=3) for CI-only testing (CI) and for 5 acoustic models presented to the normal hearing ear: self-selected (SS), all channel frequency-matched tone (ALL CH T), all channel frequency-matched noise (ALL CH N), 6 channel frequency-matched tone (6 CH T), and 6 channel frequency-matched noise (6 CH N).
Finally, Figure 6 shows scatterplots of similarity ratings against speech perception score differences (model minus CI). Thus, an ideal acoustic model would result in identical speech scores as the CI (a y-coordinate of zero) and a similarity rating of “identical” (an x-coordinate of 9). Accuracy of acoustic models is evaluated by their proximity to the ideal (9,0) location. Ellipses spanning the 95% confidence area for each type of model show that the self-selected models are closer to the ideal acoustic model than any of the frequency-matched models.
Figure 6:
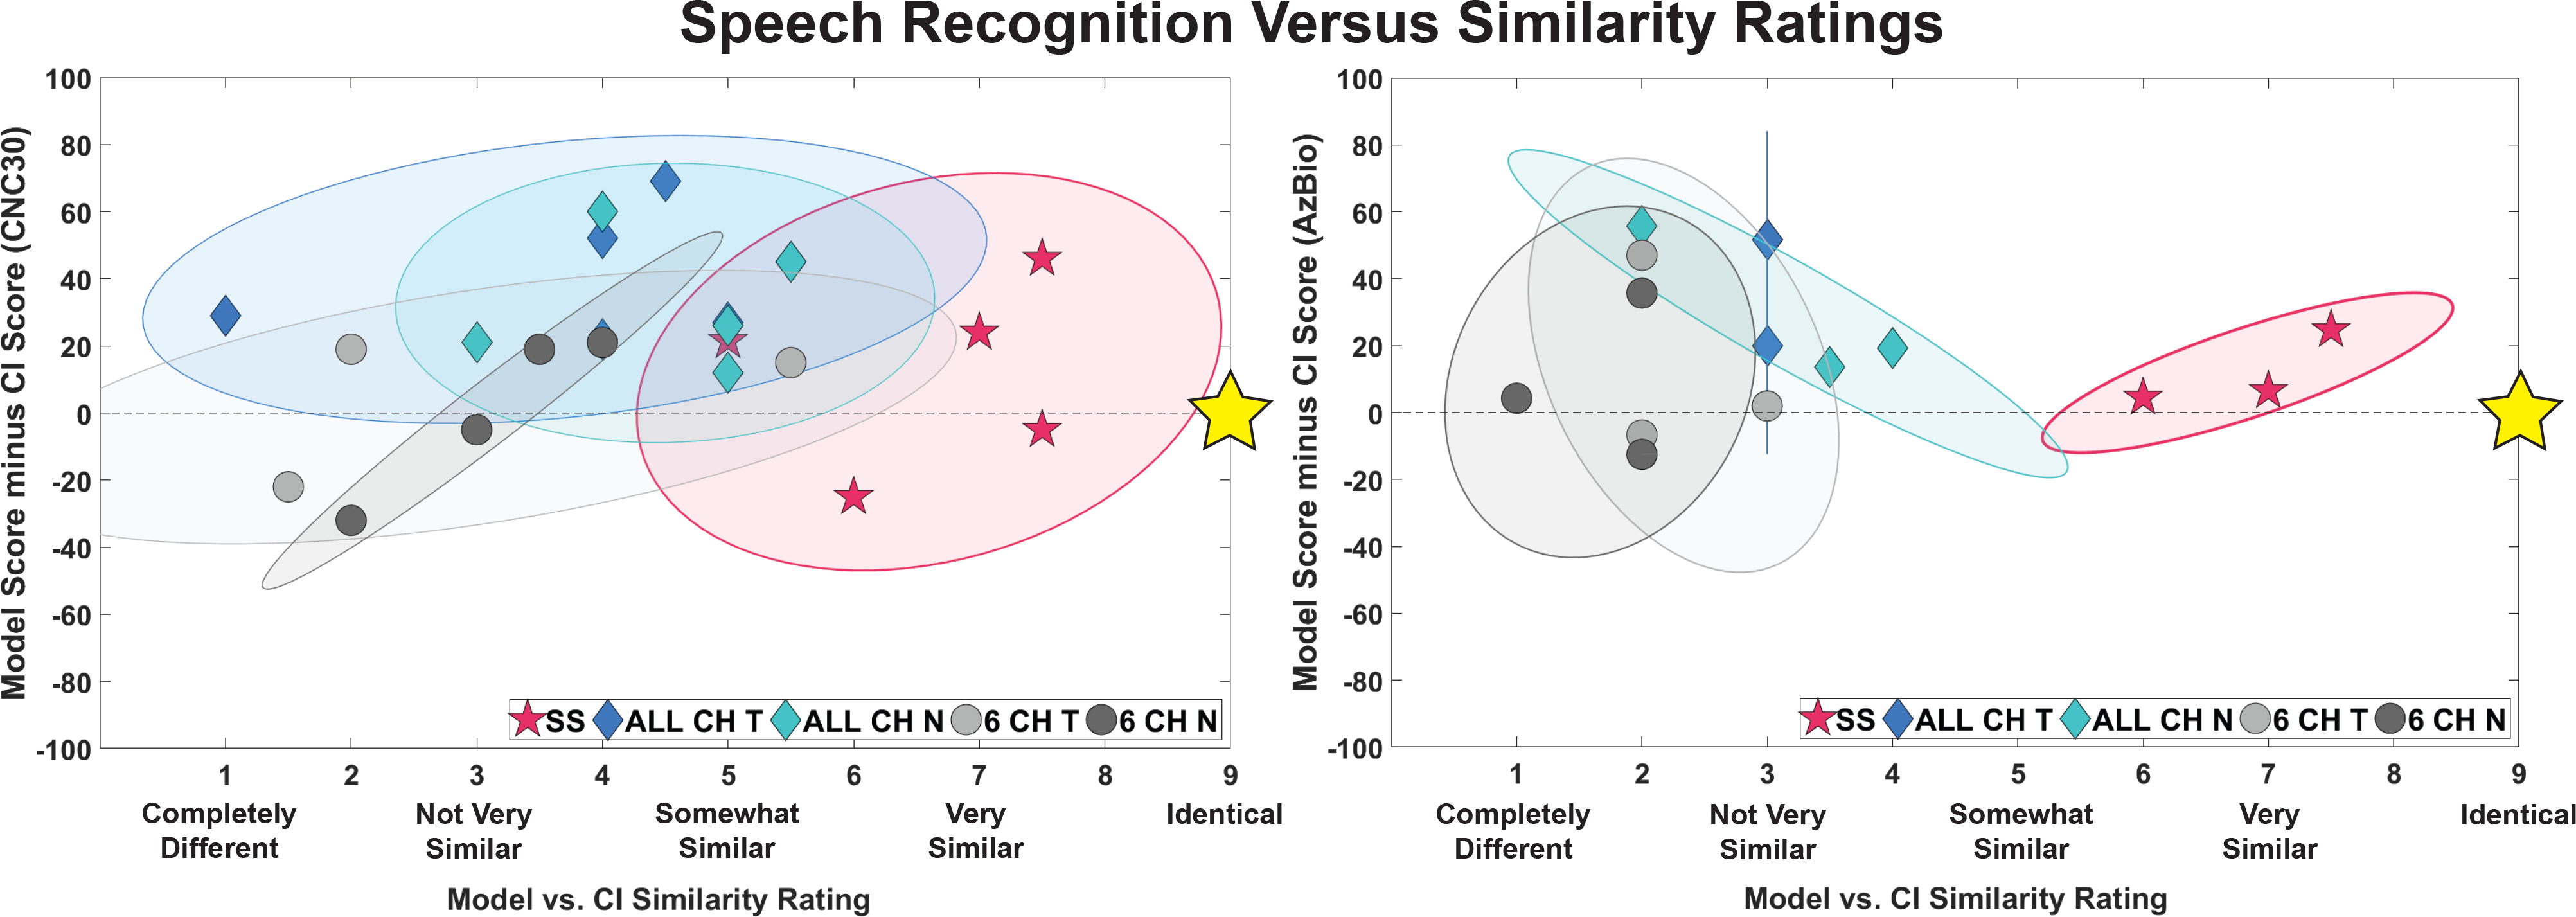
Scatterplot of overall similarity ratings and speech perception scores for five acoustic model types: self-selected (SS), all channel frequency-matched tone and noise (ALL CH T and ALL CH N), and 6 channel frequency-matched tone and noise (6 CH T and 6 CH N). The x axes show the similarity ratings and the y axes show the difference in the speech scores (acoustic model scores minus CI only scores). Those tested with CNC-30 words (n=5) are shown on the left and those tested with AzBio sentences (n=3) are shown on the right. The gold stars indicate the location of a “perfect” acoustic model: rated as “identical” to the CI and resulting in the same speech perception scores
Discussion
Two initial findings replicate conclusions from previous work. First, we found acoustic models that sound roughly similar to the CI 7–9,15 (see Fig. 3 and Fig. 4). Second, we also found acoustic models that result in speech perception scores similar to those obtained with the CI 2–5 (see Figure 5). Perhaps the most important finding of this study is that it is possible to find acoustic models that meet both conditions (see data for self-selected models in Figure 6): they are described as sounding similar to the CI, and they also result in similar speech perception scores. Moreover, this conclusion still stands when taking ratings of intelligibility, pleasantness, harshness, and loudness into account. To the best of our knowledge, this study represents the first attempt to validate acoustic models of CIs simultaneously using speech perception and subjective similarity scores. This matters because a model could fit one of the criteria (e.g., be perceptually similar) but not the other one (speech perception levels might differ significantly), and both criteria are important.
However, meeting both criteria was only possible with the self-selected acoustic models: those that had the same number of channels as the listener’s CI map, and in which each participant selected a different set of output sounds. All models other than the self-selected ones failed either the similarity measure or the speech perception measure, sometimes in spectacular fashion. The all-channel, frequency matched models failed in the sense that they resulted in word identification scores roughly double those observed with the CI (roughly 80% vs. 40% correct). The six-channel tone or noise, frequency-matched acoustic models were rated 2.5 to 2.6 in terms of similarity with the CI, in a scale where 3 represents “not very similar” (even though they resulted in speech perception scores comparable to those obtained with the CI). They were also rated as being harsher, less pleasant, and (surprisingly) less intelligible than the CI. The failure of the six-channel models seems particularly relevant because these models are very similar to those that have been used in many published acoustic model studies. We now know that these traditional acoustic models of CIs that use frequency matched analysis filters and output tones or noise bands sound very different from actual CIs 8,15. We have learned this from judgements made by listeners who are in the best position to answer the relevant question: those who have a CI in one ear and normal hearing in the contralateral ear.
There were large individual differences in the output tones or noise bands of the acoustic models selected by different participants. This suggests that a single acoustic model may be unable to represent percepts obtained by different CI users. In other words, when it comes to acoustic models of CIs, one size may not fit all. Different models may be necessary to target specific subsections of the CI population as well as different individuals, and it is possible that the optimal acoustic model for a given individual may even change as a function of experience with the CI.
The specific acoustic models selected by different participants provide an indirect estimate of how completely they may have adapted to CI-imposed frequency mismatch. In particular, the low frequency edge of the self-selected output tones or noise bands was significantly higher than the low frequency edge of the analysis filter bank for the same listener (see Figure 2). This is consistent with the basalward frequency mismatch that postlingually deaf CI users are expected to experience due to the insertion depth of their electrode arrays. The most apical electrode in some CIs is in a location where the closest spiral ganglion neurons likely have a characteristic frequency that may be one or two octaves higher than the low frequency edge of the frequency allocation tables normally used in clinical speech processors 30,31. This observation is supported by electroacoustic pitch matching performed shortly after initial stimulation in CI users who have residual hearing in the nonimplanted ear 18,21. The observed basalward frequency mismatch was more pronounced for users of the Cochlear™ and Advanced Bionics™ devices than for users of MED-EL™ devices. The latter have a longer electrode array, so this result is consistent with the possibility that basalward frequency mismatch is partially driven by electrode location. This location determines the mismatch between the neural population stimulated by a given sound in a normal ear and the neural population stimulated by the same sound in a CI user. The present results provide some evidence to suggest frequency mismatch has some impact on sound quality. Note, however, that some Cochlear™ and Advanced Bionics™ users showed little or no basalward frequency mismatch. This suggests that the percepts elicited by a CI in response to speech stimuli can sometimes change as a function of experience (see Appendix A), consistent with the longitudinal changes in electroacoustic pitch matching that have been observed as a function of experience 17,32
We hypothesize that the way a CI sounds changes systematically as a function of electrode insertion angle and experience with the device. Explicit testing of this hypothesis is already being conducted in a follow up experiment in our laboratory. Other future directions involve testing alternative acoustic models that seem to be superior to traditional tone or noise vocoders. These may include the SPIRAL vocoder 33, the pulse-spreading harmonic complex vocoder 34, as well as the various acoustic model parameters used by the Dorman group 7–9. One obvious difficulty in this endeavor will be the time and effort it might take listeners to adjust all model parameters simultaneously in order to find the best fitting acoustic model. The method-of-adjustment approach we have used in the present study may not be feasible when comparing acoustic models in a higher dimensional space. Thus, it will be important to find more efficient (and less subjective) methods to explore such spaces. The genetic algorithm initially proposed as a tool to enhanced and personalize CI map parameter fitting 35,36 is one example of the tools that might be brought to bear. In any case, the search for better acoustic models of CIs is already bearing fruit. This has implications not only for the practical use of such models but also in terms of what those improved models might teach us about the electrical stimulation of the postlingually deafened auditory system.
Supplementary Material
Appendix A Supplemental Digital Content 1.pdf
Appendix B Supplemental Digital Content 2.pdf
Appendix C Supplemental Digital Content 3.docx
Appendix D Supplemental Digital Content 4.docx
Acknowledgments
Conflicts of Interest and Source of Funding
The work described in these pages was supported by the following NIH-NIDCD grants, R01-DC03937 (PI: Svirsky), R01-DC011329 (PIs: Svirsky and Neuman), K99-DC009459 (PI: Fitzgerald), K25DC010834 (PI: Tan), by Cochlear Americas (PI: J. Thomas Roland, Jr), and by Med-El (PI: Svirsky). We appreciate the support of Susan B. Waltzman and J. Thomas Roland, Jr., co-directors of the NYU Cochlear Implant Center, as well as William H. Shapiro and Jacquelyn M. Hoffman for their help with subject recruitment. E.K.G. is an employee of MED-EL Corporation and A.L. is an employee if Cochlear Americas.
REFERENCES
- 1.Blamey PJ, Dowell RC, Tong YC, Clark GM. An acoustic model of a multiple-channel cochlear implant. J Acoust Soc Am. 1984;76(1):97–103. [DOI] [PubMed] [Google Scholar]
- 2.Dorman MF, Loizou PC, Fitzke J, Tu Z. Recognition of monosyllabic words by cochlear implant patients and by normal-hearing subjects listening to words processed through cochlear implant signal processing strategies. Ann Otol Rhinol Laryngol Suppl. 2000;185:64–66. [DOI] [PubMed] [Google Scholar]
- 3.Dorman MF, Loizou PC, Kemp LL, Kirk KI. Word recognition by children listening to speech processed into a small number of channels: data from normal-hearing children and children with cochlear implants. Ear Hear. 2000;21(6):590–596. [DOI] [PubMed] [Google Scholar]
- 4.Friesen LM, Shannon RV, Baskent D, Wang X. Speech recognition in noise as a function of the number of spectral channels: comparison of acoustic hearing and cochlear implants. J Acoust Soc Am. 2001;110(2):1150–1163. [DOI] [PubMed] [Google Scholar]
- 5.Shannon RV, Zeng FG, Kamath V, Wygonski J, Ekelid M. Speech recognition with primarily temporal cues. Science. 1995;270(5234):303–304. [DOI] [PubMed] [Google Scholar]
- 6.Laneau J, Moonen M, Wouters J. Factors affecting the use of noise-band vocoders as acoustic models for pitch perception in cochlear implants. J Acoust Soc Am. 2006;119(1):491–506. [DOI] [PubMed] [Google Scholar]
- 7.Dorman MF, Natale SC, Baxter L, Zeitler DM, Carlson ML, Lorens A, Skarzynski H, Peters JPM, Torres JH, Noble JH. Approximations to the Voice of a Cochlear Implant: Explorations With Single-Sided Deaf Listeners. Trends Hear. 2020;24:2331216520920079. PMC7225791 [DOI] [PMC free article] [PubMed] [Google Scholar]
- 8.Dorman MF, Natale SC, Butts AM, Zeitler DM, Carlson ML. The Sound Quality of Cochlear Implants: Studies With Single-sided Deaf Patients. Otol Neurotol. 2017;38(8):e268–e273. PMC5606248 [DOI] [PMC free article] [PubMed] [Google Scholar]
- 9.Dorman MF, Natale SC, Zeitler DM, Baxter L, Noble JH. Looking for Mickey Mouse™ But Finding a Munchkin: The Perceptual Effects of Frequency Upshifts for Single-Sided Deaf, Cochlear Implant Patients. J Speech Lang Hear Res. 2019;62(9):3493–3499. PMC6808340 [DOI] [PMC free article] [PubMed] [Google Scholar]
- 10.Svirsky MA, Ding N, Sagi E, Tan CT, Fitzgerald M, Glassman EK, Seward K, Neuman AC. VALIDATION OF ACOUSTIC MODELS OF AUDITORY NEURAL PROSTHESES. Proc IEEE Int Conf Acoust Speech Signal Process. 2013;2013:8629–8633. PMC4244817 [DOI] [PMC free article] [PubMed] [Google Scholar]
- 11.Cohen SM, Svirsky MA. Duration of unilateral auditory deprivation is associated with reduced speech perception after cochlear implantation: A single-sided deafness study. Cochlear Implants Int. 2019;20(2):51–56. PMC6335158 [DOI] [PMC free article] [PubMed] [Google Scholar]
- 12.Vermeire K, Van de Heyning P. Binaural hearing after cochlear implantation in subjects with unilateral sensorineural deafness and tinnitus. Audiol Neurootol. 2009;14(3):163–171. [DOI] [PubMed] [Google Scholar]
- 13.Punte AK, Vermeire K, Hofkens A, De Bodt M, De Ridder D, Van de Heyning P. Cochlear implantation as a durable tinnitus treatment in single-sided deafness. Cochlear Implants Int. 2011;12 Suppl 1:S26–29. [DOI] [PubMed] [Google Scholar]
- 14.Arts RA, George EL, Stokroos RJ, Vermeire K. Review: cochlear implants as a treatment of tinnitus in single-sided deafness. Curr Opin Otolaryngol Head Neck Surg. 2012;20(5):398–403. [DOI] [PubMed] [Google Scholar]
- 15.Karoui C, James C, Barone P, Bakhos D, Marx M, Macherey O. Searching for the Sound of a Cochlear Implant: Evaluation of Different Vocoder Parameters by Cochlear Implant Users With Single-Sided Deafness. Trends Hear. 2019;23:2331216519866029. PMC6753516 [DOI] [PMC free article] [PubMed] [Google Scholar]
- 16.Peters JPM, Bennink E, van Zanten GA. Comparison of Place-versus-Pitch Mismatch between a Perimodiolar and Lateral Wall Cochlear Implant Electrode Array in Patients with Single-Sided Deafness and a Cochlear Implant. Audiol Neurootol. 2019;24(1):38–48. PMC6549524 [DOI] [PMC free article] [PubMed] [Google Scholar]
- 17.Reiss LA, Ito RA, Eggleston JL, Liao S, Becker JJ, Lakin CE, Warren FM, McMenomey SO. Pitch adaptation patterns in bimodal cochlear implant users: over time and after experience. Ear Hear. 2015;36(2):e23–34. PMC4336615 [DOI] [PMC free article] [PubMed] [Google Scholar]
- 18.McDermott H, Sucher C, Simpson A. Electro-acoustic stimulation. Acoustic and electric pitch comparisons. Audiol Neurootol. 2009;14 Suppl 1:2–7. [DOI] [PubMed] [Google Scholar]
- 19.Vermeire K, Landsberger DM, Van de Heyning PH, Voormolen M, Kleine Punte A, Schatzer R, Zierhofer C. Frequency-place map for electrical stimulation in cochlear implants: Change over time. Hear Res. 2015;326:8–14. PMC4524783 [DOI] [PMC free article] [PubMed] [Google Scholar]
- 20.Peters JPM, Bennink E, Grolman W, van Zanten GA. Electro-acoustic pitch matching experiments in patients with single-sided deafness and a cochlear implant: Is there a need for adjustment of the default frequency allocation tables? Hear Res. 2016;342:124–133. [DOI] [PubMed] [Google Scholar]
- 21.Tan CT, Martin B, Svirsky MA. Pitch Matching between Electrical Stimulation of a Cochlear Implant and Acoustic Stimuli Presented to a Contralateral Ear with Residual Hearing. J Am Acad Audiol. 2017;28(3):187–199. PMC5435235 [DOI] [PMC free article] [PubMed] [Google Scholar]
- 22.Goupell MJ, Cosentino S, Stakhovskaya OA, Bernstein JGW. Interaural Pitch-Discrimination Range Effects for Bilateral and Single-Sided-Deafness Cochlear-Implant Users. J Assoc Res Otolaryngol. 2019;20(2):187–203. PMC6454100 [DOI] [PMC free article] [PubMed] [Google Scholar]
- 23.Harnsberger JD, Svirsky MA, Kaiser AR, Pisoni DB, Wright R, Meyer TA. Perceptual “vowel spaces” of cochlear implant users: implications for the study of auditory adaptation to spectral shift. J Acoust Soc Am. 2001;109(5 Pt 1):2135–2145. PMC3433712 [DOI] [PMC free article] [PubMed] [Google Scholar]
- 24.Svirsky MA, Silveira A, Neuburger H, Teoh SW, Suárez H. Long-term auditory adaptation to a modified peripheral frequency map. Acta Otolaryngol. 2004;124(4):381–386. [PubMed] [Google Scholar]
- 25.Svirsky MA, Fitzgerald MB, Sagi E, Glassman EK. Bilateral cochlear implants with large asymmetries in electrode insertion depth: implications for the study of auditory plasticity. Acta Otolaryngol. 2015;135(4):354–363. PMC4386730 [DOI] [PMC free article] [PubMed] [Google Scholar]
- 26.Nilsson M, Soli SD, Sullivan JA. Development of the Hearing in Noise Test for the measurement of speech reception thresholds in quiet and in noise. J Acoust Soc Am. 1994;95(2):1085–1099. [DOI] [PubMed] [Google Scholar]
- 27.Skinner MW, Holden LK, Fourakis MS, Hawks JW, Holden T, Arcaroli J, Hyde M. Evaluation of equivalency in two recordings of monosyllabic words. J Am Acad Audiol. 2006;17(5):350–366. [DOI] [PubMed] [Google Scholar]
- 28.Spahr AJ, Dorman MF, Litvak LM, Van Wie S, Gifford RH, Loizou PC, Loiselle LM, Oakes T, Cook S. Development and validation of the AzBio sentence lists. Ear Hear. 2012;33(1):112–117. PMC4643855 [DOI] [PMC free article] [PubMed] [Google Scholar]
- 29.Spruyt V How to draw a covariance error ellipse? https://www.visiondummy.com/2014/04/draw-error-ellipse-representing-covariance-matrix/. Published 2014. Accessed 2019.
- 30.Landsberger DM, Svrakic M, Roland JT Jr., Svirsky M. The Relationship Between Insertion Angles, Default Frequency Allocations, and Spiral Ganglion Place Pitch in Cochlear Implants. Ear Hear. 2015;36(5):e207–213. PMC4549170 [DOI] [PMC free article] [PubMed] [Google Scholar]
- 31.Canfarotta MW, Dillon MT, Buss E, Pillsbury HC, Brown KD, O’Connell BP. Frequency-to-Place Mismatch: Characterizing Variability and the Influence on Speech Perception Outcomes in Cochlear Implant Recipients. Ear Hear. 2020;41(5):1349–1361. [DOI] [PMC free article] [PubMed] [Google Scholar]
- 32.Svirsky MA, Fitzgerald MB, Neuman A, Sagi E, Tan CT, Ketten D, Martin B. Current and planned cochlear implant research at New York University Laboratory for Translational Auditory Research. J Am Acad Audiol. 2012;23(6):422–437. PMC3677062 [DOI] [PMC free article] [PubMed] [Google Scholar]
- 33.Grange JA, Culling JF, Harris NSL, Bergfeld S. Cochlear implant simulator with independent representation of the full spiral ganglion. J Acoust Soc Am. 2017;142(5):El484. [DOI] [PubMed] [Google Scholar]
- 34.Hilkhuysen G, Macherey O. Optimizing pulse-spreading harmonic complexes to minimize intrinsic modulations after auditory filtering. J Acoust Soc Am. 2014;136(3):1281. [DOI] [PubMed] [Google Scholar]
- 35.Wakefield GH, van den Honert C, Parkinson W, Lineaweaver S. Genetic algorithms for adaptive psychophysical procedures: recipient-directed design of speech-processor MAPs. Ear Hear. 2005;26(4 Suppl):57s–72s. [DOI] [PubMed] [Google Scholar]
- 36.Lineaweaver SKR, Wakefield GH. Psychometric augmentation of an interactive genetic algorithm for optimizing cochlear implant programs. In Proceedings of the 13th annual conference on genetic and evolutionary computation (Pages 1755–1762); July 12 – 16, 2011; Dublin, Ireland. 10.1145/2001576.2001812 [DOI] [Google Scholar]
Associated Data
This section collects any data citations, data availability statements, or supplementary materials included in this article.
Supplementary Materials
Appendix A Supplemental Digital Content 1.pdf
Appendix B Supplemental Digital Content 2.pdf
Appendix C Supplemental Digital Content 3.docx
Appendix D Supplemental Digital Content 4.docx


