Abstract
Carbon from biomass as an active material for supercapacitor electrodes has attracted much interest due to its environmental soundness, abundance, and porous nature. In this context, activated carbon prepared from coconut shells via a simple activation process (water or steam as activation agents) was used as an active material in electrodes for eco-friendly supercapacitors. X-ray diffraction (XRD), Raman spectroscopy, conductivity, scanning electron microscopy (SEM), N2 sorption and thermogravimetry coupled to mass spectrometry (TGA-MS) studies revealed that activated carbon produced by this approach exhibit a graphitic phase, a high surface area, and large pore volume. The energy storage properties of activated carbon electrodes correlate with the morphological and structural properties of the precursor material. In particular, electrodes made of activated carbon exhibiting the largest Brunauer–Emmett–Teller (BET) surface area, i.e. 1998 m2 g−1, showed specific capacitance of 132.3 F g−1 in aqueous electrolyte (1.5 M H2SO4), using expanded graphite sheets as current collector substrates. Remarkably, this sample in a configuration with ionic liquid (1-methyl-1-propy-pyrrolizinium bis(fluorosulfonyl)mide) (MPPyFSI) as electrolyte and a polyethylene separator displayed an outstanding storage capability and energy-power handling capability of 219.4 F g−1 with a specific energy of 92.1 W h kg−1 and power density of 2046.9 W kg−1 at 1 A g−1 and maintains ultra-high values at 30 A g−1 indicating the ability for a broad potential of energy and power related applications. To the best of our knowledge, these values are the highest ever reported for ionic liquid-based supercapacitors with activated carbon obtained from the biomass of coconut shells.
Simple ecofriendly activation process of carbon obtained from coconut shell-based waste was used for the fabrication of non-volatile high performance supercapacitors.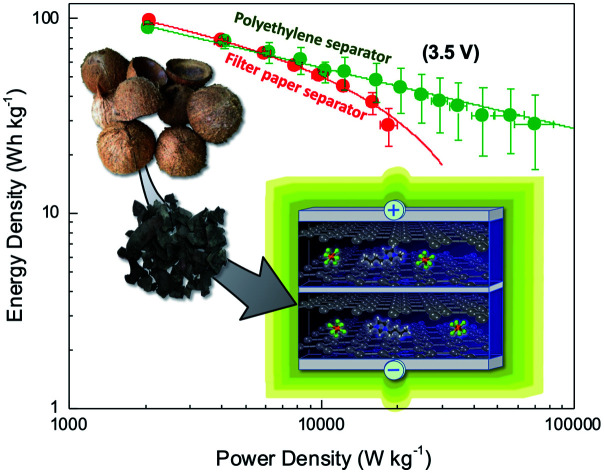
1. Introduction
Biomass as an abundant material is widely used for numerous applications,1–5 due to its widespread availability, sustainability, unique structures, and low-cost. In particular, the crystalline nature of the carbonaceous materials obtained from biomass makes them suitable for rapid ion-transportation during energy storage processes in electrochemical supercapacitors.6,7 Although many carbonaceous materials have been studied for a long time, biomass-derived charcoal continues to dominate the commercial supercapacitor industry. Compared to batteries, supercapacitors have higher power densities and cycling stability.8 The performance of supercapacitors strongly depends on the morphology of the electrode materials, current collectors, electrolytes and separators. In particular the morphology of the electrodes is crucial since the amount of charge stored is proportional to the effective surface area of the carbon material. An ideal electrode material is therefore expected to exhibit high surface area, high porosity, homogeneous pore size distribution, and high electrical conductivity, as well as having a low production cost.9,10 Among the carbonaceous materials reported in the literature, activated carbon obtained from biomass have attracted worldwide attention due to their high abundance, relatively low processing cost, and environmental friendliness.11 Varieties of biomass materials have been used as precursors for the preparation of porous activated carbon using various activation processes.12–14 Among all the biomass resources, carbon phases originated from coconut shell charcoal possesses several advantageous features, because of their mesoporous structure,15 hardness, and electronic conductivity.
Thus, activated carbon electrodes processed from coconut shell charcoal, activated via a variety of processes, have been utilized successfully as electrodes for supercapacitors as summarized in Table 1.
Properties of activated carbon prepared from coconut-based precursors.
| Coconut precursor | Activation agent | Surface area | Storage properties | Electrolytes | Ref. |
|---|---|---|---|---|---|
| Aqueous electrolyte: potential range <1V | |||||
| Shell | Steam | 1532 m2 g−1 | 228 F g−1, 38.5 W h kg−1 | 6 M KOH | 16 |
| Shell | Pyrolysis | 1194 m2 g−1 | 258 F g−1 | 1 M H2SO4 | 17 |
| Kernel | KOH | 1200 m2 g−1 | 173 F g−1 | 1 M H2SO4 | 18 |
| Shell | KOH, HCl | 1416 m2 g−1 | 186 F g−1, 11 W h kg−1, 325 W kg−1 | 1 M KOH gel | 19 |
| Shell | KOH | — | 184 F g−1, 6.4 W h kg−1, 46.17 W kg−1 | KOH | 20 |
| Fibers | KOH | 2898 m2 g−1 | 266 F g−1 | 6 M KOH | 21 |
| Shell | H3PO4 | 1176 m2 g−1 | 102 F g−1 | 1 M Na2SO4 | 22 |
| Shell | ZnCl2 | 1874 m2 g−1 | 268 F g−1, 7.3 W h kg−1, 7100 W kg−1 | 6 M KOH | 23 |
| Volatile electrolyte: potential range <3V | |||||
| Shell | ZnCl2 | 1874 m2 g−1 | 196 F g−1, 54.7 W h kg−1, 10 000 W kg−1 | 1 M Et4NBF4-PC | 23 |
| Non-volatile electrolyte: potential range <3.5 V | |||||
| Shell | KOH | 3261 m2 g−1 | 261 F g−1, 68.6 W h kg−1, 36 000 W kg−1 | EMImBF4 | 24 |
| Fibers | KOH | 2898 m2 g−1 | 155 F g−1, 53 W h kg−1, 8224 W kg−1 | EMImBF4 | 21 |
An essential factor for activation process is the selection of the activation agent. Several types of activating agents are frequently used such as, KOH, H3PO4, HCl, ZnCl2, H2O, steam etc. to obtain porous carbon and then used as electrodes for supercapacitors. On the other hand, most of the works reported so far focused on the use of these activated carbon electrodes from coconut precursors for aqueous supercapacitors. The surface area of activated carbons prepared varies from 1176 to 3261 m2 g−1 leading to a specific capacitance ranging from 102 to 268 F g−1.16–24 This trend can be attributed to improved morphological properties such as BET surface area and porosity of the electrodes. However, in these examples, acidic or basic aqueous electrolytes operating in a narrow potential window (i.e. less than 1 V) were employed yielding lower performances of the final devices. To the best of our knowledge, only a few studies were reported on supercapacitors-based activated coconut charcoal in contact with organic electrolytes.
For instance, organic electrolyte Et4NBF4-PC (tetraethylammonium tetrafluoroborate in propylene carbonate (PC))23 led to devices with an operating window of 3.0 V. However, electrochemical instability and toxicity constitute severe drawbacks of organic Et4NBF4-PC that can be dangerous in case of over-potential. On the other hand, solvent free ionic liquid, such as EMImBF4 (1-ethyl-3-methylimidazolium tetrafluoroborate),21,24 with an operating potential window of 3.5 V is therefore of great interest which guarantees stability and high energy densities at room temperature.
We herein describe new modified coconut charcoal activation procedures enabling to provide activated carbons exhibiting high surface area, appropriate pore size, and electrical conductivity suitable for high performance non-volatile supercapacitors application. The strategy developed to prepare these activated carbons involves ecofriendly and safe procedures, avoiding the use of hazardous or toxic chemicals.
Electrochemical performances of supercapacitors made of the carbons prepared were first studied in the presence of aqueous electrolyte, then the influence of both current collector and electrolyte nature on the energy storage properties were investigated for the most efficient carbon materials. Remarkably, supercapacitors including non-volatile ionic liquid electrolyte and the activated carbons with the largest specific areas led to impressive energy density–power density properties.
2. Experimental
2.1. Preparation methods for the activated carbons
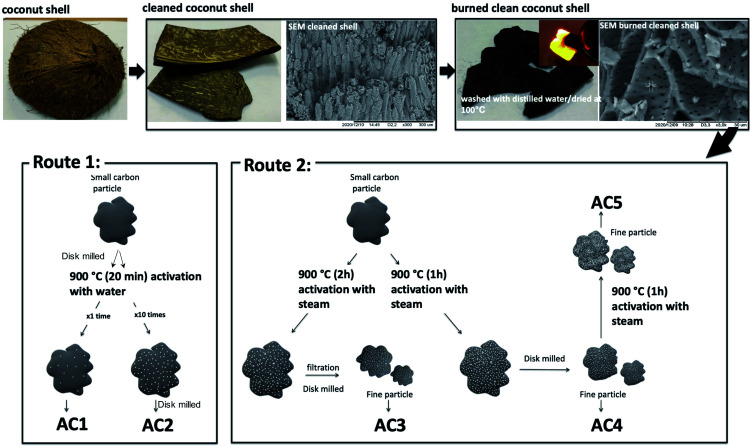
Preparation methods of the various activated carbon materials are summarized in Scheme 1 and were classified in two routes as a function of the activating agent used, i.e. H2O for the Route 1 and steam for the Route 2.
Scheme 1. Preparation methods of activated carbon (AC1–AC5) using coconut shells as precursor. The final products were prepared according to the activation routes using distilled water quenching or steam as an activation agent.
First, coconut shells were cleaned by sanding the outside surface. Thereafter the shells were washed with distilled water, dried and burned in a closed container. Charcoal produced was then washed with distilled water and dried at 100 °C.
Route 1: The activation process was done as follows, the powder from charcoal were compacted to closed container and heated at 900 °C in a box furnace for 20 min then immediately quenched with distilled water to get activated. Two type of particles size carbons were activated.
The first one, washed charcoal was disc milled for 10 min to get powder then activated. The separated powder was dried in air yielding activated carbon hereafter named AC1.
Second one, burned coconut shell charcoal was grounded into small particles (0.5 to 1.5 mm) and then get activated by repeating 10 times the activation process.
Then the particles were dried and disc milled again for 10 min to reduce the particle size. Hereafter these samples are named AC2.
Route 2: For this route the activation process was performed at 900 °C in a box furnace for 1 or 2 hours while passing steam.
The sample named AC3 was obtained from coconut shell charcoal grounded to obtain small particles with sizes ranging from 0.5 to 1.5 mm. Then this product was activated by heating 2 hours while passing steam and immediately quenched with distilled water. The resulting solution was filtered and dried to obtain the activated carbon.
For the samples heated for 1 hour the activated charcoal was cooled to 200 °C with the continuous steam flow. Activated small particles were dried and disc milled for 3 minutes to obtain a fine powder denoted AC4. Half of the above activated charcoal powder was further activated and allowed to cool to 200 °C while continuing the steam flow. These samples are named AC5.
2.2. Characterization of the activated carbon powders and films
X-ray diffraction (XRD) spectra of the activated carbon materials (AC1–AC5) were acquired with a Bruker AXS diffractometer (D2 PHASER A26-X1-A2B0D3A) using a Cu anode (Kα radiation). The average crystallite size, crystal width along a-axis (La) for the peak (100), or crystal diameter25 and stacking height along c-axis (Lc) for the peak (002),26 or crystal height (thickness) of the prepared carbonaceous particles were estimated using Scherrer equations:
The shape factor k is 1.84 for the calculation of the diameter of graphite crystallite (La) and 0.9 for the calculation of thickness of the crystallite (Lc), β is the full width at half-maximum (FWHM) of the diffraction peaks.
Confocal Raman spectroscopy studies were carried out with a Labram HR800 Horiba spectrometer equipped with an air-cooled CCD detector (ANDOR) using an argon laser (514.5 nm) provided with a grating of 600 groves per mm and an aperture of 200 μm, resulting in a spectral resolution of ∼7 cm−1. To avoid the degradation of the samples during the measurements, the power of the laser was adjusted at 0.7 mW. All spectra were normalized to the G band and Gauss–Lorentz fitting was used for the devolution of the spectra.
Surface areas and pore characteristics of the powders at the microscale and mesoscale levels were obtained by performing nitrogen adsorption measurements with a Micromeritics 3Flex surface characterization analyzer, after degassing the samples at 300 °C. The Brunauer–Emmett–Teller (BET) method and the pore size distribution N2-DFT model (Micrometrics software package) were used to exploit the data.
The scanning electron microscopy (SEM) images of the activated carbon powders were recorded using a field emission scanning microscope (FE-SEM JSM6700F, Jeol 6700F) and the cross-sectional view for the activated carbon films on the fluorine doped tin oxide SnO2:F (FTO) substrates by tabletop microscope (TM-100, Hitachi).
Thermogravimetric analyses data of the powders (AC1–AC5) were recorded between 20 and 900 °C under an argon flow at a heating rate of 10 °C min−1 with a NETZSCH STA 449 F5 Jupiter coupled with QMS 403 D Aeolos Quadro simultaneous analyzer.
2.3. Preparation of the supercapacitors-based on the activated carbon electrodes
The working electrodes were prepared by mixing activated carbons (AC1–AC5) with binders (PVP and PVDF, carbon black) in ethanol (Table S1†). The films were prepared by doctor blade technique on conductive substrates. The weight of the active material was calculated by the difference between the mass of the substrates before coating and that of dried activated carbon (100 °C for 15 min) deposited onto the substrates. The electrodes were sandwiched with a separator and electrolyte and the storage properties were determined from cyclic voltammetry (CV) and charging–discharging curves (CD).
2.4. Characterization of the supercapacitors-based on the activated carbon
The electrochemical performances were obtained by measuring device capacitance, (F g−1) of two-electrode systems using cyclic voltammetry (CV): and charge–discharge measurements to evaluate device capacitance, (F g−1):
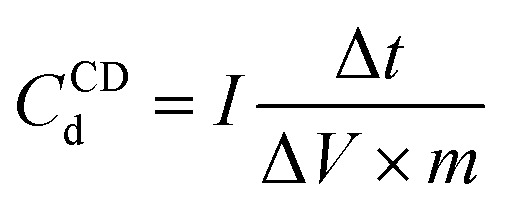 using Capacitor Analyser (VMK-8000, SPD Laboratory Inc., Japan) at various scan rates and different current densities, respectively. The control software of VMK-8000 automatically calculates the area within the CV curves and all of the important parameters in CD measurements. The Q, ΔV, scan rate, and m used in the above formula represent the amount of charge calculated from the area of CV curves (C), voltage change (V), scan rate (V s−1), and mass (g) of the active material, respectively. In the CD capacitance calculation formula, I, Δt, ΔV are discharged current (A), discharge time (s), and voltage change (V), respectively.
Single electrode capacitances (CCVs) and from charging–discharging curves (CCDs) were estimated according to the following equations:27CCVs = 4CCVd and CCDs = 4CCDd
The specific energy, E (W h kg−1) and power density P (W kg−1) were calculated from charging–discharging curves with following equations: where CCDd, Vmax, and Δt are device capacitance (F g−1), maximum charging voltage (V), discharging time (s), respectively.
The electrochemical impedance of the supercapacitors (two electrodes system) was carried out under open-circuit voltage from a frequency of 10 kHz to 0.01 Hz, with a potential perturbation of 10 mV. The single electrode capacitance components derived from impedance measurements were calculated using the formula: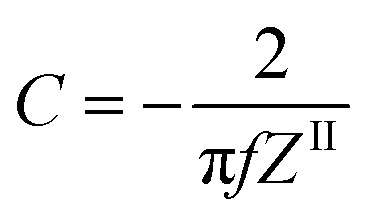 where f and ZII are frequency (Hz) and imaginary impedance component (Ω), respectively.
The resistivity of the prepared electrodes was measured by the 4-probe technique using Keithley (2450 Source Meter) on 25 μm-thick films of activated carbons (AC1–AC5) deposited by the doctor-blading technique. Several measurements were performed at different points of the films and average values were obtained.
3. Results and discussion
3.1. Structural and morphological studies
3.1.1. Structural characterization
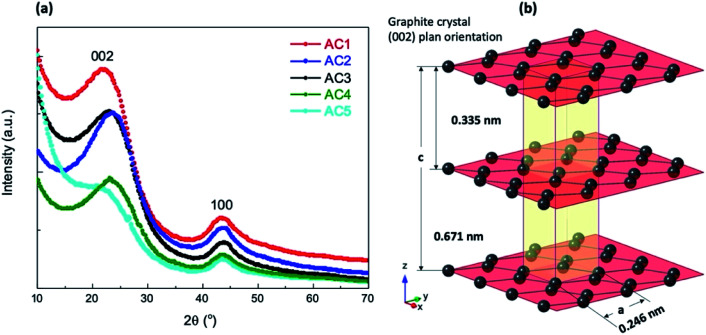
XRD patterns of the materials (AC1–AC5) are shown in Fig. 1a and the schematic structure of graphite with the crystallographic parameters a and c in the Fig. 1b. The crystallite characteristics extracted from the XRD are summarized in Table 2. Each XRD pattern exhibits two broad diffraction features located at ∼23° and 43° which correspond to the (002) and (100) planes of graphite structure (JCPDS 00-056-0159). These patterns reveal a small difference in the graphite crystallinity and intensity of the (002) and (100) peaks. Thus, the broad diffraction (002) peak observed for AC5 suggests that the material is highly disordered, partly crystallized and mostly graphitic in phase morphology. The (002) peak, which can be assigned to the graphitic planes, shifts toward larger angles, from 22.8° (22.9°) for AC5 (AC1), to 23.9° (23.4°, 23.0°) for AC2 (AC3, AC4) indicating an increase in the stacking thickness of the graphitic layers.
Fig. 1. (a) XRD pattern of the activated carbon samples prepared according to different conditions, AC1–AC5 (b) crystalline structure of the graphite showing the unit cell, (002) plane orientation, and the lattice parameters (a and c axis), crystal structure corresponding to JCPDS 00-056-0159.
Microcrystalline structure of activated carbon using different activation treatment of the coconut charcoal precursors.
| Samples | 2θ002 (°) | 2θ100 (°) | d 002 (nm) | d 100 (nm) | L c 002 (nm) | L a 100 (nm) |
|---|---|---|---|---|---|---|
| AC1 | 22.9 | 43.5 | 0.388 | 0.208 | 1.07 | 3.52 |
| AC2 | 23.9 | 44.3 | 0.371 | 0.204 | 0.99 | 3.73 |
| AC3 | 23.4 | 43.9 | 0.380 | 0.205 | 1.06 | 4.05 |
| AC4 | 23.0 | 44.0 | 0.385 | 0.206 | 1.02 | 3.96 |
| AC5 | 22.8 | 43.3 | 0.390 | 0.209 | 1.36 | 4.56 |
A similar trend is observed for the (100) peak that shifts toward larger angles, from 43.3° (43.5) for AC5 (AC1) to 44.3° (43.9°, 44.0°) for AC2 (AC3, AC4) resulting in that the graphitic structure is slightly changing on the thickness and also on the crystal diameter. The d(002) values were found to be in the 0.370–0.388 nm range for activated carbons prepared at 900 °C for 20 min using water as activation agent (AC1 and AC2) and in the 0.380–0.390 nm range for the activated carbon prepared at 900 °C for 2 h using steam as activating agent (AC3–AC5). These interlayer spacings are larger than the value of 0.335 nm expected for ideal graphite (JCPDS 00-056-0159). Such larger spacing can be related to a more disordered nature of the carbon materials herein studied which may facilitate electrolyte ion penetration and therefore increase the storage properties of the supercapacitors-based on AC1–AC5. As a consequence, samples AC1, AC4, and AC5 with large d(002) values of 0.388, 0.385, and 0.390 nm, respectively, are expected to be efficient electrode materials for storage applications. Values of graphite crystallite diameter, La and stacking thickness Lc were obtained from the (100) and (002) peaks, respectively. From the calculation the La values are higher than Lc suggesting that preferable growth of graphitic structure is on the planes.
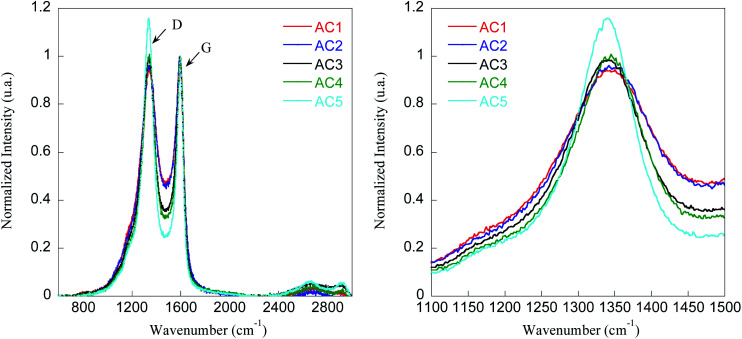
To prove the graphitic structure and disordered nature of the carbon materials, Raman spectroscopy was used. Fig. 2 compares the Raman spectra of AC1–AC5 materials and the corresponding fitting parameters (deconvolution of the spectra depicted in Fig. S1†) are presented in Table 3.
Fig. 2. Normalized Raman spectra of activated carbon materials (AC1–AC5) showing the D and G bands (left) and expansion of the D band region (right).
Raman spectroscopy data. Peaks position ( D, G), graphite peak (G), defect disorder peak (D), the degree of graphitization using the ratio of the integrated area intensity of graphite, and the intensity area of defect disorder peak (ID/IG). Sheet resistance (R) and conductivity (σ) of the activated films on the glass substrates.
| Samples | D (cm−1) | Area ID | G (cm−1) | Area IG | I D/IG | R (kΩ sq−1) | σ a (S m−1) |
|---|---|---|---|---|---|---|---|
| AC1 | 1347 | 147 | 1586 | 86 | 1.7 | 2.9 ± 0.3 | 13.9 ± 1.5 |
| AC2 | 1346 | 88 | 1588 | 56 | 1.6 | 49.2 ± 13 | 0.86 ± 0.3 |
| AC3 | 1341 | 92 | 1587 | 47 | 1.9 | 52.4 ± 7.9 | 0.75 ± 0.1 |
| AC4 | 1344 | 114 | 1592 | 31 | 3.6 | 43.3 ± 11 | 0.94 ± 0.2 |
| AC5 | 1339 | 120 | 1593 | 31 | 3.8 | 241.9 ± 76 | 0.12 ± 0.04 |
Conductivity measured via the 4-point probe method on the film containing the PVP binder.
The Raman peak detected between 1339 and 1348 cm−1 can be assigned to D band characteristic of the disorder while the peak observed between 1586 and 1593 cm−1 can be attributed to the graphitic G band according to literature data.28 The D peak is usually associated with stretching modes of more disordered carbon atoms in planar terminations of the graphite structure, and the G band corresponds to the stretching mode of the sp2 hybridized carbon atoms in the rings and chain.
Furthermore, the integrated surface area ratio of the peaks D and G (ID/IG) provides an estimation of the structural disorder degree of the carbonaceous materials, an increase in the ID/IG ratio indicating that the disorder augments (Table 3).
The study reveal that the graphitization degree is pronounced for samples AC1–AC3 than for samples AC4 and AC5. Thus, samples AC4 and AC5 appeared to be more disordered due to the much higher ratio ID/IG, i.e. 3.6 and 3.8 respectively. Moreover, these findings suggest that sample AC5 is amorphous which is consistent with XRD data. To get further insight into the electrical properties of these materials, their conductivity was determined from films processed on glass substrates. High sheet resistance, i.e. 241.9 kΩ sq−1, and low conductivity, i.e. 0.12 S m−1, were obtained for sample AC5 whereas a two order of magnitude higher conductivity, i.e. 13.9 S m−1, was found for sample AC1 (Table 3). These values are fully consistent with the crystalline degree of these samples, the more amorphous sample AC5 being much less conductive than the more graphitic samples.
3.1.2. Morphological characterization
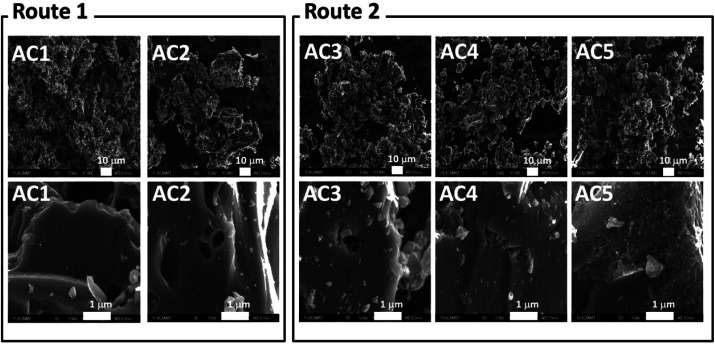
Fig. 3 shows SEM images of activated carbon powders prepared by different activation processes (AC1–AC5). At low magnification, it can be noticed that the samples are composed of agglomerated carbon particles. Both shape and size are inhomogeneous whatever sample is considered. At higher magnification, no pores lower than 100 nm were observed in sample AC1 whereas samples AC2–AC5 show pore size below 100 nm. In particular, activated carbon AC5 exhibits the largest number of small pores. As a consequence, AC5 is expected to yield better charges accumulation when used as electrodes for supercapacitors due to its higher porous nature than the other samples.
Fig. 3. SEM images of the activated carbon (Route 1: AC1, AC2 and Route 2: AC3, AC4, AC5) prepared using different activation processes, top images are at low magnification and bottom images are at high magnification for each sample as assigned in the image.
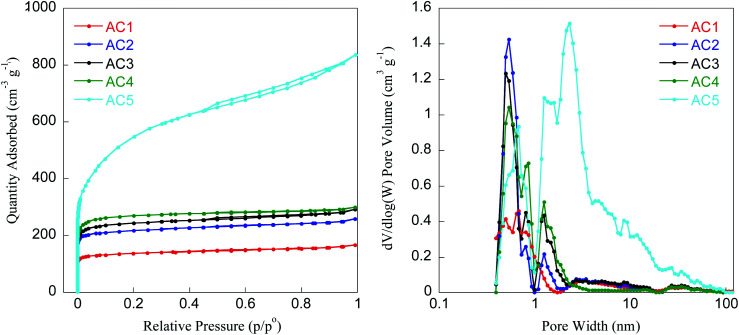
In addition to their morphological and crystalline properties, the specific surface area and total pore volume of activated carbon are also key parameters ruling their adsorption capacity for energy storage applications. N2 adsorption–desorption isotherms for the samples AC1–AC5 are shown in Fig. 4 and the textural properties are summarized in Table 4.
Fig. 4. N2 adsorption/desorption isotherms (left) and pore size distribution (right) of activated carbon samples (AC1–AC5).
Textural properties extracted from the N2 sorption measurements for activated carbon materials (AC1–AC5).
| Samples | S BET a (m2 g−1) | Total pore volumeb (cm3 g−1) | Area in pores (m2 g−1) |
|---|---|---|---|
| AC1 | 539 ± 16 | 0.22 ± 0.03 | 0 |
| AC2 | 858 ± 25 | 0.33 ± 0.04 | 3.8 ± 0.1 |
| AC3 | 952 ± 28 | 0.37 ± 0.05 | 6.1 ± 0.2 |
| AC4 | 1054 ± 31 | 0.38 ± 0.05 | 4.1 ± 0.1 |
| AC5 | 1998 ± 58 | 1.09 ± 0.09 | 14.1 ± 0.4 |
BET surface area calculated.
Total pore volume; area in pores determined by DFT.
According to the standard IUPAC classification,29 samples AC1–AC4 showed composite type I + II isotherms typical of carbonaceous microporous solids. By contrast, sample AC5 exhibited a type II isotherm with a type H3 hysteresis loop which can be attributed to microporous and mesoporous materials, the mesoporosity arising from aggregates of plate-like particles leading to slit-shaped pores.
The BET surface area of the carbon materials varied between 539 to 1998 m2 g−1 depending on the process adopted for activation. Interestingly, samples AC3, AC4, and AC5 activated by steam exhibit higher specific surface area (952, 1054, and 1998 m2 g−1 respectively) than the two other samples AC1 and AC2 (539 and 858 m2 g−1, respectively), indicating the effectiveness of the steam activation. Due to its higher surface area, total pore volume and area in pores, sample AC5 seems to be more promising for applications in supercapacitors. A similar activation process was reported by Li et al.,16 where coconut shell was used as biomass precursor to prepare porous carbon. With particle size of about 3 mm and pyrolysis at 800 °C for 1 h by passing steam continuously, Li et al. prepared carbon materials exhibiting BET surface areas of about 1500 m2 g−1. In the present work, a BET surface area of 1998 m2 g−1 was determined for the sample with fine particle size (below 0.1 mm) already activated, and then activated again at 900 °C for 1 h under continuous passing steam. Moreover, in our case the steam continuously passed during the cooling from 900 to 200 °C in order to protect active sites on the activated carbon which was already created at high temperature. This strategy allowed improving the essential properties compared to case reported previously.16
In order to get insight into the purity of activated carbon materials AC1–AC5, thermogravimetry coupled to mass spectrometry studies (TGA-MS) were performed and the corresponding thermograms are presented in Fig. S2.† According to the TG traces, the thermal decomposition of all samples is quite similar in shape for all samples, indicating that similar processes occurred during the activation. The curves are composed of three main stages with low mass losses. According to mass spectrometry data, the first stage with the weaker mass loss below 100 °C can be attributed to the loss of water molecules adsorbed on the surface of the activated carbon. The next step with about 2% mass loss between 100 and 300 °C can be related to the elimination of structural water and carbon dioxide (CO2). Finally, a significant loss of the CO2 after 650 °C and carbon monoxide (CO) after 700 °C is observed. The highest mass losses below 300 °C were observed for samples AC3, AC4 and AC5 that indicates better absorptive properties, due to their porosity favouring water sorption, compared with less porous samples AC1 and AC2. The TG analysis also confirmed that all activated carbon materials (AC1–AC5) are pure.
4. Electrochemical characterization of the supercapacitors
4.1. Influence of different activated carbons in aqueous supercapacitors
To evaluate the storage capabilities of electrodes-based on different samples (AC1–AC5), the electrochemical performances were determined by using two electrodes system in a simple FTO-based current collection configuration using aqueous 6 M KOH electrolyte (Fig. S3a†). The storage parameters extracted from the CV and CD curves are listed in Table S2.† It can be noted from Fig. S3b† that the sample exhibit a quasi-rectangular shape demonstrating ideal capacitive behavior.30,31 The specific capacitances calculated from the CV curves for AC1, AC2, AC3, AC4, and AC5 were 52.4, 76.9, 75.2, 75.6, and 106 F g−1, respectively, at 5 mV s−1 scan rate. These values are close to the specific capacitance obtained from charge–discharge curves (42.4, 73.0, 69.0, 71.2, and 106 F g−1 respectively), reported in Fig. S3c.†
As we have suggested earlier the superior capacitance was obtained for the sample AC5, which is two times higher than the value of the AC1. The superiority of AC5 can be attributed to the increase of the surface area and development of porosity during the steam activation process. It is clear that the enhancement of the capacitance of the carbon electrodes is directly related to the surface area and the pore size of the carbonaceous materials (Fig. S3d†).
Fig. S4† shows the CV and CD curves for AC5 electrodes at different scan rates and different current densities, respectively. At different scan rates, all CV curves exhibited a quasi-rectangular shape even for the scan rate of 100 mV s−1 indicating the device has excellent double-layer capacitance behavior (Fig. S4a†). The maximum capacitance of 109.5 F g−1 was obtained at a low scan rate of 2 mV s−1 in CV technique and capacitance of 96.7 F g−1 at constant current 0.2 A g−1 in CD technique (Fig. S4b–d and Table S3†), values (scan rate and constant current) which are limited in a practical situation. In this study, we used a scan rate of 5 mV s−1 for cyclic voltammetry and 0.5 A g−1 in the charging–discharging measurements as practical conditions for the evaluation of aqueous-based supercapacitors.
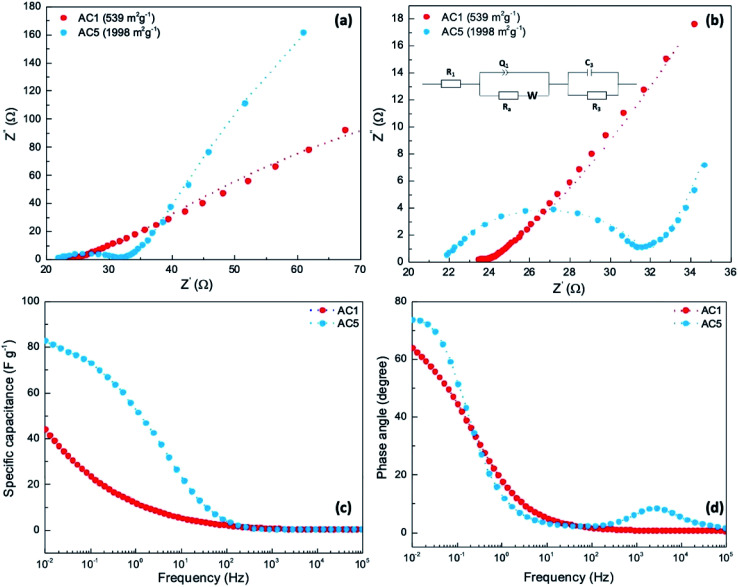
To get a better understanding of both electronic and ionic transport processes involved in these systems, electrochemical impedance measurements were performed for the supercapacitors-based on the electrodes prepared with the activated carbon AC1 and AC5 with different porosities. Fig. 5a and b show the Nyquist plots ranging from 10 kHz to 0.05 Hz at open-circuit voltage and the equivalent circuit used for the fitting and calculation of the impedance parameters (Table S4†).
Fig. 5. (a) and (b) Nyquist plots obtained from the impedance measurements for the sample AC1 and AC5. (c) and (d) Capacitance and phase as a function of frequency, respectively. In the equivalent circuit, the series resistance R1 represent the total resistance of the substrates, electrodes materials, and electrolyte; Q1, Ra and W are the interfacial contact double-layer capacitance, charge transfer resistance at electrode/electrolyte interface and Warburg diffusion element, describing the diffusion processes of the ions through the porous structure of the electrodes; C3 and R3 correspond to the capacitive behaviour and leakage resistance.
The sample with AC1 shows smaller semicircle in the high-frequency region and a line which is not perfectly vertical to the X-axis indicates the low internal resistance and the difficulty of ion diffusion at the electrode–electrolyte interface due to the low porosity of AC1 material. The low resistance for AC1 compared to AC5 indicates facile electron and ion-diffusion in the AC1 electrodes which is consistent with the higher conductivity of AC1 films compared to AC5 layers. As observed in Fig. 5a and b, the device with AC5 electrodes shows a higher internal resistance at high-frequency range and a higher slop of the straight line in a low-frequency range compared to the device with AC1 electrodes. This means that AC5 exhibits a higher internal resistance due to the high porosity although higher capacitive behavior was obtained.
The capacitance plotted as a function of frequency shows that the values remain on the same order as capacitance calculated from CV (Fig. 5c). It may be noted that the calculated values extracted from impedance measurement for AC1 (44 F g−1) and AC5 (84 F g−1) at 0.01 Hz are in agreement with the range values obtained from CV measurements. Higher specific capacitance calculated for the device with AC5 electrodes is due to the higher porosity facilitating the charge accumulation at the electrode/electrolyte interface. The observed phase angles (Fig. 5d) were found to be 63° and 72° for the devices-based on carbons AC1 and AC5, respectively. As a consequence, the device including carbon AC5 shows a phase angle closer to that of an ideal capacitor, i.e. 90°, than the AC1-based supercapacitor.
4.2. Influence of the current collector substrate in aqueous supercapacitors
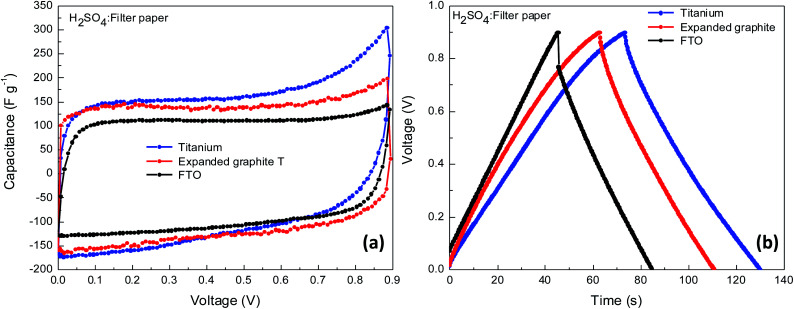
Apart from the morphological properties of the active materials in the supercapacitors, the conductive substrates have also an important role in effective charge transport. Good current collectors should have high electrical conductivity and low contact resistance with carbon electrodes with strong contact spots at the interface affecting the equivalent series resistance (ESR). Higher ESR results in reducing the power density of the supercapacitors, low ESR can be obtained by reducing the internal resistance of the electrode, and the contact resistance between the active electrode and substrate current collector.32 Considering these issues and for further improvement of devices capacitance, Ti plates and expanded graphite sheets were used as current collectors in combination with the most promising active material based on the performance shown in Fig. S3.† To assemble supercapacitors, sample AC5 was selected, electrodes were prepared using PVDF as binder and carbon black as conducting material, ratio AC : PVDF : C-black as shown in Table S1.† As KOH electrolyte is unsuitable for the Ti plates the following experiments were performed using 1.5 M H2SO4 as electrolyte and filter paper as separator. The performance of the supercapacitors (CV and CD curves) with different current collectors, Ti plates, and expanded graphite in comparison with FTO substrates is presented in Fig. 6 and Table S5.†
Fig. 6. Electrochemical characterization of supercapacitors-based on AC5 electrodes deposited on different substrates collectors, (a) CV curves at 5 mV s−1 and (b) CD curves at 0.5 A g−1.
The devices with Ti plates and expanded graphite current collectors show lower ESR of 7.0 and 0.7 Ω, respectively, than for the reference FTO-based supercapacitor ESR of 22.9 Ω. The ESR decreases with Ti plates and expanded graphite current collectors due to the improvement in interface properties as both substrates have higher electric conductivity, and lower resistance than FTO substrates. Consequently, the lower ESR leads to an improvement of the capacitance from 105.9 F g−1 for FTO substrates to 132.3 and 144.9 F g−1 for expanded graphite and Ti plates, respectively. A similar trend was observed for capacitance values measured by galvanostatic charging–discharging. Capacitance value of 94.5 F g−1 for FTO substrates and 118.0 and 123.0 F g−1 for expanded graphite and Ti plates, respectively were determined. Due to the better performances obtained with the expanded graphite plates, such as the perfect rectangular shape of the CV curves, low ESR, and higher capacitance, the graphite substrates were used for further improvement of the performance of supercapacitor with AC5 electrodes.
4.3. Storage properties of supercapacitors in non-volatile ionic liquid
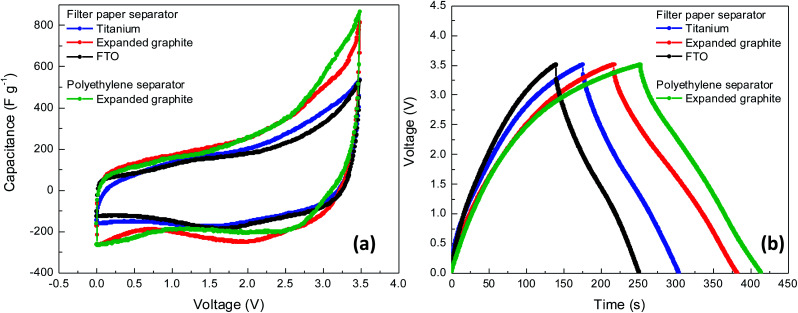
The general consensus is that the maximum working voltage in supercapacitors depends on the electrolyte potential window.33 In order to extend the performance of AC5-based supercapacitors on the expanded graphite current collectors, the ionic liquid electrolyte-based on MPPyFSI (1-methyl-1-propy-pyrrolizinium bis(fluorosulfonyl)mide) with a wide electrochemical potential window was used. Operating voltage up to 5 V provides significant benefits for the energy storage performance of the device-based on this electrolyte.34 The electrochemical performance of supercapacitors with substrate:AC5–MPPyFSI–filter paper–MPPyFSI–AC5:substrate configuration was tested in the 0–3.5 V voltage window (Fig. 7 and Table S6†). Complete device based on AC5 electrodes on Ti plates, ionic liquid MPPyFSI, and filter paper shows an outstanding stability after 5000 charging–discharging cycles at 1 V charging voltage and discharge current of 1 A g−1. The retention percentage for capacitance was found to be 92.3% (Fig. S5†). The AC5 electrodes of the present device remain unchanged during the stability tests because of the only physical movement of the ions without damaging or consuming the carbon electrodes.
Fig. 7. Electrochemical characterization of non-volatile supercapacitors with AC5 electrodes deposited on different current collectors, (a) CV curves at 5 mV s−1, (b) CD curves at 1 A g−1.
Firstly, as a fast evaluation, filter paper was used as a separator. According to the discharged curves, ESR value of the devices with expanded graphite is lower (22.7 Ω) compared with the values of FTO (58.3 Ω) and Ti plates (32.7 Ω) as current collectors. A similar trend to the one observed for aqueous type devices was observed as shown in Table S5.† This low ESR values of expanded graphite-based devices indicate good conductivity of the substrate resulting in a superior capacitance attributed to the better electrical contact between activated carbon and substrate. The low ESR value of 0.7 Ω observed on the device with 1.5 M H2SO4 is attributed to the high conductivity and mobility of the H+ ions compared with ESR of 22.7 Ω for the devices with solvent free MPPyFSI. Thus, the low conductivity and mobility of the MPPy+ ions which is attributed to the viscosity limit the charge transportation rate between electrodes and the accessibility of the electrolyte to the small pores in the surface of the electrode. However, the impact of high ESR of ionic liquid devices for the performance can be regulated by an increase in the cell operating voltage. Due to the wider operating potential range of MPPyFSI the capacitance was found to be 224.5 F g−1 at 5 mV s−1 and 233.5 F g−1 at 1 A g−1 using expanded graphite substrates as current collector which is almost twice those measured with aqueous electrolytes (Table S6†).
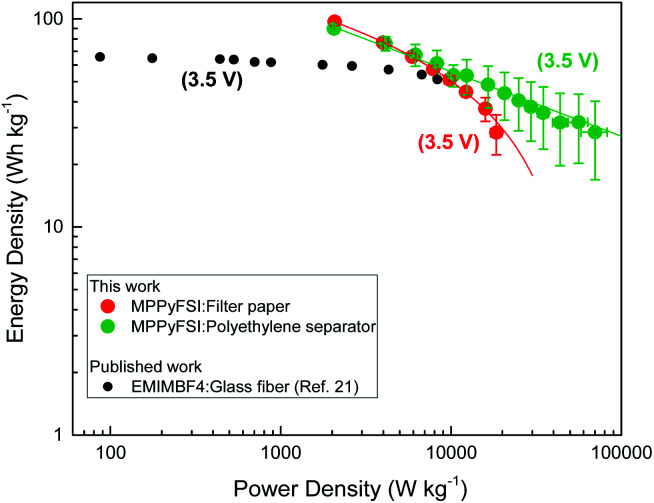
For further improvement of the device efficiency, the filter paper separator was replaced by commercial polyethylene SETELA (TORAY, thickness of 7 μm) separator. This polymer separator is very promising due to chemical and mechanical resistance in organic electrolytes, lower thickness than filter paper and potential use in combination with ionic liquid at different temperatures without any damage. As the surface of the separator is hydrophobic, ozone (O3) treatment was performed for each side before assembling the devices. As a result, ESR of the device with polyethylene separator was dramatically decreased to 4.3 Ω which can be related to its low thickness, good interface and better wettability with the ionic liquid. For application purposes, the design of supercapacitors with low ESR value is important to minimize the internal energy loss and provide high energy, power density and extend the device life time. However, as shown in the Ragone plot (Fig. 8), filter paper separator led to energy of 99.3 W h kg−1 at 1 A g−1 which is slightly higher than that obtained with polyethylene separator, i.e. 92.1 W h kg−1 at the same current density. But compared to the filter paper separator, the device with polyethylene separator showed excellent power and energy handling capability at current densities at 30 A g−1 (Fig. 8). With the increment of current density, the device with polyethylene separator showed a linear drop of its energy density and retained about 50% from its initial value at 10 A g−1 while the device with filter paper showed an exponential drop of its energy density and retained only 30% at the same current density. At 10 A g−1 the supercapacitor with filter paper can store an energy of 28.4 W h kg−1 and a power density of 18 466 W kg−1. On the other hand, at 3 times higher current densities of 30 A g−1, the device with polyethylene separator can keep the same average energy density of 28.6 W h kg−1 and ultra-high average power density of 70 259 W kg−1. This energy retention of the device with polyethylene separator at high current densities may be due to low ion transfer resistance through the polymer compared to the filter paper separator. Therefore, the device can respond to high current densities by fast ion movements through the separator because of its low thickness, wettability and interface stability with ionic liquid electrolyte.
Fig. 8. Ragone plot. Comparison of power density and specific energy of the supercapacitor with AC5 electrodes, MPPyFSI electrolytes, filter paper and polyethylene separators, and a supercapacitor published earlier. The average values plotted were calculated from charging–discharging curves at different current densities of five devices for each condition.
The energy density reported by Yin et al.21 at 10 A g−1 for the supercapacitor-based on activated carbon electrodes using coconut fibers as precursors in combination with non-volatile ionic liquid EMImBF4 electrolyte, i.e. 53 W h kg−1, falls within the same range of our values obtained with activated carbon electrodes extracted from coconut shells in combination with non-volatile MPPyFSI electrolyte, i.e. 43.9 ± 11.36 W h kg−1 (Fig. 8). Moreover, at high current density of 30 A g−1, the best device herein described shows power density of 70 259 W kg−1 while keeping specific energy of 28.6 W h kg−1 (average values) which is higher compared to the previously reported carbon extracted from coconut-based supercapacitors using non-volatile ionic liquid electrolytes.21
On the other hand, Galinski et al.24 reported energy density of 68.6 W h kg−1 at current density of 0.2 A g−1 with ionic liquid EMImBF4. In this study, almost same energy density of 67.3 W h kg−1 was reached with non-volatile MPPyFSI at 3 A g−1 indicating better performance even at higher current densities. Furthermore, in comparison with volatile electrolytes (Et4NBF4-PC) reported by Sun et al.23 the performance measured for AC5-based supercapacitors are better, due to the non-volatile nature of the electrolyte and capability of energy storage at room temperature.
Finally, the excellent energy and power handling capability of the activated coconut charcoal supercapacitors described in this section can be attributed to the appropriate morphology and texture of the active material combined with ionic liquid having wide operating voltage, stable polymer separator and conductive current collectors. The results suggest that surface area of activated carbon AC5 plays a key role as an electrode material and makes it possible to produce high-performance non-volatile ecofriendly-supercapacitor.
5. Conclusions
Graphitic activated carbon with a high degree of crystallinity, suitable morphology, and high surface area was prepared following a scalable synthetic route involving a facile activation process. Abundant and easily accessible biomass material was obtained from coconut shells as the carbon source. The produced activated carbons show specific surface area ranging from 586 m2 g−1 to 1998 m2 g−1, and the storage properties of supercapacitors using these carbons as electrode materials were directly correlated with both morphological and textural properties of the carbon materials. Thus, specific capacitances were enhanced with increasing the specific area of the active material. Among all five examined samples, AC5 material prepared by steam activation delivers the best electrochemical properties. In a two electrodes system, a capacity of 132.3 F g−1 at the scan rate of 5 mV s−1 was achieved using AC5 electrodes with expanded graphite current collectors in aqueous electrolyte (1.5 M H2SO4). More importantly, supercapacitor-based on AC5 deposited on expanded graphite substrates in combination with ionic liquid MPPyFSI and polyethylene separator displays excellent specific storage properties even at high current densities at room temperature. Capacitance of 219.4 F g−1 with a specific energy of 92.1 W h kg−1 and power density of 2046 W kg−1 at 1 A g−1 was obtained with retention of high values at a current density of 30 A g−1. This work constitutes the first report on the simple ecofriendly activation process of carbon issue from coconut shell-based waste which has a potential for mass production. Further, these carbon electrodes provide high performance supercapacitors employing solvent free ionic liquid electrolyte, low cost expanded graphite and stable polymer type separator. These findings pave the way towards production of efficient supercapacitors from biomass renewable resources.
Author contributions
N. M. K., M. D., P. D., B. K. prepared activated carbon under supervision of K. T., and G. R. A. K., N. M. K. assembled and characterized the supercapacitors-based on activated carbon under supervision of T. T., L. C., C. O., M. A. D., D. T., L. S., S. U. contributed to the characterization of the materials. All authors discussed the results and wrote the manuscript.
Conflicts of interest
The authors declare no competing financial interest.
Supplementary Material
Acknowledgments
This work benefited from the French government assistance managed funding by the National Research Agency under the “Programme d'Investissements d'Avenir” with the reference “ANR-19-MPGA-0006”. The authors would like to Philippe Legros (PLACAMAT) for SEM measurements, Lionel Hirsch (IMS, UMR 5218) for his support for impedance measurements, and Silvia Mariotti (LCPO, UMR 5629) for her support on the conductivity measurements and Laurent Thomas (ISM, UMR 5255 CNRS) for his technical assistance.
Electronic supplementary information (ESI) available: Table S1: configuration of the supercapacitors used in this study; Fig. S1: curve fit of Raman spectra of activated carbon; Fig. S2: thermograms for the activated carbons AC1–AC5; Fig. S3: digital picture of the supercapacitor (liquid type), CV, and CD of different activated carbon electrodes, specific capacitance versus BET surface area; Table S2: calculated capacitance values for each activated carbon-based supercapacitor with the FTO:AC–KOH–filter paper–KOH–AC/FTO configuration; Fig. S4: electrochemical characterization of the supercapacitor-based on the AC5 electrodes with FTO:AC5–KOH–filter paper–KOH–AC5/FTO configuration, CV at different scan rates, specific capacitance calculated from CV, CD curves at different current densities, specific capacitance calculated from CD at different current densities; Table S3: calculated capacitance values, from CV at different scan speed and CD at different specific current, for each activated carbon-based supercapacitor with FTO:AC5–KOH–filter paper–KOH–AC5/FTO configuration; Table S4: simulated parameters extracted from impedance measurements; Table S5: calculated capacitance values for AC5-based supercapacitor in configuration with H2SO4:filter paper; Table S6: calculated capacitance values for AC5-based supercapacitor in configuration with MPPyFSI:filter paper and MPPyFSI:polyethylene; Fig. S5: stability tests of sealed supercapacitor. See DOI: 10.1039/d0ra09182k
References
- Kim S. Dale B. E. Biomass Bioenergy. 2015;29:426–439. doi: 10.1016/j.biombioe.2005.06.004. [DOI] [Google Scholar]
- Deng J. Li M. Wang Y. Green Chem. 2016;18:4824–4854. doi: 10.1039/C6GC01172A. [DOI] [Google Scholar]
- Perea-Moreno M.-A. Sameoron-Manzano E. Perea-Moreno A.-J. Sustainability. 2019;11:2–19. doi: 10.3390/su11030863. [DOI] [Google Scholar]
- Kumarasinghe K. D. M. S. P. K. Kumara G. R. A. Rajapakse R. M. G. Liyanage D. N. Tennakone K. Org. Electron. 2019;71:93–97. doi: 10.1016/j.orgel.2019.05.009. [DOI] [Google Scholar]
- Pitchaiaya S. Eswaramoorthy N. Natarajan M. Santhanam A. Asokan V. Ramakrishnan V. M. Rangasamy B. Sundaram S. Ravirajan P. Velauthpillai D. Sci. Rep. 2020;10:6835. doi: 10.1038/s41598-020-62900-4. [DOI] [PMC free article] [PubMed] [Google Scholar]
- Enok T. K. King’ondu C. K. Pogrebnoi A. Chande Jande Y. A. Int. J. Electrochem. 2016:6453420. [Google Scholar]
- Lyu L. Seong K.-D. Ko D. Choi J. Lee C. Hwang T. Cho Y. Jin X. Zhang W. Pang H. Pio Y. Mater. Chem. Front. 2019;3:2543–2570. doi: 10.1039/C9QM00348G. [DOI] [Google Scholar]
- Lin Z. Goikolea E. Balducci A. Naoi K. Taberna P. L. Salanne M. Yushin G. Simon P. Mater. Today. 2018;21:419–436. doi: 10.1016/j.mattod.2018.01.035. [DOI] [Google Scholar]
- Chen X. Y. Chen C. Zhang Z. J. Xie D. H. J. Mater. Chem. 2013;1:7379–7383. doi: 10.1039/C3TA10841D. [DOI] [Google Scholar]
- Largeot C. Portet C. Chmiola J. Taberna P. Gogotsi Y. Simon P. J. Am. Chem. Soc. 2008;130:2730–2731. doi: 10.1021/ja7106178. [DOI] [PubMed] [Google Scholar]
- Ghosh S. Santhosh R. Jeniffer S. Raghvan V. Jacob G. Nanaji K. Kollu P. Jeong S. K. Grace A. N. Sci. Rep. 2019;9:16315. doi: 10.1038/s41598-019-52006-x. doi: 10.1038/s41598-019-52006-x. [DOI] [PMC free article] [PubMed] [Google Scholar]
- Bouchelta C. Medjram M. S. Bertrand O. Bellat J. P. J. Anal. Appl. Pyrolysis. 2008;82:70–77. doi: 10.1016/j.jaap.2007.12.009. [DOI] [Google Scholar]
- Le Van K. Thi T. T. L. Prog. Nat. Sci.: Mater. Int. 2014;24:191–198. doi: 10.1016/j.pnsc.2014.05.012. [DOI] [Google Scholar]
- Sun Y. Li G. Gao B. Yue Q. Li X. Bioresour. Technol. 2016;217:239–244. doi: 10.1016/j.biortech.2016.03.047. [DOI] [PubMed] [Google Scholar]
- Su W. Zhou Y. P. Carbon. 2003;41:861–863. doi: 10.1016/S0008-6223(03)00003-4. [DOI] [Google Scholar]
- Mi J. Wang X.-R. Fan R.-J. Qu W.-H. Li W.-C. Energy Fuels. 2012;26:5321–5329. doi: 10.1021/ef3009234. [DOI] [Google Scholar]
- Sun K. Leng C.-Y. Jiang J.-C. Bu Q. Lin G.-F. Lu X.-C. Zhu G.-Z. New Carbon Mater. 2017;32:451–459. doi: 10.1016/S1872-5805(17)60134-3. [DOI] [Google Scholar]
- Kishore B. Shanmughsundarm D. Penki T. R. Munichandraiah N. J. Appl. Electrochem. 2014;44:903–916. doi: 10.1007/s10800-014-0708-9. doi: 10.1007/s10800-014-0708-9. [DOI] [Google Scholar]
- Barzegar F. Khaleed A. A. Ugbo F. U. Oyeniran K. O. Momodu Y. D. Bello A. Dangbegnon J. K. Manyala N. AIP Adv. 2016;6:115306. doi: 10.1063/1.4967348. doi: 10.1063/1.4967348. [DOI] [Google Scholar]
- Taer E. Taslim R. Putri A. W. Apriwandi A. Agustino A. Int. J. Electrochem. Sci. 2018;13:12072–12084. doi: 10.20964/2018.12.19. [DOI] [Google Scholar]
- Yin L. Chen Y. Li D. Zhao X. Hou B. Cao B. Mater. Des. 2016;111:44–50. doi: 10.1016/j.matdes.2016.08.070. [DOI] [Google Scholar]
- Zhang M. Li Y. Si H. Wang B. Song T. Int. J. Electrochem. Sci. 2017;12:7844–7852. doi: 10.20964/2017.08.37. [DOI] [Google Scholar]
- Sun L. Tian C. Li M. Meng X. Wang L. Wang R. Yin J. Fu H. J. Mater. Chem. A. 2013;1:6462–6470. doi: 10.1039/C3TA10897J. [DOI] [Google Scholar]
- Galinski M. Babel K. Jurewicz K. J. Power Sources. 2013;22:83–88. doi: 10.1016/j.jpowsour.2012.11.048. [DOI] [Google Scholar]
- Meng J. Li S. Niu J. ACS Omega. 2019;4:20762–20772. doi: 10.1021/acsomega.9b03165. [DOI] [PMC free article] [PubMed] [Google Scholar]
- Vazquez-Santos M. B. Geissler E. Laszlo K. Rouzaud J.-N. Martinez-Alonso A. Tascon J. M. D. J. Phys. Chem. C. 2012;116:257–268. doi: 10.1021/jp2084499. [DOI] [Google Scholar]
- Sylla N. F. Ndiane N. M. Ngom B. D. Momodu D. Madito M. J. Mutuma B. K. Manyala N. Sci. Rep. 2019;9:13673. doi: 10.1038/s41598-019-50189-x. doi: 10.1038/s41598-019-50189-x. [DOI] [PMC free article] [PubMed] [Google Scholar]
- Sadezky A. Muckenhuber H. Grothe H. Niessner R. Poschl U. Carbon. 2005;43:1731–1742. doi: 10.1016/j.carbon.2005.02.018. [DOI] [Google Scholar]
- Brunauer S. Deming L. S. Demig E. W. Teller E. J. Am. Chem. Soc. 1940;62:1723–1732. doi: 10.1021/ja01864a025. [DOI] [Google Scholar]
- Khomenko V. Frackowiak E. Béguin F. Electrochim. Acta. 2005;50:2499–2506. doi: 10.1016/j.electacta.2004.10.078. [DOI] [Google Scholar]
- Zhou Y. Jin P. Zhou Y. Zhu Y. Sci. Rep. 2018;8:9005. doi: 10.1038/s41598-018-27460-8. [DOI] [PMC free article] [PubMed] [Google Scholar]
- Xiong G., Kundu A. and Fisher T. S., Influence of Temperature on Supercapacitor Performance, 330124_1_En, ISBN: 978-3-319-20241-9, 2015, 10.1007/978-3-319-20242-6_4 [DOI] [Google Scholar]
- Balducci A. Dugas R. Taberna P. L. Simon P. Plee D. Mastragostino M. Passerini S. J. Power Sources. 2007;165:922–927. doi: 10.1016/j.jpowsour.2006.12.048. [DOI] [Google Scholar]
- Zhou Q. Henderson W. A. Appetecchi B. G. Montanino M. Passerini S. J. Phys. Chem. B. 2008;112:13577–13580. doi: 10.1021/jp805419f. [DOI] [PubMed] [Google Scholar]
Associated Data
This section collects any data citations, data availability statements, or supplementary materials included in this article.


