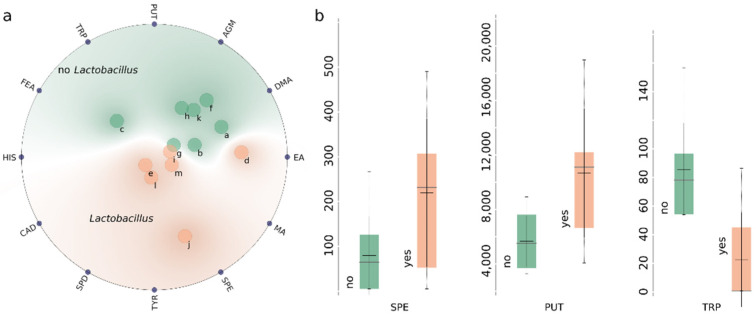
Figure 3.
Untargeted (RadViz) analysis of commercial beer samples (a) and box plots for 3 most relevant BAs in terms of classification based on presence of lactic acid bacteria (b). Grey horizontal bars in box plots denote median values, and black horizontal bars denote average values. Labels in subplot (a): a-APA1, b-LGR1, c-WZN, d-PIN, e-LMBC, f-LGR2, g-LGR3, h-LGR4, i-BWS1, j-BWS2, k-APA2, l-GEU, m-SIPA.

