Abstract
Objectives
Electronic health records (EHR) are commonly used for the identification of novel risk factors for disease, often referred to as an association study. A major challenge to EHR-based association studies is phenotyping error in EHR-derived outcomes. A manual chart review of phenotypes is necessary for unbiased evaluation of risk factor associations. However, this process is time-consuming and expensive. The objective of this paper is to develop an outcome-dependent sampling approach for designing manual chart review, where EHR-derived phenotypes can be used to guide the selection of charts to be reviewed in order to maximize statistical efficiency in the subsequent estimation of risk factor associations.
Materials and Methods
After applying outcome-dependent sampling, an augmented estimator can be constructed by optimally combining the chart-reviewed phenotypes from the selected patients with the error-prone EHR-derived phenotype. We conducted simulation studies to evaluate the proposed method and applied our method to data on colon cancer recurrence in a cohort of patients treated for a primary colon cancer in the Kaiser Permanente Washington (KPW) healthcare system.
Results
Simulations verify the coverage probability of the proposed method and show that, when disease prevalence is less than 30%, the proposed method has smaller variance than an existing method where the validation set for chart review is uniformly sampled. In addition, from design perspective, the proposed method is able to achieve the same statistical power with 50% fewer charts to be validated than the uniform sampling method, thus, leading to a substantial efficiency gain in chart review. These findings were also confirmed by the application of the competing methods to the KPW colon cancer data.
Discussion
Our simulation studies and analysis of data from KPW demonstrate that, compared to an existing uniform sampling method, the proposed outcome-dependent method can lead to a more efficient chart review sampling design and unbiased association estimates with higher statistical efficiency.
Conclusion
The proposed method not only optimally combines phenotypes from chart review with EHR-derived phenotypes but also suggests an efficient design for conducting chart review, with the goal of improving the efficiency of estimated risk factor associations using EHR data.
Keywords: outcome-dependent sampling, association study, augmented estimation, cost-effective chart review
INTRODUCTION
Electronic health records (EHR) contain extensive patient data, providing an efficient and wide-reaching resource for health research. In the last decade, EHR data have been widely used to investigate research questions in various healthcare and medical domains. One common use of EHR data is the identification of novel risk factors for disease, referred to as an association study, with wide applications such as drug repurposing pharmacovigilance, and pharmacoepidemiology.1–8 However, such EHR-based association studies face many challenges. One major challenge is measurement error in EHR-derived outcomes. For example, binary health outcomes (or phenotypes) are commonly derived from high-throughput phenotyping algorithms which often result in misclassification. Errors in EHR-derived phenotypes can lead to systematic bias, substantially inflate type I error, and diminish statistical power,9,10 which ultimately leads to low reproducibility of EHR-based research findings.11
A manual chart review of phenotypes is necessary for generating unbiased evidence on risk factor effects. Phenotypes obtained through manual chart review of patient records are often viewed as a gold standard for association studies. Such a process is, however, time-consuming and expensive. In many studies, only a limited subset of the patients can be chart reviewed for a specific phenotype due to limited resources and/or time. To combine information from an error-prone EHR-derived phenotype and a chart review of limited size, Tong et al12 proposed an augmented estimation procedure that optimally combines estimators based on these 2 sources. Their simulation studies and real data application demonstrated that the augmented estimation procedure reduces biases relative to the estimator using the EHR-derived phenotypes and gains statistical efficiency compared to the estimator using the validated phenotypes.
However, a limitation of the augmented estimation method in Tong et al12 is that the improvement in statistical efficiency is limited when the disease of interest is relatively rare. Low prevalence diseases (eg, Asherson’s syndrome, pediatric type 2 diabetes) and rare drug adverse events are commonly of interest in EHR-based association studies. For diseases with low prevalence, power loss in an association study can be substantial if the analysis is based on EHR-derived phenotypes; see our earlier investigation.9 Furthermore, for diseases with low prevalence, as we will demonstrate in the simulation studies, there is a sizable loss of statistical power (ie, corresponding to lack of efficiency in chart review) for the recent method in Tong et al.12 An intuitive explanation of the limitation of the method of Tong et al12 in the case of a rare disease is that the uniform sampling of patients for chart review often leads to a small number of validated cases, leading to unbalanced data. To address this limitation, we propose a simple but effective sampling scheme for case enrichment, as well as a corresponding estimation procedure.
From the design perspective, it is important to improve the statistical efficiency of the estimates of effects in association analysis. If 2 association studies from 2 different sampling schemes achieve the same statistical power, the sampling scheme that requires fewer patients to be chart reviewed is preferred. In the following, we investigate an efficient sampling scheme by maximizing the statistical efficiency of estimated association effects. The key idea is to use the EHR-derived phenotype to enrich the number of cases in the validation dataset. By adopting a biased sampling design, we develop a new augmented estimator by optimally combining the chart-reviewed phenotypes from the selected patients with the error-prone EHR-derived phenotype using projection theory. The proposed method has several advantages: first, by adopting this outcome-dependent sampling approach, we can achieve a more balanced validation dataset enriched with more cases, which informs estimation of the operating characteristics of the phenotyping algorithm. Second, the proposed augmented estimator leverages the estimated operating characteristics of the phenotyping algorithm in the variance reduction process, leading to the precise estimation of risk factor effects.
The remainder of the paper is organized as follows. In “Materials and Methods” section, we introduce the existing methods, including the augmented estimation method and biased sampling approaches, which motivate us to propose the augmented outcome-dependent sampling method. Then, we present the rationale for the proposed method by explaining the form and inferential properties. In “Simulation Studies” section, we conduct simulation studies to evaluate the performance of the proposed method by comparing it with existing methods. In “Data Analysis” section, we apply the proposed method to real-world data from the Kaiser Permanente Washington (KPW) healthcare system. In “Discussion” section, conclusions are drawn and future works are outlined.
MATERIALS AND METHODS
Data structure and notation
We consider an EHR dataset with N subjects and the following components: the true phenotype, Y; the EHR-derived phenotype, S; and covariates, X. Both Y and S are binary, and Y depends on X through coefficients , that is,
The first column of X is 1 standing for the intercept term. The EHR-derived phenotype S is available for all patients; while the true phenotype Y is unknown and requires manual chart review to obtain. The data structure of the original cohort is visualized in Figure 1.
Figure 1.
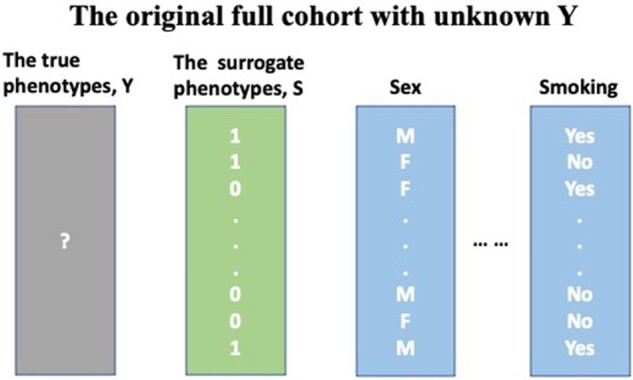
Example data structure. The full sample contains the surrogate phenotype and covariates (eg, sex, smoking status). However, the true phenotype is unknown and requires manual chart review to obtain.
In addition, we assume S and Y are nondifferentially associated, that is, and are fixed but unknown constants. This assumption is important as it guarantees our parameter estimation is consistent and the sampling bias only exists in the intercept term.
Existing methods and limitations
Because the true phenotypes are only available within a subset (V), alternative sampling designs can be pursued. Based on simple uniform sampling, Tong et al12 proposed an augmented uniform sampling procedure for this scenario. We begin with introducing the existing methods.
Method 1: Original uniform sampling method
One approach is to uniformly sample the validation subcohort from the full cohort without regard to outcomes or exposures and fit a logistic regression model to the validation cohort only, in whom information on Y will be available. Let be the validation set size and be the Fisher information matrix. The MLE estimator of this method approximately follows a normal distribution . Although this uniform sampling method is easy to apply and may work well with common diseases, it has 2 major drawbacks: first, in diseases with low prevalence, only a few patients with the phenotype of interest will be included in the validation sample; second, the association between Y and S is neglected and information from S is not utilized.
Method 2: Original biased sampling method
The key to this method is to construct a balanced subset V with the help of outcome-dependent sampling. That is, uniformly select samples from the S-positive patients and samples the S-negative patients to construct V. Within this validation set, logistic regression is fitted between Y and X. This brings the MLE estimator that is approximately normally distributed as , where c and are estimable constant elements. Because S is closely associated with Y, patients with a positive S are more likely to have a positive Y. Hence, for diseases with low prevalence, it is intuitive to sample conditional on S in order to enrich the validation sample with positive cases.
Method 3: Augmented uniform sampling method
To improve on the original uniform sampling method (Ori-Unif), Tong et al12 proposed an augmented logistic regression to take full advantage of the association between Y and S. Same as the Ori-Unif, a validation subset V is first selected uniformly from the full cohort. The augmented estimator then involves estimating 3 models:
A model for Y within the validation dataset and the MLE estimator ;
A model for S within the validation dataset and the MLE estimator ;
A model for S in the full dataset and the MLE estimator .
The final estimator is given by where is the estimated covariance matrix between and , and is the estimated covariance matrix of
As we will show in simulation studies, when the true phenotype has a moderately high prevalence, augmented uniform sampling method (Aug-Unif) leads to estimates with high statistical efficiency. However, in low prevalence settings, the Aug-Unif approach can lead to less efficient estimates, compared to case-enriched designs (see next).
Proposed method: outcome-dependent sampling design for cost-effective chart review with augmented estimation procedure
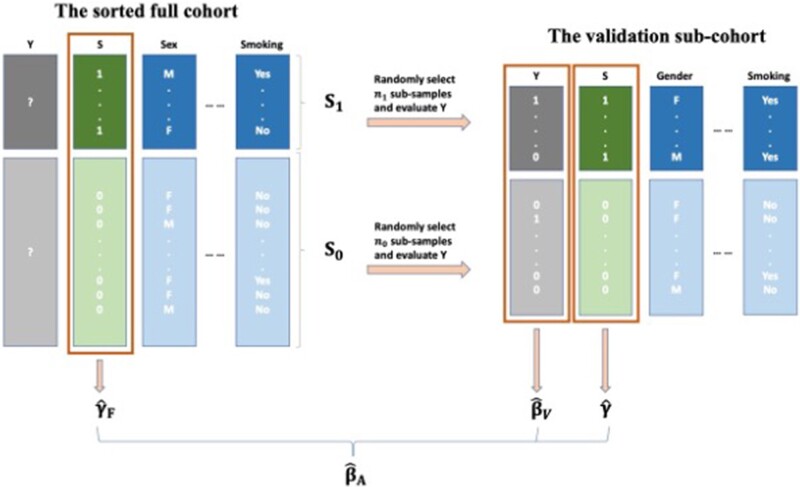
The proposed approach is motivated by the idea of taking advantage of both the biased sampling procedure and the augmentation method. Our method first applies an outcome-dependent sampling procedure to select patients for inclusion in the validation sample and then applies the “augmenting” method for estimation of outcome/exposure associations. Our method is visualized in Figure 2 and each step is detailed in Table 1.
Figure 2.
The outcome-dependent sampling design for cost-effective chart review with augmented estimation procedure.
Table 1.
The outcome-dependent sampling design for cost-effective chart review with augmented estimation procedure
| 1. Split the original full cohort into 2 sub-groups: “S-positive” ( “).” |
| 2. Uniformly select Let h1 and h0 be the sampling ratios in S1 and S0, respectively. |
| Perform the manual chart review in V and obtain the true phenotype Y. |
| 3. In the full cohort, fit weighted logistic regression for S and obtain the MLE estimator if S = 0; |
| 4. Within V, fit unweighted logistic regression for S and Y separately and obtain the “working” MLE . |
| 5. Construct the final estimator and obtain the MLE estimator , |
| where . |
The association between Y and S is quantified and utilized by introducing . On the other hand, as a result of the nondifferential misclassification assumption, for , sampling bias only exists in the intercept and the parameter estimation is still consistent. It also facilitates the identification of more patients with positive phenotypes and leads to smaller variance than estimation using uniform random sampling to generate the validation sample. In addition, it is more efficient than the original biased sampling method (Ori-Bias), as the “augmentation” step further reduces the variance utilizing the association between Y and S.
Practical suggestions
Our theory and experiments indicate that under the setting of rare disease and moderate specificity, we suggestto sample the validation set from only in order to include more cases to maximize the impact from the outcome-dependent sampling.
SIMULATION STUDIES
Simulation I: Empirical coverage probabilities and confidence intervals
Model setting
We first evaluate bias and efficiency of our method with synthetic data examples. The simulated dataset included a true phenotype Y, a surrogate phenotype S, and 3 covariates—, and with coefficients (1, 1, 1), that is,
To mimic the empirical distributions of the numeric covariates in our real data example, and followed the standard normal distribution. was a binary random variable that took the value 1 or 0 with a probability of 0.5. The intercept was adjusted to obtain average phenotype prevalence of ∼1%, ∼3%, ∼5%, ∼10%, ∼30%, and ∼50%. The surrogate outcome S was generated conditional on Y with given sensitivity and specificity . That is, the probability of was if or if :
Different combinations of were considered to assess the impact of the association between S and Y.
These values were chosen to mimic the real-world data while considering a wider spectrum of scenarios. Low prevalence often causes challenges in model fitting due to the limited number of positive cases. This is nontrivial even when using outcome-dependent sampling. Therefore, the prevalence of ∼1%/∼3% was used to investigate these concerns. On the other hand, the prevalence of ∼30%/∼50% was selected to verify that our method achieves similar efficiency to the uniform sampling method in higher prevalence settings.
Given , each simulation generated N = 3000 observations consisting of From this full cohort, n0 = 300 subsamples were drawn from and n1 = 300 subsamples were drawn from to construct the subcohort for the Ori-Bias and the outcome-dependent sampling design for cost-effective chart review with augmented estimation procedure (OSCA). Uniform sampling was used to select n = 600 subsamples from the full cohort to implement the Ori-Unif and the Aug-Unif. Specifically, for cases of the prevalence being ∼1% and ∼3%, the total sample size N and the validation sample size n were increased to 8000 and 2000, respectively, so that both random sampling methods were able to include enough cases to avoid model fitting failure. We repeated 10 000 simulations in each setting.
In this simulation study, 5 models were compared: “oracle,” “Ori-Unif,” “Aug-Unif,” “Ori-Bias,” and “OSCA.” The “oracle” model represents the ideal but unattainable scenario in which gold standard phenotypes are available for all subjects. This is not possible in practice but is used as a reference standard to benchmark the best possible estimator performance in a given scenario. The validity of all models was measured by coverage probabilities of 95% level confidence intervals, and the empirical distributions of corresponding MSE were visualized and compared in box plots.
Simulation results
First, all methods achieved nominal coverage probabilities across all scenarios investigated. We present in Supplementary Appendix Tables SA2–SA4 the average empirical coverage probabilities of at 95% level. All numbers in these tables are around 95%, no matter what combination of specificity (p0 = 60%/80%/90%), prevalence (5%/10%/30%/50%), and sensitive (p1 = 60%/80%/90%) is.
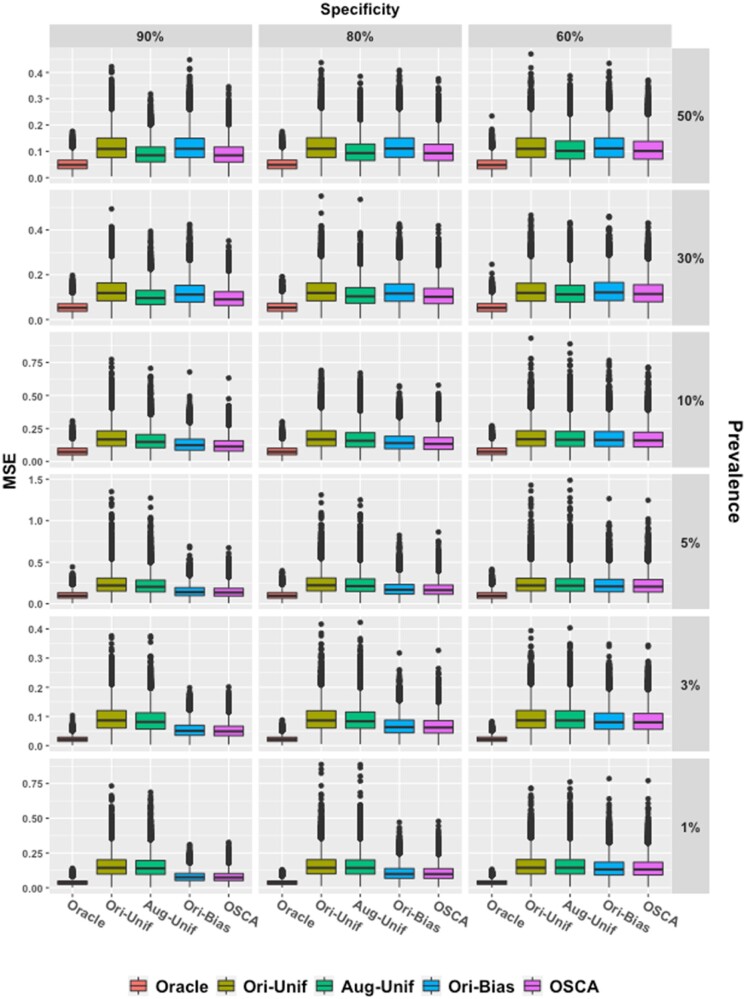
Figure 3 demonstrates the improved efficiency of OSCA relative to existing methods. The story is 2-fold. When the prevalence is low (5%/10%), compared to the 2 uniform sampling methods, OSCA is more efficient as it produces more concentrated MSE boxes, showing contribution from the outcome-dependent sampling. This trend becomes more visible as the specificity increases from 60% to 90%. In contrast, when the prevalence is ∼30% or greater, OSCA and Aug-Unif perform similarly. Thus, OSCA is more efficient when the prevalence is low, and its efficiency is not compromised when the prevalence is moderate or high.
Figure 3.
Box plots of empirical MSE. Five methods are compared with fixed p1 = 90%. Each column gives results at different specificities (90%, 80%, and 60%) and each row for different prevalence. Red, gold, green, blue, and purple boxes, respectively, stand for the oracle method, the uniform sampling method, the Aug-Unif method, the original biased sampling method, and the proposed method. Aug-Unif: augmented uniform sampling method.
On the other hand, the “augmentation” procedure enables the proposed method to be more efficient than the Ori-Bias when Y and S are closely associated. For example, with fixed prevalence at 30%, as the specificity increases from 60% to 90%, the MSE boxes of OSCA become narrower and narrower than those of Orig-Bias. This phenomenon also occurs between Aug-Unif and Ori-Unif, revealing the “augmentation” by involving the surrogate phenotype.
Simulation II: Power analysis
An advantage of our method is that it improves statistical power for a given validation sample size. Biased sampling facilitates comparison with more balanced samples and consequently requires fewer subjects to achieve the same power as the uniform sampling methods do. To support this numerically, we considered a single-predictor logistic model involving a standard normal predictor with coefficient . The intercept was adjusted to control the prevalence at ∼10% or ∼30%. The surrogate outcome was generated with fixed sensitivity and specificity both at 90% level.
Power was compared with the alternative hypothesis of or 0.5. The 2 uniform sampling methods (Ori-Unif and Aug-Unif) and 2 biased sampling methods (Ori-Bias and OSCA) all used the same validation sample size, n. For Ori-Unif and Aug-Unif, the validation samples were drawn uniformly from the full cohort. For the biased sampling methods, samples were selected uniformly from and respectively. The full cohort sample size was N = 5000, and in each setting, we repeated 10 000 simulations.
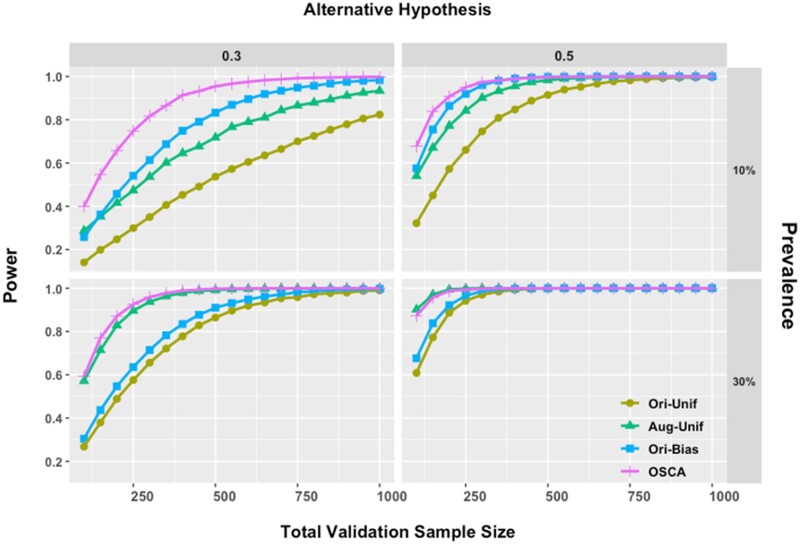
Figure 4 presents power comparisons of the 4 methods. There are several observations. In the top panels where the prevalence is low, the proposed method is able to greatly reduce the sample size needed to achieve a given power. For example, when the alternative hypothesis is and the prevalence is ∼10%, to achieve 80% power, Ori-Unif and Aug-Unif require ∼950 and ∼600 subjects, while Ori-Bias and OSCA need only ∼450 and ∼300 subjects, which save half samples.
Figure 4.
Power comparisons under different alternative hypotheses. The total validation sample size was varied from 100 to 1000. Combinations of prevalence at 10%/30% and alternative hypotheses of = 0.3/0.5 were presented. In all panels, gold, green, blue, and purple lines stand for Ori-Unif, Aug-Unif, Ori-Bias, and OSCA, respectively. Aug-Unif: augmented uniform sampling method; Ori-Bias: original biased sampling method; Ori-Unif: original uniform sampling method; OSCA: outcome-dependent sampling design for cost-effective chart review with augmented estimation procedure.
On the other hand, when the prevalence is moderate, the proposed method has similar performance as its uniform sampling counterpart does. In the bottom-left panel of Figure 4, where the prevalence is 30% and the alternative hypothesis is , Aug-Unif and OSCA have adjacent power lines and need ∼150 subjects to obtain 80% power, while Orig-Unif and Orig-Bias require ∼375 subjects.
Also, it is worth noting that as prevalence decreases, we continue to observe that OSCA requires a smaller sample to achieve the same power as Ori-Bias does. However, the magnitude of this increase in efficiency decreases with decreasing prevalence. For example, to achieve 80% power with prevalence of 3%, as shown in the top-left corner of Supplementary Appendix Figure SA8, we need ∼750 and ∼850 subjects for OCSA and Ori-Bias separately. This is an ∼13% decrease; correspondingly, as a comparison, when prevalence is 10%, there is an ∼50% decrease in the total sample size needed (Figure 4).
Simulations III: Effect of imbalanced sampling
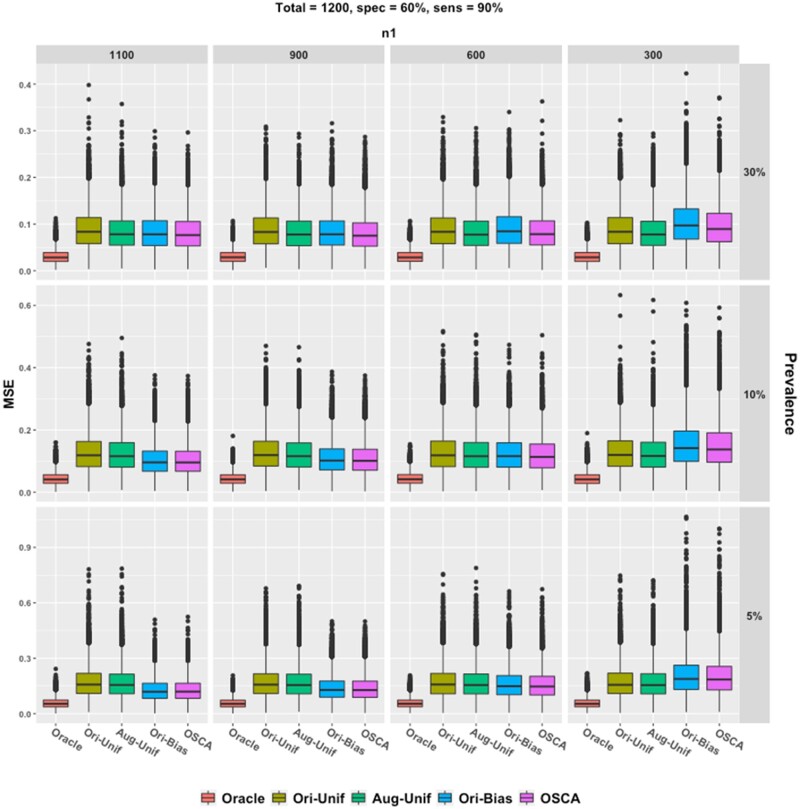
To examine the impact of different ratios of to , additional simulation studies were conducted with 60% specificity and 90% sensitivity. The model was the same as that in “Simulation I: Empirical coverage probabilities and confidence intervals” section, except that the total validation sample size was 1200, was {1100, 900, 600, 300} and . Prevalences of ∼5%, ∼10%, and ∼30% were considered.
Results are visualized in Figure 5. We observe that neither the augmentation nor the biased sampling helps much under the setting of rare disease and moderate specificity. However, when the prevalence is low (∼5%), both biased sampling methods give smaller boxes. The results confirm that a greater does help to obtain efficient and accurate estimation of the coefficients.
Figure 5.
Box plots of empirical MSE. Five methods are compared with fixed p1 = 90% and p0 = 60%. Each column gives results at different n1 and each row for different prevalence. Red, gold, green, blue, and purple boxes, respectively, stand for the oracle method, the uniform sampling method, the Aug-Unif method, the original biased sampling method, and the proposed method. Aug-Unif: augmented uniform sampling method
DATA ANALYSIS
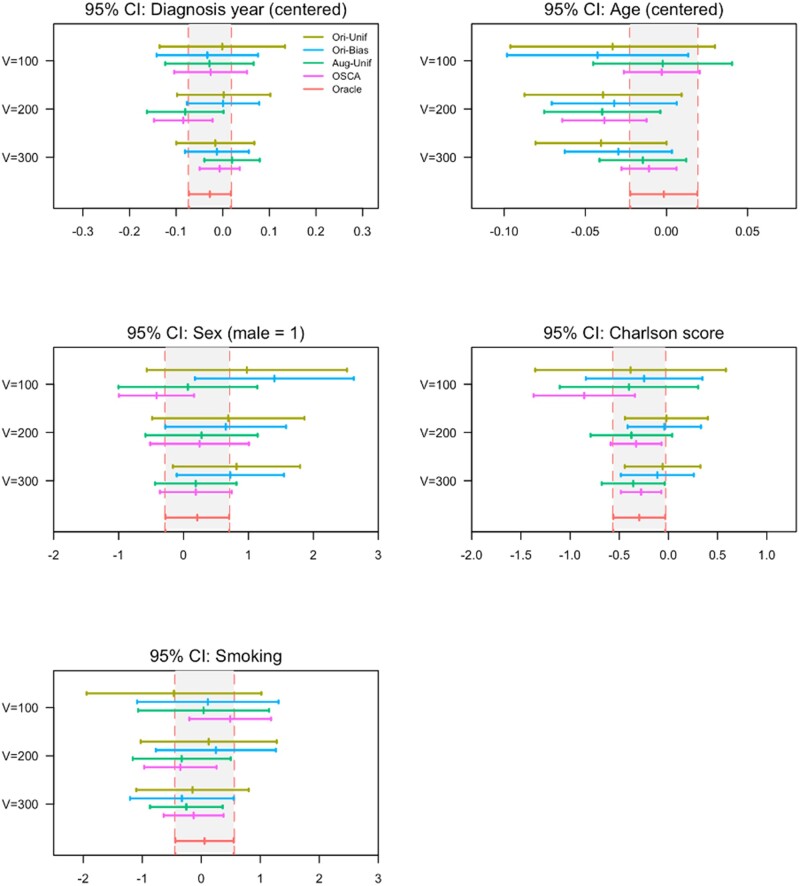
To illustrate the proposed method, we analyzed EHR data on colon cancer recurrence in a cohort of patients with a primary colon cancer diagnosed and treated in the KPW healthcare system. The study included 1063 patients who were age 18 years or older at the time of diagnosis of a stage I–IIIA colon cancer between 1995 and 2014. Chart abstractors conducted manual abstraction of medical records for all patients to obtain gold standard information on colon cancer recurrence. Recurrence was defined by a clinical diagnosis of colon cancer in the medical record occurring at least 90 days after completion of treatment for the primary colon cancer. In addition to this gold standard outcome, we applied an existing colon cancer recurrence phenotype to EHR data for the cohort to obtain a surrogate that did not require manual abstraction.13 We used these data to compare the magnitude and variance of estimates for the association of diagnosis year, age, sex, Charlson comorbidity score, and smoking status at primary cancer diagnosis with recurrent colon cancer using the alternative methods described above.
Of the 1063 patients included in the data set, 74 (6.96%) patients experienced colon cancer recurrence during follow-up. The median age at primary cancer diagnosis was 72 years (interquartile range 62–80). Five hundred and twelve (48.17%) of the 1063 patients were male. The median Charlson comorbidity score was 0.873 (interquartile range 0–1). Four hundred and seventy-six (44.78%) patients were never smokers. The median year of diagnosis was 2004 with interquartile range 2000–2009.
The sensitivity of the phenotyping algorithm using the cutpoint that maximizes Youden’s index was 84.49% and the specificity was 89.48%. To compare the 5 models, including Oracle, Ori-Unif, Ori-Bias, Aug-Unif, and OSCA, we varied the validation sample size across values of 100, 200, and 300. Figure 6 presents the results of the 5 models applied to the data. For validation samples of sizes 100, 200, and 300, the augmented methods, Aug-Unif (green) and OSCA (blue), outperformed the original methods, Ori-Unif (yellow) and Ori-Bias (blue) in terms of estimating parameters. As the validation sample size increases, the log odds ratios of the augmented methods are closer to that of the gold standard (red) compared with the original methods. Moreover, the biased sampling methods (blue and pink) outperformed the uniform sample methods (yellow and green) in terms of efficiency. The 95% confidence interval of the bias sampling method under all settings is narrower than the intervals of the corresponding uniform sampling method.
Figure 6.
Point estimates and 95% confidence intervals (CI) for the association (on log odds ratio scale) between cancer recurrence and risk factors in the KPW colon cancer cohort. The validation sample size was varied across values of 100, 200, or 300. The gray bands bounded by vertical red dashed lines represent the 95% CI of the association based on the gold standard status (red line) determined for the full sample (N = 1063). The dark yellow line represents the Ori-Unif method, the blue line represents the Ori-Bias method, the green line denotes the Aug-Unif method, and the pink line denotes the proposed OSCA method. Aug-Unif: augmented uniform sampling method; KPW: Kaiser Permanente Washington; Ori-Bias: original biased sampling method; Ori-Unif: original uniform sampling method.
Among the 2 augmented methods (green and pink), the proposed approach (OSCA, pink) provides a closer estimate to that based on the gold standard in the full sample (Oracle, red) with substantially higher efficiency compared to the Aug-Unif (green). As the validation sample size increases, the point estimate of the association parameter for the OSCA method moves toward the gold standard point estimate and the efficiency increases as well. The results are similar across all risk factors investigated, including diagnosis year, age, sex, Charlson score, and smoking status.
DISCUSSION
In this paper, we presented a method for sampling and association analysis of risk factors for rare phenotypes via a new biased sampling scheme of selecting patients for chart review. From an estimation point of view, we demonstrated that our method, using the idea of case enrichment, has sizable gains in statistical efficiency compared to existing methods based on uniform sampling for chart review. From a cost-effectiveness point of view, we note that the proposed sampling scheme can substantially reduce the needed number of patients to be chart reviewed, compared to existing methods, in order to reach the same level of statistical power. These properties and advantages of our proposed approach were supported by numerical investigations and an application using real-world EHR data.
The proposed method is also robust to the misspecification of the regression model on the risk factors with the surrogate phenotype as the outcome. This regression model is a working model, and it does not affect the validity of the proposed method. When the working model is close to the true relationship between the surrogate phenotype and the risk factors, the statistical efficiency of the proposed method can be improved. To obtain a flexible working model, we can relax the assumption that the regression models with surrogate phenotype as the outcome and with true phenotype as an outcome have the same set of risk factors. In particular, more risk factors can be included in the working model to achieve better statistical efficiency.
The proposed method has a number of limitations that warrant further investigations. First, the efficiency gain of our method, compared to Tong et al,12 comes at the price of requiring the underlying misclassification mechanism to be nondifferential. When the misclassification is truly differential,10 extension of our method is needed to ensure validity. One possible extension is to impose a misclassification model as in Lyles et al and modify our sampling scheme based on the estimated misclassification mechanism. We can also apply other parametric models and maximum likelihood methods to explicitly model the misclassification structure.14–16 Secondly, in some applications, there can be multiple surrogates available. It would be of interest to extend our current method to this setting. One possible choice is making them one aggregated surrogate, for example, the propensity score. Also, strategies such as stratification may apply. Thirdly, in practice, risk factors, such as smoking status, can also be subject to misclassification. It would be interesting to extend the proposed method to account for misclassification in both risk factors and phenotypes.
CONCLUSION
It has been acknowledged that association analysis of EHR data can lead to substantial bias if misclassification in EHR-derived phenotypes is ignored. Importantly, such bias can lead to excessive false-positive or false-negative findings generated from EHR. Our proposed outcome-dependent sampling method simultaneously addresses the issues of under-sampling of cases when disease is rare and estimation biases due to misclassification. In summary, we provided a new method that reduces estimation bias while maintaining low variance, which is also easy to implement and can guide sampling of patients for chart review and rigorous analysis of EHR data.
FUNDING
Research reported in this publication was supported in part by the NIH grants R21CA227613, R01CA172073, R01LM012607, R01AI130460, R01AG073435, 1R01LM013519, 1R56AG074604, R56AG069880 and a Subaward of NIH grant R01GM140476. The content is solely the responsibility of the authors and does not necessarily represent the official views of the National Institutes of Health. This work was supported partially through a Patient-Centered Outcomes Research Institute (PCORI) Project Program Awards (ME-2019C3-18315 and ME-2018C3-14899). All statements in this report, including its findings and conclusions, are solely those of the authors and do not necessarily represent the views of the Patient-Centered Outcomes Research Institute (PCORI), its Board of Governors or Methodology Committee.
AUTHOR CONTRIBUTIONS
ZY, JT, YC, and CYT designed methods and experiments; RAH provided the dataset from Kaiser Permanente Washington for data analysis; YC and CYT guided the dataset generation for the simulation study; ZY generated the simulation datasets, conducted simulation experiments, and JT conducted data analysis of the EHR data from Kaiser Permanente Washington; ZY, JT, YC, RAH, and CYT interpreted the results and provided instructive comments; ZY, JT, YC, RAH, and CYT drafted the main manuscript. All authors have approved the manuscript.
SUPPLEMENTARY MATERIAL
Supplementary material is available at Journal of the American Medical Informatics Association online.
CONFLICT OF INTEREST STATEMENT
None declared.
DATA AVAILABILITY
The data underlying this article cannot be shared publicly due to patient privacy concerns. The data will be shared on reasonable request to the corresponding author.1–13,16–30
Supplementary Material
REFERENCES
- 1. Tannen RL, Weiner MG, Xie D. Use of primary care electronic medical record database in drug efficacy research on cardiovascular outcomes: comparison of database and randomised controlled trial findings. BMJ 2009; 338 (1): b81. [DOI] [PMC free article] [PubMed] [Google Scholar]
- 2. Denny JC, Ritchie MD, Crawford DC, et al. Identification of genomic predictors of atrioventricular conduction. Circulation 2010; 122 (20): 2016–21. [DOI] [PMC free article] [PubMed] [Google Scholar]
- 3. Ritchie MD, Denny JC, Crawford DC, et al. Robust replication of genotype-phenotype associations across multiple diseases in an electronic medical record. Am J Hum Genet 2010; 86 (4): 560–72. [DOI] [PMC free article] [PubMed] [Google Scholar]
- 4. Zhao J, Henriksson A, Asker L, Boström H. Predictive modeling of structured electronic health records for adverse drug event detection. BMC Med Inform Decis Mak 2015; 15 (S4): S1. [DOI] [PMC free article] [PubMed] [Google Scholar]
- 5. Huitfeldt A, Hernan MA, Kalager M, Robins JM. Comparative effectiveness research using observational data: active comparators to emulate target trials with inactive comparators. EGEMS (Wash DC) 2016; 4 (1): 20. [DOI] [PMC free article] [PubMed] [Google Scholar]
- 6. Menendez ME, Janssen SJ, Ring D. Electronic health record-based triggers to detect adverse events after outpatient orthopaedic surgery. BMJ Qual Saf 2016; 25 (1): 25–30. [DOI] [PubMed] [Google Scholar]
- 7. Tripoliti EE, Papadopoulos TG, Karanasiou GS, Naka KK, Fotiadis DI. Heart failure: diagnosis, severity estimation and prediction of adverse events through machine learning techniques. Comput Struct Biotechnol J 2017; 15: 26–47. [DOI] [PMC free article] [PubMed] [Google Scholar]
- 8. Mortazavi BJ, Desai N, Zhang J, et al. Prediction of adverse events in patients undergoing major cardiovascular procedures. IEEE J Biomed Health Inform 2017; 21 (6): 1719–29. [DOI] [PubMed] [Google Scholar]
- 9. Duan R, Cao M, Wu Y, et al. An empirical study for impacts of measurement errors on EHR based association studies. AMIA Annu Symp Proc 2017; 2016: 1764–73. [PMC free article] [PubMed] [Google Scholar]
- 10. Chen Y, Wang J, Chubak J, Hubbard RA. Inflation of type I error rates due to differential misclassification in EHR‐derived outcomes: empirical illustration using breast cancer recurrence. Pharmacoepidemiol Drug Saf 2019; 28 (2): 264–8. [DOI] [PMC free article] [PubMed] [Google Scholar]
- 11. Ioannidis JPA. Why most published research findings are false. PLoS Med 2005; 2 (8): e124. [DOI] [PMC free article] [PubMed] [Google Scholar]
- 12. Tong J, Huang J, Chubak J, et al. An augmented estimation procedure for EHR-based association studies accounting for differential misclassification. J Am Med Inform Assoc 2020; 27 (2): 244–53. [DOI] [PMC free article] [PubMed] [Google Scholar]
- 13. Hassett MJ, Uno H, Cronin AM, Carroll NM, Hornbrook MC, Ritzwoller D. Detecting lung and colorectal cancer recurrence using structured clinical/administrative data to enable outcomes research and population health management. Med Care 2017; 55 (12): e88–98. [DOI] [PMC free article] [PubMed] [Google Scholar]
- 14. Spiegelman D, Rosner B, Logan R. Estimation and inference for logistic regression with covariate misclassification and measurement error in main study/validation study designs. J Am Stat Assoc 2000; 95 (449): 51–61. [Google Scholar]
- 15. Chen Z, Yi GY, Wu C. Marginal methods for correlated binary data with misclassified responses. Biometrika 2011; 98 (3): 647–62. [Google Scholar]
- 16. Lyles RH, Tang L, Superak HM, et al. Validation data-based adjustments for outcome misclassification in logistic regression. Epidemiology 2011; 22 (4): 589–97. [DOI] [PMC free article] [PubMed] [Google Scholar]
- 17. Hong C, Liao KP, Cai T. Semi-supervised validation of multiple surrogate outcomes with application to electronic medical records phenotyping. Biometrics 2019; 75 (1): 78–89. [DOI] [PubMed] [Google Scholar]
- 18. Chen J, Breslow NE. Semiparametric efficient estimation for the auxiliary outcome problem with the conditional mean model. Can J Statistics 2004; 32 (4): 359–72. [Google Scholar]
- 19. Wang X, Wang Q. Semiparametric linear transformation model with differential measurement error and validation sampling. J Multivar Anal 2015; 141: 67–80. [Google Scholar]
- 20. Magder LS, Hughes JP. Logistic regression when the outcome is measured with uncertainty. Am J Epidemiol 1997; 146 (2): 195–203. [DOI] [PubMed] [Google Scholar]
- 21. Weinberg CR, Wacholder S. The design and analysis of case-control studies with biased sampling. Biometrics 1990; 46 (4): 963–75. [PubMed] [Google Scholar]
- 22. Neuhaus JM. Bias and efficiency loss due to misclassified responses in binary regression. Biometrika 1999; 86 (4): 843–55. [Google Scholar]
- 23. Breslow NE, Holubkov R. Maximum likelihood estimation of logistic regression parameters under two-phase, outcome-dependent sampling. J R Stat Soc Ser B (Stat Methodol) 1997; 59 (2): 447–61. [Google Scholar]
- 24. Qin JBS. Over-Identified Parameter Problems and Beyond. Singapore: Springer; 2017. doi: 10.1007/978-981-10-4856-2. [Google Scholar]
- 25. Chen Y-H. Miscellanea. A robust imputation method for surrogate outcome data. Biometrika 2000; 87 (3): 711–6. [Google Scholar]
- 26. Breslow NE, Cain KC. Logistic regression for two-stage case-control data. Biometrika 1988; 75 (1): 11–20. [Google Scholar]
- 27. Wooldridge JM. Inverse probability weighted M-estimators for sample selection, attrition, and stratification. Port Econ J 2002; 1 (2): 117–39. [Google Scholar]
- 28. Tang CY, Qin Y. An efficient empirical likelihood approach for estimating equations with missing data. Biometrika 2012; 99 (4): 1001–7. [Google Scholar]
- 29. White H. Maximum likelihood estimation of misspecified models. Econometrica 1982; 50 (1): 1. [Google Scholar]
- 30. Chen Y-H, Chen H. A unified approach to regression analysis under double-sampling designs. J R Stat Soc B 2000; 62 (3): 449–60. [Google Scholar]
Associated Data
This section collects any data citations, data availability statements, or supplementary materials included in this article.
Supplementary Materials
Data Availability Statement
The data underlying this article cannot be shared publicly due to patient privacy concerns. The data will be shared on reasonable request to the corresponding author.1–13,16–30


