

Keywords: blood pressure, dipping, epithelial Na+ channel, extracellular fluid volume, sodium
Abstract
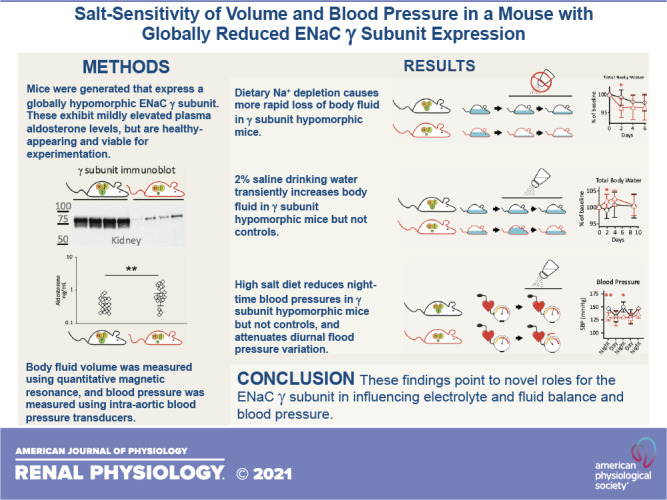
The epithelial Na+ channel (ENaC) promotes the absorption of Na+ in the aldosterone-sensitive distal nephron, colon, and respiratory epithelia. Deletion of genes encoding subunits of ENaC results in early postnatal mortality. Here, we present the initial characterization of a mouse with dramatically suppressed expression of the ENaC γ-subunit. We used this hypomorphic (γmt) allele to explore the importance of this subunit in homeostasis of electrolytes and body fluid volume. At baseline, γ-subunit expression in γmt/mt mice was markedly suppressed in the kidney and lung, whereas electrolytes resembled those of littermate controls. Aldosterone levels in γmt/mt mice exceeded those seen in littermate controls. Quantitative magnetic resonance measurement of body composition revealed similar baseline body water, lean tissue mass, and fat tissue mass in γmt/mt mice and controls. γmt/mt mice exhibited a more rapid decline in body water and lean tissue mass in response to a low-Na+ diet than the controls. Replacement of drinking water with 2% saline selectively and transiently increased body water and lean tissue mass in γmt/mt mice relative to the controls. Lower blood pressures were variably observed in γmt/mt mice on a high-salt diet compared with the controls. γmt/mt also exhibited reduced diurnal blood pressure variation, a “nondipping” phenotype, on a high-Na+ diet. Although ENaC in the renal tubules and colon works to prevent extracellular fluid volume depletion, our observations suggest that ENaC in other tissues may participate in regulating extracellular fluid volume and blood pressure.
NEW & NOTEWORTHY A mouse with globally suppressed expression of the epithelial Na+ channel γ-subunit showed enhanced sensitivity to dietary salt, including a transient increase in total body fluid, reduced blood pressure, and reduced diurnal blood pressure variation when given a dietary NaCl challenge. These results point to a role for the epithelial Na+ channel in regulating body fluid and blood pressure beyond classical transepithelial Na+ transport mechanisms.
INTRODUCTION
The epithelial Na+ channel (ENaC) has a key role in the regulation of extracellular fluid volume, blood pressure (BP), and renal K+ secretion. The canonical channel includes an α-subunit, a β-subunit, and a γ-subunit (1). Human mutations causing loss of function of the channel are associated with pseudohypoaldosteronism type 1, characterized by urinary Na+ wasting, polyuria, hypotension, hyperkalemia, and elevated aldosterone, reflecting extracellular fluid volume contraction (2). Gain-of-function mutations in the α-, β-, or γ-subunit have been associated with Liddle syndrome, characterized by hypertension, suppressed aldosterone, and hypokalemia (3–5). The importance of ENaC in regulating Na+ handling and extracellular fluid volume has led authors to suggest that ENaC activity may play a role in salt-sensitive hypertension (6–8).
However, mechanisms by which ENaC could influence fluid volume and BP are not entirely straightforward. ENaC expressed in the kidney tubule and large intestine promotes Na+ retention and K+ excretion (9–11), but ENaC is likely expressed in numerous other nonepithelial tissues that could also influence salt and water homeostasis and BP. A mouse expressing a global, hypomorphic, β-subunit allele was surprisingly found to have higher BPs than wild-type controls (12). Interpretation of these experiments was complicated by the presence of a Liddle syndrome-causing mutation in the hypomorphic allele. This caveat notwithstanding, increased BP in these animals is consistent with a role of ENaC in influencing BP beyond its classical role in promoting Na+ retention in epithelia. ENaC expressed in the vascular endothelium has been suggested to play a role in vascular stiffness, potentially influencing hemodynamics (13). ENaC may also contribute to arterial baroreception (14, 15). In addition, ENaC is expressed in antigen-presenting cells and may mediate the inflammatory response to high dietary salt intake, a process that has recently been suggested to contribute to salt-sensitive hypertension (8).
Laboratory examination of the systemic role of ENaC has been hampered by the essential nature of the genes encoding the α-, β-, and γ-subunits in mice (16–18). Here, we present the initial characterization of a gene-targeted mouse strain expressing a hypomorphic γ-subunit allele, resulting in dramatically reduced expression in both the kidney and the lung. Reduced γ-subunit expression has been previously shown to significantly impair cell surface expression and activity of the channel (19). Despite deficient expression of the γ-subunit, mice homozygous for this allele (γmt/mt) are viable. This hypomorphic allele allowed for the exploration of the importance of the ENaC γ-subunit in homeostasis of electrolytes, body fluid volume, and BP. As expected, mice deficient in γ-subunit expression exhibited impaired K+ excretion and elevated aldosterone and tended to have lower daytime BP. When presented with a dietary salt challenge, they exhibited a reduction in nighttime BPs and attenuated diurnal BP variation. Surprisingly, they also exhibited a transient increase in total body fluid volume. Although these findings are consistent with the classically described role of ENaC in promoting Na+ transport across epithelial tissues, they also suggest an extrarenal role of the γ-subunit in influencing body fluid balance.
METHODS
Generation and Care of γ-Subunit Hypomorphic Mice
Gene-targeted mice were produced using homologous recombination in embryonic stem (ES) cells. Scnn1g exon 2 and 7–8 kB of flanking DNA were cloned from a chromosome 7 bacterial artificial chromosome (BACPAC Genomics). The cDNA for the only known transcript of Scnn1g and a 3' V5 epitope tag was inserted, in frame, distal to the start codon in Scnn1g exon 2 (Fig. 1). An accompanying neomycin cassette decreased expression of the targeted locus (20). ES cells were electroporated with this construct. Correct insertion of the transgene was confirmed in G418-resistant stem cells by Southern blot. Chimeric mice carrying the targeted allele were produced at Charles River by microinjection of blastocysts with correctly targeted ES cell clones. Male progeny with germline incorporation of the transgene were selected as founders of independent mouse lines. Progeny were back crossed for four to five generations into the 129S2/SvPasCrl (129sv, Charles River) background. Heterozygous (γ+/mt) mice from the two separate lines were crossbred to generate experimental mice and littermate controls. Genotyping was performed in a single reaction with the following three primers: pER31 (intron 1 common forward primer: 5′-ACCTTACTTGGCTCCTCTGTCCCTTC-3′), pER32 (transgenic exon 2−3 junction reverse primer: 5′-GGAGGTCACTCACAGCACTGTACTTGTAG-3′), and pER35 (wild-type intron 2 reverse primer: 5′-GGAGGCAGATGCTAACCTCATTTCAGG-3′). Amplification products were 633 bp (γ+) and 400 bp (γmt). All control mice were littermates of γmt/mt mice.
Figure 1.

Generation of an Scnn1g hypomorphic allele. A: schematic of the wild-type (wt) and transgenic Scnn1g locus [encoding the epithelial Na+ channel (ENaC) γ-subunit]. The genomic region corresponding to the targeting construct is represented as a hatched box. Dark green boxes represent exons. Bars with * represent the radiolabeled 5′-probe used for Southern blot. †Position of the 3′-probe. These are external to the targeting construct (shown as the hatched region). Restriction sites used for Southern blot are marked. B: homologous recombination of the 5′-arm was confirmed by Southern blot of Sac1-digested embryonic stem cell genomic DNA with the 5′-probe (†). Correct recombination of the 3′-arm was confirmed following Nde1 digest of genomic embryonic stem cell DNA, followed by Southern blot with the DNA probe shown (*). +Clones with correct homologous recombination in a single chromosome. Chr, chromosome; Neo, neomycin resistance cassette; γENaC-V5, cDNA for the ENaC γ-subunit.
The baseline diet included 0.94% K+ and 0.23% Na+ (Prolab Isopro RMH 3000, LabDiet). The high-K+ diet (HKD) contained 5.2% K+ (as KCl) and 0.3% Na+ (Teklad TD.09075, Envigo). The low-Na+ diet (LSD; TD.90228) contained 0.01−0.02% Na+ and 0.8% K+. The high-Na+ diet (HSD) was 1.6% Na+ (as 4% NaCl) with 0.8% K+ (TD.03095). In experiments that provided Na+ via drinking fluid, 2% saline was used, unbuffered, at 2 g/dL NaCl in distilled H20 (wt/vol). All animal work was approved by Institutional Animal Care and Use Committees at the University of Pittsburgh or Vanderbilt University.
Measurement of Electrolytes and Hormones
Whole blood was collected from anesthetized animals via aspiration from a cardiac ventricle. Blood electrolyte measurements were performed immediately using an iSTAT handheld device (Abbott Point of Care). Urine Na+, K+, and Cl− measurements were performed using an EasyLyte analyzer (Medica). Urine osmolality was measured using an Osmette Micro-Osmette Osmometer (Precision Systems). ELISAs for aldosterone (Cat. No. ADI-900-173, Enzo Life Sciences) or atrial natriuretic peptide (ANP; Cat. No. RAB00385, Sigma-Aldrich) were performed on plasma diluted 1:25 to 1:200 or 1:4, respectively.
Immunoblot
Tissues were stored at −80°C until use. Approximately 50 mg of tissue was homogenized using a Dounce homogenizer in 0.15 mL (for the kidney) or 0.2 mL (for the lung) of CelLytic MT Cell Lysis reagent (Cat. No. C3228, Sigma-Aldrich) with Protease Inhibitor Cocktail St III (Cat. No. 539134, Calbiochem) and Phosphatase Inhibitor Cocktail Set II and Protease Inhibitor Cocktail Set III (Cat. No. 539132, Calbiochem). Protein was measured using a Pierce BCA protein assay kit (ThermoFisher) and mixed with 4× Laemmli buffer (Bio-Rad) plus 5% β-mercaptoethanol. Sixty micrograms of protein were loaded per well in a 4−15% polyacrylamide stain-free TGX gel (Cat. No. 5678084, Bio-Rad) and run in 1× Tris-glycine SDS buffer. Proteins were transferred to nitrocellulose and blocked in 5% (wt/vol) nonfat dry milk in PBS. Nitrocellulose was then incubated with primary antibody overnight in 5% milk in PBS. Primary antibodies included anti-γ-subunit (Cat. No. SPC-405D, StressMarq, 1 µg/mL), anti-β-subunit (Cat. No. SPC-404D, StressMarq, 1 µg/mL), and anti-α-subunit (Cat. No. SPC-403D, StressMarq, 1 µg/mL). After incubation with the appropriate horseradish peroxidase-linked secondary antibodies, blots were digitally analyzed using the ChemiDoc Imaging System (Bio-Rad). Immunoblot protein signal was normalized to whole lane protein content as quantitated from stain-free gels.
Body Composition Analysis
In vivo mouse body composition was measured by quantitative magnetic resonance (QMR) using a 100H Body Composition Analyzer (EchoMRI) (21, 22). QMR was recently shown to be effective at detecting progressive differences in body water in response to changes in dietary Na+ and water or mineralocorticoid treatment (23). Measurements were performed between 3:00 and 6:00 PM. Tag-free, unanesthetized, ∼10-wk-old mice were weighed, immediately placed in a restraint tube (EchoMRI) and inserted into the analyzer. The tube was carefully examined to ensure the absence of urine or other fluid from previously measured mice. Choice of restraint tube influenced measurements; therefore, the same tube was used for all measurements. Each measurement required <3 min. After measurement, each mouse was returned immediately to its cage. After all mice were measured once, each mouse was individually weighed and measured again. The data shown represent means of two measurements. Mouse weights and body water declined by 0.2−0.6 g between measurements (∼1 h apart), so mice were measured in the same order during each session.
Urine Electrolyte Measurement
Twelve-week-old mice that were fed the baseline diet were injected with 10% (vol/wt) of 0.9% sterile saline (intraperitoneally) and placed singly in metabolic cages (Hatteras Instruments) for urine collection over 4 h. Animals were then transitioned to the HSD for 3 wk, and 4-h urine specimens after the saline challenge were again collected in metabolic cages. Urine volume after the saline challenge was calculated as the fluid volume recovered versus the amount administered per mouse.
BP and Heart Rate Measurements
Twelve-week-old male mice underwent surgical implantation of BP radiotelemetry probes (model PA-C10, Data Sciences) into the aortic arch via the left carotid artery under isoflurane anesthesia. They were allowed to recover for a week while consuming the baseline diet. BP and heart rate (HR) were measured 3 nights and 2 days per week over the weekends, when the animal facility experienced less human traffic. Data shown represent means of measurements taken from 7:00 to 11:59 PM (nighttime) or 7:00 to 11:59 AM (daytime). Animals were then transitioned from the baseline diet to the HSD, and BP and HR were measured for 3 nights and 2 days at the end of 1, 2, and 3 wk after the change in diet. Mice were excluded from analysis if pulse pressure declined below 10 mmHg; this resulted in exclusion of a single mouse in the γmt/mt group. In the γ+/+ group, one mouse died, leaving five mice per group.
Statistics
Outliers were removed using the ROUT method (ROUT coefficient of 1%). Pairwise comparisons were performed by Student’s t test (α = 0.05). Additional statistical methods are described in the figures. Analyses were performed using Prism 8.4.2 (GraphPad). Reported errors represent SDs.
RESULTS
ENaC Expression
Immunoblots of whole kidneys and lungs from transgenic mice (γmt/mt) and littermate controls (γ+/+) revealed reduced γ-subunit expression (Fig. 2). ENaC subunit protein levels in kidney and lung lysates from γ+/+ and γmt/mt animals were compared by Western blot and normalized to total protein loaded per lane. Kidney γ-subunit protein content in γ+/+ males was lower than in γ+/+ females (0.81 ± 0.06 vs. 1.19 ± 0.13, P < 0.01). γ-Subunit protein expression in γmt/mt animals was dramatically reduced in both males (0.03 ± 0.02, P < 0.0001) and females (0.20 ± 0.08, P < 0.0001) compared with sex-matched controls. Lung γ-subunit protein content did not significantly differ between γ+/+ males (0.96 ± 0.07) and γ+/+ females (1.04 ± 0.04). However, lung γ-subunit protein in both γmt/mt males and γmt/mt females was significantly lower than in sex-matched controls (0.61 ± 0.06, P < 0.001, and 0.26 ± 0.09, P < 0.0001, respectively). β-Subunit protein levels in the kidney were also lower in γ+/+ males (0.39 ± 0.13) than in females (1.61 ± 0.62, P < 0.01). In γmt/mt males, the β-subunit was higher (1.44 ± 0.68, P < 0.05) than in male γ+/+ controls. However, this difference appeared to be driven more by reduced β-subunit signal in γ+/+ male kidneys than an increase in β-subunit expression in male γmt/mt kidneys or females of either genotype. There was no difference in β-subunit levels in γmt/mt female kidneys [0.96 ± 0.74, P = not significant (NS)] compared with the controls. In the lung, there were no differences in β-subunit protein levels when either sex or genotype were compared (γ+/+ male: 1.02 ± 0.22, γmt/mt male: 1.13 ± 0.44, γ+/+ female: 0.98 ± 0.21, and γmt/mt female: 0.88 ± 0.35). α-Subunit levels also did not differ significantly between sexes or genotypes in the kidney (γ+/+ male: 0.84 ± 0.24, γmt/mt male: 1.15 ± 0.14, γ+/+ female: 1.16 ± 0.13, and γmt/mt female: 1.23 ± 0.21). In the lung, α-subunit protein was similar in γ+/+ male and female mice (1.03 ± 0.36 vs. 0.97 ± 0.15) but was lower in γmt/mt male mice (0.57 ± 0.11, P < 0.05 compared with γmt/mt males). γmt/mt female mice exhibited α-subunit levels (1.02 ± 0.14) similar to γ+/+ female controls. Thus, it does not appear that the γ-subunit hypomorphic allele significantly alters the expression of other subunits of ENaC, with the possible exception of increased β-subunit expression in male kidneys.
Figure 2.
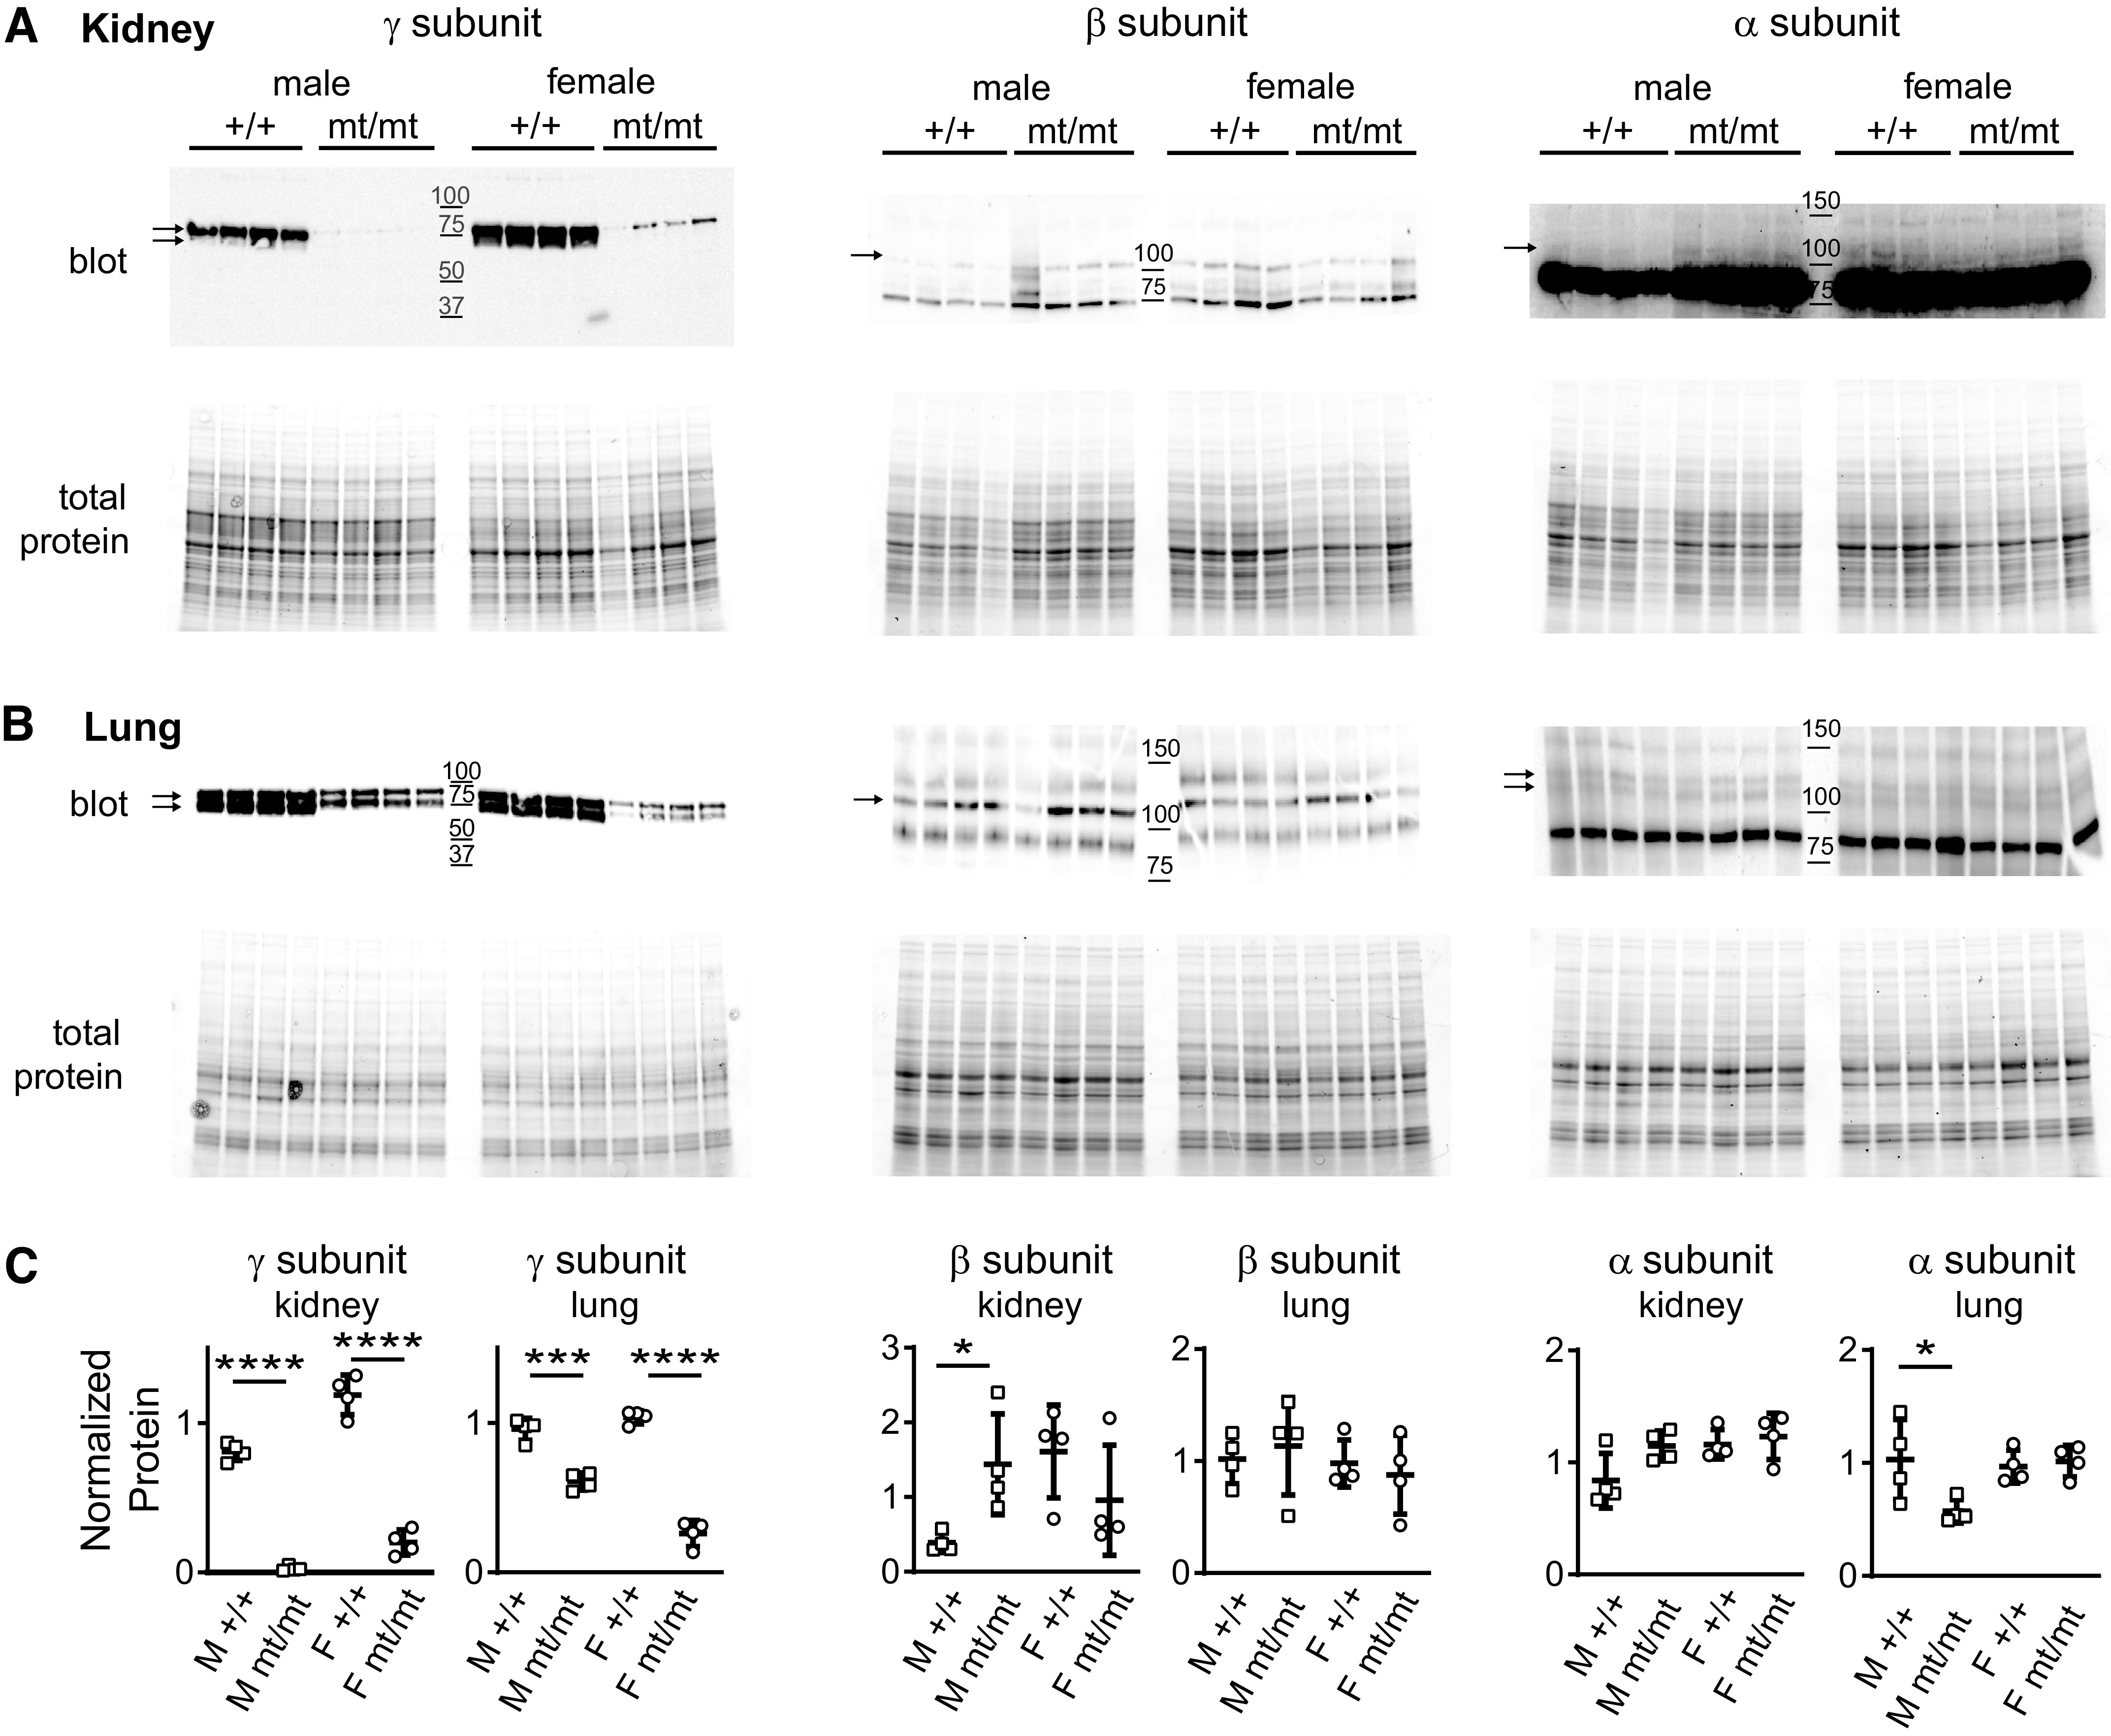
γmt/mt mice express significantly less γ-subunit in the kidney and lung. Immunoblots of kidney (A) and lung (B) tissue lysates from 10- to 12-wk-old γ+/+ or γmt/mt mice on the baseline diet were probed with antibodies against the γ-, β-, or α-subunit of the epithelial Na+ channel (ENaC). The top in A and B represents the chemiluminescence signal from immunoblots, and the bottom represents stain-free gels showing total protein loading. Molecular weight marker positions are shown in the middle of each blot. C: dot plots show protein normalized to the mean protein signal from a pool of both male (M) and female (F) γ+/+ control mice. A tear in the immunoblot of lung tissue of the β-subunit was digitally repaired for presentation but did not influence quantification. *P < 0.05, ***P < 0.001, and ****P < 0.0001 compared with the sex-matched controls by a two-tailed t test.
Viability of γmt/mt Mice
Because deletions of ENaC subunits exhibit early postnatal mortality, we examined litter size and genotype ratios in γ+/mt crosses (16). Litter size at weaning was 4.4 ± 1.8 pups, resembling the previously reported mean wild-type litter size of 4.6 pups for 129sv mice (24). Analysis of litters from 23 heterozygote crosses revealed that live γmt/mt pups were present at near-Mendelian ratios (29/103 compared with 28/103 and 46/103 for γ+/+ and γ+/mt pups, respectively). Weights of γmt/mt mice resembled age- and sex-matched controls. For 8- to 10-wk-old mice, γ+/+ males weighed 26.0 ± 0.9 g (n = 5) and γmt/mt males weighed 27.1 ± 0.9 g (n = 4, P = NS) and γ+/+ females weighed 21.1 ± 0.4 g (n = 7) and γmt/mt females weighed 21.0 ± 0.8 g (n = 3, P = NS). For 22- to 24-wk-old mice, γ+/+ males weighed 34.4 ± 6.1 g (n = 3) and γmt/mt males weighed 33.3 ± 3.3 g (n = 3, P = NS) and γ+/+ females weighed 26.7 ± 2.3 g (n = 3) and γmt/mt females weighed 25.35 ± 2.2 g (n = 4, P = NS). These data provide no evidence for growth impairment or pre- or perinatal mortality in γmt/mt mice.
Blood Metabolites
Pharmacological or genetic inhibition of ENaC has been previously shown to cause hyperkalemia (16, 25, 26). On the baseline diet, blood K+ in γmt/mt mice resembled that in the controls, as did Na+, Cl−, total CO2, blood urea nitrogen, and hemoglobin (Table 1). Blood K+ also did not differ between genotypes on the HKD (Table 2). The point estimate for blood K+ in γmt/mt males (5.6 ± 0.6, N = 9) exceeded that of γ+/+ males (5.2 ± 1.1, N = 8) but did not reach significance (P = 0.06).
Table 1.
Blood measurements on baseline diet
| γ +/+ | γ mt/mt | Male γ+/+ | Male γmt/mt | Female γ+/+ | Female γmt/mt | |
|---|---|---|---|---|---|---|
| Na+, mmol/L | 145 ± 1 (23) | 145 ± 2 (25) | 145 ± 1 (11) | 145 ± 2 (8) | 144 ± 1 (12) | 145 ± 2 (17) |
| K+, mmol/L | 4.6 ± 0.5 (23) | 4.8 ± 0.7 (25) | 4.7 ± 0.6 (11) | 5.1 ± 0.8 (8) | 4.5 ± 0.4 (12) | 4.7 ± 0.6 (17) |
| Cl−, mmol/L | 114 ± 2 (23) | 115 ± 2 (25) | 114 ± 2 (11) | 114 ± 3 (8) | 114 ± 2 (12) | 115 ± 2 (17) |
| Total CO2, mmol/L | 22 ± 2 (23) | 22 ± 2 (25) | 23 ± 1 (11) | 24 ± 2 (8) | 22 ± 2 (12) | 21 ± 2 (17) |
| Urea nitrogen, mg/dL | 27 ± 3 (23) | 28 ± 4 (25) | 28 ± 3 (11) | 31 ± 5 (8) | 26 ± 3 (12) | 27 ± 4 (17) |
| Hemoglobin, mg/dL | 14.1 ± 0.8 (23) | 14.0 ± 0.9 (25) | 14.2 ± 0.7 (11) | 14.5 ± 0.9 (8) | 14.0 ± 0.9 (12) | 13.8 ± 0.8 (17) |
| Creatinine, mg/dL | <0.2 (23) | <0.2 (25) | <0.2 (11) | <0.2 (8) | <0.2 (12) | <0.2 (17) |
| Atrial natriuretic peptide, pg/mL | 221 ± 114 (11) | 191 ± 101 (10) | 259 ± 112 (8) | 227 ± 104 (6) | 121 ± 11 (3) | 136 ± 77 (4) |
Blood parameters from 10- to 12-wk-old mice on baseline diet are shown as means ± SD; numbers of animals are in parentheses. Electrolytes, urea nitrogen, hemoglobin, and creatinine were assayed in whole blood. All creatinine values were below the detection threshold. Atrial natriuretic peptide measurements were measured in plasma. There were no significant differences between γ+/+ mice and γmt/mt mice, either in male mice or female mice, or when mice from both sexes were pooled, as determined by a two-tailed Student’s t test.
Table 2.
Blood measurements on a high-K+ diet
| γ +/+ | γmt/mt | Male γ+/+ | Male γmt/mt | Female γ+/+ | Female γmt/mt | |
|---|---|---|---|---|---|---|
| Na+, mmol/L | 146 ± 3 (15) | 147 ± 2 (13) | 148 ± 2 (8) | 148 ± 2 (9) | 145 ± 4 (7) | 145 ± 2 (4) |
| K+, mmol/L | 5.1 ± 0.9 (15) | 5.3 ± 0.7 (13) | 5.2 ± 1.1 (8) | 5.6 ± 0.6 (9) | 5.1 ± 0.6 (7) | 4.8 ± 0.5 (4) |
| Cl−, mmol/L | 120 ± 5 (115) | 119 ± 6 (13) | 119 ± 5 (8) | 120 ± 3 (9) | 120 ± 5 (7) | 116 ± 9 (4) |
| Total CO2, mmol/L | 20 ± 2 (15) | 21 ± 4 (13) | 21 ± 3 (8) | 21 ± 2 (9) | 19 ± 1 (7) | 22 ± 7 (4) |
| Urea nitrogen, mg/dL | 26 ± 4 (15) | 29 ± 5 (13) | 28 ± 2 (8) | 29 ± 4 (9) | 24 ± 6 (7) | 28 ± 8 (4) |
| Hemoglobin, mg/dL | 13.1 ± 1.0 (14) | 13.9 ± 1.2 (13) | 13.2 ± 1.1 (8) | 13.8 ± 0.7 (9) | 13.0 ± 1.1 (7) | 14.0 ± 2.1 (4) |
| Creatinine, mg/dL | <0.2 (15) | <0.2 (13) | <0.2 (8) | <0.2 (9) | <0.2 (7) | <0.2 (4) |
Data are presented as means ± SD; numbers of mice are shown in parentheses. Twelve- to sixteen-week-old mice were given a high-K+ diet (5.2% K+ as KCl) for 10 days. Electrolytes, urea nitrogen, hemoglobin, and creatinine were assayed in whole blood. Creatinine values were all below the detection threshold. Differences were assessed using a two-tailed Student’s t test.
Increased blood K+ stimulates aldosterone secretion, as does decreased effective arteriolar volume. Either of these could increase aldosterone in the plasma of γmt/mt mice. Moreover, elevated aldosterone enhances urinary K+ excretion and would attenuate any increase in blood K+ in γmt/mt mice. On the baseline diet, 10- to 12-wk-old γmt/mt mice exhibited higher aldosterone levels (830 ± 490 ng/mL, n = 18) than γ+/+ mice (410 ± 190 ng/mL, n = 17, P < 0.01; Fig. 3). This difference persisted when males were compared in isolation (900 ± 520 ng/mL, n = 6 for γmt/mt males, and 380 ± 220 ng/mL, n = 8 for γ+/+ males, P < 0.05). When females were examined in isolation, the difference was marginal (790 ± 490 ng/mL, n = 12 for γmt/mt females, and 440 ± 170 ng/mL, n = 9 for γ+/+ females, P = 0.05). Ten days on the HKD (5.2% K+ as KCl) increased aldosterone levels in both genotypes, but γmt/mt mice continued to exhibit higher plasma aldosterone levels (6,190 ± 3,160 ng/mL, n = 11) than γ+/+ control mice (3,770 ± 1,690 ng/mL, n = 12, P < 0.05).
Figure 3.

Plasma aldosterone levels are higher in γmt/mt mice than in γ+/+ control mice. On the baseline (0.94% K+) diet, plasma aldosterone in 10- to 12-wk-old mice was higher in γmt/mt mice than in control γ+/+ mice. Ten days on a high-K+ diet (5.2% K+ as KCl) increased plasma aldosterone levels in both genotypes, but aldosterone levels remained higher in γmt/mt mice than in the controls. Significance of differences between experimental animals and littermate controls was evaluated using a two-tailed t test. *P < 0.05; **P < 0.01.
Body Composition
We hypothesized that γmt/mt mice would exhibit reduced body fluid volume. As a marker of intravascular fluid volume, we examined ANP levels on the baseline diet but found no difference between genotypes (Table 1). Similarly, QMR revealed no significant differences in percent total body water, lean tissue mass, or fat tissue mass in animals on the baseline diet (Fig. 4). For γ+/+ mice, body water was 67.7 ± 2.7% (N = 10) compared with 67.4 ± 2.6% for γmt/mt mice (N = 7, P = NS). Lean tissue mass was 79.9 ± 2.5% versus 79.4 ± 3.0% (P = NS), and fat composition was 12.0 ± 3.1% versus 12.8 ± 3.1% (P = NS).
Figure 4.

Body composition analysis in γmt/mt and γ+/+ mice reveals differences in body water and lean tissue mass in response to changes in dietary salt. Body composition was measured using quantitative magnetic resonance in 9- to 14-wk-old mice. Starting weights were similar between groups. Before dietary manipulation, there were no differences in body composition as a percentage of total body weight. Mice were placed on a Na+-depleted (0.01−0.02% Na+) diet, and subsequent body composition variables were normalized to baseline for each animal. By day 2, normalized total body water was lower in γmt/mt mice than in γ+/+ mice (P < 0.05). Normalized lean tissue mass was also lower in γmt/mt mice (P < 0.01). Normalized fat content did not differ between γ+/+ and γmt/mt mice. Composition did not differ on subsequent days. After a 10-day recovery on regular diet, the effect of 2% saline on body composition was evaluated. On day 2, normalized body water and lean tissue had increased in γmt/mt mice compared with the controls (P < 0.05 for each). Thereafter, composition did not differ between genotypes. Body fat did not differ between genotypes. Statistical significance of differences between genotypes on a given day was assessed via a two-tailed t test. *P < 0.05; **P < 0.01.
γmt/mt mice did not have evidence of volume depletion at baseline. To evaluate whether compensatory mechanisms could be overcome by physiological stress, animals were stressed with an LSD (0.01−0.02% Na+) (Fig. 4). Genotype-dependent differences in body weight were not observed. At day 2, γmt/mt mice exhibited lower normalized body water than the controls (99.1 ± 2.1% for γ+/+ mice, N = 10, and 96.3 ± 2.7% for γmt/mt mice, N = 7, P < 0.05; Fig. 4). Subsequently, body water differences between genotypes lost significance. At day 2, γmt/mt mice exhibited lower normalized lean mass than controls (100.3 ± 2.1% for γ+/+ mice, N = 10, and 97.1 ± 1.9% for γmt/mt mice, N = 7, P < 0.01). Body fat did not change in either group.
The ability of ENaC to promote Na+ retention has led to the hypothesis that increased channel activity may contribute to salt-sensitive hypertension (6, 27, 28). We, therefore, asked whether γmt/mt mice were protected from fluid volume overload during an obligatory increase in Na+ intake associated with replacement of electrolyte-free drinking water with 2% saline. Mice prefer saline to electrolyte-free water, consuming >6 mL of 2% saline per day, compared with <2 mL of deionized water (29). On 2% saline, no difference in body weight was observed between groups (106 ± 6.8%, N = 10 for γ+/+ mice, and 107 ± 4.2%, N = 7 for γmt/mt mice, on day 9, P = NS; Fig. 4). Unexpectedly, body water increased in γmt/mt mice relative to the controls at day 2 (to 101.7 ± 2.1% vs. 98.9 ± 2.6%, respectively, P < 0.05). γmt/mt mice also exhibited higher lean tissue mass on day 2 (101.9 ± 1.7% vs. 99.1 ± 1.7%, respectively, P < 0.05). Body water and lean tissue masses did not differ significantly on later days. Body fat was not significantly different in γ+/+ and γmt/mt mice over 9 days (to 140.7 ± 30.7% and 149.7 ± 28.3%, respectively). Thus, γmt/mt mice experienced a transient increase in body water and lean tissue mass when challenged with an obligatory increase in NaCl consumption.
Urinary Electrolyte Excretion
To evaluate differences in urinary Na+ and K+ excretion, we examined urine electrolytes in response to a saline load in mice on the baseline diet and HSD. Mice were given an intraperitoneal injection of 0.9% saline solution, at a volume equal to 10% of the body weight, similar to previously published studies that used this method to induce ENaC-dependent, flow-induced K+ secretion (30, 31). Urine was then collected over 4 h in metabolic cages. The volume of urine recovered, as a fraction of injected volume, is reported in Table 3. Recovered urine volume did not differ between genotypes on either diet. Urine osmolality was also not different. Urine Na+ excretion (UNaV̇) did not differ between genotypes. In both genotypes, weight-normalized urinary K+ excretion (UKV̇) was lower when animals were on the HSD than on the baseline diet. At baseline, the urinary Na+/K+ concentration ratio (UNa/UK) did not differ significantly between genotypes, but the HSD resulted in a significantly higher UNa/UK in γ+/+ mice than in γmt/mt mice.
Table 3.
Urine measurements
| Baseline diet |
High Na+ diet |
|||
|---|---|---|---|---|
| γ+/+ (5) | γmt/mt (6) | γ+/+ (4) | γmt/mt (5) | |
| Urine volume, % | 46 ± 19 (5) | 59 ± 25 (6) | 45 ± 16 (4) | 46 ± 20 (5) |
| UNaV̇/g, µmol/h/g | 15 ± 7 (5) | 17 ± 9 (6) | 24 ± 12 (4) | 19 ± 7 (5) |
| UKV̇/g, µmol/h/g | 6.7 ± 1.4 (5) | 6.4 ± 1.7 (6) | 2.9 ± 2.1 (4)† | 3.2 ± 1.3 (5)† |
| UClV̇/g, µmol/h/g | 68 ± 27 (5) | 78 ± 35 (6) | 94 ± 48 (4) | 82 ± 30 (5) |
| UNa/UK | 2.2 ± 0.9 (5) | 2.6 ± 1.0 (6) | 9.0 ± 1.5 (4)‡ | 6.1 ± 1.2 (5)*‡ |
| Urine osmolality | 536 ± 144 (5) | 409 ± 150 (5) | 583 ± 180 (4) | 584 ± 172 (5) |
Urine was collected from 18-wk-old mice in metabolic cages over 4 h after intraperitoneal injection with 0.9% saline solution [10% (vol/body wt)]. After baseline urine collection, animals were transitioned to a high-NaCl (4% Na+) diet for a week, and urine electrolytes were again measured. Statistical significance was assessed using a Student’s t test. Urine volume represents the percentage of injected saline volume recovered as urine in 4 h of time. Differences between genotypes on a given diet are denoted as *P = 0.01; differences between diets within a given genotypic group are denoted as †P = 0.01 and ‡P < 0.001. UNaV̇, UKV̇, and UClV̇ are urinary Na+, K+, and Cl− excretion, respectively.
Blood Pressures
Functional genetic alteration in genes encoding ENaC subunits is associated with altered BP (27, 32). We hypothesized that reduced ENaC γ-subunit expression in mice would protect the mice from salt-induced hypertension. We examined BPs and HRs in γmt/mt mice on the baseline diet and after transition to the HSD (Fig. 5A). Mean daily nighttime systolic BP (SBP), diastolic BP (DBP), and HR on the baseline diet did not differ between γ+/+ and γmt/mt mice. Mean daily daytime SBP and DBP and HR were lower in γmt/mt mice compared with the controls on just 1 of 2 days during the baseline measurement period. After transition to the HSD, nighttime SBP in γmt/mt mice was lower than the controls on days 7, 8, and 14 and DBP was lower on day 8. After day 16, the SD in BP measurements in γmt/mt mice increased dramatically as SBP and DBP dropped to 92–110 mmHg (systolic) and 76–95 mmHg (diastolic) in two of the γmt/mt mice. These mice exhibited normal temperature (data not shown) and subjectively normal behavior. The cause of decline in BP was not determined. Overall, these results suggest a tendency toward reduced BP on HSD in γmt/mt mice compared with the controls.
Figure 5.
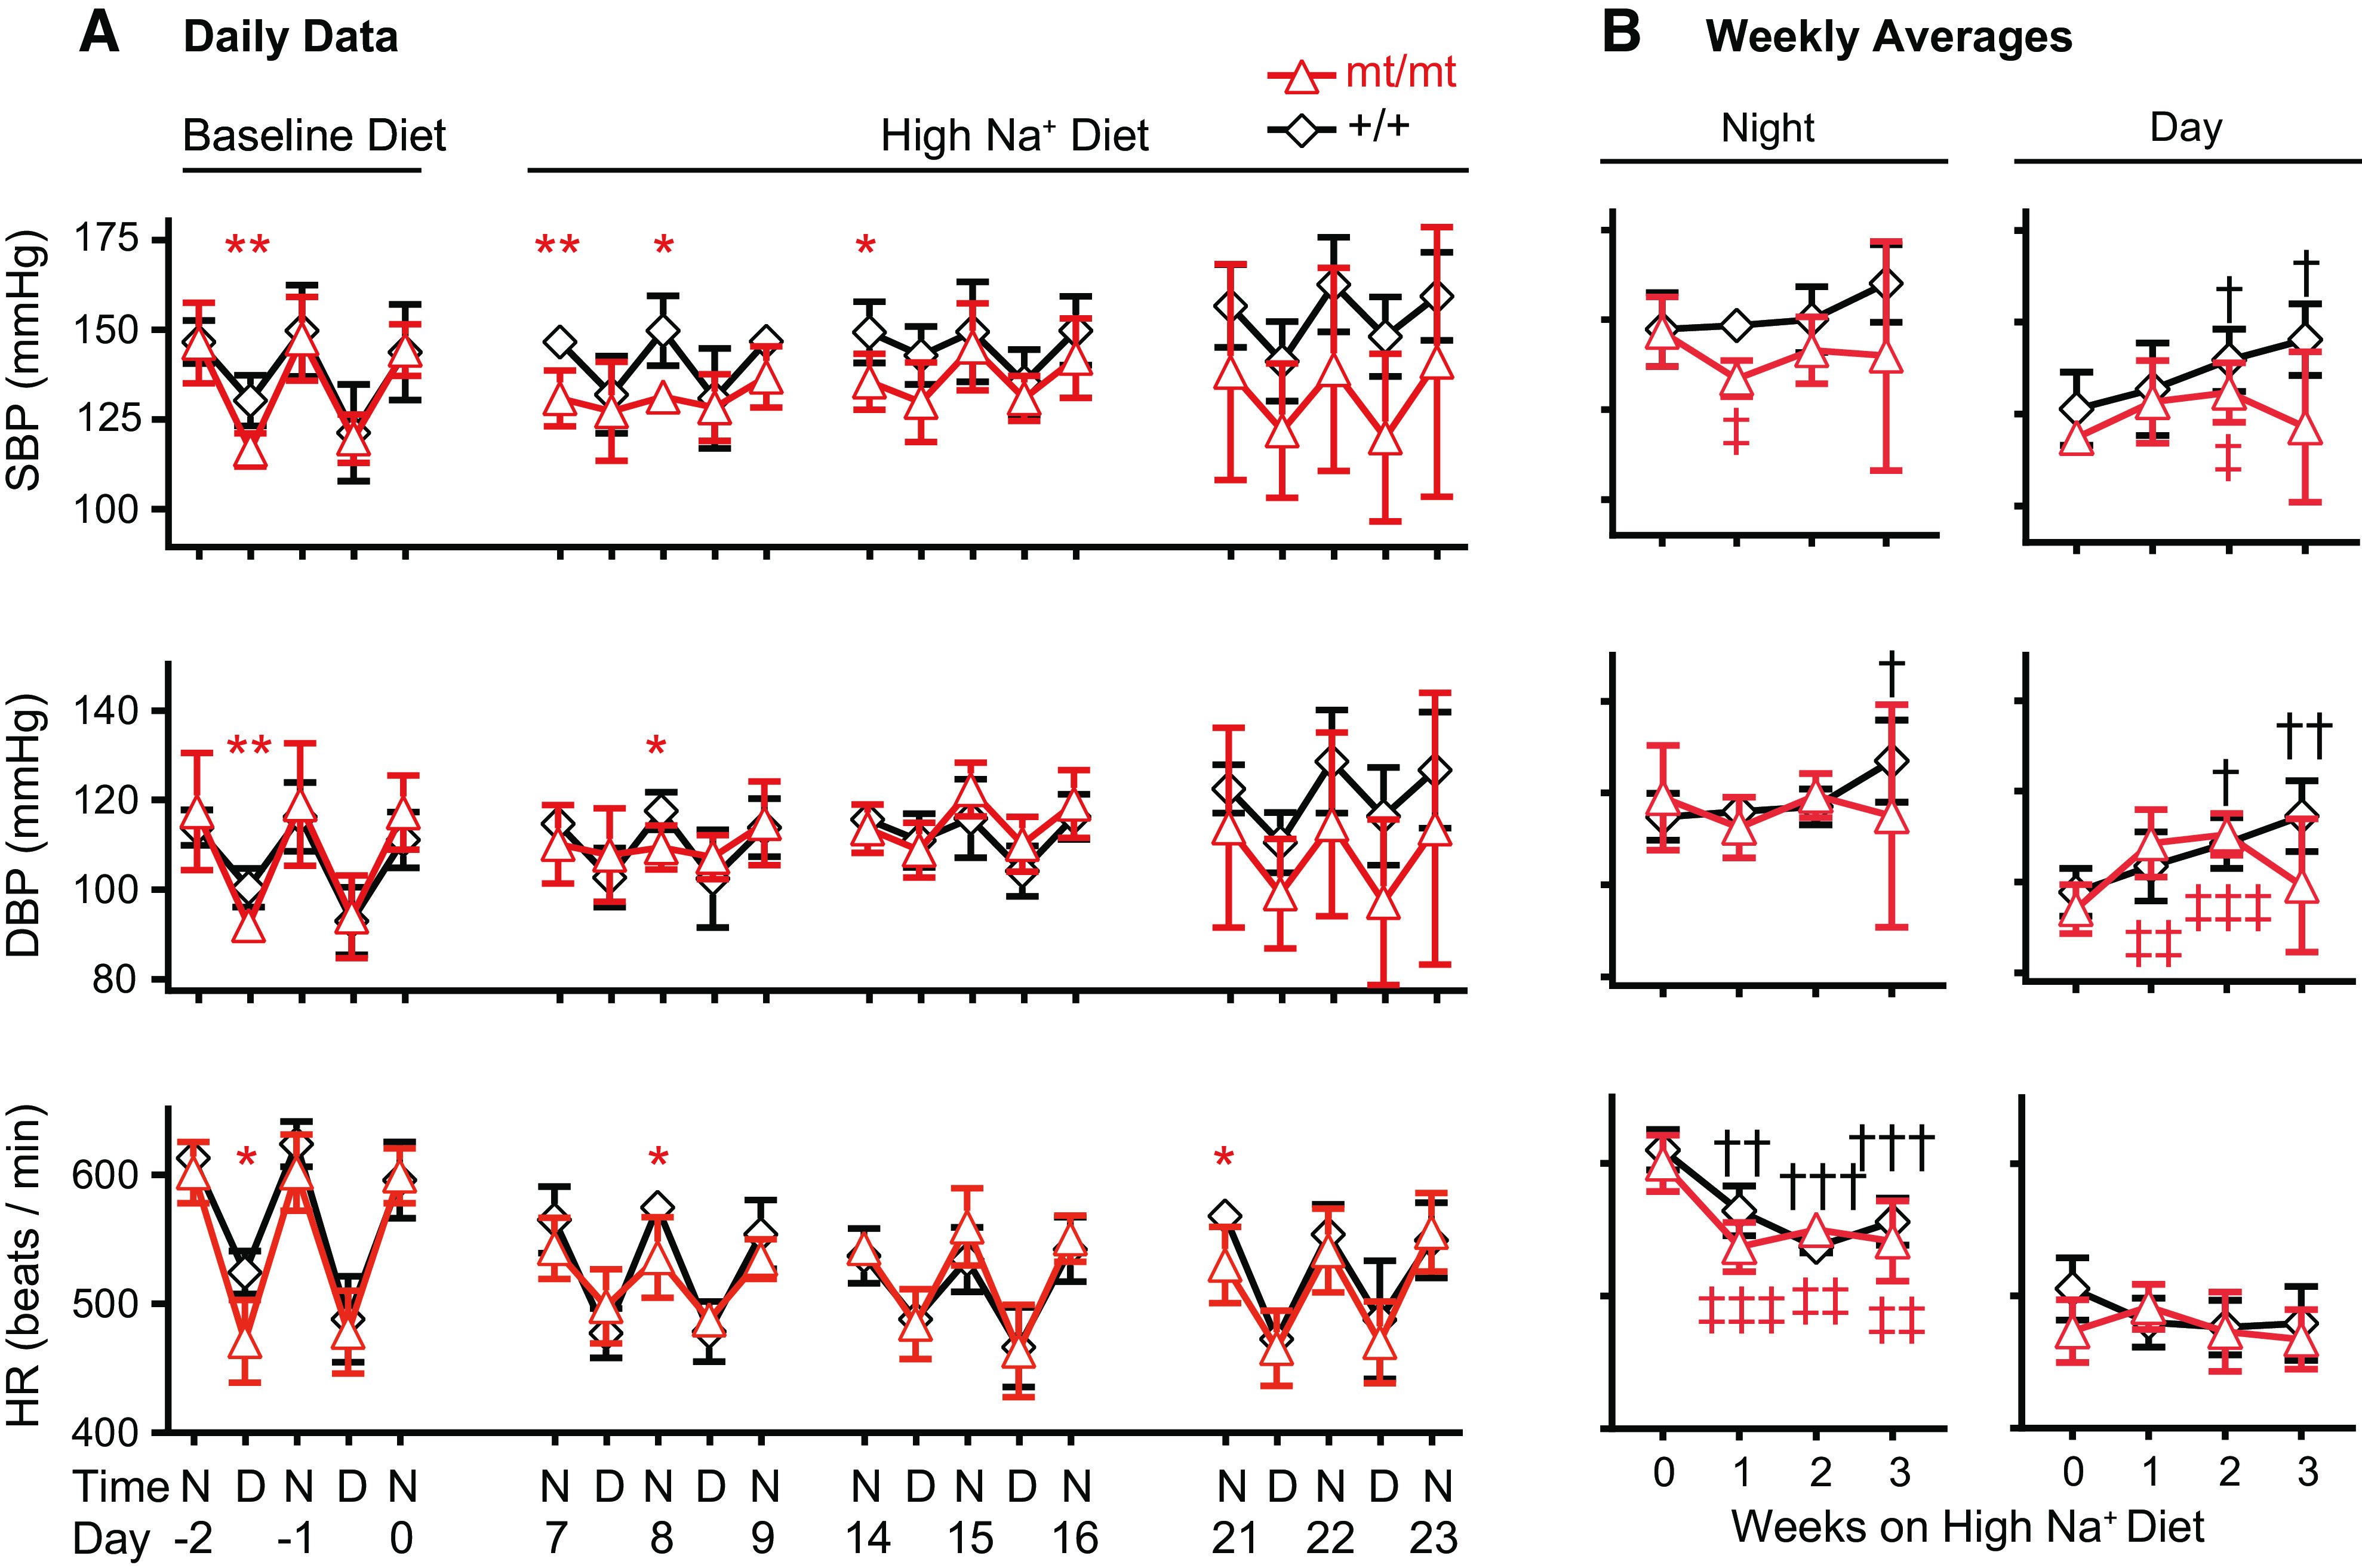
γmt/mt mice exhibit reduced blood pressure (BP) and blunted diurnal BP variation in response to a high-Na+ (4% NaCl) diet (HSD). BPs in 13-wk-old mice were measured via intra-aortic telemetry. A: mean systolic BP (SBP), diastolic BP (DBP), and heart rate (HR) at baseline and after initiation of the HSD. Day 0 represents the day that diets were transitioned from baseline (0.49% NaCl) to the HSD. *P ≤ 0.05 and **P ≤ 0.01 for comparison between genotypic groups on a given day. B: to compare changes in BP or HR against baseline, mean weekly BP or HR, disaggregated into nighttime and daytime measurements, were averaged over the course of the 3 nights and 2 days per week shown in A. Statistically significant differences in BP or HR, compared with baseline (week 0), are indicated by † or ‡ for γ+/+ or γmt/mt animals, respectively. † or P ≤ 0.05; †† or ‡‡P ≤ 0.01; ††† or ‡‡‡P ≤ 0.001. n = 5 mice per group. Significance was evaluated using a two-tailed t test. D, daytime; N, nighttime.
To evaluate changes in BP and HR in response to the HSD, mean weekly SBP, DBP, and HR (calculated as the mean of three nighttime periods and three daytime periods each week) were compared against those measured on the baseline diet (Fig. 5B). At baseline, mean weekly SBP, DBP, and HR did not differ in γmt/mt versus γ+/+ mice. Following transition to the HSD, γ+/+ mice experienced little change in mean weekly nighttime SBP, although daytime SBP rose progressively. In contrast, γmt/mt mice experienced a 1-wk decline in nighttime SBP, associated with an apparent loss in the diurnal variation in BP that then returned to the baseline. Daytime SBP in γmt/mt mice rose significantly by the end of the second week on the HSD, after which the weekly SBP point estimate fell and became indistinguishable from the baseline. Mean weekly nighttime DBP rose in γ+/+ mice by the end of the third week of the HSD. These mice exhibited a progressive and significant rise in daytime mean weekly DBP. Nighttime DBP in γmt/mt animals did not differ significantly from baseline over the course of the experiment. However, daytime DBP in these animals rose for the first 2 wk on the HSD and then returned to baseline during the third week. Weekly mean nighttime HRs declined significantly in both γ+/+ and γmt/mt mice following transition to the HSD. Daytime mean weekly HRs did not change significantly.
DISCUSSION
We describe a viable mouse model with reduced expression of the ENaC γ-subunit in the kidney and lung. These γmt/mt mice appear healthy under baseline conditions, exhibiting weights and blood electrolytes similar to the controls. However, they exhibit higher aldosterone levels, indicating compensation for reduced ENaC activity. γmt/mt mice also exhibit enhanced salt sensitivity in terms of body fluid and BP. As expected, they experience an impaired ability to conserve body fluid on a low-NaCl diet, as reflected by transient reductions in body water and lean mass on the LSD. Surprisingly, in the face of a dietary NaCl challenge, γmt/mt mice experience early transient fluid retention compared with the controls. At later times on an HSD, γmt/mt mice exhibited the expected phenotype of a lower BP compared with the controls.
The observation that reduced expression of the ENaC γ-subunit did not result in hyperkalemia was surprising. K+ excretion is closely associated with ENaC-mediated Na+ reabsorption in the aldosterone-sensitive distal nephron, and pharmacological or genetic impairment of ENaC activity reduces K+ secretion and promotes hyperkalemia (12, 16, 30, 33). Elevated aldosterone in γmt/mt animals likely stimulates processes that facilitate renal K+ excretion in mice with reduced renal ENaC activity (34), but other mechanisms may also contribute. On the baseline diet, γmt/mt mice and their γ+/+ littermates exhibited similar UNa/UK. When challenged with the HSD, γmt/mt mice and controls exhibited similar, nonsignificant changes in UNaV̇. However, both groups demonstrated a significant reduction in UKV̇, consistent with suppressed aldosterone signaling. The HSD reduced UNa/UK in γmt/mt mice compared with the controls, suggesting upregulation of aldosterone- and ENaC-independent K+ excretion in these animals.
γmt/mt mice are more sensitive to dietary NaCl than wild-type mice. These animals are euvolemic and normotensive at baseline, as demonstrated by normal blood hemoglobin, blood urea, and ANP concentrations. However, elevated aldosterone likely contributes to basal euvolemia. Dietary NaCl depletion revealed an impaired ability to maintain body fluid levels compared with the controls. The magnitude of the loss of body fluid of γmt/mt mice on the LSD was modest compared with that observed in the mice with a hypomorphic β-subunit allele (35). In our experiments, control animals did not experience any significant decline in body weight, whereas previous work found that control animals experienced a roughly 10% decline in body weight within 2 days on an LSD. This disparity may be explained by our use of mice in the 129sv background, which express multiple renin genes (36, 37). Enhanced renin-angiotensin-aldosterone system activity may explain the relative resistance of control animals to the effects of dietary Na+ deprivation. Other investigators have also observed resistance to total body fluid loss in wild-type 129/sv mice given an LSD (38). γmt/mt mice exhibited enhanced body fluid loss in response to dietary Na+ deprivation compared with the controls, consistent with a mild pseudo-hypoaldosteronism phenotype.
BPs in γmt/mt mice and controls were largely similar on a control diet. An influence on extracellular fluid volume has classically been invoked to explain the effects of ENaC on BP, but we did not observe lower body fluid in γmt/mt mice except when they experienced dietary Na+ deprivation. In contrast, γmt/mt mice drinking 2% saline had a transient increase in body fluid volume compared with the controls. This observation points to a role for the ENaC γ-subunit in attenuating volume overload in the context of increased Na+ consumption through as-of-yet unclear mechanisms and is consistent with an extrarenal role of ENaC in regulating extracellular fluid volume. Further experiments will be required to evaluate whether extrarenal mechanisms contribute to altered extracellular fluid volume in these mice.
Increased dietary Na+ surprisingly suppressed nighttime SBP and diurnal BP variation in γmt/mt mice. In humans, “nondipping” BPs that fail to decline during sleep have been associated with greater risk of adverse cardiovascular outcomes (39). The mechanisms behind nondipping BPs remain unclear but may reflect altered arterial stiffness (40). ENaC expressed in endothelial cells has been suggested to influence arterial stiffness (41, 42) and could contribute to the nondipping phenotype.
In summary, our observations with γmt/mt mice are consistent with ENaC’s role in regulating extracellular fluid volume and BP but also suggest that extrarenal ENaC has a role in extracellular fluid volume regulation, particularly in the setting of high salt intake.
Perspectives and Significance
Understanding systemic effects of ENaC function has been challenged by lethality of deletion of any of the three genes encoding ENaC subunits in mice. Targeted deletion in the kidney has confirmed a role for ENaC in electrolyte and fluid volume homeostasis, but ENaC is expressed in many other tissues. Here, we describe the generation of viable mice expressing a novel, hypomorphic γ-subunit allele that has the expected phenotypes including enhanced body fluid loss on an LSD and lower BP on an HSD. In the context of a high-salt dietary challenge, γ-subunit hypomorphic mice exhibit unexpected phenotypes, such as transient fluid gain and a reduction in diurnal BP variation. Further studies will evaluate these phenotypes, which may be a consequence of loss of ENaC function in tissues beyond the renal tubular and intestinal epithelium.
GRANTS
This work was supported by National Institutes of Health Grant Nos. K08DK110332, R01HL147818, T32DK061296, P30DK079307, K01HL130497, R03HL155041, and R01HL144941.
DISCLOSURES
No conflicts of interest, financial or otherwise, are declared by the authors.
AUTHOR CONTRIBUTIONS
E.C.R., Y.B., S.S., A.K., and T.R.K. conceived and designed research; E.C.R., A.P., T.L., A.C.J., R.P., M.A., A.L.M., and A.W. performed experiments; E.C.R., A.P., T.L., A.C.J., T.R.K., and A.W. analyzed data; E.C.R., A.P., A.C.J., T.R.K., and A.K. interpreted results of experiments; E.C.R. and A.P. prepared figures; E.C.R. drafted manuscript; E.C.R., A.P., T.L., A.C.J., M.A., Y.B., S.S., A.K., and T.R.K. edited and revised manuscript; E.C.R., A.P., T.L., A.C.J., M.A., A.L.M., A.W., Y.B., S.S., A.K., and T.R.K. approved final version of manuscript.
REFERENCES
- 1.Sheng S, Hallows KR, Kleyman TR. Epithelial Na+ channels. In: Seldin and Giebisch's The Kidney (5th ed.), edited by Alpern RJ, Moe OW, Caplan MJ. Waltham, MA: Elsevier, 2013. [Google Scholar]
- 2.Belot A, Ranchin B, Fichtner C, Pujo L, Rossier BC, Liutkus A, Morlat C, Nicolino M, Zennaro MC, Cochat P. Pseudohypoaldosteronisms, report on a 10-patient series. Nephrol Dial Transplant 23: 1636–1641, 2008. doi: 10.1093/ndt/gfm862. [DOI] [PubMed] [Google Scholar]
- 3.Hansson JH, Nelson-Williams C, Suzuki H, Schild L, Shimkets R, Lu Y, Canessa C, Iwasaki T, Rossier B, Lifton RP. Hypertension caused by a truncated epithelial sodium channel gamma subunit: genetic heterogeneity of Liddle syndrome. Nat Genet 11: 76–82, 1995. doi: 10.1038/ng0995-76. [DOI] [PubMed] [Google Scholar]
- 4.Hansson JH, Schild L, Lu Y, Wilson TA, Gautschi I, Shimkets R, Nelson-Williams C, Rossier BC, Lifton RP. A de novo missense mutation of the beta subunit of the epithelial sodium channel causes hypertension and Liddle syndrome, identifying a proline-rich segment critical for regulation of channel activity. Proc Natl Acad Sci USA 92: 11495–11499, 1995. doi: 10.1073/pnas.92.25.11495. [DOI] [PMC free article] [PubMed] [Google Scholar]
- 5.Salih M, Gautschi I, van Bemmelen MX, Di Benedetto M, Brooks AS, Lugtenberg D, Schild L, Hoorn EJ. A missense mutation in the extracellular domain of αENaC causes Liddle syndrome. J Am Soc Nephrol 28: 3291–3299, 2017. doi: 10.1681/ASN.2016111163. [DOI] [PMC free article] [PubMed] [Google Scholar]
- 6.Hummler E. Epithelial sodium channel, salt intake, and hypertension. Curr Hypertens Rep 5: 11–18, 2003. doi: 10.1007/s11906-003-0005-1. [DOI] [PubMed] [Google Scholar]
- 7.Pavlov TS, Staruschenko A. Involvement of ENaC in the development of salt-sensitive hypertension. Am J Physiol Renal Physiol 313: F135–F140, 2017. doi: 10.1152/ajprenal.00427.2016. [DOI] [PMC free article] [PubMed] [Google Scholar]
- 8.Pitzer AL, Van Beusecum JP, Kleyman TR, Kirabo A. ENaC in salt-sensitive hypertension: kidney and beyond. Curr Hypertens Rep 22: 69, 2020. doi: 10.1007/s11906-020-01067-9. [DOI] [PMC free article] [PubMed] [Google Scholar]
- 9.Boscardin E, Perrier R, Sergi C, Maillard M, Loffing J, Loffing-Cueni D, Koesters R, Rossier BC, Hummler E. Severe hyperkalemia is rescued by low-potassium diet in renal βENaC-deficient mice. Pflugers Arch 469: 1387–1399, 2017. doi: 10.1007/s00424-017-1990-2. [DOI] [PubMed] [Google Scholar]
- 10.Christensen BM, Perrier R, Wang Q, Zuber AM, Maillard M, Mordasini D, Malsure S, Ronzaud C, Stehle J-C, Rossier BC, Hummler E. Sodium and potassium balance depends on αENaC expression in connecting tubule. J Am Soc Nephrol 21: 1942–1951, 2010. doi: 10.1681/ASN.2009101077. [DOI] [PMC free article] [PubMed] [Google Scholar]
- 11.Malsure S, Wang Q, Charles RP, Sergi C, Perrier R, Christensen BM, Maillard M, Rossier BC, Hummler E. Colon-specific deletion of epithelial sodium channel causes sodium loss and aldosterone resistance. J Am Soc Nephrol 25: 1453–1464, 2014. doi: 10.1681/ASN.2013090936. [DOI] [PMC free article] [PubMed] [Google Scholar]
- 12.Drummond HA, Grifoni SC, Abu-Zaid A, Gousset M, Chiposi R, Barnard JM, Murphey B, Stec DE. Renal inflammation and elevated blood pressure in a mouse model of reduced β-ENaC. Am J Physiol Renal Physiol 301: F443–F449, 2011. doi: 10.1152/ajprenal.00694.2010. [DOI] [PMC free article] [PubMed] [Google Scholar]
- 13.Zhang J, Yuan HK, Chen S, Zhang ZR. Detrimental or beneficial: Role of endothelial ENaC in vascular function. J Cell Physiol. In press. doi: 10.1002/jcp.30505. [DOI] [PubMed] [Google Scholar]
- 14.Drummond HA, Welsh MJ, Abboud FM. ENaC subunits are molecular components of the arterial baroreceptor complex. Ann NY Acad Sci 940: 42–47, 2001. doi: 10.1111/j.1749-6632.2001.tb03665.x. [DOI] [PubMed] [Google Scholar]
- 15.Li YL, Zhang D, Tu H, Muelleman RL. Altered ENaC is associated with aortic baroreceptor dysfunction in chronic heart failure. Am J Hypertens 29: 582–589, 2016. doi: 10.1093/ajh/hpv141. [DOI] [PMC free article] [PubMed] [Google Scholar]
- 16.Barker PM, Nguyen MS, Gatzy JT, Grubb B, Norman H, Hummler E, Rossier B, Boucher RC, Koller B. Role of gamma ENaC subunit in lung liquid clearance and electrolyte balance in newborn mice. Insights into perinatal adaptation and pseudohypoaldosteronism. J Clin Invest 102: 1634–1640, 1998. doi: 10.1172/JCI3971. [DOI] [PMC free article] [PubMed] [Google Scholar]
- 17.Hummler E, Barker P, Gatzy J, Beermann F, Verdumo C, Schmidt A, Boucher R, Rossier BC. Early death due to defective neonatal lung liquid clearance in alpha-ENaC-deficient mice. Nat Genet 12: 325–328, 1996. doi: 10.1038/ng0396-325. [DOI] [PubMed] [Google Scholar]
- 18.McDonald FJ, Yang B, Hrstka RF, Drummond HA, Tarr DE, McCray PB Jr, Stokes JB, Welsh MJ, Williamson RA. Disruption of the beta subunit of the epithelial Na+ channel in mice: hyperkalemia and neonatal death associated with a pseudohypoaldosteronism phenotype. Proc Natl Acad Sci USA. 96: 1727–1731, 1999. doi: 10.1073/pnas.96.4.1727. [DOI] [PMC free article] [PubMed] [Google Scholar]
- 19.Konstas A-A, Korbmacher C. The γ-subunit of ENaC is more important for channel surface expression than the β-subunit. Am J Physiol Cell Physiol 284: C447–C456, 2003. doi: 10.1152/ajpcell.00385.2002. [DOI] [PubMed] [Google Scholar]
- 20.Pham CT, MacIvor DM, Hug BA, Heusel JW, Ley TJ. Long-range disruption of gene expression by a selectable marker cassette. Proc Natl Acad Sci USA 93: 13090–13095, 1996. doi: 10.1073/pnas.93.23.13090. [DOI] [PMC free article] [PubMed] [Google Scholar]
- 21.Taicher GZ, Tinsley FC, Reiderman A, Heiman ML. Quantitative magnetic resonance (QMR) method for bone and whole-body-composition analysis. Anal Bioanal Chem 377: 990–1002, 2003. doi: 10.1007/s00216-003-2224-3. [DOI] [PubMed] [Google Scholar]
- 22.Tinsley FC, Taicher GZ, Heiman ML. Evaluation of a quantitative magnetic resonance method for mouse whole body composition analysis. Obes Res 12: 150–160, 2004. doi: 10.1038/oby.2004.20. [DOI] [PubMed] [Google Scholar]
- 23.Morla L, Shore O, Lynch IJ, Merritt ME, Wingo CS. A noninvasive method to study the evolution of extracellular fluid volume in mice using time-domain nuclear magnetic resonance. Am J Physiol Renal Physiol 319: F115–F124, 2020. doi: 10.1152/ajprenal.00377.2019. [DOI] [PubMed] [Google Scholar]
- 24.Flurkey K, Currer JM, Leiter EH, Witham B. The Jackson Laboratory Handbook on Genetically Standardized Mice (6th ed.). Bar Harbor, ME: Jackson Laboratory, 2009. [Google Scholar]
- 25.Ray EC, Miller RG, Demko JE, Costacou T, Kinlough CL, Demko CL, Unruh ML, Orchard TJ, Kleyman TR. Urinary plasmin(ogen) as a prognostic factor for hypertension. Kidney Int Rep 3: 1434–1442, 2018. doi: 10.1016/j.ekir.2018.06.007. [DOI] [PMC free article] [PubMed] [Google Scholar]
- 26.Unruh ML, Pankratz VS, Demko JE, Ray EC, Hughey RP, Kleyman TR. Trial of amiloride in type 2 diabetes with proteinuria. Kidney Int Rep 2: 893–904, 2017. doi: 10.1016/j.ekir.2017.05.008. [DOI] [PMC free article] [PubMed] [Google Scholar]
- 27.Ray EC, Chen J, Kelly TN, He J, Hamm LL, Gu D, Shimmin LC, Hixson JE, Rao DC, Sheng S, Kleyman TR. Human epithelial Na+ channel missense variants identified in the GenSalt study alter channel activity. Am J Physiol Renal Physiol 311: F908–F914, 2016. doi: 10.1152/ajprenal.00426.2016. [DOI] [PMC free article] [PubMed] [Google Scholar]
- 28.Ray EC, Rondon-Berrios H, Boyd CR, Kleyman TR. Sodium retention and volume expansion in nephrotic syndrome: implications for hypertension. Adv Chronic Kidney Dis 22: 179–184, 2015. doi: 10.1053/j.ackd.2014.11.006. [DOI] [PMC free article] [PubMed] [Google Scholar]
- 29.Kinsman B, Cowles J, Lay J, Simmonds SS, Browning KN, Stocker SD. Osmoregulatory thirst in mice lacking the transient receptor potential vanilloid type 1 (TRPV1) and/or type 4 (TRPV4) receptor. Am J Physiol Regul Integr Comp Physiol 307: R1092–R1100, 2014. doi: 10.1152/ajpregu.00102.2014. [DOI] [PMC free article] [PubMed] [Google Scholar]
- 30.Carrisoza-Gaytan R, Ray EC, Flores D, Marciszyn AL, Wu P, Liu L, Subramanya AR, Wang W, Sheng S, Nkashama LJ, Chen J, Jackson EK, Mutchler SM, Heja S, Kohan DE, Satlin LM, Kleyman TR. Intercalated cell BKα subunit is required for flow-induced K+ secretion. JCI Insight 5: e130553, 2020. doi: 10.1172/jci.insight.130553. [DOI] [PMC free article] [PubMed] [Google Scholar]
- 31.Ray EC, Carrisoza-Gaytan R, Al-Bataineh M, Marciszyn AL, Nkashama LJ, Chen J, Winfrey A, Griffiths S, Lam TR, Flores D, Wu P, Wang W, Huang CL, Subramanya AR, Kleyman TR, Satlin LM. L-WNK1 is required for BK channel activation in intercalated cells. Am J Physiol Renal Physiol 321: F245–F254, 2021. doi: 10.1152/ajprenal.00472.2020. [DOI] [PMC free article] [PubMed] [Google Scholar]
- 32.Soundararajan R, Pearce D, Hughey RP, Kleyman TR. Role of epithelial sodium channels and their regulators in hypertension. J Biol Chem 285: 30363–30369, 2010. doi: 10.1074/jbc.R110.155341. [DOI] [PMC free article] [PubMed] [Google Scholar]
- 33.Ryan MP. Magnesium and potassium-sparing diuretics. Magnesium 5: 282–292, 1986. [PubMed] [Google Scholar]
- 34.Valinsky WC, Touyz RM, Shrier A. Aldosterone, SGK1, and ion channels in the kidney. Clin Sci (Lond) 132: 173–183, 2018. doi: 10.1042/CS20171525. [DOI] [PMC free article] [PubMed] [Google Scholar]
- 35.Pradervand S, Barker PM, Wang Q, Ernst SA, Beermann F, Grubb BR, Burnier M, Schmidt A, Bindels RJ, Gatzy JT, Rossier BC, Hummler E. Salt restriction induces pseudohypoaldosteronism type 1 in mice expressing low levels of the beta-subunit of the amiloride-sensitive epithelial sodium channel. Proc Natl Acad Sci USA 96: 1732–1737, 1999. doi: 10.1073/pnas.96.4.1732. [DOI] [PMC free article] [PubMed] [Google Scholar]
- 36.Tanimoto K, Tamura K, Sugiyama F, Murakami K, Fukamizu A. Isolation of the mouse Ren-1C gene and characterization of renin gene expression in both ES-D3 cells and their parental mouse strain. J Reprod Dev 39: 19–24, 1993. doi: 10.1262/jrd.39.19. [DOI] [Google Scholar]
- 37.Wang Q, Hummler E, Nussberger J, Clément S, Gabbiani G, Brunner HR, Burnier M. Blood pressure, cardiac, and renal responses to salt and deoxycorticosterone acetate in mice: role of renin genes. J Am Soc Nephrol 13: 1509–1516, 2002. doi: 10.1097/01.asn.0000017902.77985.84. [DOI] [PubMed] [Google Scholar]
- 38.Richards J, Jeffers LA, All SC, Cheng KY, Gumz ML. Role of Per1 and the mineralocorticoid receptor in the coordinate regulation of αENaC in renal cortical collecting duct cells. Front Physiol 4: 253, 2013. doi: 10.3389/fphys.2013.00253. [DOI] [PMC free article] [PubMed] [Google Scholar]
- 39.Fagard RH, Thijs L, Staessen JA, Clement DL, De Buyzere ML, De Bacquer DA. Prognostic significance of ambulatory blood pressure in hypertensive patients with history of cardiovascular disease. Blood Press Monit 13: 325–332, 2008. doi: 10.1097/MBP.0b013e32831054f5. [DOI] [PubMed] [Google Scholar]
- 40.Jerrard-Dunne P, Mahmud A, Feely J. Circadian blood pressure variation: relationship between dipper status and measures of arterial stiffness. J Hypertens 25: 1233–1239, 2007. doi: 10.1097/HJH.0b013e3280eec79f. [DOI] [PubMed] [Google Scholar]
- 41.Dumor K, Shoemaker-Moyle M, Nistala R, Whaley-Connell A. Arterial stiffness in hypertension: an update. Curr Hypertens Rep 20: 72, 2018. doi: 10.1007/s11906-018-0867-x. [DOI] [PubMed] [Google Scholar]
- 42.Xiong Y, Aroor AR, Ramirez-Perez FI, Jia G, Habibi J, Manrique-Acevedo C, Lastra G, Chen D, DeMarco VG, Martinez-Lemus LA, Hill MA, Jaisser F, Sowers JR, Whaley-Connell A. Western diet induces renal artery endothelial stiffening that is dependent on the epithelial Na+ channel. Am J Physiol Renal Physiol 318: F1220–F1228, 2020. doi: 10.1152/ajprenal.00517.2019. [DOI] [PMC free article] [PubMed] [Google Scholar]