Abstract
Glucose bio-sensing technologies have received increasing attention in the last few decades, primarily due to the fundamental role that glucose metabolism plays in diseases (e.g., diabetes). Molecularly imprinted polymers (MIPs) could offer an alternative means of analysis to a field that is traditionally dominated by enzyme-based devices, posing superior chemical stability, cost-effectiveness, and ease of fabrication. Their integration into sensing devices as recognition elements has been extensively studied with different readout methods such as quartz-crystal microbalance or impedance spectroscopy. In this work, a dummy imprinting approach is introduced, describing the synthesis and optimization of a MIP toward the sensing of glucose. Integration of this polymer into a thermally conductive receptor layer was achieved by micro-contact deposition. In essence, the MIP particles are pressed into a polyvinyl chloride adhesive layer using a polydimethylsiloxane stamp. The prepared layer is then evaluated with the so-called heat-transfer method, allowing the determination of the specificity and the sensitivity of the receptor layer. Furthermore, the selectivity was assessed by analyzing the thermal response after infusion with increasing concentrations of different saccharide analogues in phosphate-buffered saline (PBS). The obtained results show a linear range of the sensor of 0.0194–0.3300 mM for the detection of glucose in PBS. Finally, a potential application of the sensor was demonstrated by exposing the receptor layer to increasing concentrations of glucose in human urine samples, demonstrating a linear range of 0.0444–0.3300 mM. The results obtained in this paper highlight the applicability of the sensor both in terms of non-invasive glucose monitoring and for the analysis of food samples.
Keywords: molecularly imprinted polymers, glucose sensing, heat-transfer method, non-invasive glucose monitoring, non-enzymatic glucose sensor
Introduction
Glucose is the most abundant monosaccharide in nature and the most used aldohexose in living organisms.1 It is essential in major catabolic cycles, including oxidative phosphorylation and glycolysis for the creation of glycogens, proteins, and lipids.2 The monitoring of glucose in these systems is therefore of great importance as the molecule is a vital cog in the molecular machinery of many processes. Sensors that can deliver a fast, reliable, and cost-effective determination of glucose have therefore gained increasing attention in the past decades. Glucose sensors cover a wide range of possible applications, ranging from diabetes monitoring and food analysis, through to environmental monitoring and medical diagnostics.3−5 Certainly, the most crucial application of glucose sensors is in the diagnosis and monitoring of diabetes mellitus, also known as diabetes. Diabetes is an incurable metabolic disease, characterized by high levels of blood glucose. The initial symptoms often include frequent urination, increased thirst, and blurry vision, and if not treated it could cause many discomforting and life-threatening medical complications.6,7 The number of people with diabetes is increasing tremendously, and the World Health Organization (WHO) estimates 693 million diabetics worldwide by 2045.8 In the United States alone, an increase of 54% from 2015 to 2030 is estimated. This will cause an increase in the total annual cost associated with diabetes by 53% from $407.6 billion in 2016 to more than $622 billion by 2030.9 Therefore, it is of utmost importance to have a simple, fast, and robust sensing device to detect glucose both for the diagnosis and monitoring of diabetes to amortize these costs. Currently, commercial devices are mostly enzymatic-based electrochemical sensors in which the enzyme consists of glucose dehydrogenase or glucose oxidase;10−13 in some devices, these enzymes are coupled with other agents, such as chromogenic agents to obtain colorimetric test strips.14,15 The main limitation of these sensors lies in the low stability derived from the quaternary structure of the folded enzyme.16 Therefore, a lot of attention has been given toward the development of non-enzymatic electrochemical sensors that do not suffer the same drawback.17 Several enzyme-free glucose sensors have been developed in the past decades, with most of them being amperometric and colorimetric sensors.18−21 Even though these non-enzymatic sensors overcame the stability issue, they presented new issues to resolve. The biggest challenges of which concern the mechanism of glucose oxidation on bare platinum surfaces, being innately unselective, leading to the possibility of interacting with multiple saccharides and consequently affecting the quantitative nature of the electrochemical sensors.16 Thus, despite significant developments in the evolution of electrochemical sensors, fully non-invasive, fast, and cheap glucose-monitoring approaches are still required.
One such emerging technology that offers promise to overcome the above-mentioned issues is the use of molecularly imprinted polymers (MIPs) in sensory arrays.22,23 MIPs are synthetic polymer-based smart materials that contain nanocavities capable of selectively binding a molecular target. They are analogous to the natural antibody–antigen system,24−26 though they do not suffer from the same instability in harsh environments. MIPs have received an increasing amount of attention from the scientific community27−32 with their advantages over antibodies and enzymes extending past simple stability and encompassing factors such as simple preparation, low cost, higher physical robustness, resistance to extreme temperature and pressure, and resistance to acids, bases, and organic solvents.33 These benefits increase the list of possible matrices with which analysis can be conducted, whereas with traditional affinity reagents, this would be unfeasible. With this said, another facet that must be considered is the readout technology that the receptor layer is coupled with.
Traditionally electrochemical readout platforms have been associated with the sensing of glucose; however, these methods exploit the electrochemical reaction that occurs when glucose interacts with specific enzymes and antibodies. This electrochemical reaction is absent in a MIP-based sensory platform, and it is therefore a logical step to pair the synthetic receptor with a more compatible readout technology, such as the so-called “heat transfer method” (HTM). The HTM is a novel and innovative thermal sensing readout platform developed over the course of last 10 years.34 The method has received increasing attention in the last few years and has recently been applied in the detection of bacteria and small molecules via the use of surface-imprinted polymers35,36 and MIPs.37−39 In essence, the method is capable of measuring the thermal resistance across a liquid–solid phase boundary, with MIPs being the receptor layer deposited between the two. As a target analyte is introduced in the liquid phase, it binds to the deposited MIPs, changing its thermodynamic properties, leading to a change in the thermal conduction path between the liquid phase and the solid phase (Figure 1). This difference is measured by monitoring the temperature of the liquid phase by means of a thermocouple, while the solid phase is continuously heated to 37 °C and is monitored by a complimentary thermocouple. The overall change in the recorded temperature in the liquid phase is observed as increasing concentrations of the analyte are introduced to the receptor layer, thus building a relationship between the increasing thermal resistance of the receptor layer and the concentration of the target present (eq 1).
| 1 |
Figure 1.
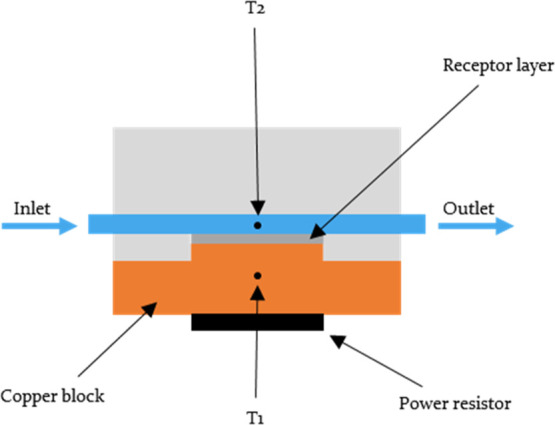
Schematic illustration of the setup used during HTM analysis.
The following research therefore sets out to demonstrate how a MIP-based sensor coupled with the HTM can be utilized in the sensing of glucose and how its application can be extended to physiological samples, such as urine.
With this said, a consideration must be made when synthesizing a MIP capable of binding glucose. The absence of a functional group in the glucose molecule that is able to form a strong ionic interaction with monomers containing an acidic or basic functionality makes the direct imprinting of glucose a tricky task; therefore, a dummy imprinting approach is favored. Glucuronic acid (GA) was selected as the functionalized dummy template and acrylamide (AAM) as a functional monomer. This approach allows the formation of an ionic bond between the −COOH and the −NH2 moieties present in the structures of the dummy template and the functional monomer (Figure 2) and would therefore allow stronger interactions than those possible between glucose and AAM. Liquid chromatography–mass spectrometry (LC–MS) was then used to demonstrate the binding capabilities of the dummy imprinted polymer to glucose. Furthermore, by varying the ratios of the template–monomer–cross-linker, it was possible to identify the best composition in terms of the imprinting efficiency by comparing the MIP with its corresponding non-imprinted polymer (NIP). Once the best composition was obtained, the MIP particles were immobilized on a polyvinylchloride (PVC) layer and deposited on an aluminum substrate to obtain a thermally conductive receptor layer that could be extensively analyzed with the HTM. The analysis demonstrated the efficiency and reproducibility of the MIP-based platform for the detection of glucose. The selectivity of the receptor layer was then determined by analyzing the response of the sensor to different carbohydrates and comparing the obtained dose–response curves with those obtained for glucose. Furthermore, the response of the receptor layer to urine samples containing known concentrations of glucose was evaluated. The resulting limit-of-detection (LoD) and linear range for glucose were compared with the physiological concentrations of the molecule in urine, evaluating then the applicability of the sensor in glucose monitoring both for medical diagnostics and food analysis.
Figure 2.
Chemical structures of glucose, glucuronic acid, and AAM.
Materials and Methods
Chemicals and Reagents
Prior to the polymerization, stabilizers were removed from the functional and crosslinking monomers by passing the reagents over a column packed with aluminum oxide. Acrylamide (≥99%), ethylene glycol dimethacrylate (98%), 2,2′-azobis(2-methylpropionitrile) (98%), tetrahydrofuran (≥99.9%), dimethyl sulfoxide (≥99.9%), acetic acid (≥99%), d-fructose (≥99%), d-lactose monohydrate (≥99.5%), and sucrose (≥99.5%) were supplied by Sigma-Aldrich. d-Glucuronic acid (98%) and methanol (≥99%) were supplied by Fisher Scientific. d-Glucose (≥98%) was purchased from TCI Chemicals. All solutions were prepared with deionized water with a resistivity of 18.1 MΩ cm–1 or with phosphate-buffered saline (PBS) solutions. Polydimethylsiloxane (PDMS) stamps were made with a Sylgard 184 elastomer kit obtained from Mavom N.V. (Schelle, Belgium). Aluminum chips were supplied by Brico NV (Korbeek-Lo, Belgium) and cut to the desired dimensions (1 × 1 cm). Medi-Test Glucose test strips for the rapid detection of glucose in urine were purchased from VWR International.
Synthesis of Dummy MIPs
Dummy MIPs were synthesized accordingly to a previously described procedure.40,41 In essence, functional monomer (AAM, 2 mmol, 142 mg), template (d-glucuronic acid, 0.25 mmol, 48.5 mg), crosslinker (EGDMA, 3 mmol, 566 μL), and thermal initiator (AIBN, 0.25 mmol, 40 mg) were dissolved in 3 mL of dimethyl sulfoxide (DMSO). The mixture was then purged with N2 to remove any oxygen from the mixture before the initiation of polymerization. The polymerization was carried out at 65 °C for 10 h to allow the polymerization to be fully completed. The obtained monolithic bulk MIP was then mechanically ground, before washing with methanol to remove any unreacted components. Once extracted, the MIP particles were placed in a vial and dried in an oven overnight at 65 °C. The dried particles were then milled four times using a Fritsch Planetary Micro Mill Pulverisette7 premium line (300 rpm, 5 min, 10 mm balls). After milling, the particles were sieved at a 1.0 mm amplitude using a Fritsch Analysette 3 until a sufficient amount of the polymer was in the collection plate to achieve microparticles with sizes smaller than 100 μm. Finally, the template molecule (GA) was removed from the MIP by continuous Soxhlet extraction with a 1:6 mixture of acetic acid and methanol for 16 h, followed by another Soxhlet extraction with pure methanol for 16 h, and particles were then dried overnight at 65 °C. A reference NIP was prepared in parallel following the same procedure.
Thermal Gravimetric Aanalysis and Fourier Transform Infrared Analysis
The removal of the template from the MIP was determined through thermal gravimetric analysis (TGA) using a TA Instruments TGA 550 Auto Advanced. Measurements were performed under a nitrogen atmosphere at a heating rate of 10 °C/min. For each measurement, 2.5–4 mg of the polymer sample was used. The amount of polymers used for each measurement was between 2.5 and 4 mg. Further confirmation of template removal was conducted with an IR-Affinity-1S Fourier transform infrared (FTIR) spectrometer (Shimadzu Corp., Kyoto, Japan) coupled to an attenuated total reflectance (ATR) crystal, comparing the spectra of extracted, non-extracted, and GA samples. The instrument was set up to run 32 scans per measurement with a spectral resolution of 4 cm–1. The IR spectra were recorded between 4000 and 400 cm–1. The ATR crystal was cleaned with ethanol 70% v/v and acetone before starting the measurement for each new sample. A background spectrum was taken before measuring every new sample to account for environmental changes.
Batch Rebinding Experiments
Rebinding experiments were conducted as follows: 20 mg of MIP/NIP particles was incubated with 5 mL solutions of glucose in deionized water with concentrations ranging from 0.055 to 0.55 mM. The samples were then placed on a rocking table at 125 rpm for 90 min, before removing them and allowing the particles to settle. The resulting settled suspensions were filtered, and the filtrate was collected. The remaining free concentration of the target (Cf) in solution was then determined by LC–MS analysis. To enable these values to be calculated, a calibration graph for glucose was first generated by analyzing the peak areas of the chromatogram at 198.09 m/z [M + NH4]+ for each of the concentrations.
LCMS Analysis
The LC–MS system is composed of the following parts: a NEXERA ultra high performance liquid chromatography system, equipped with a Shimadzu LC-30AD solvent delivery unit, a Shimadzu CT-20AC column oven (max. column length 300 mm), an SPD-M30A photodiode array detector, and a single quadrupole mass spectrometer (LCMS 2020). The MS used a dual ionization source consisting of both electron spray ionization (ESI) and atmospheric pressure chemical ionization. The short column used was a Waters XSelect CSH C18 3 mm × 30 mm with a particle size of 3.5 μm operating at 30 °C. Solvent gradient 5% acetonitrile in water followed by a gradient to 95% acetonitrile in water and flushing of the column at 95% water. Both solvents were modified with 0.1% ammonium acetate. The obtained data was analyzed using a MestReNova Software version 12.0.0.
Deposition of Dummy MIP Particles by Micro-contact Stamping
Aluminum plates were polished and cut to obtain the desired dimensions (1 × 1 × 0.5 cm2). To immobilize MIP particles, a PVC adhesive layer (0.4 wt % PVC dissolved in tetrahydrofuran) was deposited on the aluminum chip by spin coating (2000 rpm for 60 s with an acceleration of 1000 rpm s–1). To stamp the particles on the PVC layer, a PDMS substrate, covered with a monolayer of MIP particles, was used. The PVC layer was heated for 2 h at a temperature above its glass transition temperature (100 °C), allowing the beads to sink into the polymer layer. The samples were cooled down prior to thermal measurements, and any unbound particles were washed off with distilled water. In this way, planar sensor electrodes were created in a very straightforward and low-cost manner. This is necessary because although reusing MIPs is possible, it would require regenerating the binding sites in the nanocavities by rigorous washing. This is not desirable so the design needs to be as low cost as possible to enable their use as disposable electrodes.
Sensing Setup
The thermal detection platform is described thoroughly in previous work.42−44 Functionalized chips were pressed mechanically with their backside onto a copper block serving as a heat provider. The temperature of the copper underneath the sample, T1, was monitored by a K-type thermocouple (TC Direct). This information was fed into a temperature control unit that stringently controlled T1 by modifying the voltage over the power resistor (Farnell, Utrecht, The Netherlands) that heats the copper, using a software-based (Labview, National Instruments, Austin, TX, United States) proportional-integral-derivative (PID) controller (P = 10, I = 8, D = 0). The functionalized side of the chip faced a polyether ether ketone (PEEK) flow cell, which was sealed with an O-ring to avoid leakage, defining a contact area of 28 mm2 and an inner volume of 110 μL. The flow cell is connected to a tubing system, allowing the exchange of liquids in a controlled and automated fashion by means of a syringe pump. Every injection of the tested analytes was performed using a flowrate of 0.250 mL/min for 5 min. The temperature of the liquid inside the flow cell, T2, was measured by a second thermocouple placed 1 mm above the chip. For each rebinding measurement, the signal was stabilized in PBS that was used as a background solvent for the measurements. The concentration of the target or analogue inside the flow was gradually increased (0.055–0.33 mM). The signal was allowed to stabilize for 20 min between subsequent additions. Data was analyzed by monitoring the decrease in T2 after each addition (heat-transfer method or HTM) while maintaining T1 at a constant 37.00 °C. This process was repeated for each of the following compounds using the above-mentioned concentrations: glucose, fructose, sucrose, and lactose, alongside the reference NIP.
Glucose Detection in Urine Samples with the HTM
Human urine samples were collected from a healthy individual and tested with a commercially available glucose-urine test. The absence of glucose in the collected samples was confirmed using Medi-Test Glucose urine test strips. Afterward, the urine samples were spiked with increasing concentrations of glucose (0.055–0.33), and the obtained dilution series was then used for HTM analysis using the same sensing setup previously reported for both the analysis of the MIP/NIP.
Results and Discussion
Template Removal Confirmation
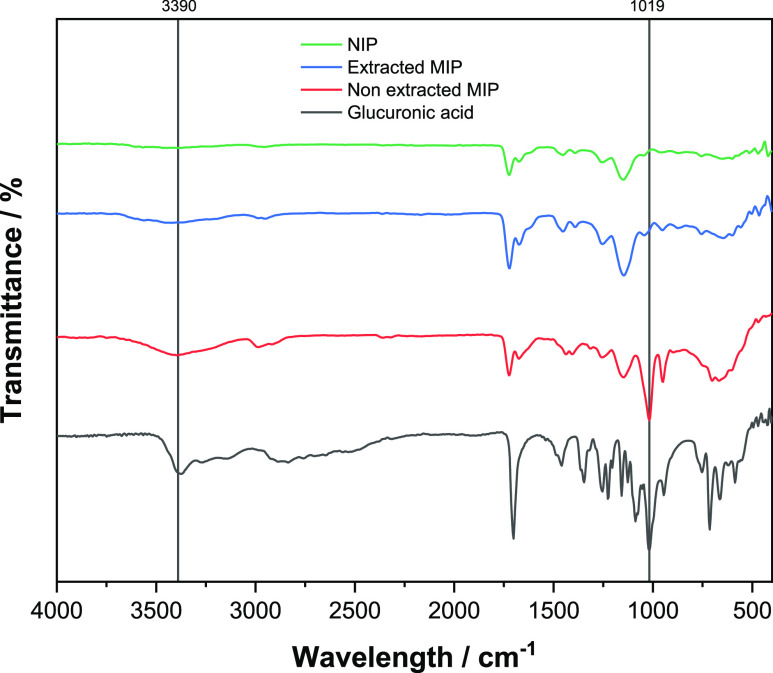
One of the critical steps in the preparation of MIPs is the template removal.45 If any template molecules remain in the MIP network, less cavities will be available for the rebinding and therefore the rebinding capacity of the polymer will be inevitably affected. To ensure complete template removal from the synthesized MIP, TGA and FTIR analysis of non-extracted MIPs, extracted MIPs, and NIPs were performed. In the FTIR spectrum (Figure 3), the distinctive peak of GA (black line) at 3300–3500 cm–1 (OH stretch) and the bands between 1050 and 950 cm–1 attributed to a combination of CO stretching and OH bending can be clearly observed. These are considered as the characteristic peaks of carbohydrates.46,47 It can be clearly noticed that these peaks are not present in the NIP and extracted MIP spectra (green and blue lines) but instead present in the non-extracted MIP (red line).
Figure 3.
FT-IR analysis of the NIP, extracted MIP, non-extracted MIP, and GA.
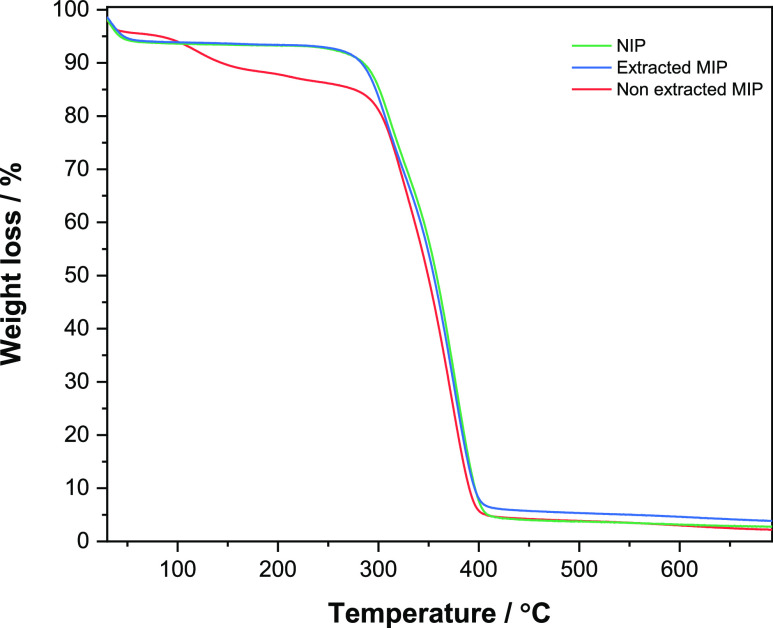
To further confirm the successful extraction of the template from the MIP, TGA analysis was performed (Figure 4). The TGA results show almost identical behavior of the extracted MIP and NIP, where the degradation starts to take place at around 280 °C. On the other hand, a significant weight loss can be noticed in the non-extracted MIP starting from 110 °C, indicating the presence of GA in the polymer before extraction.
Figure 4.
TGA analysis of the NIP, extracted MIP, and non-extracted MIP.
Considering the FTIR and TGA results, it can be said with confidence that there is no significant presence of GA in the polymer after continuous Soxhlet extraction.
Glucose Binding Analysis via LC–MS
In order to identify the best composition for the binding of glucose, four different ratios of the template/monomer/crosslinker were synthesized and tested (Table 1). The compositions tested were based on the common ratios of the components found in the literature using AAM as a functional monomer, EGDMA as a cross-linker, and DMSO as a porogenic solvent.
Table 1. Synthesized MIP/NIP Compositions.
| MIP/NIP | GA (mg) | AAM (equiv) | EGDMA (equiv) | AIBN (mg) | Solv. | T (°C) |
|---|---|---|---|---|---|---|
| MIP1 | 48.5 | 6 | 12 | 40 | DMSO | 65 |
| NIP1 | 6 | 12 | 40 | DMSO | 65 | |
| MIP2 | 48.5 | 8 | 12 | 40 | DMSO | 65 |
| NIP2 | 8 | 12 | 40 | DMSO | 65 | |
| MIP3 | 48.5 | 6 | 16 | 40 | DMSO | 65 |
| NIP3 | 6 | 16 | 40 | DMSO | 65 | |
| MIP4 | 48.5 | 8 | 16 | 40 | DMSO | 65 |
| NIP4 | 8 | 16 | 40 | DMSO | 65 |
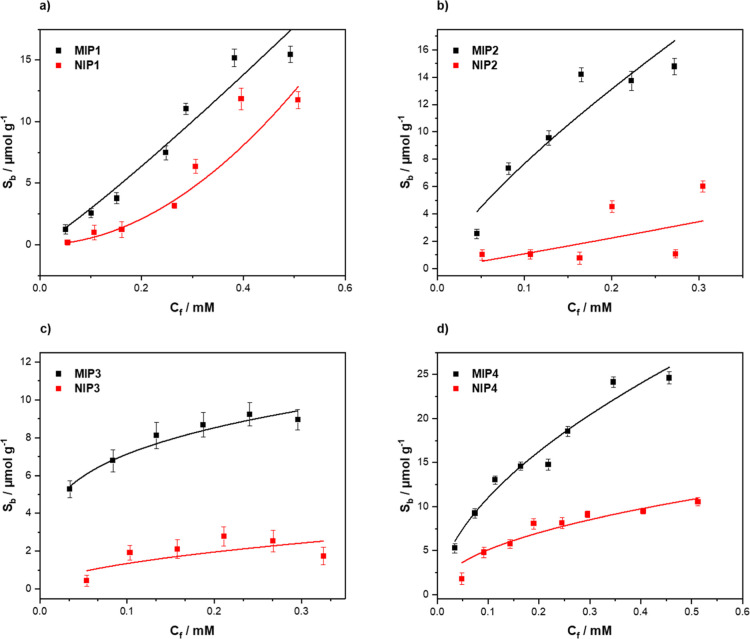
For each composition, a corresponding binding isotherm was generated by analyzing the free concentration of glucose found in solution, Cf (mM) from the batch rebinding experiments. These values were then used to extrapolate the corresponding substrate bound (Sb) (μmol g–1) values, which indicate the number of moles of glucose bound per gram of the polymer at each data point,48 thus enabling the obtained Sb to be plotted against Cf. The data were fit with Origin, version 2019b (OriginLabs Corporation, Northampton, MA, USA) using an allometric (y = axb) fit. All MIPs (black squares) were plotted alongside their corresponding NIP (red squares) (Figure 5). Of the compositions analyzed, MIP/NIP-03 presented the lowest overall maximum binding capacities of 9.26 μmol g–1 for the MIP and 2.37 μmol g–1 for the NIP (Figure 5c), thus demonstrating that with the higher concentration of the cross-linker and a lower amount of the functional monomer, the amount of cavities generated within the material was less when compared to the other compositions. MIP-01 (Figure 5a) and MIP-02 (Figure 5b) demonstrated similar binding capacities of 15.29 and 15.59 μmol g–1, respectively. Though the values for these MIPs are similar, the values for their corresponding NIPs are not similar, with NIP-01 showing a maximum binding capacity of 12.41 μmol g–1 and NIP-02 a maximum binding capacity of 4.28 μmol g–1. It can therefore be stipulated that the higher amount of the functional monomer in MIP-02 generates binding sites with higher affinity than the non-specific interactions observed in its corresponding MIP. The lower concentration of the functional monomer (MIP-01) demonstrates a less specific nature as MIP-01 demonstrates a similar maximum binding capacity to that of its NIP.
Figure 5.
Rebinding analysis with LC–MS of (a) MIP/NIP1, (b) MIP/NIP2, (c) MIP/NIP3, and (d) MIP/NIP4.
This therefore indicates that a certain threshold of the functional monomer is required to generate more specific molecular recognition. The reverse of this trend can be witnessed within MIP-03 and MIP-04, though the cross-linker concentrations within these MIPs are higher than those with MIP-01 and MIP-02, thus indicating that the amount of the cross-linker present also affects the amount of specific binding observed between the MIP/NIP. MIP-04 has the highest of all the observed maximum binding capacities with a value of 25.39 μmol g–1 and a corresponding NIP value of 10.88 μmol g–1 (Figure 4d). To complement these values and to place a metric upon the amount of specific binding per MIP/NIP, the imprint factor (IF) was calculated for each formulation. The IF value is defined as the amount of Sb at a defined Cf for the MIP devised by the Sb value of the NIP at the same Cf value. The Cf value for this calculate tends toward the lower ends as these values tend to be unaffected by the saturation effects when higher concentrations of the analyte are present. With this in mind, Cf = 0.2 mM was selected to calculate the IF values for each of the MIPs. These values were calculated directly from the fitted binding isotherms and are reported in Table 2. Of the compositions analyzed, it is unsurprising that MIP/NIP-01 has the lowest specific binding toward glucose with an IF value of 2.12. The difference between the binding observed with the MIP/NIP is too similar, with this visually apparent lack of difference being reinforced by the calculated metric. It is however surprising that MIP/NIP-04 has a lower associated IF value when comparing the visually inspected graph. MIP-02 and MIP-03 were calculated to have similar IF values, with MIP-02 demonstrating to be the more specific of the two with an IF value of 5.18 when compared to an MIP-03 value of 4.15. Again, these values are clearly a direct result of the amount of the cross-linker and monomer used in the synthesis of the MIP/NIP. MIP-02 has a higher concentration of the monomer compared to the cross-linker, enabling a higher degree of specific binding due to the higher degree of interactions possible between the monomer and template. The same trend can be seen between the MIP-01 and MIP-04, with MIP-04 having the higher amount of a functional monomer and subsequently slightly higher IF values in comparison. Overall, when considering both the maximum binding capacity and the associated IF values of each MIP, it is clear that the MIP that should be used in further experimentation is MIP-02. MIP-02 has a respectable maximum binding capacity while also retaining a higher IF when compared to the other compositions.
Table 2. Synthesized MIP/NIP Compositions.
| MIP/NIP | R2 | Sb/μmol g–1 (at Cf = 0.2 mM) | IF (at Cf = 0.2 mM) |
|---|---|---|---|
| 1 | 0.9457 | MIP: 6.54 | 2.12 |
| 0.9058 | NIP: 3.08 | ||
| 2 | 0.8783 | MIP: 13.05 | 5.18 |
| 0.3874 | NIP: 2.52 | ||
| 3 | 0.9503 | MIP: 8.6 | 4.15 |
| 0.4508 | NIP: 2.07 | ||
| 4 | 0.9602 | MIP: 16.09 | 2.29 |
| 0.906 | NIP: 7.03 |
Rebinding Analysis via the HTM
After depositing the MIP/NIPs on aluminum chips that were spin coated with a thin layer of PVC (Figure 6), the functionalized surfaces were subjected to HTM analysis.
Figure 6.
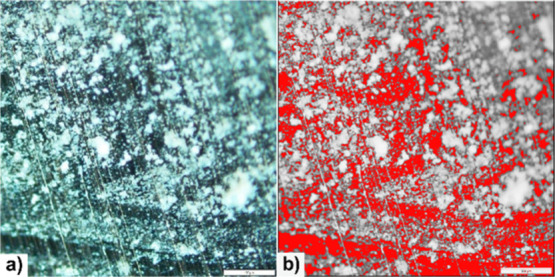
(a) Microscopy analysis of aluminum chips with deposited MIP particles. (b) Highlighted background in red showing a substrate without particles. Image was taken at 20× magnification.
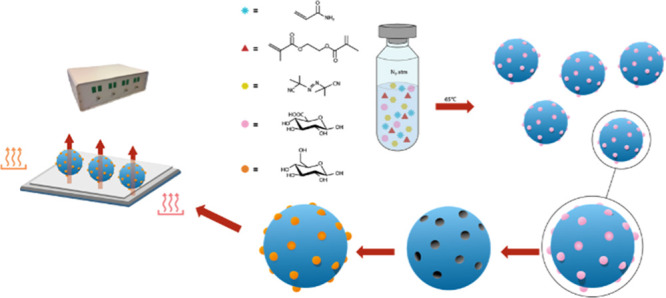
In doing so, each of the functionalized surfaces was exposed to increasing concentrations of glucose (0.00–0.33 mM) over a defined time frame (Figure 7). The measurements were conducted in PBS (pH = 7.4) with a stabilization temperature of 37 °C so as to imitate the physiological conditions and to ensure that the conducted measurements were relatable to the potential real-world samples.
Figure 7.
Schematic representation of the deposition of the MIP particles and rebinding analysis with the HTM.
The analysis of both MIPs and NIPs was conducted in the exact same manner to enable the direct comparison of substrates functionalized with both kinds of receptors. During the analysis, it can be clearly seen that the temperature inside the flow cell decreases when a higher concentration of glucose is introduced in the flow cell with the MIP particles (Figure 8a, black line). This behavior is characteristic of an analyte that is binding to the MIP, as binding events at the surface of the receptor typically lead to an increased thermal resistance at the solid–liquid interface, which impedes the flow of heat to the solution inside the flow cell. In comparison, the same behavior is not observed during the analysis of the NIP (Figure 8a, red line), though there is a negligible decrease inside the flow cell when a high concentration of glucose is present. This decrease, however, is primarily due to the non-specific binding interactions that the glucose can have with any surface functionalities present in the NIP. The change in the temperature inside the flow cell can also be represented as a change in thermal resistance at the liquid-phase interface. The time-resolved thermal resistance data (Rth) of the MIP (black line) show that the decrease in temperature observed in Figure 8a can indeed be attributed to an increase in thermal resistance caused by glucose binding to the MIP particles (Figure 8b). When Rth is calculated for the NIP (red line), it is clear that the NIP does not behave in the same manner as the MIP and the thermal resistance of the receptor does not change much over the entire tested concentration range. These results are comparable with the ones presented in previous works where other biomolecules (vitamin k and other small molecules such as histamine, nicotine, and serotonin) were analyzed with the same thermal readout setup.42,49
Figure 8.
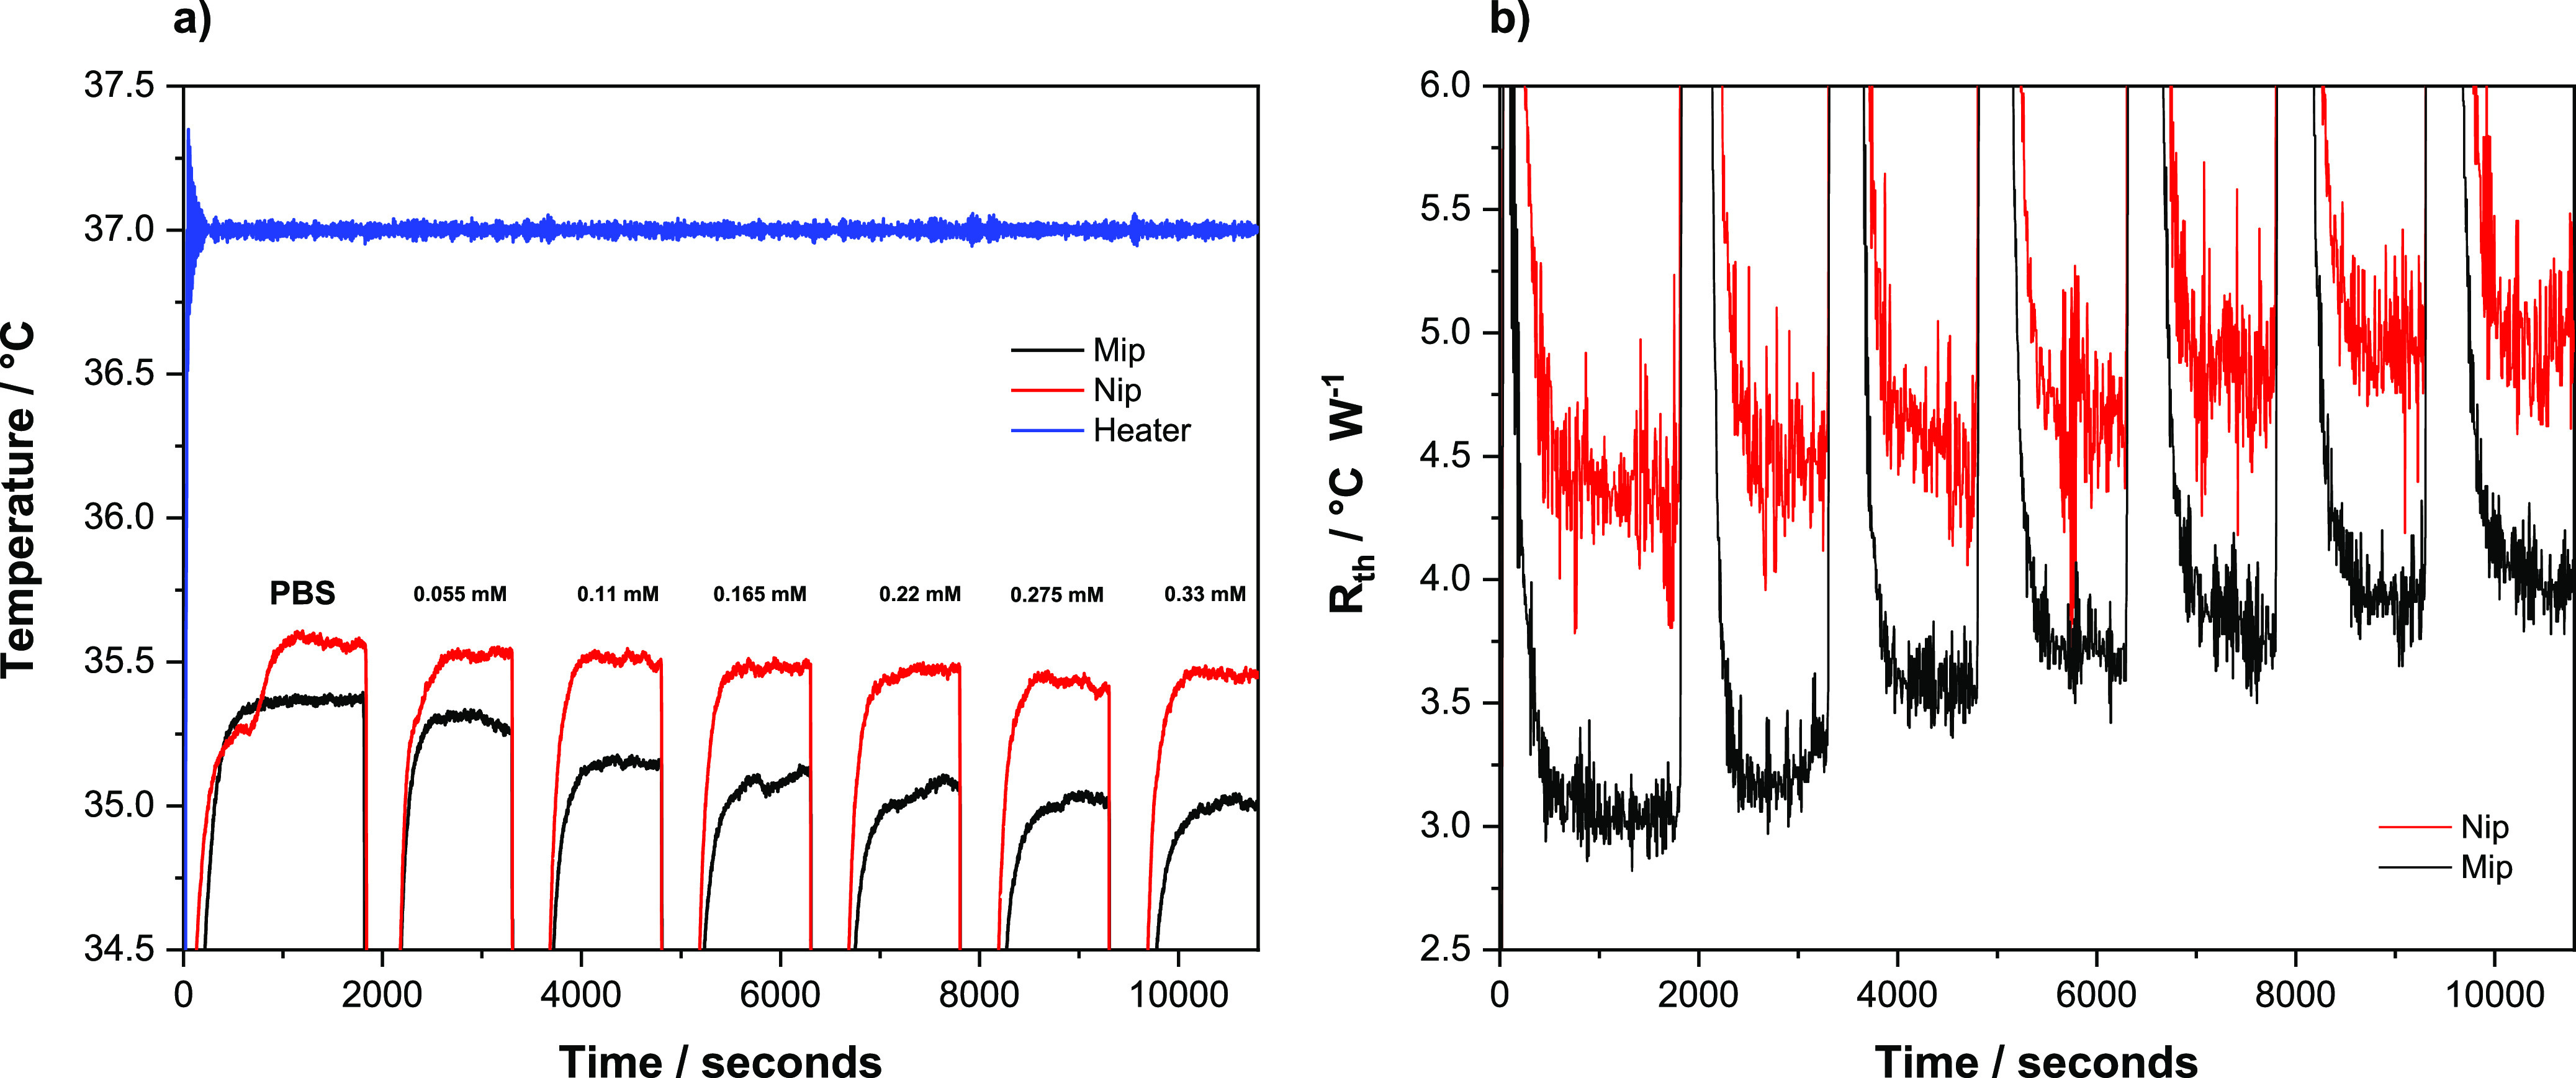
(a) Temperature profile and (b) Rth variations of the MIP/NIP after infusions with varying concentrations of glucose (0.00–0.33 mM) in PBS.
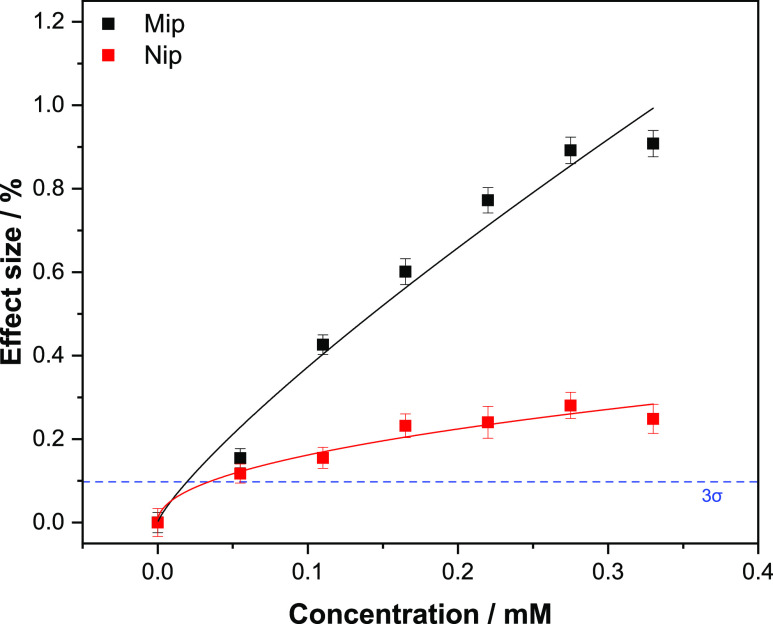
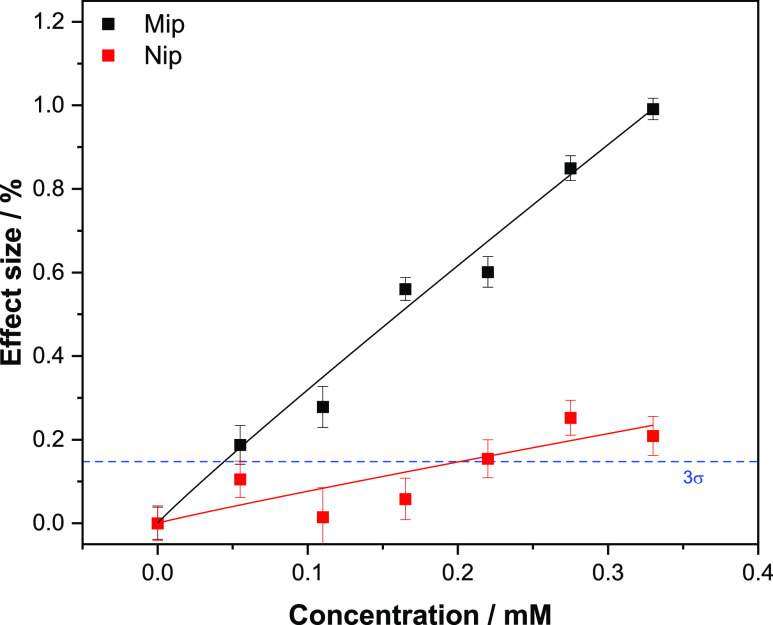
The time-resolved temperature profiles for the MIP and NIP were used to construct dose–response curves, plotting the effect size as a function of the change in temperature against the concentration of glucose introduced into the flow cell (Figure 9).
Figure 9.
Dose–response curve obtained by HTM analysis of the MIP/NIP after infusions of different concentrations of glucose, the blue dashed line reveals the LoD (3σ method) at ± 19.4 μM. Error bars and mean values are calculated using the noise of the signal and are the average of multiple measurements.
The effect size (%) was obtained by dividing the decrease in temperature at each concentration by the average baseline temperature obtained after stabilization in PBS (eq 2).
| 2 |
The data was fit with Origin, version 2019b (OriginLabs Corporation, Northampton, MA, USA) using an allometric (y = axb) fit for both the MIP (black curve, R2 = 0.9593) and NIP (red curve, R2 = 0.89887).
The LoD was calculated from the dose–response curve of the MIP (blue dashed line) using the 3σ method, corresponding to three times the maximum y-axis noise on the signal throughout the measurement. The reason for taking the error on the measurement signal (intra-sample variability) rather than the standard error on the average of three measurements (inter-sample variability) is that the former is bigger than the latter. While this shows the sensitivity limitations of the low-cost readout technology, it also demonstrates that the electrode production process is highly reproducible and leads to a high degree of repeatability in the resulting sensor platform.35−40 This y-value was then plotted and its intercept with the black curve was the calculated LoD for the sensor being 19.4 μM. The calculated intercept for the LoD (19.4 μM) is greater than the curve plotted for the NIP data, demonstrating that the sensor is capable of detecting concentrations of glucose that bind specifically. Therefore, this adds a degree of reliability to the sensor as it is able to differentiate between non-specifically bound and specifically bound glucose. The sensor demonstrates the saturation effects toward the higher concentrations (above 0.25 mM) and seems to plateau as the concentration tends toward 0.33 mM. The reference NIP is shown to saturate at much lower concentrations (0.2 mM) and has an observably lower effect size in comparison to the MIP.
Selectivity Analysis of the Receptor Layer
To demonstrate the selectivity of the optimized MIP toward glucose, further HTM analysis was conducted. The same experimental parameters and procedures as per the glucose rebinding analysis with the HTM readout were used for the analysis of the analogues. The tested competitive analytes were selected based on the chemical structure (Figure S1) and function in the body, therefore a monosaccharide (fructose) and two disaccharides (sucrose and lactose) were tested, and the binding response was analyzed. To this end, fructose was analyzed due to its similarity with glucose, though it is important to notice that despite having the same chemical formula (C6H12O6), they differ structurally. To further determine the selectivity of the sensor, sucrose and lactose were analyzed. Both molecules are composed by two monosaccharide units, one of them being glucose and the second one being fructose and galactose, respectively. In order to observe a direct comparison between glucose and the other tested analytes, the same concentration ranges previously analyzed (0.055–0.33 mM) were applied, and the thermal response was then transformed directly into an effect size (%) as previously described (eq 2).
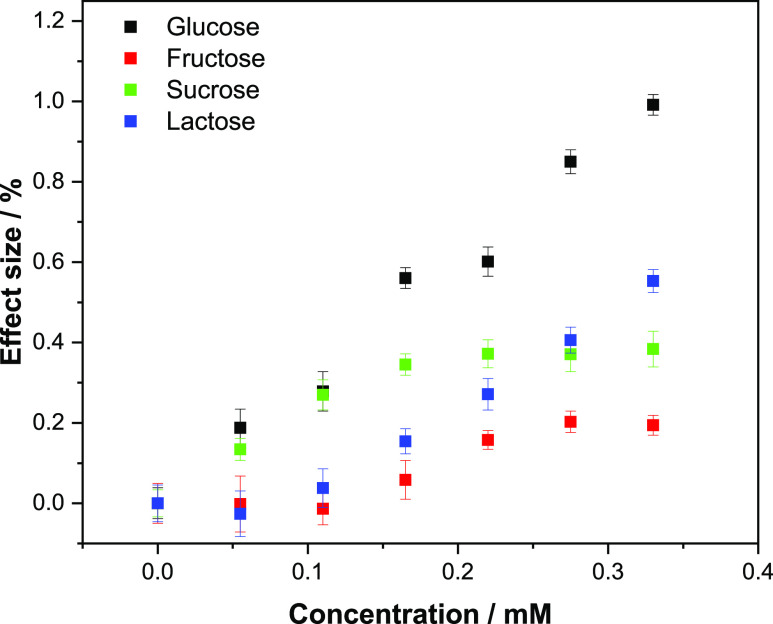
The effect sizes were then plotted against the concentration for each analyte, and the different dose–response curves for MIPs (Figure 10a) and NIPs (Figure 10b) were obtained. Overall, none of the tested analytes demonstrated a higher binding affinity than glucose toward the MIP (Figure 10a). This difference was apparent from a Cf of 0.05 mM, where there is a clear differential between glucose and the other molecules. The difference in effect size is then seen to increase as the concentration of the analyte in solution does, demonstrating a higher selectivity toward glucose at higher concentrations. This said, when analyzing samples at the lower Cf range, the analogues still have the potential to interfere with the sensor as they interact with the sensor in the LoD range. For medical diagnostics, this is not a problem as the physiological concentrations encountered are typically higher but it might limit the use of the sensor in industrial applications such as monitoring fermentation processes in large bioreactors. When analyzing the NIP data, the analogues demonstrate a similar affinity to that of glucose. Of the compounds tested, lactose is the most similar to glucose with the signal being barely differentiable. This highlights the non-specific interactions between the NIP and the other analogues, though as with glucose an IF value can be calculated for each of the compounds (Table 3).
Figure 10.
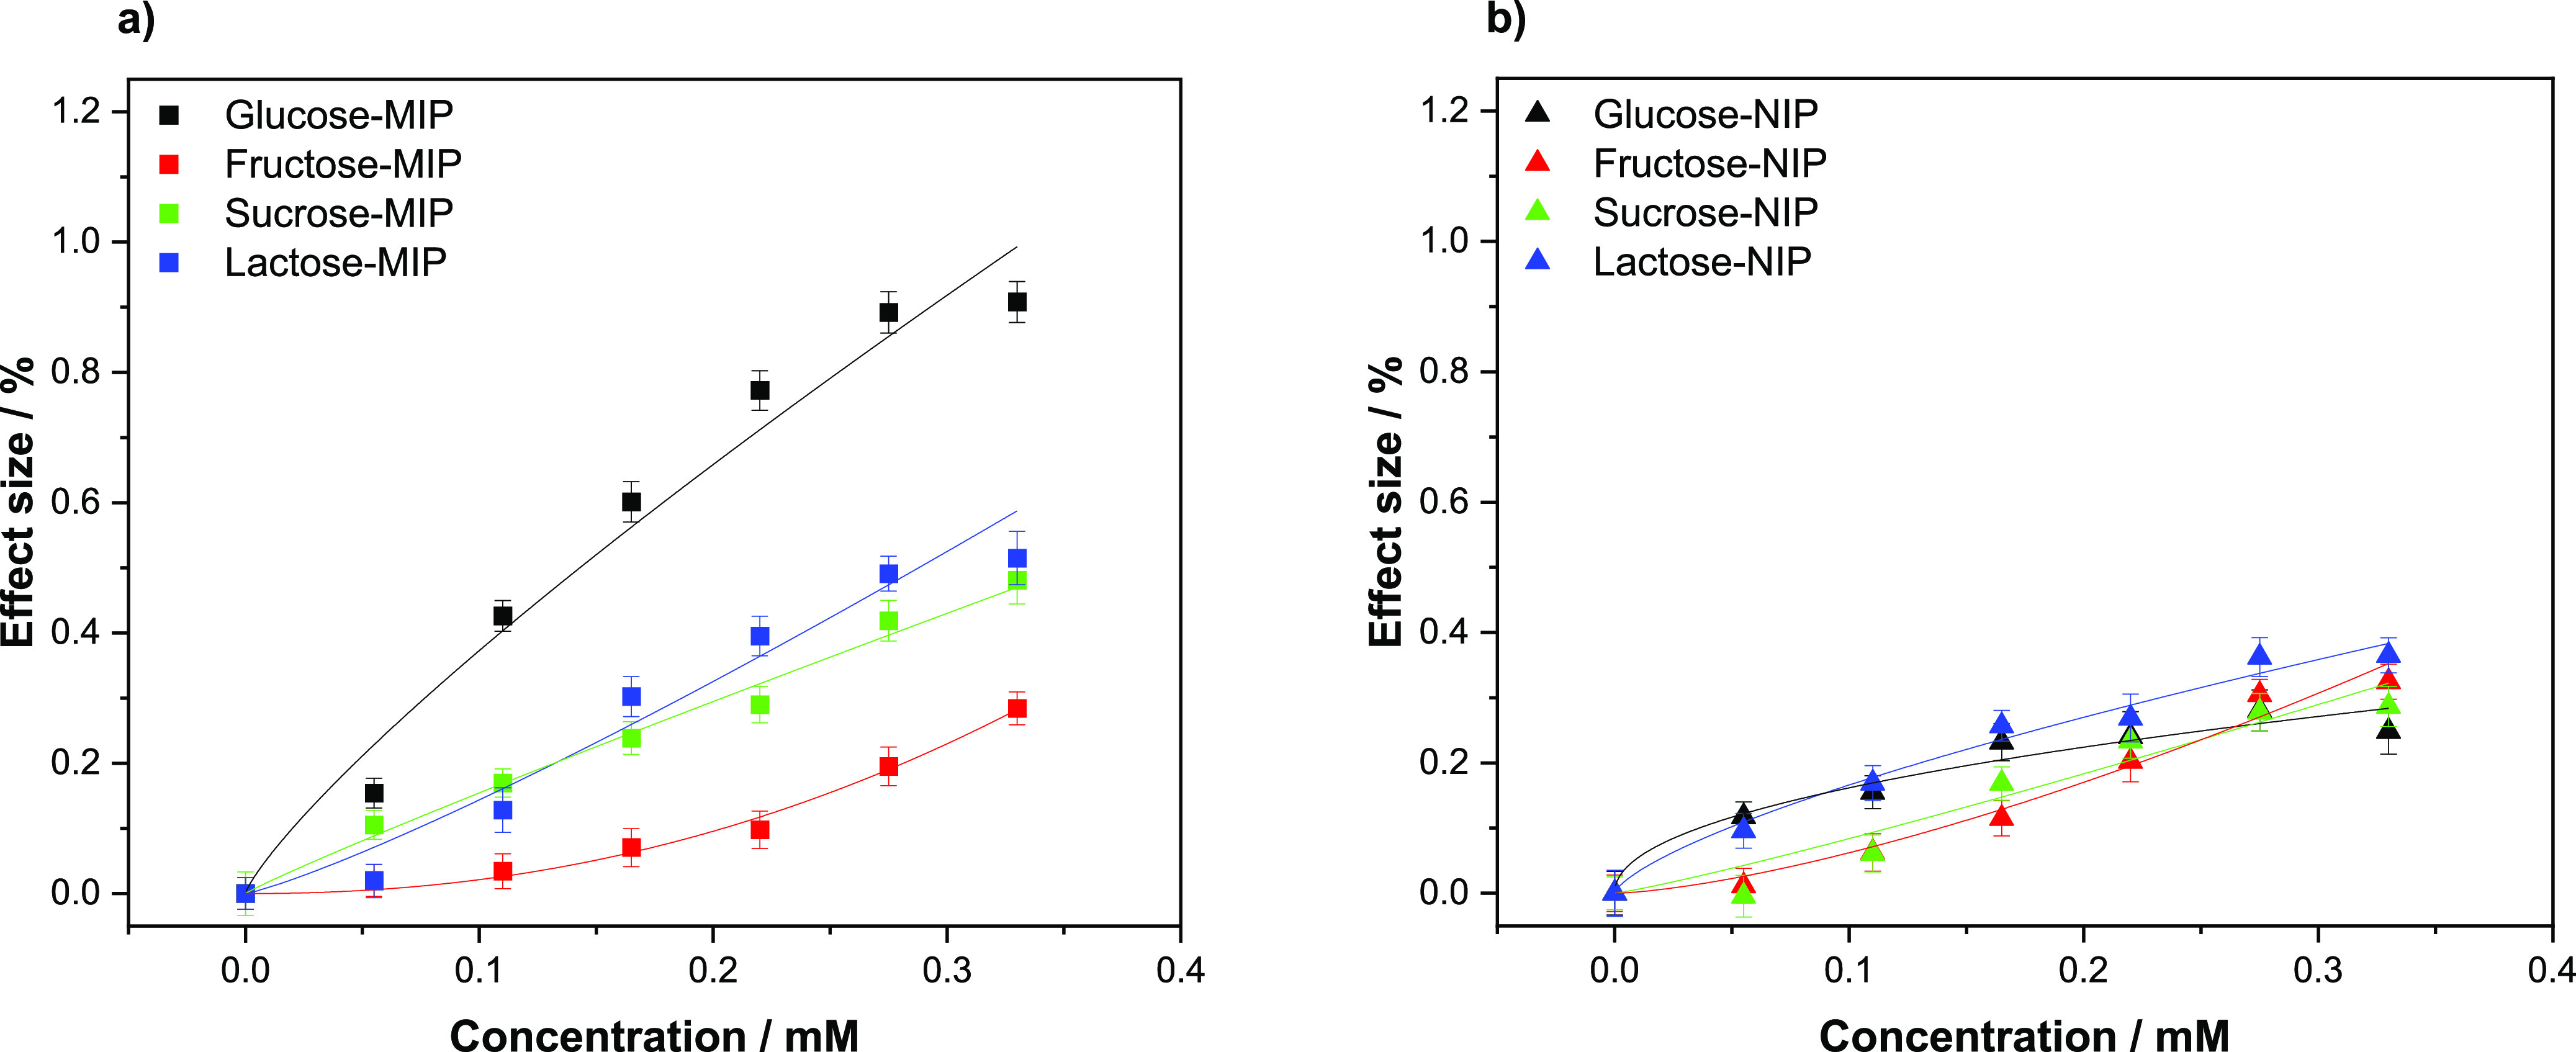
(a) HTM analysis of compounds (glucose, fructose, sucrose, and lactose) introduced inside the flow cell and infused at increasing concentrations in PBS (0.00–0.33 mM) and their corresponding dose–response curves for (a) MIPs and (b) NIPs. Error bars and mean values are calculated using the noise of the signal and are the average of multiple measurements.
Table 3. IF Values of the Tested Analytes at Cf = 0.2 mM.
| analyte | IF (Cf = 0.2 mM) |
|---|---|
| glucose | 2.95 |
| sucrose | 1.60 |
| lactose | 1.22 |
| fructose | 0.56 |
It should be noted that the disaccharides containing one glucose unit in their structure (sucrose and lactose) have a higher affinity for the MIP when comparing the IF of these with the one of fructose. Since the nanocavities present in the polymer are specifically made to fit a GA (and therefore glucose) unit, the response shown for sucrose and lactose is attributed to the presence of the glucose unit.
Application of the MIP Sensor for the Determination of Glucose Levels in Human Urine Samples
The applicability of the sensor for medical diagnostics was illustrated in this experiment, in which the sensor’s ability to determine the glucose levels in urine samples was assessed. The same experimental parameters and procedures as per the analysis conducted in PBS were used for the analysis of glucose levels in human urine samples. To this end, urine samples were collected from a healthy volunteer and analyzed with a commercial enzyme-based colorimetric glucose detection kit in order to confirm the absence of glucose in the collected urine samples (Figure S2). In order to show a direct comparison between the thermal response obtained in PBS and the one obtained in urine samples, the urine samples were spiked with the same concentration of glucose (0.055–0.33 mM) previously analyzed. Dose–response curves for both the MIP and NIP were obtained by plotting the effect size as a function of the change in temperature against the concentration of glucose in urine introduced in the flow cell (Figure 11). The effect of size (%) was calculated in the same manner using the previously reported equation (eq 2). The data was fit with Origin, version 2019b (OriginLabs Corporation, Northampton, MA, USA) using an allometric (y = axb) fit for both the MIP (black curve, R2 = 0.9753) and NIP (red curve, R2 = 0.5756). The LoD was calculated using the same method as the one obtained from the curve in PBS (3σ method) and was found to be 44.4 μM.
Figure 11.
Dose–response curve obtained by HTM analysis of the MIP/NIP after infusions of different concentrations of glucose in spiked human urine samples, the blue dashed line reveals the LoD (3σ method) at ± 44.4 μM. Error bars and mean values are calculated using the noise of the signal and are the average of multiple measurements.
Similar to the experiments performed in PBS, the calculated intercept for the LoD in urine samples is greater than the curve plotted for the NIP data, demonstrating that the sensor is capable of detecting glucose in a quantitative and specific manner in human urine samples as well as in PBS. When comparing the dose response curves obtained with the HTM analysis using PBS or urine as a medium, the sensor demonstrates a very similar behavior. It can be clearly noticed that in both the dose–response curves (Figures 9 and 11), an observably lower effect size is observed for the reference NIP when compared with the MIP. Even though the calculated LoD is higher in urine than in PBS samples, 44.4 and 19.4 μM, respectively, the sensitivity of the sensor in urine is higher than the one calculated for many commercial enzyme-based sensors and therefore demonstrates the applicability of the sensor in the monitoring and quantification of glucose in diabetic patients.
Selectivity Analysis of the Receptor Layer in Human Urine Samples
The selectivity of the developed platform in human urine samples was demonstrated with further HTM analysis. This was achieved by analyzing the thermal response after injection of the same compounds (and concentrations) used for the selectivity studies in buffer solutions. The recorded thermal response was then transformed into an effect size (%) as previously described (eq 2) and plotted against the injected concentration of the analyte in urine samples (Figure 12).
Figure 12.
HTM analysis of compounds introduced inside the flow cell and infused at increasing concentrations (0.00–0.033 mM) in human urine samples and their corresponding dose–response curves for MIPs. Error bars and mean values are calculated using the noise of the signal and are the average of multiple measurements.
Overall, none of the tested analytes show a higher binding affinity for glucose toward the MIPs. This difference was apparent from the first injection (0.05 mM), in addition the difference in effect size is seen to increase as the concentration of the analyte introduced does, demonstrating a higher selectivity toward glucose at higher concentrations. It can be noticed that the disaccharides containing a glucose unit (sucrose and lactose) show a higher rebinding effect than fructose, attributed to the fact that the navocavities present in the MIP are made to fit a GA (and therefore a glucose) unit. Since the effect sizes obtained in PBS are comparable with the ones obtained in human urine samples for each of the tested compounds, it is demonstrated that selectivity and specificity of the sensor are not highly affected by the matrix in which the analytes are present.
Conclusions
In this work, a straightforward approach for the synthesis of MIPs for glucose using a dummy imprinting technique was presented. The imprinted polymer was prepared using GA as the dummy template to obtain receptors that could bind glucose. By preparing MIPs with different molar ratios of GA/AAM/EGDMA, an optimized MIP recipe was obtained to ensure the specific interaction between the target and the receptor. Template removal from these synthesized MIPs was studied using FTIR and TGA, providing a strong proof that the template molecule is indeed removed and functions optimally. Rebinding experiments analyzed with LC–MS proceeded to be used to construct binding isotherms for each of the compositions. These isotherms were analyzed in terms of maximum binding capacity and IF values, where MIP-02 was determined to have the best composition for binding glucose (IF = 5.18, Sb max = 15.59 μmol g–1). The optimized MIP was then scrutinized further by thermal analysis with the HTM. The analysis of the MIP samples was performed in phosphate buffer solutions, where an LoD of 19.4 μM and a linear range of 19.4–330 μM was achieved. The sensor therefore operates in a concentration regime that is two orders of magnitude higher than physiological concentrations encountered in blood. However, for other applications such as the detection of glucose in sweat, urine, food products, or industrial applications, the higher apparent sensitivity renders it beneficial over traditional, commercial enzymatic glucose sensors. The same analysis was then conducted for different analogues of glucose (sucrose, lactose, and fructose), determining that the sensor had greater affinity toward glucose than any of the molecules tested.
Finally, the MIP particles demonstrated their efficiency in detecting glucose in physiological fluids. To this end, human urine samples were collected and analyzed with the HTM. The sensor exhibited an LOD of 44.4 μM and a linear range of 44.4–330 μM, demonstrating the applicability of the sensor in both establishing urine glucose concentrations. The combination of a low-cost detection platform with a straightforward, easily scalable production process, leading to a disposable glucose sensor that is competitive to state-of-the-art sensor platforms, makes these findings very interesting in terms of commercial applications and follow-up research to further optimize the sensor and integrate it into a handheld or wearable device. The results demonstrate that the sensor might offer a non-invasive, low-cost alternative to traditional enzyme-based and/or electrochemical methods in terms of medical diagnostics but the sensitivity of the sensor also makes it interesting to study other potential applications such as its use in food analysis or the monitoring of industrial fermentation processes.
Acknowledgments
This work was supported by the European Regional Development Fund (ERDF), the province of Limburg, the Dutch Ministry of Economic Affairs and Climate Policy and the Ministerium für Wirtschaft, Innovation and Digitalisierung und Energie des Landes NRW, through the Saber Print Project (project number 144277), funded by Interreg Deutschland Netherlands program.
Glossary
Abbreviations
- MIP
molecularly imprinted polymer
- NIP
non-imprinted polymer
- QCM
quartz-crystal microbalance
- HTM
heat-transfer method
- LC-MS
liquid chromatography–mass spectroscopy
- TGA
thermal gravimetric analysis
- FTIR
Fourier transform infrared
- PVC
polyvinyl chloride
- Rth
thermal resistance
- PDMS
polydimethylsiloxane
- LoD
limit of detection
- IF
imprint factor
- PID
proportional-integral-derivative
- PEEK
polyEther ether ketone
Supporting Information Available
The Supporting Information is available free of charge at https://pubs.acs.org/doi/10.1021/acssensors.1c02223.
Chemical structures of the tested analytes and dummy molecule and test strip result of the collected urine samples (PDF)
Author Contributions
All authors have given approval to the final version of the manuscript.
The authors declare no competing financial interest.
Supplementary Material
References
- Vaulont S.; Vasseur-Cognet M.; Kahn A. Glucose Regulation of Gene Transcription. J. Biol. Chem. 2000, 275, 31555–31558. 10.1074/JBC.R000016200. [DOI] [PubMed] [Google Scholar]
- du Plessis S.; Agarwal A.; Mohanty G.; van der Linde M. Oxidative Phosphorylation versus Glycolysis: What Fuel Do Spermatozoa Use?. Asian J. Androl. 2015, 17, 230. 10.4103/1008-682X.135123. [DOI] [PMC free article] [PubMed] [Google Scholar]
- Klonoff D. C. Continuous Glucose Monitoring: Roadmap for 21st century diabetes therapy. Diabetes Care 2005, 28, 1231–1239. 10.2337/DIACARE.28.5.1231. [DOI] [PubMed] [Google Scholar]
- Lin Y.; Yu P.; Hao J.; Wang Y.; Ohsaka T.; Mao L. Continuous and Simultaneous Electrochemical Measurements of Glucose, Lactate, and Ascorbate in Rat Brain Following Brain Ischemia. Anal. Chem. 2014, 86, 3895–3901. 10.1021/AC4042087. [DOI] [PubMed] [Google Scholar]
- Kropff J.; Bruttomesso D.; Doll W.; Farret A.; Galasso S.; Luijf Y. M.; Mader J. K.; Place J.; Boscari F.; Pieber T. R.; Renard E.; DeVries J. H. Accuracy of two continuous glucose monitoring systems: a head-to-head comparison under clinical research centre and daily life conditions. Diabetes, Obes. Metab. 2015, 17, 343. 10.1111/DOM.12378. [DOI] [PMC free article] [PubMed] [Google Scholar]
- Coster S.; Gulliford M.; Seed P.; Powrie J.; Swaminathan R. Monitoring Blood Glucose Control in Diabetes Mellitus: A Systematic Review. Health Technol. Assess. 2000, 4, 1–93. 10.3310/hta4120. [DOI] [PubMed] [Google Scholar]
- Diagnosis and Classification of Diabetes Mellitus. Diabetes Care 2014, 37 Suppl 1, S81–90. 10.2337/DC14-S081. [DOI] [PubMed] [Google Scholar]
- Cho N. H.; Shaw J. E.; Karuranga S.; Huang Y.; da Rocha Fernandes J. D.; Ohlrogge A. W.; Malanda B. IDF Diabetes Atlas: Global Estimates of Diabetes Prevalence for 2017 and Projections for 2045. Diabetes Res. Clin. Pract. 2018, 138, 271–281. 10.1016/J.DIABRES.2018.02.023. [DOI] [PubMed] [Google Scholar]
- Rowley W. R.; Bezold C.; Arikan Y.; Byrne E.; Krohe S. Diabetes 2030: Insights from Yesterday, Today, and Future Trends. Popul. Health Manag. 2017, 20, 6–12. 10.1089/POP.2015.0181. [DOI] [PMC free article] [PubMed] [Google Scholar]
- Chen A.; Chatterjee S. Nanomaterials Based Electrochemical Sensors for Biomedical Applications. Chem. Soc. Rev. 2013, 42, 5425. 10.1039/c3cs35518g. [DOI] [PubMed] [Google Scholar]
- Nichols S. P.; Koh A.; Storm W. L.; Shin J. H.; Schoenfisch M. H. Biocompatible Materials for Continuous Glucose Monitoring Devices. Chem. Rev. 2013, 113, 2528–2549. 10.1021/CR300387J. [DOI] [PMC free article] [PubMed] [Google Scholar]
- Shokrekhodaei M.; Quinones S. Review of Non-Invasive Glucose Sensing Techniques: Optical, Electrical and Breath Acetone. Sensors 2020, 20, 1251. 10.3390/S20051251. [DOI] [PMC free article] [PubMed] [Google Scholar]
- Malitesta C.; Palmisano F.; Torsi L.; Zambonin P. G. Glucose Fast-Response Amperometric Sensor Based on Glucose Oxidase Immobilized in an Electropolymerized Poly(o-Phenylenediamine) Film. Anal. Chem. 1990, 62, 2735–2740. 10.1021/AC00223A016. [DOI] [PubMed] [Google Scholar]
- Luo X.; Xia J.; Jiang X.; Yang M.; Liu S. Cellulose-Based Strips Designed Based on a Sensitive Enzyme Colorimetric Assay for the Low Concentration of Glucose Detection. Anal. Chem. 2019, 91, 15461–15468. 10.1021/ACS.ANALCHEM.9B03180. [DOI] [PubMed] [Google Scholar]
- Cha R.; Wang D.; He Z.; Ni Y. Development of Cellulose Paper Testing Strips for Quick Measurement of Glucose Using Chromogen Agent. Carbohydr. Polym. 2012, 88, 1414–1419. 10.1016/J.CARBPOL.2012.02.028. [DOI] [Google Scholar]
- Park S.; Boo H.; Chung T. D. Electrochemical Non-Enzymatic Glucose Sensors. Anal. Chim. Acta 2006, 556, 46–57. 10.1016/J.ACA.2005.05.080. [DOI] [PubMed] [Google Scholar]
- Sehit E.; Altintas Z. Significance of Nanomaterials in Electrochemical Glucose Sensors: An Updated Review (2016-2020). Biosens. Bioelectron. 2020, 159, 112165. 10.1016/J.BIOS.2020.112165. [DOI] [PubMed] [Google Scholar]
- Gao H.; Xiao F.; Ching C. B.; Duan H. One-Step Electrochemical Synthesis of PtNi Nanoparticle-Graphene Nanocomposites for Nonenzymatic Amperometric Glucose Detection. ACS Appl. Mater. Interfaces 2011, 3, 3049–3057. 10.1021/AM200563F. [DOI] [PubMed] [Google Scholar]
- Park S.; Chung T. D.; Kim H. C. Nonenzymatic Glucose Detection Using Mesoporous Platinum. Anal. Chem. 2003, 75, 3046–3049. 10.1021/AC0263465. [DOI] [PubMed] [Google Scholar]
- Zhang L.; Li H.; Ni Y.; Li J.; Liao K.; Zhao G. Porous Cuprous Oxide Microcubes for Non-Enzymatic Amperometric Hydrogen Peroxide and Glucose Sensing. Electrochem. Commun. 2009, 11, 812–815. 10.1016/J.ELECOM.2009.01.041. [DOI] [Google Scholar]
- Emir G.; Dilgin Y.; Ramanaviciene A.; Ramanavicius A. Amperometric Nonenzymatic Glucose Biosensor Based on Graphite Rod Electrode Modified by Ni-Nanoparticle/Polypyrrole Composite. Microchem. J. 2021, 161, 105751. 10.1016/J.MICROC.2020.105751. [DOI] [Google Scholar]
- Ratautaite V.; Samukaite-Bubniene U.; Plausinaitis D.; Boguzaite R.; Balciunas D.; Ramanaviciene A.; Neunert G.; Ramanavicius A. Molecular Imprinting Technology for Determination of Uric Acid. Int. J. Mol. Sci. 2021, 22, 5032. 10.3390/IJMS22095032. [DOI] [PMC free article] [PubMed] [Google Scholar]
- Viter R.; Kunene K.; Genys P.; Jevdokimovs D.; Erts D.; Sutka A.; Bisetty K.; Viksna A.; Ramanaviciene A.; Ramanavicius A. Photoelectrochemical Bisphenol S Sensor Based on ZnO-Nanoroads Modified by Molecularly Imprinted Polypyrrole. Macromol. Chem. Phys. 2020, 221, 1900232. 10.1002/MACP.201900232. [DOI] [Google Scholar]
- Belbruno J. J. Molecularly Imprinted Polymers. Chemical Reviews 2019, 119, 94–119. 10.1021/acs.chemrev.8b00171. [DOI] [PubMed] [Google Scholar]
- Ye L.; Haupt K. Molecularly Imprinted Polymers as Antibody and Receptor Mimics for Assays, Sensors and Drug Discovery. Anal. Bioanal. Chem. 2004, 378, 1887–1897. 10.1007/S00216-003-2450-8. [DOI] [PubMed] [Google Scholar]
- Lavignac N.; Allender C. J.; Brain K. R. Current Status of Molecularly Imprinted Polymers as Alternatives to Antibodies in Sorbent Assays. Anal. Chim. Acta 2004, 510, 139–145. 10.1016/J.ACA.2003.12.066. [DOI] [Google Scholar]
- Zhang H.Molecularly Imprinted Nanoparticles for Biomedical Applications. Advanced Materials; Wiley-VCH Verlag, 2020. January Vol. 32. [DOI] [PubMed] [Google Scholar]
- Wackerlig J.; Lieberzeit P. A. Molecularly imprinted polymer nanoparticles in chemical sensing - Synthesis, characterisation and application. Sens. Actuators, B 2015, 207, 144–157. 10.1016/J.SNB.2014.09.094. [DOI] [Google Scholar]
- Schirhagl R.; Qian J.; Dickert F. L. Immunosensing with Artificial Antibodies in Organic Solvents or Complex Matrices. Sens. Actuators, B 2012, 173, 585–590. 10.1016/J.SNB.2012.07.036. [DOI] [Google Scholar]
- Piletsky S. A.; Alcock S.; Turner A. P. F. Molecular Imprinting: At the Edge of the Third Millennium. Trends Biotechnol. 2001, 19, 9–12. 10.1016/S0167-7799(00)01523-7. [DOI] [PubMed] [Google Scholar]
- Ramanavicius S.; Jagminas A.; Ramanavicius A. Advances in Molecularly Imprinted Polymers Based Affinity Sensors (Review). Polymers 2021, 13, 974. 10.3390/POLYM13060974. [DOI] [PMC free article] [PubMed] [Google Scholar]
- Ramanavicius S.; Ramanavicius A. Conducting Polymers in the Design of Biosensors and Biofuel Cells. Polymers 2021, 13, 49. 10.3390/POLYM13010049. [DOI] [PMC free article] [PubMed] [Google Scholar]; Page 49
- Liu G.; Huang X.; Li L.; Xu X.; Zhang Y.; Lv J.; Xu D. Recent Advances and Perspectives of Molecularly Imprinted Polymer-Based Fluorescent Sensors in Food and Environment Analysis. Nanomaterials 2019, 9, 1030. 10.3390/NANO9071030. [DOI] [PMC free article] [PubMed] [Google Scholar]
- van Grinsven B.; Eersels K.; Peeters M.; Losada-Pérez P.; Vandenryt T.; Cleij T. J.; Wagner P. The Heat-Transfer Method: A Versatile Low-Cost, Label-Free, Fast, and User-Friendly Readout Platform for Biosensor Applications. ACS Appl. Mater. Interfaces 2014, 6, 13309–13318. 10.1021/am503667s. [DOI] [PubMed] [Google Scholar]
- Steen Redeker E.; Eersels K.; Akkermans O.; Royakkers J.; Dyson S.; Nurekeyeva K.; Ferrando B.; Cornelis P.; Peeters M.; Wagner P.; Diliën H.; van Grinsven B.; Cleij T. J. Biomimetic Bacterial Identification Platform Based on Thermal Wave Transport Analysis (TWTA) through Surface-Imprinted Polymers. ACS Infect. Dis. 2017, 3, 388–397. 10.1021/acsinfecdis.7b00037. [DOI] [PMC free article] [PubMed] [Google Scholar]
- Arreguin-Campos R.; Eersels K.; Lowdon J. W.; Rogosic R.; Heidt B.; Caldara M.; Jiménez-Monroy K. L.; Diliën H.; Cleij T. J.; van Grinsven B. Biomimetic Sensing of Escherichia Coli at the Solid-Liquid Interface: From Surface-Imprinted Polymer Synthesis toward Real Sample Sensing in Food Safety. Microchem. J. 2021, 169, 106554. 10.1016/j.microc.2021.106554. [DOI] [Google Scholar]
- Crapnell R. D.; Street R. J.; Ferreira-Silva V.; Down M. P.; Peeters M.; Banks C. E. Electrospun Nylon Fibers with Integrated Polypyrrole Molecularly Imprinted Polymers for the Detection of Glucose. Anal. Chem. 2021, 93, 13235–13241. 10.1021/acs.analchem.1c02472. [DOI] [PubMed] [Google Scholar]
- Crapnell R. D.; Canfarotta F.; Czulak J.; Johnson R.; Betlem K.; Mecozzi F.; Down M. P.; Eersels K.; van Grinsven B.; Cleij T. J.; Law R.; Banks C. E.; Peeters M. Thermal Detection of Cardiac Biomarkers Heart-Fatty Acid Binding Protein and ST2 Using a Molecularly Imprinted Nanoparticle-Based Multiplex Sensor Platform. ACS Sens. 2019, 4, 2838–2845. 10.1021/ACSSENSORS.9B01666/SUPPL_FILE/SE9B01666_SI_001.PDF. [DOI] [PubMed] [Google Scholar]
- Peeters M. M.; van Grinsven B.; Foster C.; Cleij T.; Banks C. Introducing Thermal Wave Transport Analysis (TWTA): A Thermal Technique for Dopamine Detection by Screen-Printed Electrodes Functionalized with Molecularly Imprinted Polymer (MIP) Particles. Molecules 2016, 21, 552. 10.3390/MOLECULES21050552. [DOI] [PMC free article] [PubMed] [Google Scholar]
- Lowdon J. W.; Eersels K.; Arreguin-Campos R.; Caldara M.; Heidt B.; Rogosic R.; Jimenez-Monroy K. L.; Cleij T. J.; Diliën H.; van Grinsven B. A Molecularly Imprinted Polymer-Based Dye Displacement Assay for the Rapid Visual Detection of Amphetamine in Urine. Molecules 2020, 25, 5222. 10.3390/molecules25225222. [DOI] [PMC free article] [PubMed] [Google Scholar]
- Lowdon J. W.; Diliën H.; van Grinsven B.; Eersels K.; Cleij T. Colorimetric Sensing of Amoxicillin Facilitated by Molecularly Imprinted Polymers. Polymers 2021, 13, 2221. 10.3390/polym13132221. [DOI] [PMC free article] [PubMed] [Google Scholar]
- Eersels K.; Diliën H.; Lowdon J.; Steen Redeker E.; Rogosic R.; Heidt B.; Peeters M.; Cornelis P.; Lux P.; Reutelingsperger C.; Schurgers L.; Cleij T.; van Grinsven B. A Novel Biomimetic Tool for Assessing Vitamin K Status Based on Molecularly Imprinted Polymers. Nutrients 2018, 10, 751. 10.3390/nu10060751. [DOI] [PMC free article] [PubMed] [Google Scholar]
- Lowdon J. W.; Eersels K.; Rogosic R.; Boonen T.; Heidt B.; Diliën H.; van Grinsven B.; Cleij T. J. Surface Grafted Molecularly Imprinted Polymeric Receptor Layers for Thermal Detection of the New Psychoactive Substance 2-Methoxphenidine. Sens. Actuators, A 2019, 295, 586–595. 10.1016/j.sna.2019.06.029. [DOI] [Google Scholar]
- Rogosic R.; Lowdon J. W.; Heidt B.; Diliën H.; Eersels K.; Van Grinsven B.; Cleij T. J. Studying the Effect of Adhesive Layer Composition on MIP-Based Thermal Biosensing. Phys. Status Solidi A 2019, 216, 1800941. 10.1002/PSSA.201800941. [DOI] [Google Scholar]
- Lorenzo R.; Carro A.; Alvarez-Lorenzo C.; Concheiro A. To Remove or Not to Remove? The Challenge of Extracting the Template to Make the Cavities Available in Molecularly Imprinted Polymers (MIPs). Int. J. Mol. Sci. 2011, 12, 4327–4347. 10.3390/IJMS12074327. [DOI] [PMC free article] [PubMed] [Google Scholar]
- Kacuráková M.; Mathlouthi M. FTIR and Laser-Raman Spectra of Oligosaccharides in Water: Characterization of the Glycosidic Bond. Carbohydr. Res. 1996, 284, 145–157. 10.1016/0008-6215(95)00412-2. [DOI] [PubMed] [Google Scholar]
- Wolkers W. F.; Oliver A. E.; Tablin F.; Crowe J. H. A Fourier-Transform Infrared Spectroscopy Study of Sugar Glasses. Carbohydr. Res. 2004, 339, 1077–1085. 10.1016/J.CARRES.2004.01.016. [DOI] [PubMed] [Google Scholar]
- Thoelen R.; Vansweevelt R.; Duchateau J.; Horemans F.; D’Haen J.; Lutsen L.; Vanderzande D.; Ameloot M.; vandeVen M.; Cleij T. J.; Wagner P. A MIP-Based Impedimetric Sensor for the Detection of Low-MW Molecules. Biosens. Bioelectron. 2008, 23, 913–918. 10.1016/J.BIOS.2007.08.020. [DOI] [PubMed] [Google Scholar]
- Peeters M.; Csipai P.; Geerets B.; Weustenraed A.; van Grinsven B.; Thoelen R.; Gruber J.; de Ceuninck W.; Cleij T. J.; Troost F. J.; Wagner P. Heat-Transfer-Based Detection of l-Nicotine, Histamine, and Serotonin Using Molecularly Imprinted Polymers as Biomimetic Receptors. Anal. Bioanal. Chem. 2013, 405, 6453–6460. 10.1007/s00216-013-7024-9. [DOI] [PubMed] [Google Scholar]
Associated Data
This section collects any data citations, data availability statements, or supplementary materials included in this article.


