Abstract
Deep learning (DL) models in quantitative structure–activity relationship fed the molecular structure directly to the network without using human-designed descriptors by representing molecule as a graph or string (e.g., SMILES code). However, these two representations were oversimplification of real molecules to reflect chemical properties of molecular structures. Given that the choice of molecular representation determines the architecture of the DL model to apply, a novel way of molecular representation can open a way to apply diverse DL networks developed and used in other fields. A topological distance-based electron interaction (TDEi) tensor has been developed in this study inspired by the quantum mechanical model of the molecule, which defines a molecule with electrons and protons. In the TDEi tensor, the atomic orbital (AO) of each atom is represented by an electron configuration (EC) vector, which is a bit string based on the presence and absence of electrons in each AO according to spin indicated by positive and negative signs. Interactions between EC vectors were calculated based on the topological distance between atoms in a molecule. As a molecular structure was translated into 3D array, CNN models (modified VGGNet) were applied using a TDEi tensor to predict four physicochemical properties of drug-like compound datasets: MP (275,131), Lipop (4193), Esol (1127), and Freesolv (639). Models achieved good prediction accuracy. PCA showed that a stronger correlation was observed between the extracted features and the target endpoint as features were extracted from the deeper layer.
Introduction
Diverse quantitative structure–activity relationship (QSAR) models have been used in drug discovery projects to reduce the time and cost required for drug discovery by predicting properties or activities of molecules with their structure alone.1−3 Even though QSAR models have been successful in filtering out poor molecules in the early phase of drug discovery, the models have failed to discover good drug candidates based on their prediction outcomes alone, which implies that the prediction accuracy of QSAR models is not satisfactory yet.4 Recently, deep learning (DL) algorithms have been applied in QSAR model development with expectation of significant prediction accuracy improvement.5 Even though most of DL studies claim that the application of DL algorithms improved prediction accuracy,6−10 it is not certain whether use of DL can truly improve prediction accuracy of QSAR models. Jiang et al. compared the performance of machine learning (ML) models and DL models on multiple datasets and concluded that a descriptor-based support vector machine outperformed DL models.11 In order to achieve a breakthrough in drug discovery using DL, more research studies are still required to test diverse deep neural network (DNN) architectures on drug-like compounds to see if DL can truly improve prediction accuracy.
An artificial neural network was frequently used in traditional QSAR studies with a descriptor vector as an input in a shallow network architecture having only one hidden layer. A descriptor-based DL model used a deeper network architecture by staking more hidden layers inside the network. In more advanced DL algorithm, methods to feed the molecular structures directly to the network were developed instead of using molecular descriptors. The molecular structure can be represented with different theoretical models,7 and a topological graph is a common way to define molecular structures with edges (chemical bonds) and nodes (atoms). A graph convolutional neural network (GCN) takes the molecular graph as an input, represented by an adjacency matrix with the feature of each atom and their neighbor information. The feature for each atom represents the character of the atom based on its microenvironment, and neighbor information is described by the distance between the atoms, or connectivity features, such as chemical bond features.8,12,13 The simplified molecular input line entry system (SMILES) code is a string format representation for molecular structures14 and is broadly used in public databases. As molecular structures can be represented in a string format, techniques used in natural language processing were adopted to input molecular structures directly to the network through one-hot encoding on each symbol of SMILES15 or SMILES-embeddings.16 Even though the graph and SMILES were widely used for molecular structure representation, these were oversimplification of molecules in real life to reflect chemical properties observed in molecular structures. Thus, more molecular representations need to be developed to represent molecules realistically. Given that the choice of molecular representation determines the architecture of DNN to apply, development of a novel representation can open a way to apply diverse DL algorithms, developed and used in other fields, on drug-like compound datasets.
A quantum mechanical (QM) model of the molecule is represented by electrons and protons. Since a chemical bond can be described by distribution of electrons between closely located atoms, the input file for QM calculation did not specify bonding information. In the SMILES and mol file format, intrinsic hydrogen is usually omitted; however, it should be explicitly specified in QM calculation to elaborate the electronic structure of the molecule. QM descriptors have been used in a wide range of QSAR studies to establish a correlation between molecular orbital (MO) energy-derived descriptors and the target endpoints.17 In order to calculate electron interactions between atoms in a molecule, an autocorrelation descriptor was used to calculate the interaction of QM properties between two atoms within a certain topological distance.18,19 This method uses human-preprocessed information based on different levels of QM calculation theories. To my best knowledge, no DNN studies defined a molecule with a QM model so that the DNN automatically extracts QM property interactions. Given that MO energies were calculated in QM through linear combination of atomic orbitals (AOs), interactions between AOs in a molecule can be used to generate an input for DL models so that the network can efficiently weigh the interactions between AOs for prediction of the target properties in a data-driven way.
In this study, a topological distance-based electron interaction (TDEi) tensor was developed to convert the molecular structure into a 3D array format to feed the electronic structure of the molecule into convolutional neural network (CNN) architecture. In the TDEi tensor calculation, AOs in each atom were represented by the electron configuration (EC) vector, and the number of interactions between each AO was calculated to convert the molecular structure into the TDEi tensor. Particularly, the TDEi tensor was designed to be adjustable according to the size of the data and the complexity of the molecular structure by changing the EC vector and topological distance channel. Here, modified VGGNet was used in model development with the TDEi tensor, and it achieved good prediction accuracy for prediction of four physicochemical properties: normal melting point (MP), water solubility (Esol), octanol/water distribution coefficient (Lipop), and hydration free energy (Freesolv). Analysis of the features revealed that a higher correlation was achieved between the features and the target properties when features were extracted from the deeper layer of the VGGNet.
Methods
TDEi Tensor Calculation
In QM calculation, coefficients for linear combination of AOs were estimated in the density matrix, which is a diagonal matrix whose rows and columns are AOs in a molecule. As a molecule can be translated into a matrix format with AO information, the concept was adopted in the TDEi tensor design. The size of the density matrix is dependent on the number of AOs in the molecule; however, the input shape must be equal regardless of the size of the molecule in order to input them into the CNN. Therefore, the electron interaction (Ei) matrix was designed with rows and columns with a fixed size of the EC vector so that every input has an identically sized matrix. As the size of the Ei matrix was fixed, molecular geometry differences were lost in the matrix because the EC vector was solely based on the composition of molecules. Since molecules with identical compositions can have different molecular geometries, the Ei matrix was generated for each topological distance within a molecule to consider the topological structure of a molecule.
In QM calculation, 3D geometry of a molecule is used to calculate the distance between atoms. The 3D structure of molecules can be obtained by geometry optimization; however, calculated 3D geometry is not suitably accurate. The 3D structures available in PubChem were also the optimized structures. Thus, 2D structural information alone was used in this study due to the absence of precise 3D molecular geometry for compounds in datasets.
Definition of an Electron Configuration Vector
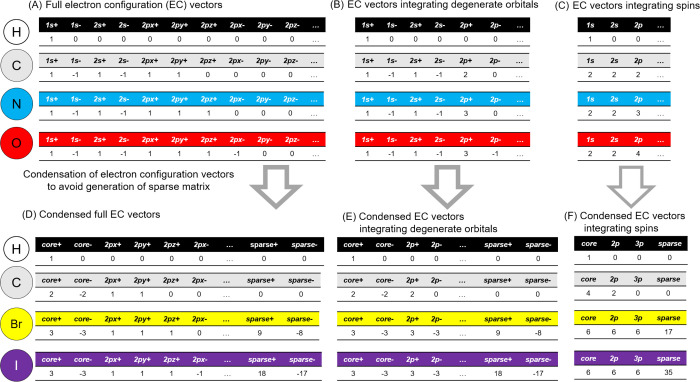
The TDEi tensor was calculated based on the EC of atoms in a molecule. The EC vector was defined in a previous study by giving a zero for each unoccupied AO and one for each occupied AO with two different electron spins marked by positive and negative signs.20 The EC vector can be varied by combining degenerated AOs or electron spins because these electrons possess identical levels of energy. It is particularly significant in the case of handling small sized data set to integrate the information for efficient model training. Such information condensation was successful in the prediction model development with a small dataset.21 The possible variations of EC vectors are summarized in Figure 1.
Figure 1.
Calculation of electron configuration (EC) vectors of each atom. The EC vector of each atom was used in order to calculate electron interaction matrices. (A) Indices of the full EC vector are atomic orbitals with different spins, and the EC vector was designed to be reduced by integrating (B) atomic orbitals in an identical energy level (degenerate orbitals) and (C) in different spins. (D–F) Each EC vector was condensed to reduce sparsity in feature space.
Electron Interaction Matrix Calculation
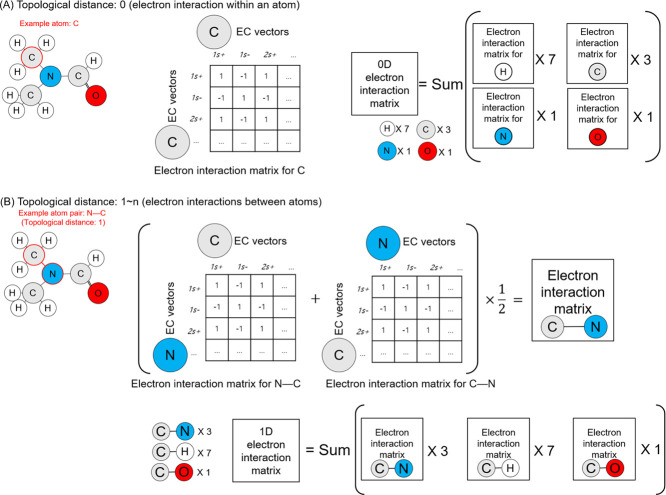
Instead of using chemical bonds, the TDEi tensor checks neighboring atoms to define the topological structure of a molecular geometry. Intrinsic hydrogens were not indicated in SMILES; however, they should be specified in order to correctly calculate the electronic structure of a molecule; therefore, all hydrogens present in the molecule were specifically added. The GetDistanceMatrix function implemented in RDKit (version 2018.09.01) was used to obtain the topological distance (TD) of atoms within a molecule. Topological distance 0 means the atom itself (Figure 2A); thus, the EC vector of the atom was multiplied by a row and a column in order to calculate the number of electron interactions within the atom. The topological distance 0 matrix is the sum of the Ei matrices for all atoms within a molecule. When the topological distance was higher than one, the pairs of atoms within the molecule were taken to calculate the Ei matrices between them. Since the Ei matrices between two paired atoms were calculated twice, they were divided by two, and all Ei matrices for each topological distance were summed. All Ei matrices with topological distances greater than one were calculated as explained in Figure 2B.
Figure 2.
Electron interaction matrices (Eis) in each specified topological distance were calculated based on the EC vector of each atom in a molecule. (A) Eis within topological distance 0 are electron interactions within an atom, and (B) Eis within topological distance longer than 0 are Eis between pair of atoms according to the distance. After calculation of Eis, they were summed within the identical topological distance.
Concatenating Electron Interaction Matrices in Different Topological Distances
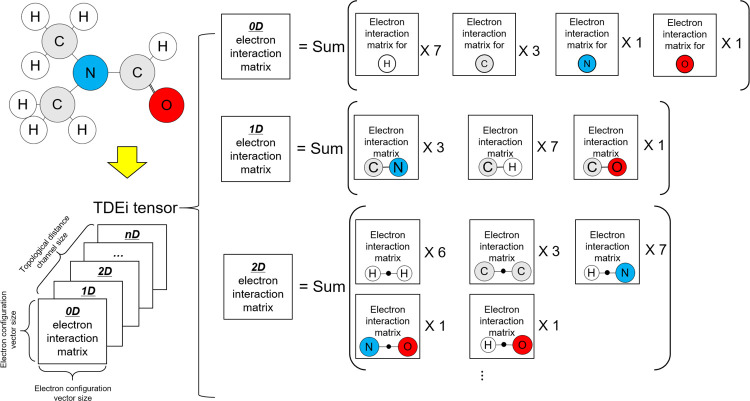
The Ei matrix can be calculated from any topological distance. In the example molecule (Figure 3), atom pairs existed up to a topological distance of 4. The Ei matrices from atom pairs with a greater topological distance can be calculated if the size of the molecule increases. When Ei matrices were prepared from predetermined topological distances, they were concatenated to form the TDEi tensor (Figure 4). As the TDEi tensor size can be varied based on the size of the EC vector and the topological distance, it can be flexibly adjusted according to the size of the data or the diversity of the molecular structure.
Figure 3.
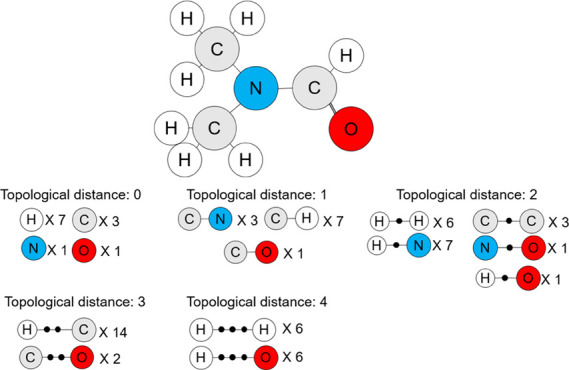
Possible atom pairs. In this molecule, the longest topological distance was 4D; however, further atom pairs can be found if the size of the molecule increases.
Figure 4.
Preparation of the TDEi tensor. The TDEi tensor was prepared by concatenating Ei matrices in each topological distance and designed to be adaptable to structural diversity and the size of datasets by adjusting EC vectors and topological distances.
Preparation of Datasets
In this study, four datasets were selected for the regression tasks: MP, Esol, Lipop, and Freesolv. There are wide ranges of available datasets used in DL model development studies8,11,13,16 such as human immunodeficiency virus replication inhibition, human ß-secretase 1 inhibition, blood–brain barrier penetration, toxicity in clinical trials, drug adverse reactions, biological targets screened in Tox21 and ToxCast, and PubChem BioAssay data; however, they were seriously imbalanced whether they were binary or multiple classification tasks. Thus, these were not used in this study.
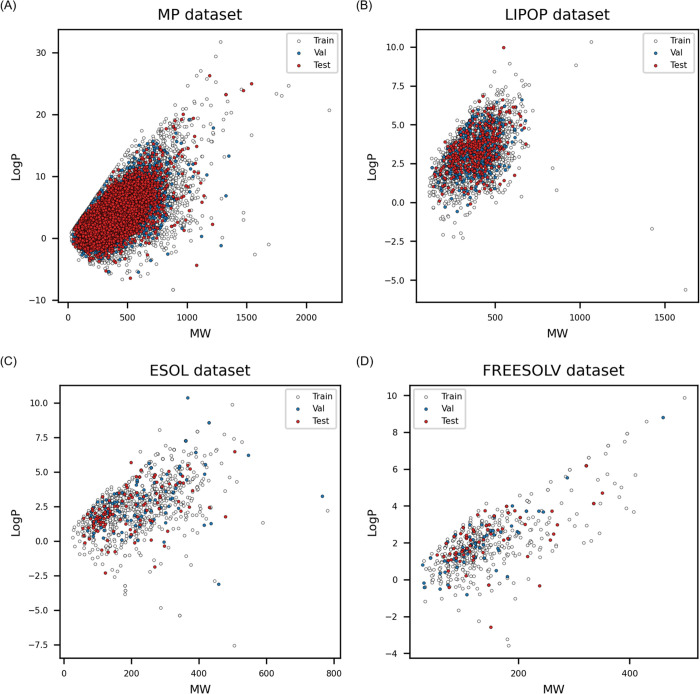
The MP was obtained from the study of Tetko et al., in which 275,131 compounds were extracted with their MP values from patent documents.22 The dataset was divided into training, validation, and external test sets by a random split in a ratio of 8:1:1. ESOL, Freesolv, and Lipop were obtained from the study by Jiang et al.11 The datasets were already divided into training, validation, and externa test sets by the authors, thus I used them as such. The number of data and the range of the endpoint are listed in Table 1, and the chemical space of the datasets were plotted to verify the structural diversity in the training, validation, and external test sets (Figure 5).
Table 1. Datasets for Model Building.
| training
set |
validation
set |
test
set |
|||||
|---|---|---|---|---|---|---|---|
| endpoints | total num. | num. | range | num. | range | num. | range |
| MP | 275,131 | 220,104 | –199.0 to 517.0 | 27,513 | –157.15 to 420 | 27,514 | –185.18 to 438.65 |
| Lipop | 4193 | 3354 | –1.5 to 4.5 | 420 | –1.42 to 4.49 | 419 | –1.17 to 4.5 |
| Esol | 1127 | 901 | –11.6 to 1.58 | 113 | –9.16 to 0.94 | 113 | –8.40 to 1.02 |
| Freesolv | 639 | 511 | –25.47 to 3.16 | 64 | –9.76 to 3.43 | 64 | –20.52 to 3.12 |
Figure 5.
Structure diversities between training, validation, and external test set. (A) The normal melting point (MP) data was the largest data set. Datasets for (B) Lipop, (C) Esol, and (D) Freesolv were the octanol/water partition coefficient, water solubility, and hydration free energy, respectively.
Model Development and Validation
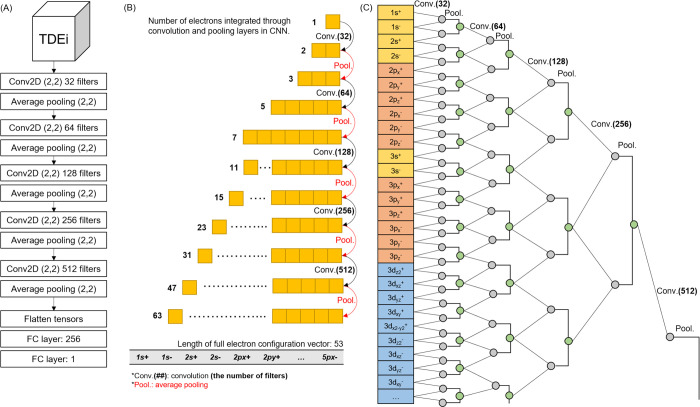
The CNN was used in this study for model development, through Tensorflow 2.2.0,23 and the network architecture was modified from VGGNet as (1) the size of the initial filter channel was reduced by half, from 64 to 32, (2) the filter shape was reduced from three by three to two by two, (3) average pooling was used to minimize information loss, and (4) a convolutional layer was applied once instead of twice before the pooling layer (Figure 6A). A grid search was performed on the CNN architectures, activation functions, and epoch numbers to obtain the finest hyperparameters for model development. Model training was conducted using the NEURON system of the National Supercomputing Center of South Korea, which is mainly composed of GPU nodes (https://www.ksc.re.kr/eng/resource/neuron). The prediction accuracy of the model was measured using four metrics: mean absolute error (MAE), normalized mean absolute error (NMAE), R square (R2), and Spearman’s rank correlation coefficient (Sr).
where ypred is the model’s prediction values, yobs is the observation values, n is the number of compounds, yobs® is the average of observation values, and d is the difference between the ranks of each compound. The prediction model with an R2 higher than 0.6, on the external test set, is considered as an accurate model. Even though the model did not achieve R2 > 0.6, it was still able to make an accurate prediction of the target value when the NMAE was less than 10%. As the QSAR model was used in the prioritization of compounds, an Sr higher than 0.6 implies that the model’s prediction is valid and useful in relative comparison of chemicals, even if the NMAE is over 10%.24 It is important to assess the model prediction accuracy with more than one metric since one metric alone cannot properly represent the prediction accuracy of the model.
Figure 6.
CNN architecture used in this study and electron interactions integrated through each layer. (A) VGGNet was modified by decreasing the channel size of filter, filter size in the convolutional layer to two by two, and the number of convolutional layers before the pooling layer. In grid search, diverse CNN architectures were tested; however, increasing the number of layers did not improve prediction accuracy. (B) Electron interactions were combined through each convolution and average pooling layer. Since the full electron configuration vector size was 53, all electron interactions were considered when the TDEi tensor passed the last pooling layer. (C) Electron interactions integrated in each convolution and pooling layer were shown as an example.
Model Analysis
VGGNets with the TDEi tensor were developed over four datasets; however, the model developed with the MP alone was analyzed because this model was trained with the largest dataset in this study. In the QSAR study, the capacity to separate different molecular structures was the most significant point in the descriptor design. As the CNN extracted features from the TDEi tensor, the performance of these features in distinguishing compounds along the MP was examined. The features were extracted from the middle of the VGGNet before the final prediction value was calculated. Principal component analysis (PCA) was used to project extracted tensors into 2D space.
Results and Discussion
TDEi Parameter Search
The TDEi parameter search results are presented in the supplementary tables: MP (Table S1), Lipop (Table S2), Esol (Table S3), and Freesolv (Table S4). As the TDEi tensor can be varied by changing the EC vectors and topological distances, the influence of different options in the TDEi tensor on prediction accuracy was analyzed. First, an appropriate EC vector size was searched. In the Lipop, Esol, and Freesolv datasets, a dramatic decrease in prediction accuracy was observed regardless of topological distance when the EC vector size was reduced, whereas the MP model showed a mild decrease in prediction accuracy. The full EC vector achieved the highest accuracies in MP, Lipop, and Esol, whose data size was greater than 1000, and the condensed full EC vector in Freesolv, whose data size was less than 1000. According to this experiment, full or condensed full EC vectors should be used in the development of the models for drug-like compounds.
Second, a suitable topological distance was checked. Desirable prediction accuracy was achieved in the MP when the TDEi tensor with topological distance 3 was used, and a further increase in topological distance did not lead to a significant improvement in the accuracy. In the other three datasets, the TDEi tensor with topological distance 2 achieved the highest accuracy. When prediction accuracy variation in the external test set was compared between the MP and other three datasets, prediction accuracy was gradually improved in the MP, whereas fluctuation of prediction accuracy was observed in other three datasets. This difference may be derived from the data size difference. As bigger data was used, the training process of the model seems much stable than other models trained with smaller data.
As the prediction accuracy of the model varied significantly based on the EC vector size and the topological distance of the TDEi tensor in each dataset, a preliminary search was required to select the most suitable option for the TDEi tensor, which was selected such as topological distance 3 with a full EC vector for MP, 2 with a full EC vector for Lipop and Esol, and 2 with a condensed full EC vector for Freesolv. In this study, experiments were performed on small drug-like compounds. TDEi tensor options could be changed if the structural diversity of datasets is different from that of drug-like molecules.25,26
Model Prediction Accuracy
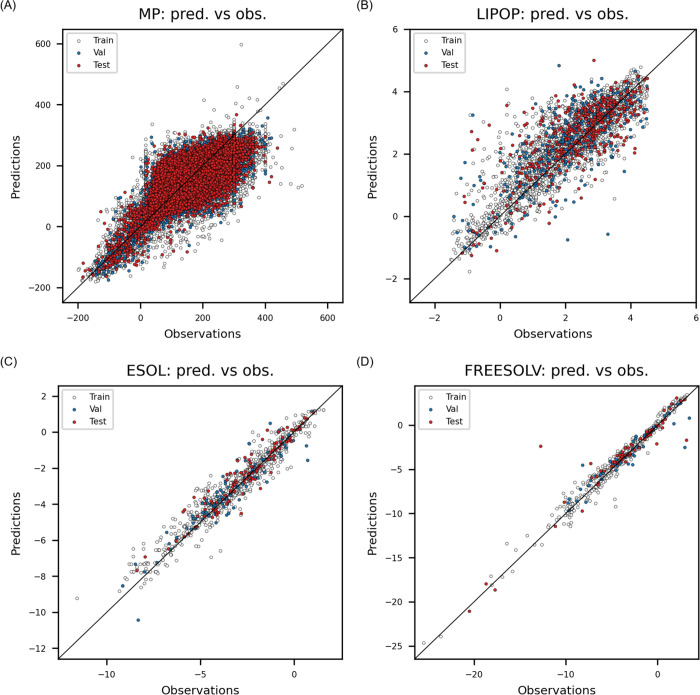
The VGGNet was optimized with the best option of TDEi tensors in the preliminary search for each dataset (Table 2), and the goodness-of-fit of each model is shown in Figure 7. The R2 of the MP model was 0.565 for the external data set. Prediction errors between 0 and 400 °C were relatively high as data points were widely distributed across the best-fit line (Figure 7A). However, NMAE = 5.27% indicates that prediction values were accurate on average, and Sr = 0.729 implied that the model correctly ordered the molecules according to MP values. The Lipop model achieved an R2 of 0.516 on the external test set, and the NMAE was 10.93%. Even though the NMAE is slightly over 10%, Sr = 0.724 showed that the model can be used to compare lipophilicity of the molecules, which is a common use of logP in chemical space visualization (Figure 7B). The models developed by Esol and Freesolv achieved high R2 (Figure 7C,D). Most of DL studies prove their prediction accuracy with one metric; however, more than one metric should be used to examine prediction accuracy of the model thoroughly. Particularly, R2 can vary significantly even though MAE is not varied much.
Table 2. Best Prediction Results for Each Endpoint.
| training
set |
validation
set |
test
set |
||||||||||||
|---|---|---|---|---|---|---|---|---|---|---|---|---|---|---|
| endpoints | TD | EC vector | MAE | NMAE | R2 | Sr | MAE | NMAE | R2 | Sr | MAE | NMAE | R2 | Sr |
| MP | 3D | full | 31.959 | 4.46% | 0.584 | 0.742 | 33.352 | 5.78% | 0.553 | 0.720 | 32.874 | 5.27% | 0.565 | 0.729 |
| Lipop | 2D | full | 0.450 | 7.50% | 0.726 | 0.867 | 0.654 | 11.07% | 0.525 | 0.740 | 0.620 | 10.93% | 0.516 | 0.724 |
| Esol | 2D | full | 0.346 | 2.63% | 0.948 | 0.976 | 0.557 | 5.52% | 0.872 | 0.922 | 0.465 | 4.94% | 0.896 | 0.951 |
| Freesolv | 2D | full (cond.a) | 0.425 | 1.48% | 0.968 | 0.989 | 0.729 | 5.53% | 0.875 | 0.942 | 0.563 | 2.38% | 0.961 | 0.979 |
cond.: condensed.
Figure 7.
Examination of goodness-of-fit on four endpoints: (A) normal melting point, (B) octanol/water partition coefficient, (C) aqueous solubility, and (D) solvation free energy.
VGGNet was developed with more convolutional layers to examine whether the prediction accuracy would improve significantly. However, adding more convolutional layers or increasing the number of nodes within fully connected layers did not lead to a meaningful improvement in prediction accuracy. Thus, CNN models with deeper layers, such as ResNet and Inception, were not applied. This was similar to the previous study where increasing the weights within the neural network architecture did not always improve prediction accuracy.20 Moreover, it is important to find a model architecture with the minimum number of weights achieving the highest prediction accuracy because the use of an excessive number of weights in the model could induce false positives in prediction outcomes.11
Among the four datasets used in this study, the experimental error in MP data was available in the reference. According to the study, the inherent experimental error was 35 °C measured from 18,058 duplicated compounds,22 which was larger than the MAE of the MP model in this study. This experimental error indicated that the lowest error achieved by the model is around 35 °C in reality. Therefore, prediction accuracy improvement for this dataset is limited by data itself, and ML and DL algorithms were not able to make meaningful improvement any further. In DL-based QSAR studies, datasets were collected from a wide range of studies to increase the volume of data; however, it inevitably leads to increase in noises in it since experimental values were measured with different experimental protocols.27 Therefore, understanding the experimental errors of the dataset is of great aid in determining whether the prediction accuracy of the model is meaningful. In DL model studies, the prediction accuracy of the model was compared with others to prove that their own methods achieved improvement in prediction accuracy. Even though prediction accuracy of the DL model was numerically improved compared to other methods, these achievements might not be meaningful if the prediction errors were lower than inherent experimental errors in the dataset since the prediction error cannot be smaller than the experimental error.1 Unfortunately, it is difficult to find studies that compared the prediction accuracy of the QSAR model with the experimental errors of the target endpoint. It may be attributed to dataset curation being done without an understanding of their inherent experimental errors. Unless the prediction errors of QSAR models are analyzed based on experimental errors in the dataset first, a simple comparison between the prediction accuracy of QSAR models may be inadequate to provide decisive evidence of significant improvement in prediction accuracy. As models in computer vision predict unambiguous labels, a higher prediction accuracy always implies a better model. If the problem of mislabeling was excluded from the discussion, then prediction models in computer vision achieved great success because of certainty in the dataset. It is practically impossible to obtain experimental noise-free datasets in drug-like compound datasets. To make a successful case, inherent experimental errors in the dataset must be understood precisely in order that the models are trained and validated reliably.
Model Analysis
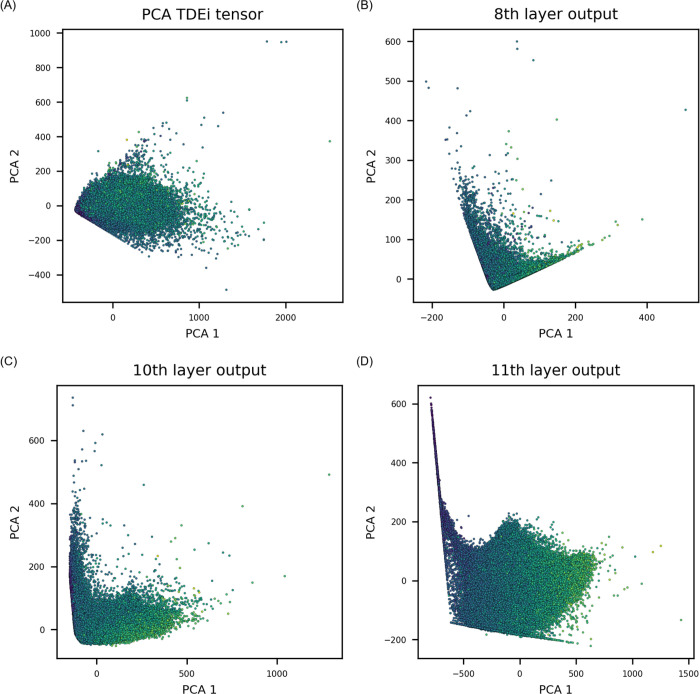
PCA was performed to exhibit how the feature space was varied as the TDEi tensor was processed within the VGGNet. In Figure 8, dots are brighter if the value is higher and darker if they are lower. Initially, the original TDEi tensor’s feature space established a low correlation with MP (Figure 8A). Once the TDEi tensor was processed up to the last convolutional layer (the 8th layer), compounds were well prioritized (Figure 8B). An additional pooling layer strengthened the trend in data distribution by separating compounds with a low melting point to the upper left side and a high melting point to the lower right side in the projected space (Figure 8C). When the extracted features from the convolutional layer and pooling layer were processed in a fully connected layer, most of the compounds were arranged with a stronger correlation with their MP values (Figure 8D).
Figure 8.
Results of principal component analysis (PCA). The MP prediction model was analyzed since it was developed with the largest dataset. Each point was colored based on the MP value: a brighter color implies a higher MP, whereas a darker color means a lower MP. (A) Initially, the TDEi tensor itself could not sufficiently prioritize compounds according to the MP. (B) Features extracted after the last convolutional layer showed that data points were arranged along the trend of MP values. (C) The trend was strengthened after the last average pooling layer, and (D) stronger correlation was established after the fully connected layer.
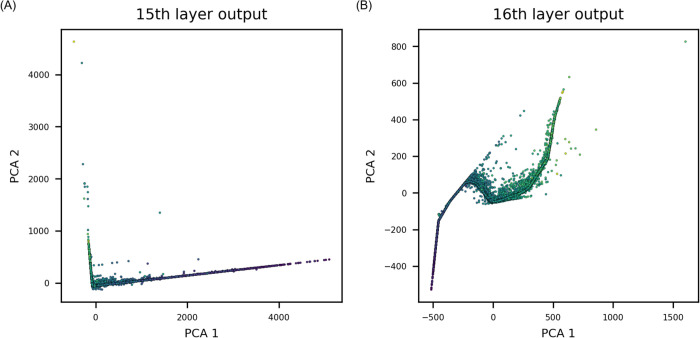
To examine the difference in feature extraction by deepening the VGGNet, PCA was identically performed with an increased number of convolutional layers. In Figure 6, the convolutional layer is applied once before the pooling layer. In the deeper VGGNet, convolutional layers were applied twice with identical hyperparameters before the pooling layer. Features from the last pooling layer, and the second fully connected layer were extracted and visualized (Figure 9). PCA showed that the features extracted after additional convolutional layers were strongly correlated with the MP. Lack of improvement in prediction accuracy even after the increase in correlation in the deeper VGGNet may be attributed to inherent experimental noise in the dataset.
Figure 9.
Results of using a deeper layer of VGGNet in feature space variation. Results shown in this figure were obtained by deepening the VGGNet in Figure 6 by applying a convolutional layer twice before the average pooling layer. (A) Features extracted from the last pooling layer prioritize compounds accurately. (B) After the fully connected layer, features were in stronger correlation with the target endpoint.
In the CNN models trained with image data, initially, the fundamental level of features was extracted, and a higher level of features was found as the layer went deeper. The EC is fundamental information compared to atom-level features; thus, the use of EC in the CNN was expected to fully harness the CNN’s automatic feature extraction capacity through filters establishing significant electron interactions for prediction of the target endpoint. According to the analysis of electron interactions in the CNN (Figure 6B,C), interactions with a wider range of electrons were established as the TDEi tensor passed through each convolution and average pooling layer, and interactions between all AOs were calculated by the last average pooling layer. Given that MOs were calculated through a combination of AOs, values from the 10th layer, which is the fifth pooling layer (Figure 6A), were similar to the molecular orbital values of a molecule. Thus, the CNN automatically extracts MO energy-like values through five convolution and pooling layers, and then these values were fed into fully-connected layers to calculate the physicochemical properties. Feature space variation in PCA supported this idea because the extracted features were rearranged with a stronger correlation toward the MP values as the layer went deeper.
Comparative Study between CNN Models for Drug Molecules
Most of DL studies used a GCN by defining molecular structure as a graph. In my best knowledge, there were only few studies that developed the CNN on drug molecule data. Application of CNN to molecular structure data was limited due to the lack of adequate method to convert a molecular structure into a 3D array. Meyer et al. used an image of a 2D structure as an input for the CNN.28 However, the use of a 2D image caused issue of structure standardization since the pixel of the image can be easily changed if a molecular structure image on 2D space was rotated. Moreover, chemical features cannot be extracted from the 2D image alone, and thus, Meyer et al. used an additional fingerprint-based prediction model to compensate the possible disadvantage of the image-based CNN model. Hirohara et al. used the SMILES matrix whose column is a one-hot encoded vector of each symbol in SMILES.15 Hirohara et al. used normalization algorithm on the SMILES string so that only one SMILES code is produced from a molecule. However, in this approach, the limitation is in applicable length of the SMILES code and production of sparse information in the matrix. Hirohara et al. fixed the size of matrix by 400 rows, maximum length of SMILES string, and 42 columns, length of SMILES symbols. Therefore, this is a limitation to calculate the SMILES matrix for a larger molecule whose SMILES string is longer than 400 characters, and also it produces large sparse matrix when a small-sized molecule was converted into the matrix. Karpov et al. used SMILES embedding to prepare the input for the CNN model.16 Preparation for SMILES embedding requires data augmentation and a Transformer architecture training. Once the Transformer encoder part was ready, then output of the encoder part becomes a fixed size of matrix, which is called SMILES embedding and used as an input for CNN to train the model for prediction of target endpoint. Thus, its computational cost is highly expensive.
The TDEi tensor efficiently standardizes chemical structures without extra training processes by converting atoms into AO-level information and applying a fixed-topological distance to produce an identically sized tensor regardless of size and complexity of a molecule. In the case of one-hot encoded matrix, a sparse matrix is produced since all vectors were zero except only one relevant position, while the use of an EC vector makes the TDEi tensor contain richer information than a one-hot encoded vector. Therefore, the TDEi tensor is a better way to overcome the standardization issue and input sparsity problem. The fact that the TDEi tensor has a shape of 3D array is also another advantage that all the CNN architectures developed in computer vision can be easily applied to the TDEi tensor. On the other hand, there is a disadvantage using a QM model of a molecule. DL models that defined a molecule as a graph can identify significant molecular fragments after the model was trained.13,15,16 However, the TDEi tensor cannot be used for molecular fragment identification since it is based on electrons within a molecule and topological distance between them.
Conclusions
Graphs and SMILES were the most commonly used molecular representations in DL-based QSAR models. In this study, a TDEi tensor was developed to represent molecular structures based on interactions between electrons within a molecule. The TDEi tensor was calculated following the steps as (1) AOs of each atom were described by an EC vector, which is a bit string according to the presence and absence of electrons in each AO based on their spin indicated by positive and negative signs, (2) the number of electron interactions were calculated based on EC vectors between two atoms, and (3) electron interactions in each topological distance were concatenated within a 3D array. The TDEi tensor prepared from a molecule was used as a CNN model input.
Modified VGGNet was trained with the TDEi tensor as an input to predict four physicochemical properties: MP, Lipop, Esol, and Freesolv. The TDEi tensor was designed to be adjustable by changing EC vector size and depth of topological distance in order to cope with structural diversity and small size dataset. The result in the preliminary search showed that appropriate option for EC vector and topological distance depth were varied for each dataset. When VGGNet was optimized for each endpoint, models achieved good prediction accuracy.
In VGGNet, it was expected that the network weighs each electron interactions automatically to predict the target endpoint. In order to visualize the assumption, MP data was analyzed. When feature space changes were traced by PCA, a stronger correlation was found between the features and the target endpoint as features were extracted from the deeper layer.
Glossary
List of Abbreviations
- TDEi
topological distance-based electron interaction
- CNN
convolutional neural network
- QSAR
quantitative structure–activity relationship
- ML
machine learning
- GCN
graph convolutional neural network
- DNN
deep neural network
- SMILES
simplified molecular input line entry system
- QM
quantum mechanics
- EC
electron configuration
- AO
atomic orbital
- MO
molecular orbital
- MP
melting point
- Lipop
octanol/water distribution coefficient
- Esol
water solubility
- Freesolv
hydration free energy
- MAE
mean absolute error
- NMAE
normalized MAE
- Sr
Spearman’s rank correlation coefficient
- PCA
principal component analysis
Supporting Information Available
The Supporting Information is available free of charge at https://pubs.acs.org/doi/10.1021/acsomega.1c05693.
(Table S1) Preliminary results on MP for selection of the best TDEi tensor option, (Table S2) preliminary results on logP for selection of the best TDEi tensor option, (Table S3) preliminary results on logS for selection of the best TDEi tensor option, and (Table S4) preliminary results on hydration free energies for selection of the best TDEi tensor option (XLSX)
Codes and files for the TDEi tensor calculation (the code is also available in GitHub (https://github.com/shkdidrlf/TDEi_tensor)) (ZIP)
This work was financially supported by a National Research Foundation of Korea (NRF) grant funded by the Korean Government (MSIT) (no. NRF-2019R1F1A1061955).
The author declares no competing financial interest.
Notes
All the datasets used in this work are under a CC-BY license. The code is available in the supplementary information and GitHub (https://github.com/shkdidrlf/TDEi_tensor). (1) URL for MP data source:22https://figshare.com/articles/dataset/Melting_Point_and_Pyrolysis_Point_Data_for_Tens_of_Thousands_of_Chemicals/2007426 and (2) URL for Lipop, Esol, and Freesolv data source:11https://static-content.springer.com/esm/art%3A10.1186%2Fs13321-020-00479-8/MediaObjects/13321_2020_479_MOESM1_ESM.zip.
Notes
Not applicable.
Supplementary Material
References
- Cherkasov A.; Muratov E. N.; Fourches D.; Varnek A.; Baskin I. I.; Cronin M.; Dearden J.; Gramatica P.; Martin Y. C.; Todeschini R.; Consonni V.; Kuz’min V. E.; Cramer R.; Benigni R.; Yang C.; Rathman J.; Terfloth L.; Gasteiger J.; Richard A.; Tropsha A. QSAR modeling: Where have you been? Where are you going to?. J. Med. Chem. 2014, 57, 4977–5010. 10.1021/jm4004285. [DOI] [PMC free article] [PubMed] [Google Scholar]
- Piñero J.; Furlong L. I.; Sanz F. In silico models in drug development: Where we are. Curr. Opin. Pharmacol. 2018, 42, 111–121. 10.1016/j.coph.2018.08.007. [DOI] [PubMed] [Google Scholar]
- Shin H. K.; Kang Y. M.; No K. T.. Predicting ADME properties of chemicals. In Handbook of computational chemistry; Leszczynski J.; Kaczmarek-Kedziera A.; Puzyn T.; Papadopoulos M. G., Eds. Springer: Cham, 2017, pp. 2265–2301. [Google Scholar]
- Huang J.; Fan X. Why QSAR fails: An empirical evaluation using conventional computational approach. Mol. Pharmaceutics 2011, 8, 600–608. 10.1021/mp100423u. [DOI] [PubMed] [Google Scholar]
- Kim H.; Kim E.; Lee I.; Bae B.; Park M.; Nam H. Artificial intelligence in drug discovery: A comprehensive review of data-driven and machine learning approaches. Biotechnol. Bioprocess Eng. 2020, 25, 895–930. 10.1007/s12257-020-0049-y. [DOI] [PMC free article] [PubMed] [Google Scholar]
- Cova T. F. G. G.; Pais A. A. C. C. Deep learning for deep chemistry: Optimizing the prediction of chemical patterns. Front. Chem. 2019, 7, 809. 10.3389/fchem.2019.00809. [DOI] [PMC free article] [PubMed] [Google Scholar]
- Jiménez-Luna J.; Grisoni F.; Schneider G. Drug discovery with explainable artificial intelligence. Nat. Mach. Intell. 2020, 2, 573–584. 10.1038/s42256-020-00236-4. [DOI] [Google Scholar]
- Wu Z.; Ramsundar B.; Feinberg E. N.; Gomes J.; Geniesse C.; Pappu A. S.; Leswing K.; Pande V. MoleculeNet: a benchmark for molecular machine learning. Chem. Sci. 2018, 9, 513–530. 10.1039/C7SC02664A. [DOI] [PMC free article] [PubMed] [Google Scholar]
- Cui Q.; Lu S.; Ni B.; Zeng X.; Tan Y.; Chen Y. D.; Zhao H. Improved prediction of aqueous solubility of novel compounds by going deeper with deep learning. Front. Oncol. 2020, 10, 121. 10.3389/fonc.2020.00121. [DOI] [PMC free article] [PubMed] [Google Scholar]
- Xu Y.; Dai Z.; Chen F.; Gao S.; Pei J.; Lai L. Deep learning for drug-induced liver injury. J. Chem. Inf. Model. 2015, 55, 2085–2093. 10.1021/acs.jcim.5b00238. [DOI] [PubMed] [Google Scholar]
- Jiang D.; Wu Z.; Hsieh C.-Y.; Chen G.; Liao B.; Wang Z.; Shen C.; Cao D.; Wu J.; Hou T. Could graph neural networks learn better molecular representation for drug discovery? A comparison study of descriptor-based and graph-based models. Aust. J. Chem. 2021, 13, 12. 10.1186/s13321-020-00479-8. [DOI] [PMC free article] [PubMed] [Google Scholar]
- Chen H.; Engkvist O.; Wang Y.; Olivecrona M.; Blaschke T. The rise of deep learning in drug discovery. Drug Discovery Today 2018, 23, 1241–1250. 10.1016/j.drudis.2018.01.039. [DOI] [PubMed] [Google Scholar]
- Xiong Z.; Wang D.; Liu X.; Zhong F.; Wan X.; Li X.; Li Z.; Luo X.; Chen K.; Jiang H.; Zheng M. Pushing the boundaries of molecular representation for drug discovery with the graph attention mechanism. J. Med. Chem. 2020, 63, 8749–8760. 10.1021/acs.jmedchem.9b00959. [DOI] [PubMed] [Google Scholar]
- Weininger D. SMILES, a chemical language and information system. 1. Introduction to methodology and encoding rules. J. Chem. Inf. Comput. Sci. 1988, 28, 31–36. 10.1021/ci00057a005. [DOI] [Google Scholar]
- Hirohara M.; Saito Y.; Koda Y.; Sato K.; Sakakibara Y. Convolutional neural network based on SMILES representation of compounds for detecting chemical motif. BMC Bioinf. 2018, 19, 526. 10.1186/s12859-018-2523-5. [DOI] [PMC free article] [PubMed] [Google Scholar]
- Karpov P.; Godin G.; Tetko I. V. Transformer-CNN: Swiss knife for QSAR modeling and interpretation. Aust. J. Chem. 2020, 12, 17. 10.1186/s13321-020-00423-w. [DOI] [PMC free article] [PubMed] [Google Scholar]
- Karelson M.; Lobanov V. S.; Katritzky A. R. Quantum-chemical descriptors in QSAR/QSPR studies. Chem. Rev. 1996, 96, 1027–1044. 10.1021/cr950202r. [DOI] [PubMed] [Google Scholar]
- Hemmateenejad B.; Yousefinejad S.; Mehdipour A. R. Novel amino acids indices based on quantum topological molecular similarity and their application to QSAR study of peptides. Amino Acids 2011, 40, 1169–1183. 10.1007/s00726-010-0741-x. [DOI] [PubMed] [Google Scholar]
- Yousefinejad S.; Hemmateenejad B.; Mehdipour A. R. New autocorrelation QTMS-based descriptors for use in QSAM of peptides. J. Iran. Chem. Soc. 2012, 9, 569–577. 10.1007/s13738-012-0070-y. [DOI] [Google Scholar]
- Shin H. K. Electron configuration-based neural network model to predict physicochemical properties of inorganic compounds. RSC Adv. 2020, 10, 33268–33278. 10.1039/D0RA05873D. [DOI] [PMC free article] [PubMed] [Google Scholar]
- Shin H. K.; Kim S.; Yoon S. Use of size-dependent electron configuration fingerprint to develop general prediction models for nanomaterials. NanoImpact 2021, 21, 100298. 10.1016/j.impact.2021.100298. [DOI] [PubMed] [Google Scholar]
- Tetko I. V.; Lowe D. M.; Williams A. J. The development of models to predict melting and pyrolysis point data associated with several hundred thousand compounds mined from PATENTS. Aust. J. Chem. 2016, 8, 2. 10.1186/s13321-016-0113-y. [DOI] [PMC free article] [PubMed] [Google Scholar]
- Abadi M.; Agarwal A.; Barham P.; Brevdo E.; Chen Z.; Citro C.; Corrado G. S.; Davis A.; Dean J.; Devin M.; Ghemawat S.; Goodfellow I.; Harp A.; Irving G.; Isard M.; Jozefowicz R.; Jia Y.; Kaiser L.; Kudlur M.; Levenberg J.; Mané D.; Schuster M.; Monga R.; Moore S.; Murray D.; Olah C.; Shlens J.; Steiner B.; Sutskever I.; Talwar K.; Tucker P.; Vanhoucke V.; Vasudevan V.; Viégas F.; Vinyals O.; Warden P.; Wattenberg M.; Wicke M.; Yu Y.; Zheng X.. TensorFlow: Large-scale machine learning on heterogeneous systems; Google, 2015. [Google Scholar]
- Alexander D. L. J.; Tropsha A.; Winkler D. A. Beware of R2: Simple, unambiguous assessment of the prediction accuracy of QSAR and QSPR models. J. Chem. Inf. Model. 2015, 55, 1316–1322. 10.1021/acs.jcim.5b00206. [DOI] [PMC free article] [PubMed] [Google Scholar]
- Seo M.; Shin H. K.; Myung Y.; Hwang S.; No K. T. Development of natural compound molecular fingerprint (NC-MFP) with the dictionary of natural products (DNP) for natural product-based drug development. Aust. J. Chem. 2020, 12, 6. 10.1186/s13321-020-0410-3. [DOI] [PMC free article] [PubMed] [Google Scholar]
- Shin H. K.; Lee S.; Oh H. N.; Yoo D.; Park S.; Kim W. K.; Kang M. G. Development of blood brain barrier permeation prediction models for organic and inorganic biocidal active substances. Chemosphere 2021, 277, 130330. 10.1016/j.chemosphere.2021.130330. [DOI] [PubMed] [Google Scholar]
- Zhao L.; Wang W.; Sedykh A.; Zhu H. Experimental errors in QSAR modeling sets: What we can do and what we cannot do. ACS Omega 2017, 2, 2805–2812. 10.1021/acsomega.7b00274. [DOI] [PMC free article] [PubMed] [Google Scholar]
- Meyer J. G.; Liu S.; Miller I. J.; Coon J. J.; Gitter A. Learning drug functions from chemical structures with convolutional neural networks and random forests. J. Chem. Inf. Model. 2019, 59, 4438–4449. 10.1021/acs.jcim.9b00236. [DOI] [PMC free article] [PubMed] [Google Scholar]
Associated Data
This section collects any data citations, data availability statements, or supplementary materials included in this article.


