

Summary
Millions of people die from liver diseases annually, and liver failure is one of the three major outcomes of liver disease. The gut microbiota plays a crucial role in liver diseases. This study aimed to explore the effects of Lactobacillus casei strain Shirota (LcS), a probiotics used widely around the world, on acute liver injury (ALI), as well as the underlying mechanism. Sprague Dawley rats were intragastrically administered LcS suspensions or placebo once daily for 7 days before induction of ALI by intraperitoneal injection of D‐galactosamine (D‐GalN). Histopathological examination and assessments of liver biochemical markers, inflammatory cytokines, and the gut microbiota, metabolome and transcriptome were conducted. Our results showed that pretreatment with LcS reduced hepatic and intestinal damage and reduced the elevation of serum gamma‐glutamyltranspeptidase (GGT), total bile acids, IL‐5, IL‐10, G‐CSF and RANTES. The analysis of the gut microbiota, metabolome and transcriptome showed that LcS lowered the ratio of Firmicutes to Bacteroidetes; reduced the enrichment of metabolites such as chenodeoxycholic acid, deoxycholic acid, lithocholic acid, d‐talose and N‐acetyl‐glucosamine, reduce the depletion of d‐glucose and l‐methionine; and alleviated the downregulation of retinol metabolism and PPAR signalling and the upregulation of the pyruvate metabolism pathway in the liver. These results indicate the promising prospect of using LcS for the treatment of liver diseases, particularly ALI.
The aim of this study is to evaluate the effect of pretreatment with the probiotic Lactobacillus casei Shirota (LcS) on acute liver injury (ALI) in rats. LcS administration ameliorates ALI‐related organ damage, alleviating inflammatory status and metabolic disorders. Furthermore, the LcS‐reshaped gut microbiota is shown to modulate liver injury‐related signalling pathways and enterohepatic cross‐talk. These findings support the use of LcS as a promising functional food additive in liver disease treatments.

Introduction
Liver injury can be induced by various factors, such as drug abuse, bile duct ligation, fat‐enriched and choline‐deficient diets, and viral infection. Without proper treatment, patients with severe liver injury may experience acute liver failure (ALF). Large areas of hepatocyte necrosis or severe damage to liver functions accompanied by hepatic encephalopathy are often observed in this process, which often leads to multiple organ failure (Stravitz and Lee, 2019). Although artificial liver support systems and liver transplants play important roles in treatment, the mortality rate of ALF is still very high (Squires et al., 2018). Thus, the need to develop new prevention and treatment methods is still urgent. Alterations in the gut microbiota, such as decreases in microbial diversity, depletions of beneficial bacteria and enrichment of opportunistic pathogens, are frequently reported in liver diseases, including liver injury/failure (Lv et al., 2019). Furthermore, some microbes and their products can invade the circulatory system, resulting in immune dysregulation, infection and inflammation, which continuously contribute to liver failure and even death (Donnelly et al., 2016). Therefore, increasing attention has been paid to methods improving the gut microbiota, especially those involving probiotics, to prevent and treat liver injury/failure (Dailey et al., 2019; Jiang et al., 2020; Yang et al., 2020).
The species Lactobacillus casei is widely distributed in the mammalian intestines, and it includes a large group of strains used in food product fermentation. Among them, L. casei Shirota (LcS) is one of the most studied and used probiotics in the world. Drinking fermented beverages containing LcS can significantly reduce the severity of constipation (Koebnick et al., 2003; Aoki et al., 2014) and regulate stool consistency (Chen et al., 2019). When LcS was used to treat allergic rhinitis, allergen‐induced serum IL‐5, IL‐6, IFN‐γ and IgE levels were significantly reduced in patients, while specific IgG was increased (Ivory et al., 2008). LcS can also improve the treatment outcomes of osteoarthritis in the knee by reducing serum hypersensitive C‐reactive protein levels (Lei et al., 2017), improve sleep quality by alleviating stress‐related symptoms (Takada et al., 2017), and favourably affect metabolic abnormalities in obese prediabetic subjects (Naito et al., 2018). Moreover, LcS can reduce the incidence and duration of upper respiratory infections in middle‐aged office workers (Shida et al., 2017), and it can be used as a supplement to improve the efficacy of antibiotics against fast breathing pneumonia in children (Li et al., 2018). In particular, when the elderly take LcS, it can improve NK cell activity and tends to produce a more anti‐inflammatory cytokine profile (Dong et al., 2013), in addition to increasing the number of beneficial bacteria in the faeces, promoting gastrointestinal health (Aoyagi et al., 2019), and reducing the risk of high blood pressure (Aoyagi et al., 2017).
d‐galactosamine (D‐GalN) is a compound with highly selective hepatotoxicity. Liver injury induced by D‐GalN is reproducible and is applicable to the study of acute liver injury (ALI) or ALF (Muntane et al., 2000; Cauli et al., 2011). In this study, we investigated the effects of LcS on ALI and the related mechanisms using a D‐GalN‐induced liver injury rat model.
Results
LcS attenuated the hepatic dysfunction and excessive inflammatory response induced by D‐GalN
Levels of 14 liver function indicators and twenty‐three inflammatory cytokines were assessed (Table S2). Serum alanine aminotransferase (ALT), aspartate aminotransferase (AST), alkaline phosphatase (ALP), total bile acid (TBA), gamma‐glutamyltranspeptidase (GGT), glycyl‐proline dipeptidyl aminopeptidase (GPDA), total bilirubin (TBIL) and direct bilirubin (DBIL) levels were significantly elevated in the positive control (PC) group compared with the healthy control (HC) group. However, LcS reduced the increases in GGT and TBA induced by D‐GalN (Fig. 1A). Similarly, the levels of 23 tested cytokines were significantly higher in the PC group than in the HC group. Pretreatment with LcS significantly reduced the increases in IL‐5, IL‐10, G‐CSF and RANTES induced by D‐GalN (Fig. 1B).
Fig. 1.
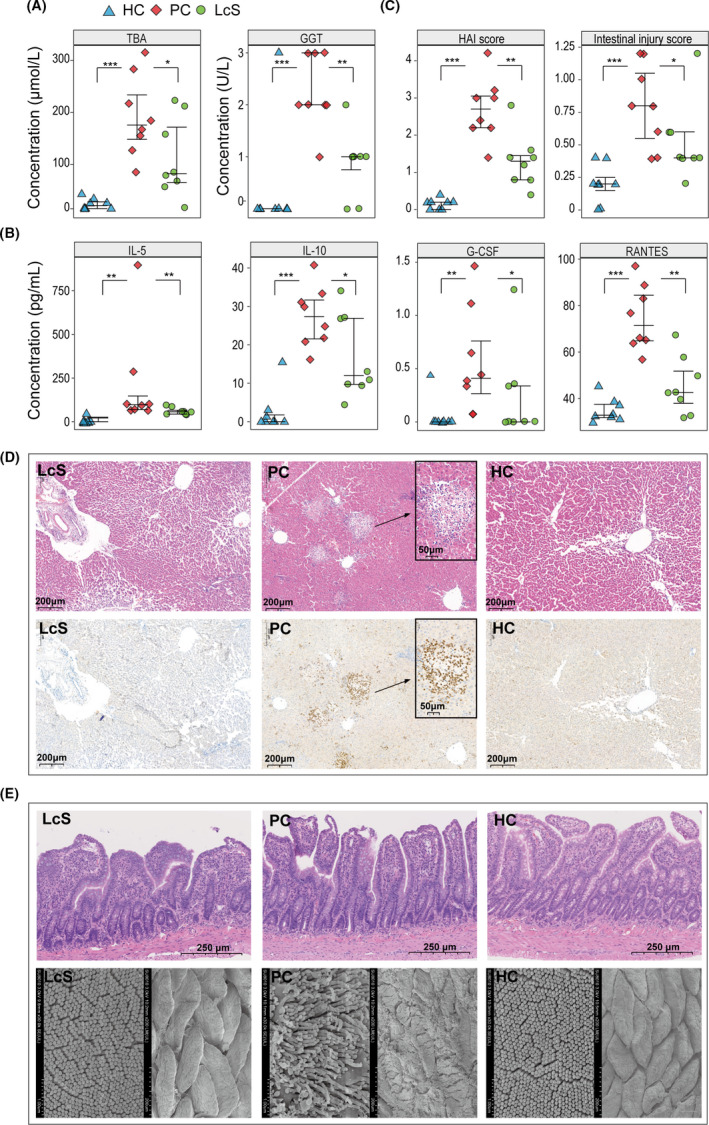
LcS alleviated the hepatic dysfunction, excessive inflammatory response and hepatic and intestinal damage induced by D‐GalN. A. Concentrations of TBA and GGT in serum samples. B. Concentrations of IL‐5, IL‐10, G‐CSF and RANTES in plasma samples. C. HAI score and intestinal injury score based on eight samples in each group. D. Representative images of liver samples stained by H&E and immunohistochemistry. E. Representative images of the terminal ileum samples stained by H&E and the intestinal villus ultrastructure under scanning electron microscopy. (*P < 0.05; **P < 0.01; ***P < 0.001).
LcS partially alleviated the hepatic and intestinal damage induced by D‐GalN
Histopathological examination revealed that both the liver and terminal ileum exhibited histological abnormalities after D‐GalN injection. As shown in the photomicrographs of liver haematoxylin and eosin (H&E) and immunohistochemistry staining (Fig. 1D), inflammatory cell infiltration, high myeloperoxidase (MPO) expression in neutrophils and hepatocyte necrosis, degeneration and apoptosis were observed in the PC group; however, these histological injuries and the elevation in histological activity index (HAI) score were ameliorated in the LcS group which was pretreated with LcS prior to injection with D‐GalN (Fig. 1C). Meanwhile, LcS pretreatment also alleviated the intestinal epithelial damage caused by D‐GalN. Because there were fewer subepithelial Gruenhagen’s spaces and a more intact mucosal structure, the LcS group had lower intestinal injury score than the PC group (Fig. 1C and E). In addition, abnormal enterocyte ultrastructure, including atrophied villi and sparse microvilli, was also alleviated by LcS in the PC group (Fig. 1E).
LcS tended to alleviate D‐GalN‐induced alterations in gut microbiota
We obtained a total of 1 768 613 reads from 24 faecal samples of three groups by 16S rDNA amplicon sequencing. Alpha‐diversity analyses showed that the flora diversities of both the PC and LcS groups as estimated by the Shannon index were significantly different from those of the HC group, while the species richness as predicted by the Chao1 index was not different between any two groups (Fig. 2A). For beta‐diversity, a principal coordinates analysis (PCoA) based on the unweighted UniFrac method demonstrated that the overall microbial composition of the three groups varied (Fig. 2B). The results of a permutational multivariate analysis of variance (PERMANOVA, pseudo‐F = 2.33, P = 0.001), an analysis of similarities (ANOSIM, R = 0.41, P = 0.001) and a nonmetric multidimensional scaling analysis (NMDS, stress value = 0.11, Fig. 2B) also indicated significant differences in microbial composition between the three groups.
Fig. 2.
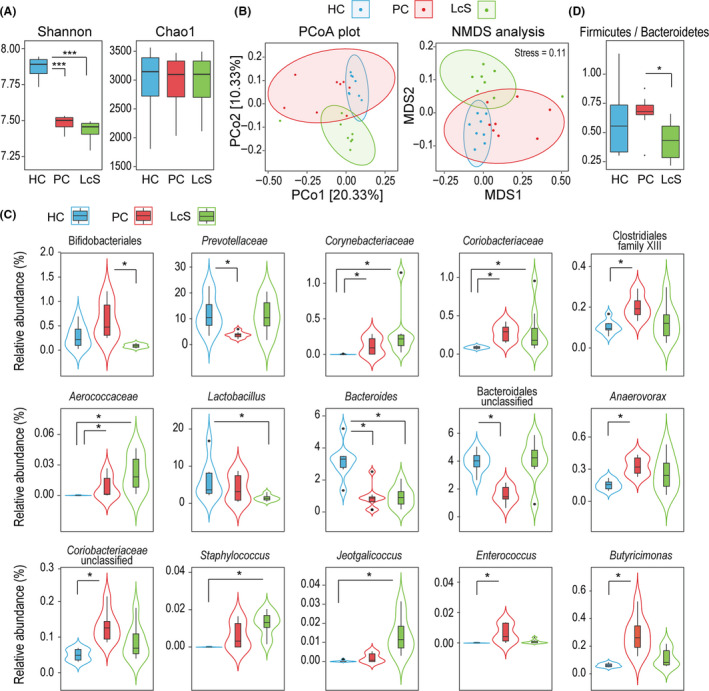
Surveys of the 16S rDNA gene revealed that LcS tended to alleviate D‐GalN‐induced alterations in the gut microbiota. A. Box plot of species richness and flora diversities estimated by the Chao1 index and the Shannon index, respectively. B. Two‐dimensional PCoA plot and NMDS analysis based on an unweighted UniFrac matrix. C. Alterations in the relative abundance of bacterial taxa between the LcS, PC and HC groups. D. The ratio of Firmicutes to Bacteroidetes. (*P adj < 0.05; **P adj < 0.01; ***P adj < 0.001).
We further analysed alterations in the relative abundance of bacterial taxa during this process (Table S3). When the PC and HC groups were compared, all of the predominant taxa (relative abundances were more than 1% in at least one group) that were significantly depleted belong to the phylum Bacteroidetes, such as Bacteroides (PC vs. HC, 0.92% vs. 3.19%, P adj = 0.028) and Prevotellaceae (PC vs. HC, 3.45% vs. 11.81%, P adj = 0.046). In contrast, several taxa from the phylum Actinobacteria, such as Corynebacteriaceae and Coriobacteriaceae, as well as several taxa from the phylum Firmicutes, such as Clostridiales family XIII, Anaerovorax and Enterococcus, were significantly enriched in the PC group (Fig. 2C).
Only the order Bifidobacteriales was altered (P adj = 0.026) and shown to be depleted in the LcS group compared with the PC group. However, the ratio of Firmicutes to Bacteroidetes, a significant indicator of gut microbiota health, was significantly lower in the LcS group than in the PC group (P = 0.015). This ratio was not significantly different between the HC and PC or the HC and LcS groups (Fig. 2D). This result indicates that LcS may alleviate liver injury by regulating the overall structure of the gut microbiota. A comparison of the gut microbiota between the LcS and HC groups indirectly confirmed that LcS tended to alleviate two D‐GalN‐induced effects: depletion of some taxa belonging to the phylum Bacteroidetes and enrichment of some taxa belonging to the phylum Firmicutes. For example, compared to its level in the HC group, Prevotellaceae was not depleted in the LcS group as it was in the PC group. Furthermore, the taxa belonging to the phylum Firmicutes that were massively enriched in the HC group were depleted in the LcS group. For example, Lactobacillus (LcS vs. HC, 1.48% vs. 5.99%, P adj = 0.027) was depleted in the LcS group.
LcS alleviated D‐GalN‐induced metabolic disorder
To determine the effects of LcS on the gut metabolome, we analysed faecal samples using gas chromatography–mass spectrometry (GC‐MS). A total of 84 compounds were identified from the HC, PC and LcS groups. The orthogonal partial least squares discriminant analysis (OPLS‐DA) illustrated that the metabolic profiles of the LcS, PC and HC groups were clearly separated from each other (Fig. 3A), indicating significant differences in their metabolomic profiles. When variable importance in the projection (VIP) values >1.5 were used as the screening threshold, twelve compounds (pentadecanoic acid, campesterol, pentanedioic acid, d‐fructose, pantothenic acid, 4‐hydroxybenzeneacetic acid, dodecanol, pentanoic acid, l‐phenylalanine, hexadecanol, lathosterol and ethanolamine) were determined to be the main contributors to the discrimination between the PC and HC groups. However, paullinic acid, behenic acid, d‐glucose, trisaminol, octadecanol and pentadecanol contributed prominently to the discrimination between the PC and LcS groups. When the level of each metabolite was compared, LcS reversed not only the enrichment of faecal chenodeoxycholic acid (CDCA), deoxycholic acid (DCA), lithocholic acid (LCA), d‐talose and N‐acetyl‐glucosamine but also the depletion of d‐glucose and l‐methionine induced by D‐GalN. Furthermore, the levels of paullinic acid, octadecanol, pentadecanol and lathosterol were higher in LcS faeces than in PC faeces, while the level of stigmastanol was lower in the former. Notably, the levels of paullinic acid, octadecanol, pentadecanol and stigmastanol were not significantly different between the HC and PC groups, while the levels of hexadecanol and lathosterol were higher in the PC group than in the HC group (Fig. 3B and C).
Fig. 3.
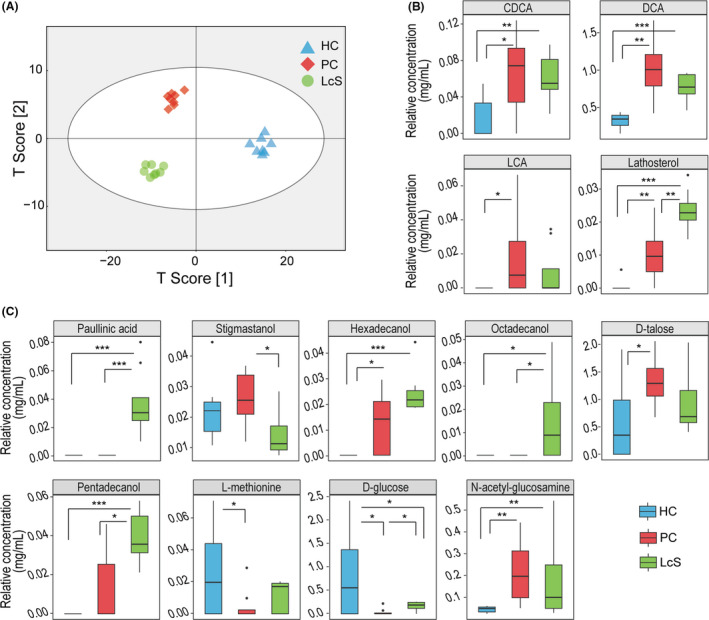
LcS alleviated D‐GalN‐induced metabolic disorder. A. OPLS‐DA illustrated that the metabolic profiles of the LcS, PC and HC groups were clearly separated from each other. B and C. The relative concentrations of thirteen gut metabolites were different between the LcS, PC and HC groups. (*P adj < 0.05; **P adj < 0.01; ***P adj < 0.001).
LcS partially reversed D‐GalN‐induced transcriptional regulatory changes
The transcription of 82 liver genes was significantly different both between HC and PC and between LcS and PC (Figs 4A and 5A). First, LcS alleviated the D‐GalN‐induced transcriptional upregulation of 28 liver genes including Ccl11, Lif and Il11, which function in cytokine activity, and Ch25h, Fasn and Fads2, which function in bile acid (BA) and lipid metabolism processes. Second, LcS alleviated the D‐GalN‐induced transcriptional downregulation of 54 liver genes including Abcb4, Cldn1, Serpina7, Insig2, Cyp17a1, Ctsl, Slc25a22 and Tdo2, which function in response to fatty acids, FXR (Nr1h4), BSEP (Abcb11) and NTCP (SlC10a1), which function in BA synthesis and transport, and Acpp, Kynu, Acot5, G6pc and Gckr, which function in purine‐containing compound metabolic processes. Third, KEGG pathway enrichment analysis further confirmed that LcS significantly alleviated D‐GalN‐induced downregulation of retinol metabolism and the PPAR signalling pathway, as well as D‐GalN‐induced upregulation of the pyruvate metabolism pathway (Fig. 5B). To validate the transcriptome results, we conducted RT‐qPCR analysis of representative genes in liver, including BA synthesis and transport‐related genes (Abcb11, Slc10a1, Nr1h4 and Cyp7a1) and inflammation‐related genes (TLR4, TLR5, etc.); we found that their expression was similar to that in the transcriptome analysis (Fig. S1).
Fig. 4.
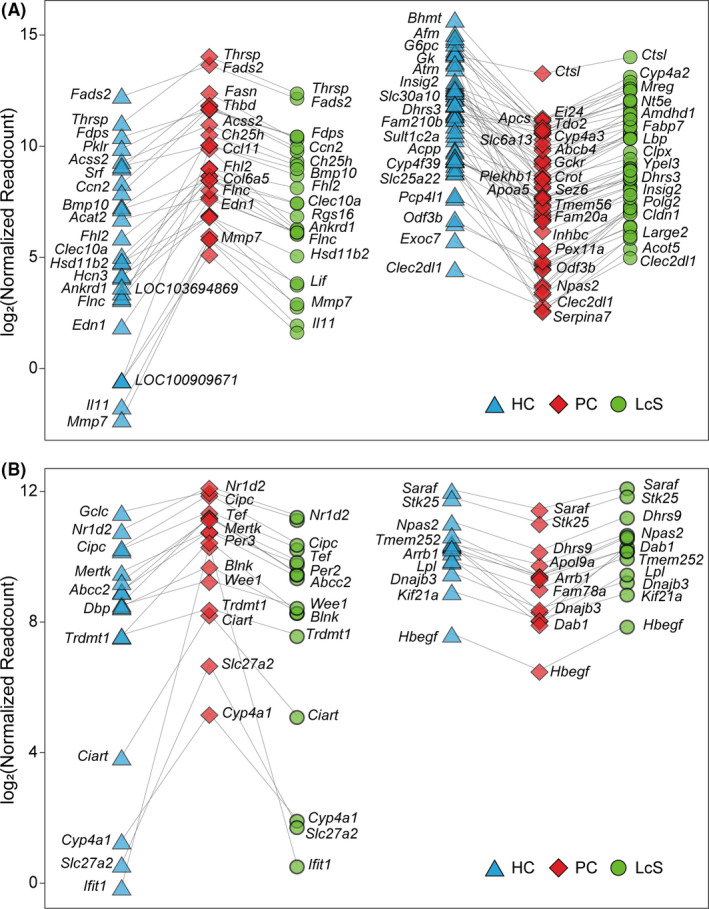
LcS partially reverses transcriptional regulatory changes. A. Eighty‐two hepatic genes were differentially transcribed in both HC versus PC and LcS versus PC. Among them, LcS reversed the upregulation of 28 genes and the downregulation of 54 genes induced by D‐GalN. B. Thirty‐two gut genes were differentially transcribed in both HC versus PC and LcS versus PC. Among them, LcS reversed the upregulation of 17 genes and the downregulation of 15 genes induced by D‐GalN. (*P adj < 0.05; **P adj < 0.01; ***P adj < 0.001).
Fig. 5.
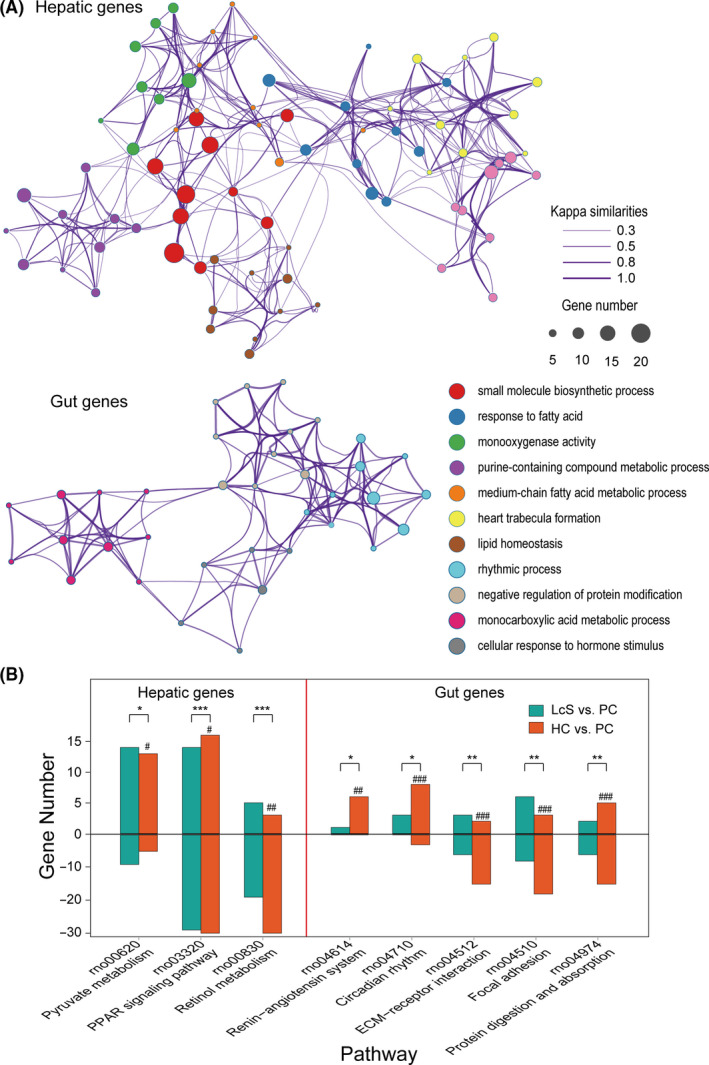
Function classification and pathway analysis of the differentially transcribed genes. A. Enrichment networks of the hepatic and gut genes whose differential transcription was caused by D‐GalN or LcS based on GO functional classification and clustering analysis. All the enriched functional sets (P adj < 0.05) are represented by different nodes and clustered by colour. The pairs of nodes are connected by their Kappa similarities. B. KEGG enrichment analysis of hepatic and gut genes whose differential transcription was caused by D‐GalN or LcS. The number of upregulated genes is shown above the zero axis, and the number of downregulated genes is shown below the zero axis. Enrichment significance in LcS versus PC: *P adj < 0.05, **P adj < 0.01, ***P adj < 0.001; enrichment significance in HC versus PC: #P adj < 0.05, ##P adj < 0.01, ###P adj < 0.001.
The comparisons of the gut transcriptomes among the HC, PC and LcS groups showed that the transcription of 32 genes was significantly different between both the HC and PC groups and between the PC and LcS groups (Figs 4B and 5A). First, LcS reduced the transcriptional upregulation of 17 gut genes induced by D‐GalN, including Cyp4a1 and Slc27a2, which are involved in PPAR signalling, and Ciart, Cipc, Dpb, Nr1d2, Tef, Per2 and Per3, which function in rhythmic processes. Second, LcS alleviated the transcriptional downregulation of 15 gut genes caused by D‐GalN, including Arntl, Arrb1 and Dhrs9, which function in the regulation of hormone levels, and Dab1 and Stk25, which function in the positive regulation of protein kinase activity. Third, the KEGG pathway enrichment analysis further confirmed that LcS significantly alleviated the D‐GalN‐induced downregulation of focal adhesion, ECM‐receptor interaction signalling and the protein digestion and absorption pathway, as well as the D‐GalN‐induced upregulation of the renin‐angiotensin system and the circadian rhythm pathway (Fig. 5B).
Altered gut bacteria, metabolites, serum cytokines, gut genes and liver genes were significantly correlated with each other
As shown in the results of the correlation analysis of the gut microbiota and faecal metabolites (Fig. 6A), paullinic acid, hexadecanol, octadecanol, pentadecanol, CDCA, lathosterol, DCA and LCA were negatively correlated with potentially beneficial bacteria, such as those in the taxa Bifidobacteriales, Bacteroides and Lactobacillus, and positively correlated with potentially harmful bacteria such as those in the taxa Enterococcus, Coriobacteriaceae and Corynebacteriaceae. Prevotellaceae was negatively correlated with d‐talose and N‐acetyl‐glucosamine but positively correlated with d‐glucose. LCA, stigmastanol, d‐talose and N‐acetyl‐glucosamine were positively correlated with several members of the Bifidobacteriales, the Coriobacteriaceae, Lactobacillus and Enterococcus. In addition, d‐glucose and l‐methionine were negatively correlated with Bifidobacteriales and Enterococcus.
Fig. 6.
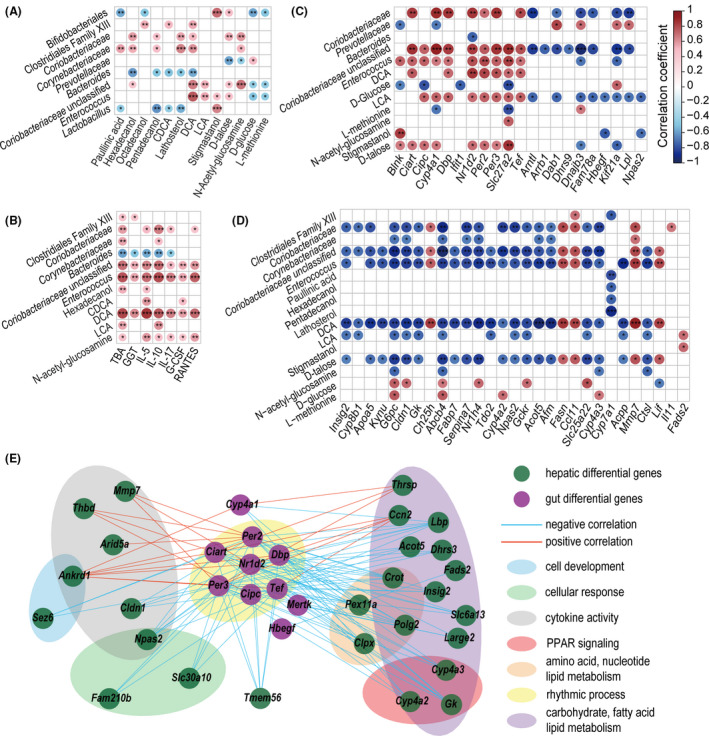
Associations between significantly altered variables from liver functions, inflammatory responses, and the gut microbiome, metabolome and transcriptome. A. Correlations of altered gut microbes and altered gut metabolites. B. Correlations of altered gut microbes and metabolites with altered liver function indicators and inflammatory cytokines. C. Correlations of altered gut microbes and metabolites with altered hepatic genes. D. Correlations of altered gut microbes and metabolites with altered gut genes. E. Cross‐talk of 10 differentially expressed gut genes and their associated 26 hepatic differentially expressed genes. Genes are classified by function and designated by areas of different colours. (*P < 0.05; **P < 0.01; ***P < 0.001).
As correlations of the gut microbiota or metabolites with liver function indicators and inflammatory cytokines showed (Fig. 6B), IL‐5, IL‐10, L‐17, G‐CSF, RANTES, GGT and TBA were positively correlated with potentially harmful bacteria such as Coriobacteriaceae and Enterococcus and with the metabolites hexadecanol, LCA, CDCA, DCA and N‐acetyl‐glucosamine.
The transcription of some gut genes was correlated mainly with the faecal levels of Coriobacteriaceae, Enterococcus, DCA, LCA and d‐talose (Fig. 6C). For example, these bacterial taxa and metabolites were positively correlated with at least one of the following genes: Cyp4a1 and Slc27a2 (located in the PPAR signalling pathway), Nr1d2, Per2 and Per3 (related to the circadian rhythm pathway), and Blnk and Ifit1 (related to immunity); however, they were negatively correlated with genes such as Dnajb3, Fam78a, Hbegf, Kif21a and Lpl. In contrast, the correlations of some gut genes with Prevotellaceae, Bacteroides, d‐glucose and l‐methionine were the opposite of their correlations with Coriobacteriaceae, Enterococcus, DCA, LCA and d‐talose.
The correlation of liver gene transcription with the levels of Coriobacteriaceae, Corynebacteriaceae, Enterococcus, Clostridiales family XIII, hexadecanol, pentadecanol, paullinic acid, lathosterol, DCA, LCA, d‐talose, N‐acetyl‐glucosamine and stigmastanol were generally the opposite of their correlation with Prevotellaceae, d‐glucose and l‐methionine (Fig. 6D). For example, liver genes such as Cyp8b1, Apoa5, Gk and Fabp7, which are involved in PPAR signalling, were negatively correlated with at least one of the following: Coriobacteriaceae, Corynebacteriaceae, Enterococcus, DCA, LCA and d‐talose. Inflammatory genes such as Lif, Mmp7 and Ccl11 were positively correlated with DCA, LCA and d‐talose but negatively correlated with d‐glucose.
Comprehensive correlations were found between 32 gut genes and 82 liver genes. When P < 0.001 was used as the screening threshold, the transcription levels of 10 gut genes were closely correlated with those of 26 liver genes (Fig. 6E). Gut Nr1d2 and Ciart were widely and significantly correlated with the observed liver genes. Notably, the correlation coefficient between the two rhythmic process‐related genes gut Nr1d2 and liver Npas2 was nearly −1. In addition, gut Per2 and Per3, which are related to the period circadian clock, were also correlated with at least two liver genes.
Discussion
LcS is a probiotic widely used throughout the world. Increasing attention has been focused on the role of LcS in health and diseases. Meanwhile, millions of people die from liver diseases annually (Stravitz and Lee, 2019). Liver failure is one of the three major outcomes of liver diseases, along with liver cirrhosis and liver cancer. Therefore, in this work, we evaluated the effects of LcS on ALI and explored a potential mechanism using a rat model of liver injury induced by D‐GalN. Our results showed that LcS reduced hepatic damage; alleviated the elevation of serum GGT, IL‐5, IL‐10, G‐CSF and RANTES, the transcriptional elevation of inflammatory genes such as Ccl11, Lif and Il11 in the liver, and the elevation of serum TBA and faecal CDCA, DCA and LCA; and partially prevented alterations in the intestinal microbiota induced by D‐GalN. The underlying mechanism is related to the regulation of pathways such as PPAR signalling by LcS.
Modulating the cross‐talk between the gut microbiota and immunity is one of the important means by which probiotics affect health and disease. Our results showed that LcS not only reversed the D‐GalN‐induced alterations in the gut microbiota, such as the depletion of Prevotellaceae and enrichment of Butyricimonas, but also reduced potentially harmful bacteria and enhanced potentially beneficial bacteria to levels lower/higher than those of the HC group. Enterococcus species such as E. faecalis have been reported to promote the virulence of coinfecting organisms (Kao and Kline, 2019) and to promote intestinal inflammation by impairing epithelial barrier integrity (Steck et al., 2011). Butyricimonas species such as B. virosa have been associated with bacteremia during polymicrobial infection (Ogawa et al., 2018). Bacteroides species such as B. acidifaciens have been reported to improve metabolic disorders in mice by activating PPAR signalling (Yang et al., 2017). Correspondingly, our results showed that Enterococcus was significantly correlated with elevate serum GGT, G‐CSF, IL‐10, IL‐17, IL‐5 and RANTES levels, while Bacteroides was negatively correlated with IL‐10, IL‐5 and/or TBA. Furthermore, the transcription of liver functional genes such as Afm was widely and significantly negatively correlated with Enterococcus; in contrast, the transcription of liver inflammatory genes such as Ccl11 was positively correlated with Enterococcus. These results are good examples of the role of LcS in regulating the gut microbiota to alleviate liver injury.
Shaping host–gut microbiota metabolic interactions are also key to driving good probiotic performance. Here, the regulation of metabolism related to BAs by LcS is a good example. On the one hand, our results showed that LcS alleviated the D‐GalN‐induced increases in both serum TBA and faecal BAs, such as CDCA, DCA and LCA, and enhanced the levels of long‐chain fatty acids, such as octadecanol and pentadecanol, indicating that LcS contributed to the homeostasis of BA enterohepatic circulation. The gut microbiota participates in the deconjugation, dehydrogenation, dehydroxylation and epimerization of primary BAs, such as cholic acid (CA) and CDCA, to secondary BAs, such as DCA and LCA, in the small intestine and colon (Wahlström et al., 2016; Li et al., 2017). Our results showed that the levels of DCA and LCA were significantly correlated with bacterial taxa such as Coriobacteriaceae, Clostridiales family XIII, Enterococcus of Lactobacillales and Butyricimonas of Bacteroidales. This was in line with the finding that bacteria from Coriobacteriaceae (Wegner et al., 2017), Clostridiales (Devlin and Fischbach, 2015), Lactobacillales (Ridlon et al., 2014) and Bacteroidales (Fukiya et al., 2009) can produce DCA (or iso‐DCA) from CA or LCA (or iso‐LCA) from CDCA and divide the taurine conjugates TDCA and TLCA into taurine and DCA and LCA, respectively. Moreover, the increased BA levels in the gut appear to favour gram‐positive members of the Firmicutes with 7α‐dehydroxylase activity and result in significant increases in DCA/LCA‐producing bacteria (Ridlo et al., 2014). In patients with cholestasis, the genus Enterococcus was the most highly overabundant in bile, and E. faecalis was strongly correlated with TLCA (Liwinski et al., 2019). This may explain why the increase/reduction in gut Firmicutes was synchronous with the increase/reduction in DCA and LCA in the PC/LcS group in this study. This finding was also consistent with our previous report that Lactobacillus helveticus R0052 treatment decreased both the LCA level and the intestinal abundance of the associated genus Acetatifactor (from Firmicutes) to alleviate liver injury (Wang et al., 2019). On the other hand, our results showed that the transcription of the farnesoid X receptor (FXR)‐encoding gene Nr1h4 in the liver was upregulated 2.64‐fold (P adj = 0.004), whereas the transcription of Cyp7A1 was downregulated 3.73‐fold (P adj = 6.27E‐06) in the LcS group versus the PC group. FXR has been established as a key regulator in BA synthesis and transport (Kalaany and Mangelsdorf, 2006). Hepatic activation of FXR suppresses BA synthesis by reducing the expression of CYP7A1, which encodes the rate‐limiting enzyme 7α‐hydroxylase in BA synthesis from cholesterol. These findings indicate the possibility of a reduction in TBA and CDCA production in the LcS group and were in line with a report of Lactobacillus rhamnosus GG (LGG) treatment inhibiting hepatic BA synthesis to prevent liver fibrosis (Liu et al., 2019). Meanwhile, the transcription of the BA transporter‐encoding gene Abcb11 and Slc10a1 was significantly upregulated in the liver in the LcS group versus the PC group, indicating that pretreatment with LcS may help to reduce the hepatic BA accumulation caused by ALI.
LcS alleviated liver injury through complex signalling pathways in vivo. Our results showed that LcS significantly alleviated the downregulation of both the retinol metabolism pathway and the PPAR signalling pathway and reduced the upregulation of the pyruvate metabolism pathway in the liver. First, PPARs, a group of nuclear receptors that predominantly regulate various metabolic processes such as the metabolism of fatty acids and BAs, were reported to have diverse functions, including roles in inflammation, reproduction, development, cell proliferation, cell specialization and energy metabolism (Oh et al., 2019). In liver fibrosis and cholestasis, activated PPAR signalling contributes to repressing BA synthesis, inhibiting hepatic BA uptake and promoting biliary excretion (Ghonem et al., 2015). Therefore, PPAR signalling is most likely involved in the LcS processes to alleviate D‐GalN‐induced upregulation of BAs and inflammatory cytokines. Moreover, our results show intensive correlations of gut bacteria with the transcription of liver genes in PPAR pathways, which is in line with the gut microbiota being capable of influencing PPAR expression in the liver (Oh et al., 2019). Second, retinoic acid, a metabolite of the retinol metabolism pathway, functions as a ligand for nuclear retinoic acid receptors that modulate the development of chordate animals. Consequently, the alleviation of the D‐GalN‐induced downregulation of the retinol pathway in the LcS group may contribute to the recovery of liver injury. Moreover, retinoic acid acts through retinoid receptors that synergize with PPARγ, and activation of either retinoic acid signalling or PPARγ signalling has proven to be able to reverse hepatic stellate cell (HSC) activation and liver fibrosis (Panebianco et al., 2017), indicating that these two signalling pathways may promote each other in the LcS‐mediated alleviation of liver injury. Third, pyruvate is an important intermediate for both glycometabolism and the transformation of various substances in vivo. Aberrant pyruvate metabolism plays a prominent role in diseases such as cancer and heart failure. Inhibition of pyruvate metabolism may help to treat hepatic steatosis and fibrosis (McCommis and Finck, 2019), indicating the potential benefits of LcS in alleviating D‐GalN‐induced upregulation of pyruvate metabolism.
LcS can affect intestinal homeostasis via several pathways. First, our results show that LcS alleviated D‐GalN‐induced downregulation of gut focal adhesion signalling and ECM‐receptor interaction signalling, indicating that LcS may help gut cells protect against the destructive effects of D‐GalN on cell growth, differentiation, inter‐ and intracellular communication, and tissue integrity (Leube et al., 2015). Second, LcS alleviated the D‐GalN‐induced downregulation of protein digestion and absorption signalling, which plays a central role in health and many diseases, thus indicating a potential new means for the prevention and treatment of related diseases. Third, our results show that LcS reduced D‐GalN‐induced upregulation of both the renin–angiotensin system and the circadian rhythm pathway. There is increasing evidence that the renin–angiotensin system is involved in inflammation and carcinogenesis (Ranjbar et al., 2019). It was reported that disruption of the circadian system can increase the activity of the gut immune system and the release of inflammatory factors (Gombert et al., 2019). Therefore, alleviating the upregulation of these two pathways may be involved in the gastroprotective mechanisms of LcS.
Enterohepatic cross‐talk in inflammation is important for the pathogenesis and treatment of many diseases. Our results showed that seven gut genes (Ciart, Cipc, DBP, Nr1d2, Per2, Per3 and Tef function in rhythmic processes) were intensively correlated with 24 hepatic genes (P < 0.001) at the transcriptional level. For example, gut genes Ciart and Nr1d2 were negatively correlated with the upregulation of hepatic PPAR signalling‐related genes Cyp4a2, Cyp4a3 and Gk, indicating the important cross‐talk between circadian rhythm signalling and PPAR signalling. Some of the above observations were in line with circadian repressors such as Nr1d2, Per2 and Tef synergistically playing roles in the regulation of carbohydrate and lipid metabolism with PPAR signalling (Grimaldi et al., 2010; Gachon et al., 2011; Marciano et al., 2014). In addition, these gut genes (Ciart, Cipc, Dbp, Nr1d2, Per2, Per3 and Tef) were also significantly correlated with hepatic genes involved in cellular response, cytokine activity regulation and the metabolism of carbohydrates, lipids, fatty acids, amino acids and nucleotides, indicating the fundamental role of circadian rhythm signalling in comprehensive enterohepatic cross‐talk during the LcS alleviation of D‐GalN‐induced liver injury. This was in line with the report that the gut microbiota directs PPAR‐driven reprogramming of the liver circadian clock through transcriptional rewiring of hepatic metabolism (Murakami et al., 2016).
In summary, this work demonstrates the probiotic properties of LcS in alleviating D‐GalN‐induced liver injury; specifically, LcS was effective at reducing hepatic and intestinal damage, alleviating increases in serum GGT, TBA, faecal DCA and LCA levels, partially reversing alterations in the gut microbiota and maintaining the homeostasis of important signalling pathways of the liver and gut. This work provides prospects for the prevention and treatment of liver injury and ALI using LcS.
Experimental procedures
Culture conditions and suspension preparation
LcS was isolated from the yogurt drink Yakult® and identified by 16S rDNA sequencing. After anaerobic culturing in Man–Rogosa–Sharpe broth (Thermo Fisher, Shanghai, China) at 37°C for 18 h, the broth was centrifuged at 8000 g at 4°C for 10 min. The precipitate was washed twice and resuspended in sterile normal saline at a final concentration of 3 × 10⁹ CFU ml‐1 for intragastric administration.
Animal experimental design and sample collection
Twenty‐four male‐specific pathogen‐free (SPF) Sprague Dawley rats (Shanghai SLAC Laboratory Animal Co. Ltd., Shanghai, China) weighing 250–300 g were randomly divided into three groups: the healthy control (HC) group, the positive control (PC) group and the LcS‐treated (LcS) group, with eight rats in each group. All animals were fed standard rat chow and kept in SPF facilities. In the first 7 days, rats in the LcS group were treated with 1 ml of freshly prepared LcS suspensions (3 × 10⁹ CFU) by intragastric administration once daily, while rats in the HC and PC groups were treated with 1 ml of saline. On the eighth day, ALI was induced in the rats in the LcS and PC groups by intraperitoneal injection of D‐GalN (Sigma, Saint Louis, MO, USA) at a dose of 1.1 g kg‐1 body weight, while the rats in the HC group received the same dose of saline.
Faecal samples were collected 24 h after injection upon defecation. All rats were anesthetized with pentobarbital sodium and pethidine before sacrifice. Blood from the inferior vena cava was centrifuged at 3000 g for 10 min to collect plasma and serum. Samples of liver and terminal ileum were immediately fixed in 10% paraformaldehyde or in phosphate‐buffered saline (PBS) with 2.5% glutaraldehyde once isolated. Other liver and terminal ileum samples were stored in liquid nitrogen for transcriptomic analysis and further study.
Haematological tests of hepatic function and inflammatory cytokines
Levels of liver function indicators, including total bilirubin (TBIL), direct bilirubin (DBIL), indirect bilirubin (IBIL), total bile acid (TBA), total protein (TP), albumin (ALB), globulin (GLO), alanine aminotransferase (ALT), aspartate aminotransferase (AST), alkaline phosphatase (ALP), gamma‐glutamyltranspeptidase (GGT), cholinesterase (CHE) and glycyl‐proline dipeptidyl aminopeptidase (GPDA), were assessed using a Hitachi 7600‐210 automatic analyser (Hitachi, Tokyo, Japan). Levels of 23 inflammatory cytokines in plasma (G‐CSF, GM‐CSF, GRO/KC, IFN‐γ, IL‐1α, IL‐1β, IL‐2, IL‐4, IL‐5, IL‐6, IL‐7, IL‐10, IL‐12 (p70), IL‐13, IL‐17A, IL‐18, M‐CSF, MCP‐1, MIP‐1α, MIP‐3α, RANTES, TNF‐α and VEGF) were measured with commercially available Bio‐Plex Pro Rat Cytokine 23‐Plex Assay Kits using the Bio‐plex 200 System (Bio‐Rad Laboratories, Hercules, CA, USA).
Histopathological examination and intestinal barrier detection
Samples of liver and terminal ileum were fixed in 10% paraformaldehyde for 24 h, embedded in paraffin, cut into 2‐μm sections and stained with haematoxylin and eosin (H&E). The level of myeloperoxidase (MPO) was detected by immunohistochemistry staining. The degree of liver damage was scored according to the histological activity index (HAI) and divided into four grades (Knodell et al., 1981). The intestinal epithelium abnormalities were evaluated as reported previously (Chiu et al., 1970), and the development of subepithelial Gruenhagen’s space, epithelial lifting and denudation of villi were taken into consideration in this scoring system. At least five fields of each section were assessed under a microscope. The 2.5% glutaraldehyde‐fixed terminal ileum samples were refixed in PBS with 1% OsO4. The fixed samples were washed, gradient dehydrated in ethanol and a critical point dryer and then finally coated with gold–palladium. A Hitachi SU8010 scanning electron microscope was used for observation.
Gut microbial analysis
DNA extraction of faecal samples was performed using a QIAamp Fast DNA Stool Mini Kit (QIAGEN, Valencia, CA, USA). The V3‐V4 region of the 16S rDNA gene was amplified using the primers 338F (5'‐ACTCCTACGGGAGGCAGCAG‐3') and 806R (5'‐GGACTACHVGGGTWTCTAAT‐3'). PCR amplification, 16S rDNA sequencing using the Illumina MiSeq platform (Illumina) and data processing were conducted as described previously (Lv et al., 2016). Briefly, raw reads were cleaned, filtered and then merged using FLASH v1.2.11. Quality control was conducted using FastQC v0.11.8. The software Quantitative Insights Into Microbial Ecology (QIIME) v1.9.1 was used for operational taxonomic unit (OTU) picking, clustering, identification against the Greengenes database and the NCBI 16S Microbial database, and subsequent statistical analysis of microbial diversity and differential enrichment.
Gut metabolomic profiling
Faecal samples were pretreated before gas chromatography–mass spectrometry (GC‐MS) analysis as described previously (Ye et al., 2018). Briefly, 15 mg of thawed faeces was mixed with 800 μl of ice‐cold methanol for extraction; the mixture was then homogenized, centrifuged and filtered, and the supernatant was subsequently vacuum freeze‐dried, methoxymated and trimethylsilylated with 20 μl of heptadecanoic acid (1 mg ml‐1) as an internal standard. The pretreated samples were analysed on an Agilent 7890A‐5975C GC‐MS system (Agilent Technologies, Santa Clara, CA, USA) using an Agilent J&W Hp‐5 MS column under the following conditions: the column temperature rose to 200°C by a heating rate of 10°C min‐1 with an initial 2 min at 70°C, followed by a heating rate of 4°C min‐1 to 300°C, and then held at 300°C for 2 min; the temperatures of the injector, transfer line and electron impact (EI) ion source were set to 250, 290 and 230°C, respectively; the electron energy was 70 eV. Raw data obtained from GC‐MS runs were analysed using Agilent Qualitative Analysis vB.07.00 software. Metabolites were identified by the NIST 17 database with a matching score of at least 80. The resulting data set was normalized and transformed into relative concentration by the internal standard before multivariate analysis. Orthogonal partial least squares discriminant analysis (OPLS‐DA) was performed to visualize metabolic differences between groups using the SIMCA v14.1 software from Umetrics.
Transcriptomic analysis
Total RNA was extracted from the liver and terminal ileum samples using an RNeasy Plus Mini kit (QIAGEN). RNA purity was checked using a NanoPhotometer spectrophotometer (Implen, Los Angeles, CA, USA). RNA was quantified using an RNA 6000 Nano LabChip Kit and Bioanalyzer 2100 (Agilent) with an RNA integrity number (RIN) > 7.0. RNA (1 μg per sample) was used as input material for preparations. Sequencing libraries were generated using the NEBNext UltraTM RNA Library Prep Kit for Illumina (New England Biolabs, Ipswich, MO, USA) following the manufacturer’s procedure, and index codes were added to attribute sequences to each sample. Clustering of index‐coded samples was performed on a cBot Cluster Generation System using TruSeq PE Cluster Kit v3‐cBot‐HS (Illumina). After cluster generation, the library preparations were sequenced on an Illumina NovaSeq platform, and 150 bp paired‐end reads were generated. Prior to alignment, raw reads were filtered by removing the reads containing adaptor or poly‐N and low‐quality sequences with Q‐values < 30. The paired‐end clean reads were then aligned to a reference genome (Rnor_6.0, GCA_000001895.4) using HISTA2 v2.0.5. The number of clean reads mapped to each gene was calculated and normalized to the number of reads per kilobase of exon model per million mapped reads (RPKM) using featureCounts v1.5.0‐p3. A differential gene expression analysis was performed using the ‘DESeq2’ R package. Genes with an FDR‐adjusted P‐value < 0.05 found by DESeq2 were designated as differentially expressed. Analysis of gene annotation, functional classification, determination of pathway and process enrichment and network visualization were conducted using the ‘clusterProfiler’ R package and online software Metascape (Zhou et al., 2019) based on Gene Ontology (GO) and the Kyoto Encyclopedia of Genes and Genomes (KEGG).
RT‐qPCR analysis
The transcription of inflammation‐ and BA synthesis and transport‐related genes was verified by reverse transcription quantitative PCR (RT‐qPCR). Briefly, the total RNA was transformed into cDNA and then measured by RT‐qPCR in triplicate with Premix Ex Taq (Takara Biomedicals, Kusatsu, Japan) on a ViiA7 Real‐time PCR system (Applied Biosystems, Waltham, MA, USA). The housekeeping gene glyceraldehyde‐3‐phosphate dehydrogenase (GAPDH) was defined as the internal control. Gene transcription was transformed into relative expression based on the internal control for further analysis. The primer sequences for the indicated genes are provided in Table S1.
Statistical analysis
For liver function, cytokine and metabolite data, the Mann–Whitney U test was used to compare any two data sets that were not normally distributed, while the Kruskal–Wallis test was used for more than two groups; otherwise, one‐way ANOVA followed by the Student–Newman–Keuls method was used. Differential metabolites were selected according to variable importance in the projection (VIP) values obtained from the OPLS‐DA model and the p‐values from the Mann–Whitney U test or one‐way ANOVA. Spearman’s rank test was used to analyse correlations between every two significant factors. P‐values were adjusted for the false discovery rate using the Benjamini–Hochberg method where necessary (*P adj < 0.05; **P adj < 0.01; ***P adj < 0.001).
Conflict of interest
The authors declare that the research was conducted in the absence of any commercial or financial relationships that could be construed as a potential conflict of interest.
Funding Information
This work is supported by the National Key Research and Development Program of China under Grant 2018YFC2000500; the National Natural Science Foundation of China under Grants 81570512 and 81790631; the Natural Science Foundation of Zhejiang Province in China under Grant LQ19H030007; the General Research Project of Zhejiang Educational Committee under Grant Y201738071; and the Zhejiang Province Public Welfare Technology Application Research Project under Grant 2018C37059.
Ethical approval
All procedures were performed according to the 2011 National Institutes of Health Guide for the Care and Use of Laboratory Animals and were approved by the Animal Care and Use Committee of the First Affiliated Hospital, School of Medicine, Zhejiang University.
Supporting information
Fig. S1. Representative gene transcriptional alterations in liver verified by RT‐qPCR. (A) Relative expression of four BA synthesis and transport‐related genes, Abcb11, Slc10a1, Nr1h4 and Cyp7a1, in the liver. (B) Relative expression of ten inflammation‐related genes, TLR2, TLR4, TLR5, TIMP1, MTOR, JNK, IKK, NF‐Κb, HMGB‐1 and TNF‐α, in the liver. (* Padj < 0.05; ** Padj < 0.01; *** Padj < 0.001).
Table S1. PCR primers for RT‐qPCR analysis of the indicated genes.
Table S2. Levels of fourteen liver liver function indicators.
Table S3. Relative abundance of gut bacterial at phylum level.
Microb. Biotechnol. (2021) 15(1), 247–261
Contributor Information
Lanjuan Li, Email: ljli@zju.edu.cn.
Longxian Lv, Email: lvlongxian@zju.edu.cn.
Data Availability Statement
All data generated or analysed during this study are included in this published article and its additional information files. The data sets generated during the current study are available in the GenBank Sequence Read Archive repository under accession number PRJNA607469.
References
- Aoki, T. , Asahara, T. , Matsumoto, K. , Takada, T. , Chonan, O. , Nakamori, K. , et al. (2014) Effects of the continuous intake of a milk drink containing Lactobacillus casei strain Shirota on abdominal symptoms, fecal microbiota, and metabolites in gastrectomized subjects. Scand J Gastroenterol 49: 552–563. [DOI] [PubMed] [Google Scholar]
- Aoyagi, Y. , Amamoto, R. , Park, S. , Honda, Y. , Shimamoto, K. , Kushiro, A. , et al. (2019) independent and interactive effects of habitually ingesting fermented milk products containing lactobacillus Casei strain Shirota and of engaging in moderate habitual daily physical activity on the intestinal health of older people. Front Microbiol 10: 1477. [DOI] [PMC free article] [PubMed] [Google Scholar]
- Aoyagi, Y. , Park, S. , Matsubara, S. , Honda, Y. , Amamoto, R. , Kushiro, A. , et al. (2017) Habitual intake of fermented milk products containing Lactobacillus casei strain Shirota and a reduced risk of hypertension in older people. Benef Microbes 8: 23–29. [DOI] [PubMed] [Google Scholar]
- Cauli, O. , Lopez‐Larrubia, P. , Rodrigo, R. , Agusti, A. , Boix, J. , Nieto‐Charques, L. , et al. (2011) Brain region‐selective mechanisms contribute to the progression of cerebral alterations in acute liver failure in rats. Gastroenterology 140: 638–645. [DOI] [PubMed] [Google Scholar]
- Chen, S. , Ou, Y. , Zhao, L. , Li, Y. , Qiao, Z. , Hao, Y. , and Ren, F. (2019) Differential effects of lactobacillus Casei strain Shirota on patients with constipation regarding stool consistency in China. J Neurogastroenterol Motil 25: 148–158. [DOI] [PMC free article] [PubMed] [Google Scholar]
- Chiu, C.J. , McArdle, A.H. , Brown, R. , Scott, H.J. , and Gurd, F.N. (1970) Intestinal mucosal lesion in low‐flow states. I. A morphological, hemodynamic, and metabolic reappraisal. Arch Surg 101: 478–483. [DOI] [PubMed] [Google Scholar]
- Dailey, F.E. , Turse, E.P. , Rossow, B. , Kuwajima, V.K. , and Tahan, V. (2019) Probiotics for gastrointestinal and liver diseases: an updated review of the published literature. Endocr Metab Immune Disord Drug Targets 19: 549–570. [DOI] [PubMed] [Google Scholar]
- Devlin, A.S. , and Fischbach, M.A. (2015) A biosynthetic pathway for a prominent class of microbiota‐derived bile acids. Nat Chem Biol 11: 685–690. [DOI] [PMC free article] [PubMed] [Google Scholar]
- Dong, H. , Rowland, I. , Thomas, L.V. , and Yaqoob, P. (2013) Immunomodulatory effects of a probiotic drink containing Lactobacillus casei Shirota in healthy older volunteers. Eur J Nutr 52: 1853–1863. [DOI] [PubMed] [Google Scholar]
- Donnelly, M.C. , Hayes, P.C. , and Simpson, K.J. (2016) Role of inflammation and infection in the pathogenesis of human acute liver failure: clinical implications for monitoring and therapy. World J Gastroenterol 22: 5958–5970. [DOI] [PMC free article] [PubMed] [Google Scholar]
- Fukiya, S. , Arata, M. , Kawashima, H. , Yoshida, D. , Kaneko, M. , Minamida, K. , et al. (2009) Conversion of cholic acid and chenodeoxycholic acid into their 7‐oxo derivatives by Bacteroides intestinalis AM‐1 isolated from human feces. FEMS Microbiol Lett 293: 263–270. [DOI] [PubMed] [Google Scholar]
- Gachon, F. , Leuenberger, N. , Claudel, T. , Gos, P. , Jouffe, C. , Fleury Olela, F. , et al. (2011) Proline‐ and acidic amino acid‐rich basic leucine zipper proteins modulate peroxisome proliferator‐activated receptor alpha (PPARalpha) activity. Proc Natl Acad Sci USA 108: 4794–4799. [DOI] [PMC free article] [PubMed] [Google Scholar]
- Ghonem, N.S. , Assis, D.N. , and Boyer, J.L. (2015) Fibrates and cholestasis. Hepatology 62: 635–643. [DOI] [PMC free article] [PubMed] [Google Scholar]
- Gombert, M. , Carrasco‐Luna, J. , Pin‐Arboledas, G. , and Codoner‐Franch, P. (2019) The connection of circadian rhythm to inflammatory bowel disease. Transl Res 206: 107–118. [DOI] [PubMed] [Google Scholar]
- Grimaldi, B. , Bellet, M.M. , Katada, S. , Astarita, G. , Hirayama, J. , Amin, R.H. , et al. (2010) PER2 controls lipid metabolism by direct regulation of PPARgamma. Cell Metab 12: 509–520. [DOI] [PMC free article] [PubMed] [Google Scholar]
- Ivory, K. , Chambers, S.J. , Pin, C. , Prieto, E. , Arques, J.L. , and Nicoletti, C. (2008) Oral delivery of Lactobacillus casei Shirota modifies allergen‐induced immune responses in allergic rhinitis. Clin Exp Allergy 38: 1282–1289. [DOI] [PubMed] [Google Scholar]
- Jiang, H. , Yan, R. , Wang, K. , Wang, Q. , Chen, X. , Chen, L. , et al. (2020) Lactobacillus reuteri DSM 17938 alleviates d‐galactosamine‐induced liver failure in rats. Biomed Pharmacother 133: 111000. [DOI] [PubMed] [Google Scholar]
- Kalaany, N.Y. , and Mangelsdorf, D.J. (2006) LXRS AND FXR: the Yin and Yang of cholesterol and fat metabolism. Annu Rev Physiol 68: 159–191. [DOI] [PubMed] [Google Scholar]
- Kao, P.H.N. , and Kline, K.A. (2019) Dr. Jekyll and Mr. Hide: how Enterococcus faecalis subverts the host immune response to cause infection. J Mol Biol 431: 2932–2945. [DOI] [PubMed] [Google Scholar]
- Knodell, R.G. , Ishak, K.G. , Black, W.C. , Chen, T.S. , Craig, R. , Kaplowitz, N. , et al. (1981) Formulation and application of a numerical scoring system for assessing histological activity in asymptomatic chronic active hepatitis. Hepatology 1: 431–435. [DOI] [PubMed] [Google Scholar]
- Koebnick, C. , Wagner, I. , Leitzmann, P. , Stern, U. , and Zunft, H.J. (2003) Probiotic beverage containing Lactobacillus casei Shirota improves gastrointestinal symptoms in patients with chronic constipation. Can J Gastroenterol 17: 655–659. [DOI] [PubMed] [Google Scholar]
- Lei, M. , Guo, C. , Wang, D. , Zhang, C. , and Hua, L. (2017) The effect of probiotic Lactobacillus casei Shirota on knee osteoarthritis: a randomised double‐blind, placebo‐controlled clinical trial. Benef Microbes 8: 697–703. [DOI] [PubMed] [Google Scholar]
- Leube, R.E. , Moch, M. , and Windoffer, R. (2015) Intermediate filaments and the regulation of focal adhesion. Curr Opin Cell Biol 32: 13–20. [DOI] [PubMed] [Google Scholar]
- Li, B. , Zheng, J. , Zhang, X. , and Hong, S. (2018) Probiotic Lactobacillus casei Shirota improves efficacy of amoxicillin‐sulbactam against childhood fast breathing pneumonia in a randomized placebo‐controlled double blind clinical study. J Clin Biochem Nutr 63: 233–237. [DOI] [PMC free article] [PubMed] [Google Scholar]
- Li, Y. , Tang, R. , Leung, P.S.C. , Gershwin, M.E. , and Ma, X. (2017) Bile acids and intestinal microbiota in autoimmune cholestatic liver diseases. Autoimmun Rev 16: 885–896. [DOI] [PubMed] [Google Scholar]
- Liu, Y. , Chen, K. , Li, F. , Gu, Z. , Liu, Q. , He, L. , et al. (2019) Probiotic LGG prevents liver fibrosis through inhibiting hepatic bile acid synthesis and enhancing bile acid excretion in mice. Hepatology. [DOI] [PMC free article] [PubMed] [Google Scholar]
- Liwinski, T. , Zenouzi, R. , John, C. , Ehlken, H. , Ruhlemann, M. C. , Bang, C. , et al. Alterations of the bile microbiome in primary sclerosing cholangitis. Gut 69: 665–672. [DOI] [PubMed] [Google Scholar]
- Lv, L.X. , Fang, D.Q. , Shi, D. , Chen, D.Y. , Yan, R. , Zhu, Y.X. , et al. (2016) Alterations and correlations of the gut microbiome, metabolism and immunity in patients with primary biliary cirrhosis. Environ Microbiol 18: 2272–2286. [DOI] [PubMed] [Google Scholar]
- Lv, L.‐X. , Jiang, H.‐Y. , Yan, R. , and Li, L. (2019) Interactions between gut microbiota and hosts and their role in infectious diseases. Infect Microb Dis 1: 3–9. [Google Scholar]
- Marciano, D.P. , Chang, M.R. , Corzo, C.A. , Goswami, D. , Lam, V.Q. , Pascal, B.D. , and Griffin, P.R. (2014) The therapeutic potential of nuclear receptor modulators for treatment of metabolic disorders: PPARgamma, RORs, and Rev‐erbs. Cell Metab 19: 193–208. [DOI] [PubMed] [Google Scholar]
- McCommis, K.S. , and Finck, B.N. (2019) Treating hepatic steatosis and fibrosis by modulating mitochondrial pyruvate metabolism. Cell Mol Gastroenterol Hepatol 7: 275–284. [DOI] [PMC free article] [PubMed] [Google Scholar]
- Muntane, J. , Rodriguez, F.J. , Segado, O. , Quintero, A. , Lozano, J.M. , Siendones, E. , et al. (2000) TNF‐alpha dependent production of inducible nitric oxide is involved in PGE(1) protection against acute liver injury. Gut 47: 553–562. [DOI] [PMC free article] [PubMed] [Google Scholar]
- Murakami, M. , Tognini, P. , Liu, Y. , Eckel‐Mahan, K.L. , Baldi, P. , and Sassone‐Corsi, P. (2016) Gut microbiota directs PPARgamma‐driven reprogramming of the liver circadian clock by nutritional challenge. EMBO Rep 17: 1292–1303. [DOI] [PMC free article] [PubMed] [Google Scholar]
- Naito, E. , Yoshida, Y. , Kunihiro, S. , Makino, K. , Kasahara, K. , Kounoshi, Y. , et al. (2018) Effect of Lactobacillus casei strain Shirota‐fermented milk on metabolic abnormalities in obese prediabetic Japanese men: a randomised, double‐blind, placebo‐controlled trial. Biosci Microbiota Food Health 37: 9–18. [DOI] [PMC free article] [PubMed] [Google Scholar]
- Ogawa, Y. , Sato, M. , Yamashita, T. , Nakano, R. , Mochizuki, S. , Kasahara, K. , et al. (2018) Polymicrobial anaerobic bacteremia caused by Butyricimonas virosa and Brachyspira pilosicoli in a patient with peritonitis following intestinal perforation. Ann Lab Med 38: 71–73. [DOI] [PMC free article] [PubMed] [Google Scholar]
- Oh, H.Y.P. , Visvalingam, V. , and Wahli, W. (2019) The PPAR‐microbiota‐metabolic organ trilogy to fine‐tune physiology. FASEB J 33: 9706–9730. [DOI] [PubMed] [Google Scholar]
- Panebianco, C. , Oben, J.A. , Vinciguerra, M. , and Pazienza, V. (2017) Senescence in hepatic stellate cells as a mechanism of liver fibrosis reversal: a putative synergy between retinoic acid and PPAR‐gamma signalings. Clin Exp Med 17: 269–280. [DOI] [PubMed] [Google Scholar]
- Ranjbar, R. , Shafiee, M. , Hesari, A. , Ferns, G.A. , Ghasemi, F. , and Avan, A. (2019) The potential therapeutic use of renin‐angiotensin system inhibitors in the treatment of inflammatory diseases. J Cell Physiol 234: 2277–2295. [DOI] [PubMed] [Google Scholar]
- Ridlon, J.M. , Kang, D.J. , Hylemon, P.B. , and Bajaj, J.S. (2014) Bile acids and the gut microbiome. Curr Opin Gastroenterol 30: 332–338. [DOI] [PMC free article] [PubMed] [Google Scholar]
- Shida, K. , Sato, T. , Iizuka, R. , Hoshi, R. , Watanabe, O. , Igarashi, T. , et al. (2017) Daily intake of fermented milk with Lactobacillus casei strain Shirota reduces the incidence and duration of upper respiratory tract infections in healthy middle‐aged office workers. Eur J Nutr 56: 45–53. [DOI] [PMC free article] [PubMed] [Google Scholar]
- Squires, J.E. , McKiernan, P. , and Squires, R.H. (2018) Acute liver failure: an update. Clin Liver Dis 22: 773–805. [DOI] [PubMed] [Google Scholar]
- Steck, N. , Hoffmann, M. , Sava, I.G. , Kim, S.C. , Hahne, H. , Tonkonogy, S.L. , et al. (2011) Enterococcus faecalis metalloprotease compromises epithelial barrier and contributes to intestinal inflammation. Gastroenterology 141: 959–971. [DOI] [PubMed] [Google Scholar]
- Stravitz, R.T. , and Lee, W.M. (2019) Acute liver failure. Lancet 394: 869–881. [DOI] [PMC free article] [PubMed] [Google Scholar]
- Takada, M. , Nishida, K. , Gondo, Y. , Kikuchi‐Hayakawa, H. , Ishikawa, H. , Suda, K. , et al. (2017) Beneficial effects of Lactobacillus casei strain Shirota on academic stress‐induced sleep disturbance in healthy adults: a double‐blind, randomised, placebo‐controlled trial. Benef Microbes 8: 153–162. [DOI] [PubMed] [Google Scholar]
- Wahlström, A. , Sayin, S.I. , Marschall, H.‐U. , and Bäckhed, F. (2016) Intestinal crosstalk between bile acids and microbiota and its impact on host metabolism. Cell Metab 24: 41–50. [DOI] [PubMed] [Google Scholar]
- Wang, Q. , Lv, L. , Jiang, H. , Wang, K. , Yan, R. , Li, Y. , et al. (2019) Lactobacillus helveticus R0052 alleviates liver injury by modulating gut microbiome and metabolome in D‐galactosamine‐treated rats. Appl Microbiol Biotechnol 103: 9673–9686. [DOI] [PubMed] [Google Scholar]
- Wegner, K. , Just, S. , Gau, L. , Mueller, H. , Gerard, P. , Lepage, P. , et al. (2017) Rapid analysis of bile acids in different biological matrices using LC‐ESI‐MS/MS for the investigation of bile acid transformation by mammalian gut bacteria. Anal Bioanal Chem 409: 1231–1245. [DOI] [PubMed] [Google Scholar]
- Yang, J.Y. , Lee, Y.S. , Kim, Y. , Lee, S.H. , Ryu, S. , Fukuda, S. , et al. (2017) Gut commensal Bacteroides acidifaciens prevents obesity and improves insulin sensitivity in mice. Mucosal Immunol 10: 104–116. [DOI] [PubMed] [Google Scholar]
- Yang, L. , Bian, X. , Wu, W. , Lv, L. , Li, Y. , Ye, J. , et al. (2020) Protective effect of Lactobacillus salivarius Li01 on thioacetamide‐induced acute liver injury and hyperammonaemia. Microb Biotechnol 13: 1860–1876. [DOI] [PMC free article] [PubMed] [Google Scholar]
- Ye, J. , Lv, L. , Wu, W. , Li, Y. , Shi, D. , Fang, D. , et al. (2018) Butyrate protects mice against methionine‐choline‐deficient diet‐induced non‐alcoholic steatohepatitis by improving gut barrier function, attenuating inflammation and reducing endotoxin levels. Front Microbiol 9: 1967. [DOI] [PMC free article] [PubMed] [Google Scholar]
- Zhou, Y. , Zhou, B. , Pache, L. , Chang, M. , Khodabakhshi, A.H. , Tanaseichuk, O. , et al. (2019) Metascape provides a biologist‐oriented resource for the analysis of systems‐level datasets. Nat Commun 10: 1523. [DOI] [PMC free article] [PubMed] [Google Scholar]
Associated Data
This section collects any data citations, data availability statements, or supplementary materials included in this article.
Supplementary Materials
Fig. S1. Representative gene transcriptional alterations in liver verified by RT‐qPCR. (A) Relative expression of four BA synthesis and transport‐related genes, Abcb11, Slc10a1, Nr1h4 and Cyp7a1, in the liver. (B) Relative expression of ten inflammation‐related genes, TLR2, TLR4, TLR5, TIMP1, MTOR, JNK, IKK, NF‐Κb, HMGB‐1 and TNF‐α, in the liver. (* Padj < 0.05; ** Padj < 0.01; *** Padj < 0.001).
Table S1. PCR primers for RT‐qPCR analysis of the indicated genes.
Table S2. Levels of fourteen liver liver function indicators.
Table S3. Relative abundance of gut bacterial at phylum level.
Data Availability Statement
All data generated or analysed during this study are included in this published article and its additional information files. The data sets generated during the current study are available in the GenBank Sequence Read Archive repository under accession number PRJNA607469.