

Abstract
Functional connectivity and effective connectivity of the human brain, representing statistical dependence and directed information flow between cortical regions, significantly contribute to the study of the intrinsic brain network and its functional mechanism. Many recent studies on electroencephalography (EEG) have been focusing on modeling and estimating brain connectivity due to increasing evidence that it can help better understand various brain neurological conditions. However, there is a lack of a comprehensive updated review on studies of EEG‐based brain connectivity, particularly on visualization options and associated machine learning applications, aiming to translate those techniques into useful clinical tools. This article reviews EEG‐based functional and effective connectivity studies undertaken over the last few years, in terms of estimation, visualization, and applications associated with machine learning classifiers. Methods are explored and discussed from various dimensions, such as either linear or nonlinear, parametric or nonparametric, time‐based, and frequency‐based or time‐frequency‐based. Then it is followed by a novel review of brain connectivity visualization methods, grouped by Heat Map, data statistics, and Head Map, aiming to explore the variation of connectivity across different brain regions. Finally, the current challenges of related research and a roadmap for future related research are presented.
Keywords: artificial intelligence, brain association, electroencephalogram, machine learning, survey
This article reviews EEG‐based functional and effective connectivity studies undertaken over the last few years, in terms of estimation, visualization, and applications associated with machine learning classifiers. Methods are explored and discussed from various dimensions, such as either linear or nonlinear, parametric, or nonparametric, time‐based, frequency‐based or time‐frequency‐based. Then it is followed by a novel review of brain connectivity visualization methods, grouped by Heat Map, data statistics and Head Map, aiming to explore the variation of connectivity across different brain regions. Finally, the current challenges of related research and a roadmap for future related research are presented.
1. INTRODUCTION
In the past decades, plenty of prior researchers showed their interest in understanding brain activities through analyzing noninvasive brain signals. Scalp electroencephalography (EEG), has been yearly increasingly attractive resulting in a growing number of publications (Van Diessen et al., 2015). On one hand, to extract hidden information from EEG recordings, various traditional digital signal processing methods were employed, such as independent component analysis (ICA; van Mierlo et al., 2014b; Tafreshi, Daliri, & Ghodousi, 2019; van Mierlo et al., 2014a; Vecchio, Miraglia, Bramanti, & Rossini, 2014), power spectral density (PSD; Erra, Velazquez, & Rosenblum, 2017; Ko, Yang, & Sim, 2009; Lias, Sulaiman, Murat, & Taib, 2010), discrete wavelet transform (DWT; Amin, Yusoff, & Ahmad, 2020; Cvetkovic, Derya, & Cosic, 2008; Dhiman & Saini, 2014; Ibrahim, Djemal, & Alsuwailem, 2018; Vijay Anand & Shantha Selvakumari, 2019), and so on. They usually focus on either a single EEG channel, which are univariate methods essentially, or blind signal separation. Those methods may not consider the intercommunications between different EEG signals. On the other hand, growing attention was paid to brain connectivity. There is increasing evidence that brain connectivity can reveal the function of different brain regions and complex cortical intercommunications among them (Babiloni et al., 2005; Sakkalis, 2011; Tafreshi et al., 2019; van Mierlo et al., 2014a), which helps better understand many neurological conditions including disorders and emotions. As shown in Figure 1, the number of publications relevant to “EEG and brain connectivity” grew sustainably in recent years, especially after 2012.
FIGURE 1.
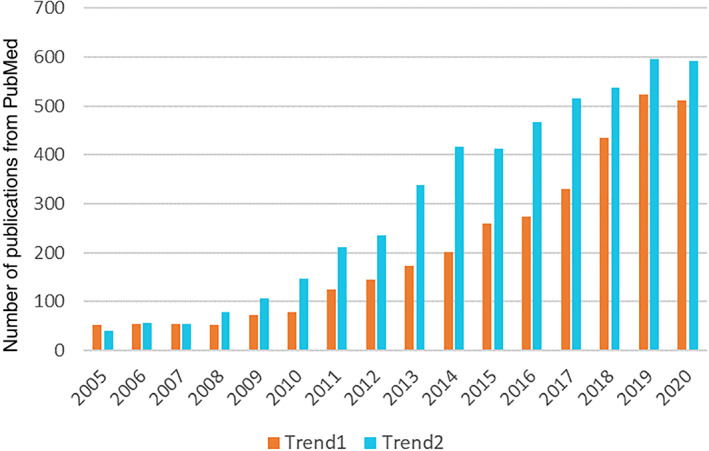
Number of publications per year from PubMed search using keywords “EEG and Machine learning” or “EEG and AI” (Trend1) and “brain connectivity and EEG” (Trend2) in the period 2005–2020
Brain connectivity can be subdivided into neuroanatomical (or structural), functional, and effective connectivity. Neuroanatomical connectivity refers to structural links such as synapses or fiber pathways at the microscopic scale of neurons (Sakkalis, 2011). Magnetic resonance imaging (MRI) and diffusion tensor imaging (DTI) are well‐accepted techniques to reveal the brain structural connectivity with a relatively high spatial resolution (Clayden, 2013; Fan et al., 2016; Mohanty, Sethares, Nair, & Prabhakaran, 2020), while EEG cannot directly reveal structural connections and it is applied to estimate functional and effective connectivity. Compared with MRI, EEG offers higher temporal resolution, thus connectivity can be estimated at shorter time scales. Meanwhile, EEG has the capacity to enable early detection of anomalies in pathophysiological processes affecting brain networks at a lower cost before clinical symptoms emerge and before structural alterations are visible in MRI (Marzetti et al., 2019; Sadaghiani, Brookes, & Baillet, 2021). Functional connectivity is defined as statistical interdependence among spatially distant neurophysiological regions (Friston, 2011), usually measured by correlation, coherence and information theory (Cao et al., 2021; Colclough et al., 2016; Marzetti et al., 2019; Sarrigiannis et al., 2015; Shan et al., 2021; Wang et al., 2014; Zhao et al., 2018). In terms of effective connectivity, it indicates the causal influence of one neural region over others (Astolfi et al., 2004; Tafreshi et al., 2019) by combining imaging techniques like EEG and magnetoencephalography (MEG) with mathematical models of interconnected brain regions (Friston, 2001; Ponten, Daffertshofer, Hillebrand, & Stam, 2010). Different from the functional connectivity that only addresses statistical relationships, effective connectivity tends to reveal underlying mechanisms of interaction among neural regions and it is dynamic (event‐dependent) and depends on a model of connections (Friston, 2011; He, Billings, Wei, Sarrigiannis, & Zhao, 2013; Seth, Barrett, & Barnett, 2015). It is believed that brain connectivity contains enormous potentials, which could aid our understanding of brain networks. There are debates if the volume conduction effect can be avoided from sensor‐level estimates of brain connectivity, due to the transmission from neural excitation to the surface measurement (He et al., 2019). Some researchers prefer to calculate the connectivity in source‐space after solving the inverse problem (Moezzi & Goldsworthy, 2018; Palva et al., 2018; Supp, Schlögl, Trujillo‐Barreto, Müller, & Gruber, 2007).
Moreover, based on a variety of features and biomarkers extracted from signal processing and brain connectivity analysis, recent years have witnessed a considerable increase of published articles using machine learning (ML) methods for EEG classification (Figure 1), such as support vector machine (SVM), random forest (RF), and K‐Nearest Neighbor (KNN) (Akbarian & Erfanian, 2020; Blinowska et al., 2017; Lehmann et al., 2007; Rajendra Acharya, Vinitha Sree, Alvin, & Suri, 2012), as well as deep learning approaches (Ball et al., 2016; Chen, Song, & Xiaoli, 2019; Saeedi, Saeedi, Maghsoudi, & Shalbaf, 2020).
Visualization is indispensable in brain connectivity analysis and highly promoting to interpret brain activity and intercommunications. Zhao et al. (2020) suggest that the imaging and study of brain functional connectivity can effectively revolutionize our understanding of brain degradation or dysfunction in a user friendly and systematic way. Besides, some researchers believe that connectivity results are supposed to be presented using appropriate visualizations that would in reality be interpreted by neurophysiologists (Haufe, Nikulin, Müller, & Nolte, 2013). On the other hand, the visualization of brain connectivity generates novel and promising input images for some deep learning methods. Literature shows that the convolution neural network (CNN) has the ability to identify the complexity present in EEG signals using advanced visualizing techniques of brain connectivity (Gao et al., 2019; Mammone, Ieracitano, & Morabito, 2020; Wang, El‐Fiqi, Hu, & Abbass, 2019).
Although over recent years an incessant flurry of numerous promising approaches related to brain functional and effective connectivity has contributed to neural research in understanding brain network function and some reviews tried to summarize the methods and discuss the limitations (Bastos & Schoffelen, 2016; Sakkalis, 2011; Van Diessen et al., 2015; van Mierlo et al., 2014a), there is a lack of comprehensive review in the last few years in terms of estimation, applications, and particularly their associated ML approaches. Moreover, there is no review available on a variety of visualization methods to represent the variation of functional and effective connectivity.
Section 2 of this article systematically reviews brain functional and effective connectivity estimation and analysis methods in accordance with their properties and applied areas. Those popular methods to quantify brain connectivity are grouped as parametric and nonparametric techniques and their conceptual and mathematical details are represented in the Appendix. Various distinct approaches of connectivity visualization, grouped into three categories, are reviewed in Section 3. Section 4 provides a summary and critical evaluation of brain connectivity methods and their applications in the fields of neural disease and brain activity research. We then discuss the role of visualization for brain connectivity analysis in detail. Besides, a discussion on the significance of ML and its various effective combination with brain connectivity estimations are represented in Section 4. This section closes with the identified research gaps and future direction. The conclusions are given in Section 5.
2. ESTIMATION
A review of high‐frequently used methods to estimate brain connectivity based on EEG is given in Table 1 associated with their properties. These methods are either linear or nonlinear, parametric, or nonparametric, belong to functional or effective connectivity, in time, frequency or time‐frequency domain. The conceptual and mathematical details of these approaches are represented individually in the Appendix. It can be observed from this table that the functional connectivity is usually estimated by nonparametric methods while the effective connectivity estimates are based on parametric techniques. In this review, parametric and nonparametric methods are grouped separately.
TABLE 1.
Comparison of methods for quantifying brain connectivity using EEG
| Linearity | Signal processing | Brain connectivity | Domain | ||||||
|---|---|---|---|---|---|---|---|---|---|
| Linear | Nonlinear | Parametric | Nonparametric | FC | EC | Time | Frequency | Time‐frequency | |
| DCM | √ | √ | √ | √ | |||||
| MSC | √ | √ | √ | √ | |||||
| STFC | √ | √ | √ | √ | |||||
| WC | √ | √ | √ | √ | |||||
| PLV | √ | √ | √ | √ | |||||
| GS | √ | √ | √ | √ | |||||
| GC | √ | √ | √ | √ | |||||
| PDC | √ | √ | √ | √ | |||||
| Corr | √ | √ | √ | √ | |||||
| SL | √ | √ | √ | √ | |||||
| TE | √ | √ | √ | √ | √ | ||||
| MI | √ | √ | √ | √ | |||||
| DTF | √ | √ | √ | √ | |||||
| PS | √ | √ | √ | √ | |||||
| SEM | √ | √ | √ | ||||||
| IPC | √ | √ | √ | √ | |||||
| PLI | √ | √ | √ | √ | |||||
| ERR | √ | √ | √ | √ | |||||
Abbreviations: Corr, correlation; DCM, dynamic causal modeling; DTF, directed transfer function; EC, effective connectivity; ERR, error reduction ratio; FC, functional connectivity; GC, granger causality; GS, generalized synchronization; IPC, imaginary part of coherency; MI, mutual information; MSC, magnitude squared coherence; PDC, partial directed coherence; PLI, phase lag index; PLV, phase locking value; PS, phase synchronization; SEM, structural equation modeling; SL, synchronization likelihood; STFC, short‐time Fourier coherence; TE, transfer entropy; WC, wavelet coherence.
2.1. Nonparametric methods
2.1.1. Linear methods
Linear intercommunication of the brain has been studied for several decades and is relatively straightforward in terms of computation and interpretation (Van Diessen et al., 2015). Correlation measures are well‐accepted to represent linear connections. Pearson correlation coefficient (PCC) and cross‐correlation were applied in the time domain to estimate functional connectivity from multi‐channel EEG recordings (Fagerholm, Moran, Violante, Leech, & Friston, 2020; Handojoseno et al., 2013; Ibrahim et al., 2018; Lee & Hsieh, 2014; Tarokh, Carskadon, & Achermann, 2010; Vortmann, Kroll, & Putze, 2019). It should be noted that PCC is the cross‐correlation value at the zero time lag. In other words, if there is any time delay between the two EEG signals, PCC cannot accurately represent the strength of linear correlation. The counterpart of the cross‐correlation in the frequency domain is the coherence. Coherence is sensitive to both changes in power and phase relationships between EEG signals (Sakkalis, 2011). The magnitude squared coherence (MSC; Battaglia & Brovelli, 2019) and the imaginary part of coherency (Ewald, Marzetti, Zappasodi, Meinecke, & Nolte, 2012; Haufe & Ewald, 2019; Nolte et al., 2004; Stam, Nolte, & Daffertshofer, 2007) were widely utilized and the latter one is less sensitive to volume conduction (Nentwich et al., 2020; Nolte et al., 2004). The limitation of coherence and correlation is that only either spectral components or temporal information can be observed while no information about brain dynamics is provided. Time‐frequency analysis methods are popular to study the changes in cortical connectivity, simultaneously extracting spectral and temporal information (Sankari, Adeli, & Adeli, 2012). The short‐time Fourier coherence (STFC) (Chen, Ros, & Gruzelier, 2013; Wendling, Ansari‐asl, Bartolomei, & Senhadji, 2009) and wavelet coherence (WC) (Ieracitano, Duun‐Henriksen, Mammone, La Foresta, & Morabito, 2017; Lachaux et al., 2002; Qassim, Cutmore, & Rowlands, 2017; Sankari et al., 2012; Sankari & Adeli, 2011) are utilized by several studies to produce EEG functional connectivity in the time‐frequency domain. STFC employs a fixed sliding window to achieve spectral analysis within the time window, while WC optimizes and adjusts the wavelet base for different signal frequencies to characterize time‐varying coherence (Sakkalis, 2011).
2.1.2. Nonlinear methods
Phase synchronization is a category that focuses on the phase coupling of oscillation systems. The phase locking value (PLV; Bajo et al., 2015; Bedo, Ribary, & Ward, 2020; Delgado‐Restituto, Romaine, & Rodríguez‐Vázquez, 2019; Mheich, Hassan, Khalil, Berrou, & Wendling, 2015; Sadaghiani & Kleinschmidt, 2016) and the phase lag index (PLI; Chaturvedi et al., 2019; Fraga González et al., 2018; Liao, Zhou, & Luo, 2019; Stam et al., 2007) are high‐frequently used to obtain the strength of phase synchronization. Information theory is regarded as another efficient method in the case of extracting nonlinear interactions among EEG signals. To be more specific, mutual information (MI; Melia et al., 2015; Meng, Yao, Sheng, Zhang, & Zhu, 2015; Piho & Tjahjadi, 2020; Rajendra Acharya et al., 2012; Yin et al., 2017) and synchronization likelihood (SL; Altenburg, Vermeulen, Strijers, Fetter, & Stam, 2003; Chriskos, Frantzidis, Gkivogkli, Bamidis, & Kourtidou‐Papadeli, 2018; Mumtaz, Ali, Yasin, & Malik, 2018; Pijnenburg et al., 2004; Yu et al., 2017) are used to estimate the undirected functional connectivity from EEG recordings, while the directed transfer of information can be quantified by transfer entropy (TE). Choosing SL as a connectivity measure might lead to biased results since SL is sensitive to volume conduction effects (Boersma et al., 2013). In contrast, TE has demonstrated its robustness against volume conduction. (Harmah et al., 2020; Huang, Pal, Chuang, & Lin, 2015; McBride et al., 2015; Yang, Le Bouquin Jeannes, Bellanger, & Shu, 2013; Yao & Wang, 2017). It should be noticed that information‐based approaches are fully model‐free. That is to say, relatively fewer assumptions tend to be imposed on the data, but it trades in the need for larger data sets (Seth et al., 2015; Zhao et al., 2020).
2.2. Parametric methods
The parametric methods refer to a framework or procedure where there is a specification of a model that requires a set of fixed parameters to be fitted to the observed signals (Sakkalis, 2011; Salman, Grover, & Shankar, 2018; Zhao, Billings, Wei, & Sarrigiannis, 2012). Compared with model‐free techniques, parametric‐model‐based methods are more commonly accepted to estimate the effective connectivity of multi‐channel EEGs. In this case, parametric effective connectivity is based on theoretical models that describe how brain areas interact and influence each other (Sakkalis, 2011). Dynamic causal modeling (DCM; Brown & Friston, 2012; Herz et al., 2012; Lee, Yoon, & Lee, 2020; Van de Steen, Almgren, Razi, Friston, & Marinazzo, 2019) applies a Bayesian framework to assess model performance, and structural equation modeling (SEM; Astolfi et al., 2004; Babiloni et al., 2003; Sartori, Bertoldo, Zavaglia, Ursino, & Toffolo, 2012)is a generalized linear modeling framework combining factor analysis with path modeling (Kaur et al., 2019). DCM and SEM treat the brain as a deterministic nonlinear and linear system, respectively (Astolfi et al., 2004; David et al., 2006; Friston, Harrison, & Penny, 2003).
Unlike DCM and SEM that require a certain amount of a priori knowledge about connectivity, many researchers have developed various data‐driven methods for quantifying effective connectivity based on Granger causality (Salman et al., 2018). Granger causality‐related methods occupy a useful middle ground between fully model‐free and highly model‐dependent approaches (Seth et al., 2015). Most of the Granger causality measures are constructed based on autoregressive models, in which the present samples of the signals are predicted using a linear or nonlinear combination of the past samples (Omidvarnia, Mesbah, Khlif, et al., 2011; Omidvarnia, Mesbah, O'Toole, et al., 2011; van Mierlo et al., 2014a; Zhao et al., 2020; Zhao, Billings, Wei, He, et al., 2013; Zhao, Billings, Wei, & Sarrigiannis, 2013). According to the considered coefficients of the autoregressive models, partial directed coherence (PDC; Ghumare, Schrooten, Vandenberghe, & Dupont, 2018; He, Billings, Wei, & Sarrigiannis, 2014; Mazher, Abd Aziz, Malik, & Ullah Amin, 2017; Silfverhuth, Hintsala, Kortelainen, & Seppänen, 2012; Varotto et al., 2012; Varotto et al., 2014) and directed transfer function (DTF; Haufe, Nikulin, & Nolte, 2011; Omidvarnia, Mesbah, Khlif, et al., 2011; Omidvarnia, Mesbah, O'Toole, et al., 2011) were applied in the field of EEG‐based neuroscience. PDC is computationally more efficient and more robust than DTF since it does not involve any matrix inversion (He, Billings, et al., 2014). Granger causality was originally developed in the context of linear autoregressive with exogenous (ARX) input models (Geweke, 1982), while some researchers focused on nonlinear causality, which is generated by nonlinear ARX model in time and frequency domains (Chen et al., 2019; He et al., 2013; He, Wei, Billings, & Sarrigiannis, 2014; Zhao, Billings, Wei, He, et al., 2013; Zhao, Billings, Wei, & Sarrigiannis, 2013). Besides the traditional Granger method, the error reduction ratio‐causality (ERR‐causality) test was proposed to estimate the time‐varying direction and strength of linear or nonlinear causality between two signals as well as their relative time shift (Sarrigiannis et al., 2014; Zhao et al., 2012, 2020).
3. VISUALISATION OF BRAIN CONNECTIVITY
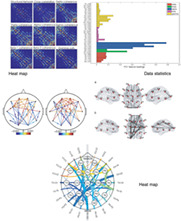
To effectively interpret results obtained from EEG recordings, many researchers have developed or employed various distinguished visualization approaches. This section aims to review the typical visualization methods for functional and effective connectivity and provide corresponding critical comparisons. The visualization methods can be categorized into three groups: heat map, data statistics, and head map.
Heat map generally employs an adjacency matrix to represent the quantification of brain connectivity, which performs well in showing the overall relationship between all pairs of available EEG channels. Chu et al. (2015) found a significant similarity between functional and structural networks within dysplasia patients. Regions of Interests (ROIs) for structural network analysis were selected to overlap with ROIs used for constructing the functional networks. The functional connectivity was quantified by cross‐correlation and coherence and visualized by a heat map, as shown in Figure 2a. This visualization method was also used in pediatric epilepsy studies (Sargolzaei et al., 2015) and the analysis of spontaneous blood oxygen level‐dependent signals (Chang, Liu, Chen, Liu, & Duyn, 2013).
FIGURE 2.
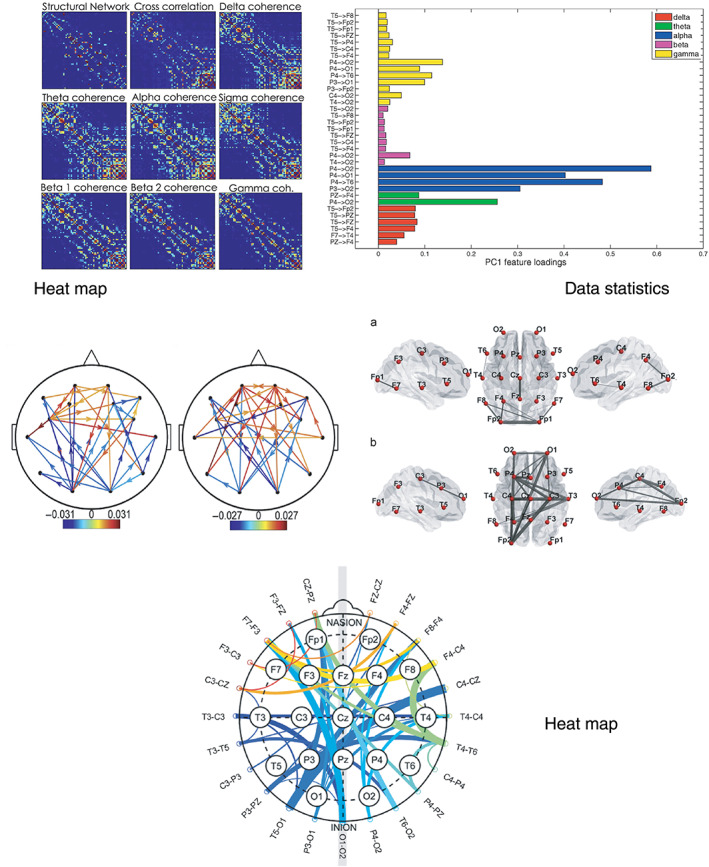
Examples of the visualization of brain connectivity. (a) Structural and functional networks are topologically similar. Examples of structural and functional adjacency matrices from one patient. Similarity between structural network architecture and cross‐correlation and coherence functional networks is visually evident (Chu et al., 2015). (b) Contribution of non‐normalized directed transfer function (NDTF) pairs variables to PC1 in terms of Principal component analysis (PCA) loadings. Only these NDTF pairs which showed statistical differences between Nold and AD groups on the level p <0.0005 contributed. It provides information about the importance of a particular parameter in the classification procedures (Blinowska et al., 2017). (c) Constructed functional connectivity map (The threshold of is applied as the connection strength) for subject diagnosed with left frontal region epilepsy and subject diagnosed with generalized epilepsy (Sargolzaei, Cabrerizo, Goryawala, Salah, & Adjouadi, 2015). (d) Effective brain networks (averaged over all participants) for responses to different emotional music (Shahabi & Moghimi, 2016). (e) A revised circular graph plot overlaid with EEG electrode locations to highlight the real electrode locations and their corresponding locations in the plot (Zhao et al., 2020)
The data statistic method tends to quantitatively compare targeted pairs and visualize significant ones by setting a threshold. Blinowska et al. (2017) demonstrated a statistical difference among a series of directed pairs in the contribution of Nonnormalized directed transfer function pairs values (Figure 2b), indicating the most important connections for the discrimination between healthy elderly and Alzheimer's disease individuals (Blinowska et al., 2017). Similarly, PLI was estimated and visualized by a statistic method for patients with Fragile X Syndrome (FXS; Van Der Molen, Stam, & Van Der Molen, 2014), where the healthy control group shows the brain connectivity difference in typical frequency ranges.
With a combination of brain connectivity and a head map, researchers were able to represent the distinction between health and disease and responses to external stimuli while demonstrating the importance of specific brain regions. Figures 2c,d visualize brain functional connectivity for epilepsy diagnosis (Sargolzaei et al., 2015) and effective connectivity for human emotional responses to various types of music (Shahabi & Moghimi, 2016) respectively. Besides, Zhao et al. (2020) proposed a revised circular graph to visualize the functional connectivity quantification for the classification of Alzheimer's disease (Figure 2e), which demonstrates the potential contribution of specific regions to disease diagnosis.
Both heat map and head map methods can represent connectivity distributions reflecting an extent involvement of specific brain regions. The heat map employs an adjacency matrix to show interconnections between each electrode pair, while the head map helps isolate and visualize brain areas of interest that can be used in developing specific applications, such as the representation of connectivity differences for diagnostic purposes (i.e., brain network function in health and various neurological disorders). It is worth noting that the determination of an appropriated threshold is important for the implementation of an appropriate head map method, since too much or too little information may limit connectivity interpretation. Moreover, a heat map is usually used for visualizing functional connectivity but not effective connectivity while the head map can reveal both types of connectivity. Another advantage of heat map is that it can generate appropriate inputs for deep learning models. For instance, Chen et al. (2019) used MI to build the heat map, which is then used as the inputs to the CNNs. The data statistics approach, compared with the other two methods, focuses more on quantification. To be more specific, this method tends to provide numerical comparison and select the most valuable connections by setting thresholds. Therefore, it is more suitable for studies that aim to reflect on data difference among a limited number of electrode pairs. However, the overall topological connectivity characteristics cannot be represented, which limits the ability to infer the contribution of structural connectivity to the findings.
4. APPLICATIONS AND ML
4.1. Practical application
Increasing evidence exists that brain connectivity analysis, quantified by statistical dependence (e.g., correlation and coherence), information theory, and parametric and nonparametric causality analysis, can reveal the changes of the brain signal behavior or patterns of neurological patients. Over the past few years, there was substantial developments and emergences of a great number of promising results for analyzing and understanding different types of neurological disorders such as Alzheimer's disease (Bajo et al., 2015; delEtoile & Adeli, 2017; Engels et al., 2015; Sankari & Adeli, 2011), epilepsy (Clemens et al., 2013; Douw et al., 2010; Visani et al., 2010; Xie & Krishnan, 2013) and Parkinson's disease (Chaturvedi et al., 2019; Evangelisti et al., 2019; Handojoseno et al., 2013; Yuvaraj et al., 2016). In addition to neurological and neurophysiological studies and associated clinical applications, there is a wide range of applications where the research objectives are to assist human in understanding brain behavior, for example, emotion recognition (Khosrowabadi, Heijnen, Wahab, & Quek, 2010; Lee & Hsieh, 2014; Shahabi & Moghimi, 2016), object recognition (Kaur et al., 2019; Supp et al., 2007; Tafreshi et al., 2019), mental assessment (Al‐Shargie et al., 2019; Cattai et al., 2018; Rathee, Cecotti, & Prasad, 2017), and biometric identification (Fraschini, Pani, Didaci, & Marcialis, 2019; La Rocca et al., 2014; Wang et al., 2019).
In the meantime, the rapid progression of ML technology, applied in the field of brain connectivity has led to very significant developments, aiming to achieve a deeper and better understanding of brain network behaviors for the health group and patients with various neurological conditions. Table 2 shows a depiction of some recent applications of brain connectivity estimations supported by ML methods.
TABLE 2.
Recent applications combining brain connectivity estimations with machine learning methods
| Applications | Estimation + ML method |
|---|---|
| Object recognition (Tafreshi et al., 2019) | PCC, WC, MSC, PS, and MI + SVM |
| Diagnosis of Parkinson's disease‐related dementia and Alzheimer's disease (Jeong, Do Kim, Song, Chung, & Jeong, 2016) | WC + linear discriminant analysis (LDA) |
| Prediction of freezing of gait in Parkinson's disease patients (Handojoseno et al., 2013) | PCC + multilayer perceptron neural network and k‐nearest neighbor classifier |
| Emotion recognition (Piho & Tjahjadi, 2020) | MI + SVM, naive Bayes (NB) classifier, and K‐nearest neighbors (KNN) |
| Detection of brain responses to emotional music (Shahabi & Moghimi, 2016) | DTF + SVM |
| Discrimination between Alzheimer's patients and healthy individuals (Blinowska et al., 2017) | DTF + artificial neural networks (ANNs) |
| Depression diagnosis (Saeedi et al., 2020) | PDC and DTF + long short‐term memory and convolutional neural networks (CNN) |
| Attention‐deficit/hyperactivity disorder identification (Chen et al., 2019) | MI + CNN |
| Diagnosis of Alzheimer's disease (Zhao et al., 2020) | ERR + KNN |
| Diagnosis of major depressive disorder (Mumtaz et al., 2018) | SL + SVM, logistic regression (LR) and NB |
| Classification of autism spectrum disorder (Jamal et al., 2014) | PS + LDA and SVM |
| Speech categorization decisions (Al‐Fahad, Yeasin, & Bidelman, 2019) | PCC and graph network + SVM and LDA |
| Transcranial magnetic stimulation monitoring (Gupta, Du, Hong, & Choa, 2019) | Coherence + principal component analysis (PCA) along sparse nonnegative matrix factorization (NMF) |
| Detecting disorders of consciousness (Wang, Tian, Zhang, & Hu, 2020) | Ensemble of SVMs + power spectral density difference (PSDD) incorporating with a recursive cosine function |
| Sedation scale estimation (Sanz‐García et al., 2019) | PS + SVM |
| Detecting psycho‐physiological insomnia (Aydın, Tunga, & Yetkin, 2015) | MI, PCC and MSC + NB, random forest, regression methods and nearest neighbor based methods |
| Investigation of the effect of Clozapine therapy (Ravan, Hasey, Reilly, MacCrimmon, & Khodayari‐Rostamabad, 2015) | Cross‐power spectral density (CPSD) + fuzzy c‐mean |
| Face perception tasks (Jamal, Das, Maharatna, Pan, & Kuyucu, 2015) | PLV + LDA and KNN |
4.2. Hand‐crafted versus imaging features
On one hand, state‐of‐the‐art methods for EEG‐based applications mostly apply a procedure that comprises hand‐crafted features and traditional ML classifiers. For example, “PCC, WC, MSC, PS, and MI + SVM” is applied to object recognition (Tafreshi et al., 2019), “WC + LDA” is used for the diagnosis of Parkinson's disease‐related dementia and Alzheimer's disease (Jeong et al., 2016), “DTF + SVM” is used for the detection of brain responses to emotional music (Shahabi & Moghimi, 2016) and “SL + SVM, LR, and NB” is used for the diagnosis of major depressive disorder (Mumtaz et al., 2018). On the other hand, various visualization methods provide robust features for deep learning in recent years. For instance, Saeedi et al. (2020) reconstructed a connectivity image using two connectivity measures (PDC and DTF) and eight frequency bands for the input of deep learning networks. The proposed achieved an accuracy of 99.24% in the case of major depressive disorder diagnosis.
5. DISCUSSION
5.1. Connectivity estimation
Brain connectivity has shown significant potential in assessing brain function in patients with different neurological disorders and tracking various cognitive and emotional brain states for healthy participants. It is crucial to select the most appropriate connectivity measure, as widely distributed complex brain networks generate diverse topological signal processing and intercommunications in distinct conditions. Therefore, many novel methods have been developed from manifold aspects. This includes consideration of linear or nonlinear behaviors, the information in time, frequency or time‐frequency domain, parametric or nonparametric measures, directed or undirected information.
5.1.1. Functional connectivity versus effective connectivity
In the studies of effective connectivity, parametric methods have been extensively used to quantify directional interconnections among separated brain regions. The main advantage of parametric modeling of effective analysis is that the model structure is usually transparent and compact, with lagged signals being the model variables. The estimation of parametric models usually does not need a large number of samples, therefore parametric modeling allows to perform a transient or time‐dependent connectivity analysis (Li, Lei, Cui, Guo, & Wei, 2019; Zhao et al., 2012). On the other hand, functional connectivity captures statistical independence between distributed and spatially separated neuronal areas, using for example, a bi‐variate measure (Wang et al., 2019). Functional connectivity is generally model‐free, which decreases the need of setting strict assumptions on signals. However, the amount of data needs to be increased to meet the calculation demand of functional connectivity estimation.
5.1.2. Phase‐based connectivity versus amplitude‐based connectivity
Brain connectivity can also be divided into phase‐based connectivity and amplitude‐based connectivity. Connectivity of the amplitude is usually estimated with correlation (Brookes et al., 2011; Chang et al., 2013; Hipp & Siegel, 2015; Wang et al., 2020), while phase coupling is generally estimated with coherence‐based methods and phase synchronization (Bastos & Schoffelen, 2016; Chaturvedi et al., 2019; Fagerholm et al., 2020; Nolte et al., 2004; Stam et al., 2007). These aspects further capture different neural processes (He et al., 2019; Siems & Siegel, 2020). As a result, the phase‐ and amplitude‐based approaches give partially overlapping, partially differing results. At the same time, it has been shown that in noisy signals, phase and amplitude dynamics influence each other and the reliability of phase estimation inherently depends on the signal‐to‐noise ratio (SNR) and may generally be more accurate in the presence of higher signal amplitudes (He et al., 2019).
5.1.3. Precautions during analysis
Volume conduction, an important issue when analyzing EEG recordings, has been shown to influence sensor‐space connectivity analyses (Haufe et al., 2013), for example, phase coupling (Palva et al., 2018), Granger causality (Haufe et al., 2013), and correlation methods (Hipp & Siegel, 2015). To avoid the effect of volume conduction, some methodshave been proposed, such as imaginary part of the coherency (van Mierlo et al., 2014a), DTF (Kamifiski & Bfinowska, 1991) and PDC (Baccalá & Sameshima, 2001). Besides, calculating source‐level connectivity from sensor‐level EEGs could get rid of the influence caused by volume conduction or field propagation (He et al., 2019). This process is the so‐called inverse problem (Van Diessen et al., 2015). In the meantime, some researchers suggest the interpretation of connectivity measures from sensor‐level EEG recordings is not straightforward. Instead, source‐level EEG is believed to be a reliable tool for measuring connectivity and it can be reconstructed from the scalp EEG (Moezzi & Goldsworthy, 2018).
5.2. Role of visualization
Visualization plays a crucial role in the research of EEG brain connectivity. Specifically, it establishes the base for further practical and clinical uses of novel methods. It could not only improve the efficiency for other researchers to understand and evaluate the proposed approaches and produced results, but also benefit experts in presenting and explaining the finding obtained from various advanced methods to people without basic knowledge of EEG signals and brain connectivity. The heat map, data statistics and head map generally conclude various popular visualization methods and meet the distinct requirements and aims of researchers.
Besides, EEG study could be combined with appropriate visualization methods to study potential functions, oscillations and intercommunications within a dynamic architecture of the human brain (Chen et al., 2013). The current medical instrument related to EEG focuses on oscillations and biomarkers within a signal channel (Ratti, Waninger, Berka, Ruffini, & Verma, 2017). Therefore, from the authors' point of view, development and innovations of visualization have the potential to promote the upgrading of EEG‐related equipment, as well as explore more secrets within the human brain.
Another opportunity for brain connectivity visualization is the combination with deep learning methods, which has attracted increasing investigation for brain study. There is a significant amount of works to use a variety of deep learning methods in the understanding of EEG recording, but most of them use the raw data directly. The limitation of such approaches is the lack of transparency because they usually cannot reveal which brain region has the anomaly and how it leads to neurological disorders. There is increasing evidence that CNN has superior performance to classify images by learning the spatial pattern of raw images automatically, instead of using handcrafted features. Therefore, it is promising to use the brain connectivity visualization, in a form of images, to be fed into CNN in the classification. Essentially, in this approach, brain connectivity acts as handcrafted features, but in an image format instead of singular values. Chen et al. proposed a general framework for the attention‐deficit/hyperactivity disorder (ADHD) identification problem by combining an EEG‐based brain network, estimated by MI, with CNN techniques (2019). The proposed framework achieved a convincing performance with an accuracy of 94.67% with the heat map visualization. Besides functional connectivity, effective connectivity visualization can also provide valuable inputs for CNN. For example, Saeedi et al. (2020) constructed a connectivity image with two connectivity measures (PDC and DTF) and eight frequency bands as the input of deep learning networks. The experiments show that the CNN applied on the constructed image of effective connectivity achieves the best results with an accuracy of 99.24% in the case of major depressive disorder diagnosis.
5.3. Research gaps and future direction
Although significant outcomes in this area have been achieved, limitations and significant challenges remain. First, brain network interactions are dynamic and may be time‐varying (the associated signals are nonstationary), as phase synchronization and phase scattering occur within the millisecond range (Varela, Lachaux, Rodriguez, & Martinerie, 2001). Transient associations, usually highly nonlinear, among different brain regions have been observed (Sarrigiannis et al., 2014, 2018). Even though recent years witnessed the development of brain connectivity techniques, there are limited methods that can analyze nonstationary and nonlinear behaviors of brain networks. Exploring the hidden information within EEG signals is far beyond the capabilities of commonly available methods. Second, simplifying the interpretation of data‐driven methods is a challenge. While traditional parametric models extended from AR models, for example, autoregressive moving average with exogenous input (ARMAX) and nonlinear autoregressive moving average with exogenous input (NARMAX) models (Gu et al., 2021) and dynamic causal model (David et al., 2006) are parsimonious and transparent, whose individual model terms have a clear explanation and can be linked back to the original neural system, other types of parametric models for example, nonlinear kernel models (Shen, Baingana, & Giannakis, 2016) tend to be complicated and it becomes difficult to relate the models back to the underlying system due to the lack of transparency. Interpretation of the outcomes of nonparametric methods for example, neural networks (Abbasvandi & Nasrabadi, 2019; Saeedi et al., 2020) require sufficient mathematical knowledge and probably some specific and professional modeling skills. Therefore, the overall performance of such methods heavily depends on the experience and knowledge of the end‐users, typically clinicians or doctors if the tools are developed for clinical applications. Third, there is no real‐time feedback of brain functional connectivity during data acquisition in current EEG systems. As a result, scientists (e.g., neurologists or neurophysiologists) cannot flexibly focus on the examination of specific network areas in real‐time or determine where the most significant abnormalities state or behavior takes place. Some researchers have started to integrate EEG with augmented reality (Mercier‐Ganady, Lotte, Loup‐Escande, Marchal, & Lecuyer, 2014; Vortmann et al., 2019), but they only focused on the information obtained from a single channel. There is a lack of applications to track and visualize time‐varying brain connectivity in real‐time. Fourthly, from the authors' point of view, there are a lot of visualization and imaging techniques in neuroscience and some of them used for other imaging modalities also have the potential to visualize EEG brain connectivity. For instance, BioImage Suite provides an attractive and interpretative visualization for fMRI functional connectivity (Finn et al., 2015; Shen et al., 2018).
Therefore, even though brain connectivity techniques have been significantly developed over the past years, more validation and improvements/developments are still required. Table 3 suggests potential directions and possible strategies, which will help deepen our understanding of brain functional and effective connectivity from a variety of novel perspectives, as well as how to enhance their availability and reliability.
TABLE 3.
The potential directions of EEG brain connectivity research
| Future direction | Purpose or strategy |
|---|---|
| Novel estimation | Extract more valuable information from EEG signals by robust brain connectivity methods, especially nonstationary and nonlinear intercommunications. |
| Interpretability | Design appropriate visualization methods to reduce the difficulty of understanding the actual implication of brain connectivity estimation and its outcomes, such as disease diagnosis and brain activity analysis. |
| Universality | Build a large dataset covering people with different ages, genders and diseases conditions to develop and evaluate universal brain connectivity methods. |
| Real‐time research | Establish a real‐time sensor and monitoring system based on advanced brain connectivity estimation and visualization approaches, capturing dynamic neuro‐connectivity and assisting observation. |
| Improved diagnosis | Using the visualization of estimated brain functional or effective connectivity as the input of deep learning method to maintain the transparency and improve the classification accuracy. |
| Application extension | Pursue a deeper understanding of the brain network and explore potential fields where EEG brain connectivity can be used. |
6. CONCLUSIONS
This article reviewed recent studies in estimating brain functional and effective connectivity using EEG with associated visualization as well as their applications. It is observed that functional connectivity is usually measured using nonparametric methods while effective connectivity is measured by parametric methods. In comparison to parametric methods, nonparametric methods require relatively fewer assumptions, but they trade in the need for larger data sets. Nonlinear dynamics and the spatiotemporal characteristics of brain networks hidden within EEG recordings have the potential to be identified using appropriate functional and effective connectivity methods. Although progress has been made the potential of those methods is far from being fully explored. It is expected that future research in this area will focus on better integrating different methods in particular ML approaches to improve the accuracy of disease diagnosis meanwhile increasing transparency. Real‐time visualization of brain connectivity during the data acquisition stage can be introduced to improve the data quality, and help scientists better identify which areas of the brain exhibit connectivity deficits under various neurological conditions.
ACKNOWLEDGMENT
Author Yuzhu Guo gratefully acknowledge the support from the Beijing Natural Science Foundation, China (Grant No. 4202040) and the National Natural Science Foundation of China (Grant No. 61876015).
Open access funding enabled and organized by Projekt DEAL.
THE CONCEPTUAL AND MATHEMATICAL DETAILS FOR CALCULATING BRAIN CONNECTIVITY
Functional connectivity
Correlation
PCC is able to evaluate the linear interdependency between two signals in the time domain and it ranges from −1 to +1. The correlation coefficient between signal and can be defined as follows (van Mierlo et al., 2014a):
| (1) |
where E is the expected value, and are the mean values and and are the standard deviations of and time series.
Cross‐correlation differs from PCC since it is a function with respect to time lag τ, which can be expressed as (Ibrahim et al., 2018; van Mierlo et al., 2014a).
| (2) |
Magnitude squared coherence
MSC is a linear method to estimate the interconnections between two signals in the frequency domain calculated by PSD. The MSC of signal and can be written as (van Mierlo et al., 2014a, 2014b; Wendling et al., 2009)
| (3) |
where and ) are the PSD of signal and respectively, and is the cross PSD at frequency .
To avoid the volume conduction effects, the imaginary part of the coherency is employed by a few studies instead of looking at the magnitude and phase of the coherency (Ewald et al., 2012; Van Diessen et al., 2015; van Mierlo et al., 2014a).
| (4) |
Wavelet coherence
WC is generally acknowledged as a qualitative estimator that can represent the time‐varying relations in the time‐frequency domain between signals with a specifically determined scale (Labat, 2005; Tafreshi et al., 2019). To be more specific, the wavelet transforms of a signal is a function of both time and frequency, which is defined as the convolution of the input with a Wavelet family :
| (5) |
Wavelet cross‐spectrum around time and frequency , given input signals and , can be derived by the Wavelet transforms of and :
| (6) |
where * defines the complex conjugate and is assumed as a frequency‐depending scalar.
WC at the time and frequency is derived as:
| (7) |
Short‐time Fourier coherence
Short‐time Fourier transform (STFT) is also implemented in the time‐frequency domain instead of the classical fast Fourier transform approach to calculate coherence, and coherence may be calculated around a number of time instants. This technique produces the so‐called “coherogram,” which forms a three‐dimensional matrix of time and frequency against coherence. However, stationarity is still required within each time interval for which coherence is calculated, meaning that in practice one should carefully decide on the optimal section length over which each coherence estimate is measured. Window length and overlapping within each coherence estimate affect the resolution of the measure (Delgado‐Restituto et al., 2019; Sakkalis, 2011).
Phase synchronization
Phase synchronization (PS) assumes two oscillation systems without amplitude synchronization can have phase synchronization. The PLV and the PLI are high‐frequently used to obtain the strength of phase synchronization (van Mierlo et al., 2014a). The instantaneous phase of a signal is given by:
| (8) |
where is the Hilbert transform of which is defined as:
| (9) |
where refers to the Cauchy principal value. The PLV for two signals is defined as:
| (10) |
where defines the sampling period and indicates the sample number of each signal (Mormann, Lehnertz, David, & Elger, 2000). The range of PLV is from 0 to 1, where 0 shows a lack of synchronization and 1 indicates strict phase synchronization.
The PLI captures the asymmetry of the distribution of phase differences between two signals and is calculated based on the relative phase difference between the two signals(Borrego‐Salcido, Juárez‐Del‐Toro, & Cruz.Aké, 2019; Wendling et al., 2009).
| (11) |
The resulting value lies in the interval , where a higher value indicates more phase synchrony.
Synchronization likelihood
SL is a measure of multivariate synchronization to investigate the interactions between nonlinear dynamical systems without any knowledge about the governing equations (Stam & van Dijk, 2002). For an M‐channel time series (k denotes channel number [k = 1,…, M]), embedded vectors are reconstructed with time‐delay embedding:
| (12) |
where is the embedding dimension and denotes time lag. The estimated probability that embedded vectors are closer to each other than a distance is (Wendling et al., 2009):
| (13) |
where is the Euclidean distance; stands for the Heaviside step function, is the Theiler correction and determines the length of the sliding window. Letting , where , the number of channels where the embedded vectors and will be closer together than this critical distance :
| (14) |
SL at time can be obtained by averaging over all values of
| (15) |
All aforementioned measures are normalized between 0 and 1; the 0 value means that the two signals are completely independent. On the opposite, the 1 value means that the two signals are completely synchronized (Wendling et al., 2009).
Mutual information
According to information theory, MI of two random variables and shows how a random variable is informative for the other one. Let, and be the probability distributions of random variables and , respectively. The entropy of and is defined as (Tafreshi et al., 2019):
| (16) |
| (17) |
where n defines window length.
and are conditional entropy and joint entropy between and , defined respectively as:
| (18) |
| (19) |
where E is the expected value function.
MI of two random variables and is computed as follows (Khosrowabadi et al., 2010):
| (20) |
if and only if random variables and are statistically independent.
Effective connectivity
Granger causality
Granger causality can estimate effective interactions from time‐series data Granger causality implements a statistical, predictive notion of causality whereby causes precede and help predict their effects (Seth et al., 2015). It is defined in both the time and frequency domains, and it allows for the conditioning out of common causal influences. One time series is said to Granger cause a second one if the inclusion of the past values of the first into the modeling of the second significantly reduces the variance of the modeling error. According to Granger causality, if the past values of contain information that helps to predict above and beyond the information contained in past values of alone then signal “Granger‐causes” signal . The Granger causality from signal to and the one from signal to can be investigated separately. (van Mierlo et al., 2014a).
Partial directed coherence
PDC is a method that quantifies the relation between two among N signals, avoiding volume conduction by estimating influences of all other signals (Tafreshi et al., 2019). PDC improves the concept of Partial Coherence by estimating causal influences. This method is estimated on multivariate autoregressive (MVAR).
is a set of estimated signals from N recording channels:
| (21) |
The MVAR process is an expressive description of the data set :
| (22) |
In this model is a zero‐mean multivariate uncorrelated white noise vector. is the autoregressive coefficients matrix and its elements indicates the influence of on and represents the border of the model.
PDC from the channel to the channel at frequency is defined as follows:
| (23) |
where is a frequency‐domain description of (Baccalá & Sameshima, 2001; Granger & Aug, 2007)
| (24) |
Directed transfer function
The directed transfer function (DTF) is also based on the concept of Granger causality estimated on MVAR, which models all signals simultaneously (Kamifiski & Bfinowska, 1991). is a set of estimated signals from recording channels:
| (25) |
The MVAR process is an expressive description of the data set :
| (26) |
In this model is a zero‐mean multivariate uncorrelated white noise vector with . , ,…, is coefficients matrix and represent the border of the model. Equation (20) can be transformed into the frequency domain, which is defined as:
| (27) |
where
| (28) |
So, can be obtained by
| (29) |
is the transfer function of the system and its elements indicate the causal influence from the jth input to the ith output at frequency .
The DTF is defined as:
| (30) |
Normalized DTF is defined as:
| (31) |
where describes the influence ratio of the channel‐related cortical area on the channel‐related cortical area with respect to the influence of all estimated cortical signals (Babiloni et al., 2005). This is an important difference between DTF and PDC since DTF is normalized for the structure that receives the signal, whereas PDC is normalized for the structure that sends the signal (Baccalá & Sameshima, 2001).
Structural equation modeling
A set of linear structural equations are employed by the structural equation modeling (SEM), exploring causal intercommunications among the observed variables and parameters. In terms of neural systems, a measure of covariance represents the degree to which the activities of two or more regions are related. The SEM technique estimates the parameters by minimizing the difference between the observed covariances and those implied by a structural or path model (Astolfi et al., 2004; Babiloni et al., 2003).
Dynamic causal modeling
The aim of DCM (Friston et al., 2003) is to make inferences about the coupling among brain regions or sources and how that coupling is influenced by experimental factors. DCM uses the notion of effective connectivity, defined as the influence one neuronal system exerts over another. The central idea behind DCM is to treat the brain as a deterministic nonlinear dynamical system that is subject to inputs and produces outputs. In neuroimaging, DCM starts with a reasonably realistic neuronal model of interacting cortical regions. This model is then supplemented with a forward model of how neuronal activity is transformed into measured responses. This enables effective connectivity of the neuronal model to be estimated from observed data (David et al., 2006; Yvert, Perrone‐Bertolotti, Baciu, & David, 2012).
Transfer entropy
TE is an alternative measure of effective connectivity based on information theory. TE does not require a model of the interaction and is inherently nonlinear (Vicente, Wibral, & Lindner, 2011). TE for two observed time series and can be written as
| (32) |
where is a discrete‐valued time‐index and denotes the prediction time, a discrete‐valued time‐interval. and are and delay vectors (Vicente et al., 2011).
Error reduction ratio
Error reduction ratio (ERR) is a parametric method in the time domain, which indicates how much of the change in the system response, in percentage, can be accounted for by including the relevant model terms. This capability allows the computing of the contribution of linear and nonlinear terms independently without fitting the full nonlinear model, where parameter estimation and model validation are required. Consider a linear regression
| (33) |
where
| (34) |
and . are the model terms selected from the candidate term set. Matrix can be decomposed as where
| (35) |
and is an upper triangular matrix with unity diagonal elements.
Equation (33) is then rewritten as
| (36) |
where . Equation (36) is now ready to represent the relation between Y and G.
The importance of each model term to the variation of the system output is then estimated. Initially, set values for (A then becomes an identity matrix), so , and calculate as
| (37) |
For , set and then calculate
| (38) |
where . Next, the algorithm calculates
| (39) |
and
| (40) |
The ERR value for each term is finally defined as
| (41) |
Values of ERR range from 0 to 100%. The larger the value of ERR, the higher the dependence between this term and the output. To stop the search procedure and determine the number of significant terms , a criterion called Penalised Error‐to‐Signal Ratio (PESR) is used (Zhao et al., 2012). It can be written as
| (42) |
This criterion is introduced to monitor the search procedure, where denotes the index of the selected terms. The search procedure stops when achieves a local minimum. In this article, the value of was chosen as 8.
To calculate the contribution of the input to the output, the sum of ERR of all selected terms, denoted by , is calculated by
| (43) |
Note is the number of the selected terms, not the number of total candidate terms. The value of () describes the percentage explained by the identified model to the system output. If the considered inputs can fully explain the variation of the system output, the value of is equal to 100%.
The linearity of connectivity is represented by the sum of ERR of the linear terms, and it can be computed by
| (44) |
The nonlinearity of connectivity is represented by the sum of ERR of the nonlinear terms, and it can be computed by
| (45) |
Cao, J. , Zhao, Y. , Shan, X. , Wei, H. , Guo, Y. , Chen, L. , Erkoyuncu, J. A. , & Sarrigiannis, P. G. (2022). Brain functional and effective connectivity based on electroencephalography recordings: A review. Human Brain Mapping, 43(2), 860–879. 10.1002/hbm.25683
Funding information National Natural Science Foundation of China, Grant/Award Number: 61876015; Beijing Natural Science Foundation, China, Grant/Award Number: 4202040
DATA AVAILABILITY STATEMENT
Data sharing is not applicable to this review article as no new data was created or analyzed in this study.
REFERENCES
- Abbasvandi, Z. , & Nasrabadi, A. M. (2019). A self‐organized recurrent neural network for estimating the effective connectivity and its application to EEG data. Computers in Biology and Medicine, 110, 93–107. 10.1016/j.compbiomed.2019.05.012 [DOI] [PubMed] [Google Scholar]
- Akbarian, B. , & Erfanian, A. (2020). Biomedical signal processing and control a framework for seizure detection using effective connectivity, graph theory, and multi‐level modular network. Biomedical Signal Processing and Control, 59, 101878. 10.1016/j.bspc.2020.101878 [DOI] [Google Scholar]
- Al‐Fahad, R. , Yeasin, M. , Bidelman, G.M. (2019). Unsupervised decoding of single‐trial EEG reveals unique states of functional brain connectivity that drive rapid speech categorization decisions. bioRxiv . 10.1101/686048 [DOI] [PMC free article] [PubMed]
- Al‐Shargie, F. , Tariq, U. , Hassanin, O. , Mir, H. , Babiloni, F. , & Al‐Nashash, H. (2019). Brain connectivity analysis under semantic vigilance and enhanced mental states. Brain Sciences, 9, 363. 10.3390/brainsci9120363 [DOI] [PMC free article] [PubMed] [Google Scholar]
- Altenburg, J. , Vermeulen, R. J. , Strijers, R. L. M. , Fetter, W. P. F. , & Stam, C. J. (2003). Seizure detection in the neonatal EEG with synchronization likelihood. Clinical Neurophysiology, 114, 50–55. 10.1016/S1388-2457(02)00322-X [DOI] [PubMed] [Google Scholar]
- Amin, H. U. , Yusoff, M. Z. , & Ahmad, R. F. (2020). A novel approach based on wavelet analysis and arithmetic coding for automated detection and diagnosis of epileptic seizure in EEG signals using machine learning techniques. Biomedical Signal Processing and Control, 56, 10707. 10.1016/j.bspc.2019.101707 [DOI] [Google Scholar]
- Astolfi, L. , Cincotti, F. , Mattia, D. , Salinari, S. , Babiloni, C. , Basilisco, A. , … He, B. (2004). Estimation of the effective and functional human cortical connectivity with structural equation modeling and directed transfer function applied to high‐resolution EEG. Magnetic Resonance Imaging, 22, 1457–1470. 10.1016/j.mri.2004.10.006 [DOI] [PubMed] [Google Scholar]
- Aydın, S. , Tunga, M. A. , & Yetkin, S. (2015). Mutual information analysis of sleep EEG in detecting psycho‐physiological insomnia. Journal of Medical Systems, 39, 43. 10.1007/s10916-015-0219-1 [DOI] [PubMed] [Google Scholar]
- Babiloni, F. , Cincotti, F. , Babiloni, C. , Carducci, F. , Mattia, D. , Astolfi, L. , … He, B. (2005). Estimation of the cortical functional connectivity with the multimodal integration of high‐resolution EEG and fMRI data by directed transfer function. Neuroimage, 24, 118–131. 10.1016/j.neuroimage.2004.09.036 [DOI] [PubMed] [Google Scholar]
- Babiloni, F. , Cincotti, F. , Basilisco, A. , Maso, E. , Bufano, M. , Babiloni, C. , … Rubin, D. B. D. (2003). Frontoparietal cortical networks revealed by structural equation modeling and high resolution EEG during a short term memory task. International IEEE EMBS Conference on Neural Engineering NER 2003–January (pp. 79–82). Capri, Italy, 10.1109/CNE.2003.1196760 [DOI]
- Baccalá, L. A. , & Sameshima, K. (2001). Partial directed coherence: A new concept in neural structure determination. Biological Cybernetics, 84, 463–474. 10.1007/PL00007990 [DOI] [PubMed] [Google Scholar]
- Bajo, R. , Pusil, S. , López, M. E. , Canuet, L. , Pereda, E. , Osipova, D. , … Pekkonen, E. (2015). Scopolamine effects on functional brain connectivity: A pharmacological model of Alzheimer's disease. Scientific Reports, 5, 1–6. 10.1038/srep09748 [DOI] [PMC free article] [PubMed] [Google Scholar]
- Ball, G. , Aljabar, P. , Arichi, T. , Tusor, N. , Cox, D. , Merchant, N. , … Counsell, S. J. (2016). Machine‐learning to characterise neonatal functional connectivity in the preterm brain. NeuroImage, 124, 267–275. 10.1016/j.neuroimage.2015.08.055 [DOI] [PMC free article] [PubMed] [Google Scholar]
- Bastos, A. M. , & Schoffelen, J. M. (2016). A tutorial review of functional connectivity analysis methods and their interpretational pitfalls. Frontiers in Systems Neuroscience, 9, 1–23. 10.3389/fnsys.2015.00175 [DOI] [PMC free article] [PubMed] [Google Scholar]
- Battaglia, D. , & Brovelli, A. (2019). Functional connectivity and neuronal dynamics: Insights from computational methods. In The Cognitive Neurosciences (6th ed.). Retrieved from https://hal.archives-ouvertes.fr/hal-02304918 [Google Scholar]
- Bedo, N. , Ribary, U. , & Ward, L. M. (2020). Fast dynamics of cortical functional and effective connectivity during word Reading. PLoS One, 9, 1–24. 10.1371/journal.pone.0088940 [DOI] [PMC free article] [PubMed] [Google Scholar]
- Blinowska, K. J. , Rakowski, F. , Kaminski, M. , De Vico Fallani, F. , Del Percio, C. , Lizio, R. , & Babiloni, C. (2017). Functional and effective brain connectivity for discrimination between Alzheimer's patients and healthy individuals: A study on resting state EEG rhythms. Clinical Neurophysiology, 128, 667–680. 10.1016/j.clinph.2016.10.002 [DOI] [PubMed] [Google Scholar]
- Boersma, M. , Smit, D. J. A. , Boomsma, D. I. , de Geus, E. J. C. , Delemarre‐Van de Waal, H. A. , & Stam, C. J. (2013). Growing trees in child brains: Graph theoretical analysis of electroencephalography‐derived minimum spanning tree in 5‐ and 7‐year‐old children reflects brain maturation. Brain Connectivity, 3, 50–60. 10.1089/brain.2012.0106 [DOI] [PubMed] [Google Scholar]
- Borrego‐Salcido, C. , Juárez‐Del‐Toro, R. , & Cruz.Aké, S. (2019). Linear and nonlinear causality between marriages, births, and economic growth. Revista Mexicana de Economía y Finanzas Nueva Época, 15, 37–55. 10.21919/remef.v15i1.413 [DOI] [Google Scholar]
- Brookes, M. J. , Hale, J. R. , Zumer, J. M. , Stevenson, C. M. , Francis, S. T. , Barnes, G. R. , … Nagarajan, S. S. (2011). Measuring functional connectivity using MEG: Methodology and comparison with fcMRI. NeuroImage, 56, 1082–1104. 10.1016/j.neuroimage.2011.02.054 [DOI] [PMC free article] [PubMed] [Google Scholar]
- Brown, H. R. , & Friston, K. J. (2012). Dynamic causal modelling of precision and synaptic gain in visual perception ‐ An EEG study. NeuroImage, 63, 223–231. 10.1016/j.neuroimage.2012.06.044 [DOI] [PMC free article] [PubMed] [Google Scholar]
- Cao, J. , Grajcar, K. , Shan, X. , Zhao, Y. , Zou, J. , Chen, L. , … Sarrigiannis, P. G. (2021). Biomedical signal processing and control using interictal seizure‐free EEG data to recognise patients with epilepsy based on machine learning of brain functional connectivity. Biomedical Signal Processing and Control, 67, 102554. 10.1016/j.bspc.2021.102554 [DOI] [Google Scholar]
- Cattai, T. , Colonnese, S. , Corsi, M.C. , Bassett, D.S. , Scarano, G. & De Vico Fallani, F. 2018. Characterization of mental states through node connectivity between brain signals. European Signal Processing Conference 2018–September (pp. 1377–1381). Rome, Itlay. 10.23919/EUSIPCO.2018.8553000 [DOI]
- Chang, C. , Liu, Z. , Chen, M. C. , Liu, X. , & Duyn, J. H. (2013). EEG correlates of time‐varying BOLD functional connectivity. NeuroImage, 72, 227–236. 10.1016/j.neuroimage.2013.01.049 [DOI] [PMC free article] [PubMed] [Google Scholar]
- Chaturvedi, M. , Bogaarts, J. G. , Kozak (Cozac), V. V. , Hatz, F. , Gschwandtner, U. , Meyer, A. , … Roth, V. (2019). Phase lag index and spectral power as QEEG features for identification of patients with mild cognitive impairment in Parkinson's disease. Clinical Neurophysiology, 130, 1937–1944. 10.1016/j.clinph.2019.07.017 [DOI] [PubMed] [Google Scholar]
- Chen, H. , Song, Y. , & Xiaoli, L. (2019). A deep learning framework for identifying children with ADHD using an EEG‐based brain network. Neurocomputing, 356, 83–96. 10.1016/j.neucom.2019.04.058 [DOI] [Google Scholar]
- Chen, J. , Ros, T. , & Gruzelier, J. H. (2013). Dynamic changes of ICA‐derived EEG functional connectivity in the resting state. Human Brain Mapping, 34, 852–868. 10.1002/hbm.21475 [DOI] [PMC free article] [PubMed] [Google Scholar]
- Chriskos, P. , Frantzidis, C. A. , Gkivogkli, P. T. , Bamidis, P. D. , & Kourtidou‐Papadeli, C. (2018). Achieving accurate automatic sleep staging on manually pre‐processed EEG data through synchronization feature extraction and graph metrics. Frontiers in Human Neuroscience, 12, 1–13. 10.3389/fnhum.2018.00110 [DOI] [PMC free article] [PubMed] [Google Scholar]
- Chu, C. J. , Tanaka, N. , Diaz, J. , Edlow, B. L. , Wu, O. , Hämäläinen, M. , … Kramer, M. A. (2015). EEG functional connectivity is partially predicted by underlying white matter connectivity. NeuroImage, 108, 23–33. 10.1016/j.neuroimage.2014.12.033 [DOI] [PMC free article] [PubMed] [Google Scholar]
- Clayden, J. D. (2013). Imaging connectivity: MRI and the structural networks of the brain. Functional Neurology, 28, 197–203. 10.11138/FNeur/2013.28.3.197 [DOI] [PMC free article] [PubMed] [Google Scholar]
- Clemens, B. , Puskás, S. , Besenyei, M. , Spisák, T. , Opposits, G. , Hollódy, K. , … Emri, M. (2013). Neurophysiology of juvenile myoclonic epilepsy: EEG‐based network and graph analysis of the interictal and immediate preictal states. Epilepsy Research, 106, 357–369. 10.1016/j.eplepsyres.2013.06.017 [DOI] [PubMed] [Google Scholar]
- Colclough, G. L. , Woolrich, M. W. , Tewarie, P. K. , Brookes, M. J. , Quinn, A. J. , & Smith, S. M. (2016). How reliable are MEG resting‐state connectivity metrics? NeuroImage, 138, 284–293. 10.1016/j.neuroimage.2016.05.070 [DOI] [PMC free article] [PubMed] [Google Scholar]
- Cvetkovic, D. , Derya, E. , & Cosic, I. (2008). Wavelet transform feature extraction from human PPG, ECG, and EEG signal responses to ELF PEMF exposures: A pilot study. Digital Signal Processing, 18, 861–874. 10.1016/j.dsp.2007.05.009 [DOI] [Google Scholar]
- David, O. , Kiebel, S. J. , Harrison, L. M. , Mattout, J. , Kilner, J. M. , & Friston, K. J. (2006). Dynamic causal modeling of evoked responses in EEG and MEG. NeuroImage, 30, 1255–1272. 10.1016/j.neuroimage.2005.10.045 [DOI] [PubMed] [Google Scholar]
- delEtoile, J. , & Adeli, H. (2017). Graph theory and brain connectivity in Alzheimer's disease. The Neuroscientist, 23, 616–626. 10.1177/1073858417702621 [DOI] [PubMed] [Google Scholar]
- Delgado‐Restituto, M. , Romaine, J. B. , & Rodríguez‐Vázquez, Á. (2019). Phase synchronization operator for on‐Chip brain functional connectivity computation. IEEE Transactions on Biomedical Circuits and Systems, 13, 957–970. 10.1109/TBCAS.2019.2931799 [DOI] [PubMed] [Google Scholar]
- Dhiman, R. , Saini, J. S. , & Priyanka. (2014). Genetic algorithms tuned expert model for detection of epileptic seizures from EEG signatures. Applied Soft Computing, 19, 8–17. 10.1016/j.asoc.2014.01.029 [DOI] [Google Scholar]
- Douw, L. , van Dellen, E. , de Groot, M. , Heimans, J. J. , Klein, M. , Stam, C. J. , & Reijneveld, J. C. (2010). Epilepsy is related to theta band brain connectivity and network topology in brain tumor patients. BMC Neuroscience, 11, 1–10. 10.1186/1471-2202-11-103 [DOI] [PMC free article] [PubMed] [Google Scholar]
- Engels, M. M. A. , Stam, C. J. , Van Der Flier, W. M. , Scheltens, P. , De Waal, H. , & Van Straaten, E. C. W. (2015). Declining functional connectivity and changing hub locations in Alzheimer's disease: An EEG study. BMC Neurology, 15, 1–8. 10.1186/s12883-015-0400-7 [DOI] [PMC free article] [PubMed] [Google Scholar]
- Erra, R. G. , Velazquez, J. L. P. , & Rosenblum, M. (2017). Neural synchronization from the perspective of non‐linear dynamics. Frontiers in Computational Neuroscience, 11, 98. 10.3389/fncom.2017.00098 [DOI] [PMC free article] [PubMed] [Google Scholar]
- Evangelisti, S. , Pittau, F. , Testa, C. , Rizzo, G. , Gramegna, L. L. , Ferri, L. , … Tinuper, P. (2019). L‐dopa modulation of brain connectivity in Parkinson's disease patients: A pilot EEG‐fMRI study. Frontiers in Neuroscience, 13, 1–10. 10.3389/fnins.2019.00611 [DOI] [PMC free article] [PubMed] [Google Scholar]
- Ewald, A. , Marzetti, L. , Zappasodi, F. , Meinecke, F. C. , & Nolte, G. (2012). Estimating true brain connectivity from EEG/MEG data invariant to linear and static transformations in sensor space. NeuroImage, 60, 476–488. 10.1016/j.neuroimage.2011.11.084 [DOI] [PubMed] [Google Scholar]
- Fagerholm, E. D. , Moran, R. J. , Violante, I. R. , Leech, R. , & Friston, K. J. (2020). Dynamic causal modelling of phase‐amplitude interactions. NeuroImage, 208, 116452. 10.1016/j.neuroimage.2019.116452 [DOI] [PubMed] [Google Scholar]
- Fan, L. , Li, H. , Zhuo, J. , Zhang, Y. , Wang, J. , Chen, L. , … Jiang, T. (2016). The human Brainnetome atlas: A new brain atlas based on connectional architecture. Cerebral Cortex, 26, 3508–3526. 10.1093/cercor/bhw157 [DOI] [PMC free article] [PubMed] [Google Scholar]
- Finn, E. S. , Shen, X. , Scheinost, D. , Rosenberg, M. D. , Huang, J. , Chun, M. M. , … Constable, R. T. (2015). Functional connectome fingerprinting: Identifying individuals using patterns of brain connectivity. Nature Neuroscience, 18, 1664–1671. 10.1038/nn.4135 [DOI] [PMC free article] [PubMed] [Google Scholar]
- Fraga González, G. , Smit, D. J. A. , van der Molen, M. J. W. , Tijms, J. , Stam, C. J. , de Geus, E. J. C. , & van der Molen, M. W. (2018). EEG resting state functional connectivity in adult dyslexics using phase lag index and graph analysis. Frontiers in Human Neuroscience, 12, 1–12. 10.3389/fnhum.2018.00341 [DOI] [PMC free article] [PubMed] [Google Scholar]
- Fraschini, M. , Pani, S. M. , Didaci, L. , & Marcialis, G. L. (2019). Robustness of functional connectivity metrics for EEG‐based personal identification over task‐induced intra‐class and inter‐class variations. Pattern Recognition Letters, 125, 49–54. 10.1016/j.patrec.2019.03.025 [DOI] [Google Scholar]
- Friston, K. J. (2001). Brain function, nonlinear coupling, and neuronal transients. The Neuroscientist, 7, 406–418. 10.1177/107385840100700510 [DOI] [PubMed] [Google Scholar]
- Friston, K. J. (2011). Functional and effective connectivity: A review. Brain Connectivity, 1, 13–36. 10.1089/brain.2011.0008 [DOI] [PubMed] [Google Scholar]
- Friston, K. J. , Harrison, L. , & Penny, W. (2003). Dynamic causal modelling. NeuroImage, 19, 1273–1302. 10.1016/S1053-8119(03)00202-7 [DOI] [PubMed] [Google Scholar]
- Gao, Z. , Wang, X. , Yang, Y. , Mu, C. , Cai, Q. , Dang, W. , & Zuo, S. (2019). EEG‐based spatio‐temporal convolutional neural network for driver fatigue evaluation. IEEE Transactions on Neural Networks and Learning Systems, 30, 2755–2763. 10.1109/TNNLS.2018.2886414 [DOI] [PubMed] [Google Scholar]
- Geweke, J. (1982). Measurement of linear dependence and feedback between multiple time series. Journal of the American Statistical Association, 77, 304–313. 10.1080/01621459.1982.10477803 [DOI] [Google Scholar]
- Ghumare, E. G. , Schrooten, M. , Vandenberghe, R. , & Dupont, P. (2018). A time‐varying connectivity analysis from distributed EEG sources: A simulation study. Brain Topography, 31, 721–737. 10.1007/s10548-018-0621-3 [DOI] [PMC free article] [PubMed] [Google Scholar]
- Granger, C. W. J. , & Aug, N. (2007). Investigating causal relations by econometric models and cross‐spectral methods, 37, 424–438. [Google Scholar]
- Gu, Y. , Yang, Y. , Dewald, J. P. A. , Van Der Helm, F. C. T. , Schouten, A. C. , & Wei, H. L. (2021). Nonlinear modeling of cortical responses to mechanical wrist perturbations using the NARMAX method. IEEE Transactions on Biomedical Engineering, 68, 948–958. 10.1109/TBME.2020.3013545 [DOI] [PMC free article] [PubMed] [Google Scholar]
- Gupta, D. , Du, X. , Hong, E. , & Choa, F. S. (2019). TMS‐EEG based source localized connectivity signature extraction by using unsupervised machine learning. International IEEE/EMBS Conference on Neural Engineering. NER 2019–March, pp. 1216–1219, San Francisco, CA, USA. 10.1109/NER.2019.8716962 [DOI]
- Handojoseno, A. M. A. , Shine, J. M. , Nguyen, T. N. , Tran, Y. , Lewis, S. J. G. , & Nguyen, H. T. (2013). Using EEG spatial correlation, cross frequency energy, and wavelet coefficients for the prediction of freezing of gait in Parkinson's disease patients. Proceedings of the Annual International Conference of the IEEE Engineering in Medicine and Biology Society (pp. 4263–4266). Osaka, Japan. 10.1109/EMBC.2013.6610487 [DOI] [PubMed]
- Harmah, D. J. , Li, C. , Li, F. , Liao, Y. , Wang, J. , Ayedh, W. M. A. , … Xu, P. (2020). Measuring the non‐linear directed information flow in schizophrenia by multivariate transfer entropy. Frontiers in Computational Neuroscience, 13, 1–15. 10.3389/fncom.2019.00085 [DOI] [PMC free article] [PubMed] [Google Scholar]
- Haufe, S. , & Ewald, A. (2019). A simulation framework for benchmarking EEG‐based brain connectivity estimation methodologies. Brain Topography, 32, 625–642. 10.1007/s10548-016-0498-y [DOI] [PubMed] [Google Scholar]
- Haufe, S. , Nikulin, V. , & Nolte, G. (2011). Identifying brain effective connectivity patterns from EEG: Performance of Granger causality, DTF, PDC and PSI on simulated data. BMC Neuroscience, 12, 1–2. 10.1186/1471-2202-12-s1-p141 21208416 [DOI] [Google Scholar]
- Haufe, S. , Nikulin, V. V. , Müller, K. R. , & Nolte, G. (2013). A critical assessment of connectivity measures for EEG data: A simulation study. NeuroImage, 64, 120–133. 10.1016/j.neuroimage.2012.09.036 [DOI] [PubMed] [Google Scholar]
- He, B. , Astolfi, L. , Valdes‐Sosa, P. A. , Marinazzo, D. , Palva, S. O. , Benar, C. G. , … Koenig, T. (2019). Electrophysiological brain connectivity: Theory and implementation. IEEE Transactions on Biomedical Engineering, 66, 2115–2137. 10.1109/TBME.2019.2913928 [DOI] [PMC free article] [PubMed] [Google Scholar]
- He, F. , Billings, S. A. , Wei, H. L. , & Sarrigiannis, P. G. (2014). A nonlinear causality measure in the frequency domain: Nonlinear partial directed coherence with applications to EEG. Journal of Neuroscience Methods, 225, 71–80. 10.1016/j.jneumeth.2014.01.013 [DOI] [PubMed] [Google Scholar]
- He, F. , Billings, S. A. , Wei, H. L. , Sarrigiannis, P. G. , & Zhao, Y. (2013). Spectral analysis for nonstationary and nonlinear systems: A discrete‐time‐model‐based approach. IEEE Transactions on Biomedical Engineering, 60, 2233–2241. 10.1109/TBME.2013.2252347 [DOI] [PubMed] [Google Scholar]
- He, F. , Wei, H. L. , Billings, S. A. , & Sarrigiannis, P. G. (2014). A nonlinear generalization of spectral granger causality. IEEE Transactions on Biomedical Engineering, 61, 1693–1701. 10.1109/TBME.2014.2300636 [DOI] [PubMed] [Google Scholar]
- Herz, D. M. , Christensen, M. S. , Reck, C. , Florin, E. , Barbe, M. T. , Stahlhut, C. , … Timmermann, L. (2012). Task‐specific modulation of effective connectivity during two simple unimanual motor tasks: A 122‐channel EEG study. NeuroImage, 59, 3187–3193. 10.1016/j.neuroimage.2011.11.042 [DOI] [PubMed] [Google Scholar]
- Hipp, J. F. , & Siegel, M. (2015). BOLD fMRI correlation reflects frequency‐specific neuronal correlation. Current Biology, 25, 1368–1374. 10.1016/j.cub.2015.03.049 [DOI] [PubMed] [Google Scholar]
- Huang, C. S. , Pal, N. R. , Chuang, C. H. , & Lin, C. T. (2015). Identifying changes in EEG information transfer during drowsy driving by transfer entropy. Frontiers in Human Neuroscience, 9, 1–12. 10.3389/fnhum.2015.00570 [DOI] [PMC free article] [PubMed] [Google Scholar]
- Ibrahim, S. , Djemal, R. , & Alsuwailem, A. (2018). Electroencephalography (EEG) signal processing for epilepsy and autism spectrum disorder diagnosis. Biocybernetics and Biomedical Engineering, 38, 16–26. 10.1016/j.bbe.2017.08.006 [DOI] [Google Scholar]
- Ieracitano, C. , Duun‐Henriksen, J. , Mammone, N. , La Foresta, F. & Morabito, F. C. 2017. Wavelet coherence‐based clustering of EEG signals to estimate the brain connectivity in absence epileptic patients. Proceedings of International Joint Conference on Neural Networks 2017–May, pp. 1297–1304, Anchorage, Alaska, USA. 10.1109/IJCNN.2017.7966002 [DOI]
- Jamal, W. , Das, S. , Maharatna, K. , Pan, I. , & Kuyucu, D. (2015). Brain connectivity analysis from EEG signals using stable phase‐synchronized states during face perception tasks. Physica A: Statistical Mechanics and its Applications, 434, 273–295. 10.1016/j.physa.2015.03.087 [DOI] [Google Scholar]
- Jamal, W. , Das, S. , Oprescu, I. A. , Maharatna, K. , Apicella, F. , & Sicca, F. (2014). Classification of autism spectrum disorder using supervised learning of brain connectivity measures extracted from synchrostates. Journal of Neural Engineering, 11, 046019. 10.1088/1741-2560/11/4/046019 [DOI] [PubMed] [Google Scholar]
- Jeong, D. H. , Do Kim, Y. , Song, I. U. , Chung, Y. A. , & Jeong, J. (2016). Wavelet energy and wavelet coherence as eeg biomarkers for the diagnosis of Parkinson's disease‐related dementia and Alzheimer's disease. Entropy, 18(1), 8. 10.3390/e18010008 [DOI] [Google Scholar]
- Kamifiski, M. J. , & Bfinowska, K. J. (1991). A new method of the description of the information flow in the brain structures. Biological Cybernetics, 210, 203–210. [DOI] [PubMed] [Google Scholar]
- Kaur, Y. , Ouyang, G. , Junge, M. , Sommer, W. , Liu, M. , Zhou, C. , & Hildebrandt, A. (2019). The reliability and psychometric structure of multi‐scale entropy measured from EEG signals at rest and during face and object recognition tasks. Journal of Neuroscience Methods, 326, 108343. 10.1016/j.jneumeth.2019.108343 [DOI] [PubMed] [Google Scholar]
- Khosrowabadi, R. , Heijnen, M. , Wahab, A. & Quek, H. C. 2010. The dynamic emotion recognition system based on functional connectivity of brain regions. 2010 IEEE Intelligent Vehicles Symposium, pp. 377–381, La Jolla, CA, USA. 10.1109/IVS.2010.5548102 [DOI]
- Ko, K. E. , Yang, H. C. , & Sim, K. B. (2009). Emotion recognition using EEG signals with relative power values and Bayesian network. International Journal of Control, Automation and Systems, 7, 865–870. 10.1007/s12555-009-0521-0 [DOI] [Google Scholar]
- La Rocca, D. , Campisi, P. , Vegso, B. , Cserti, P. , Kozmann, G. , Babiloni, F. , & De Vico Fallani, F. (2014). Human brain distinctiveness based on EEG spectral coherence connectivity. IEEE Transactions on Biomedical Engineering, 61, 2406–2412. 10.1109/TBME.2014.2317881 [DOI] [PubMed] [Google Scholar]
- Labat, D. (2005). Recent advances in wavelet analyses: Part 1. A review of concepts. Journal of Hydrology, 314, 275–288. 10.1016/j.jhydrol.2005.04.003 [DOI] [Google Scholar]
- Lachaux, J. P. , Lutz, A. , Rudrauf, D. , Cosmelli, D. , Le Van Quyen, M. , Martinerie, J. , & Varela, F. (2002). Estimating the time‐course of coherence between single‐trial brain signals: An introduction to wavelet coherence. Neurophysiologie Clinique, 32, 157–174. 10.1016/S0987-7053(02)00301-5 [DOI] [PubMed] [Google Scholar]
- Lee, M. , Yoon, J. G. , & Lee, S. W. (2020). Predicting motor imagery performance from resting‐state EEG using dynamic causal modeling. Frontiers in Human Neuroscience, 14, 1–15. 10.3389/fnhum.2020.00321 [DOI] [PMC free article] [PubMed] [Google Scholar]
- Lee, Y. , & Hsieh, S. (2014). Classifying different emotional states by means of EEG‐ based functional connectivity patterns. PLoS One, 9(4), e95415. 10.1371/journal.pone.0095415 [DOI] [PMC free article] [PubMed] [Google Scholar]
- Lehmann, C. , Koenig, T. , Jelic, V. , Prichep, L. , John, R. E. , Wahlund, L. O. , … Dierks, T. (2007). Application and comparison of classification algorithms for recognition of Alzheimer's disease in electrical brain activity (EEG). Journal of Neuroscience Methods, 161, 342–350. 10.1016/j.jneumeth.2006.10.023 [DOI] [PubMed] [Google Scholar]
- Li, Y. , Lei, M. , Cui, W. , Guo, Y. , & Wei, H. L. (2019). A parametric time frequency‐conditional Granger causality method using ultra‐regularized orthogonal least squares and multiwavelets for dynamic connectivity analysis in EEGs. IEEE Transactions on Biomedical Engineering, 66, 3509–3525. [DOI] [PubMed] [Google Scholar]
- Liao, Y. , Zhou, G. & Luo, Y. X. (2019). Sex difference in EEG functional connectivity during sleep stages and resting wake state based on weighted phase lag index. Proceedings of the Annual International Conference of the IEEE Engineering in Medicine and Biology Society. pp. 648–651, Berlin, Germany. 10.1109/EMBC.2019.8857296 [DOI] [PubMed] [Google Scholar]
- Lias, S. , Sulaiman, N. , Murat, Z. H. , & Taib, M. N. (2010). IQ index using alpha‐beta correlation of EEG power spectrum density (PSD). ISIEA 2010–2010 IEEE Symposium on Industrial Electronics & Applications. pp. 612–616. Penang, Malaysia. 10.1109/ISIEA.2010.5679391 [DOI] [Google Scholar]
- Mammone, N. , Ieracitano, C. , & Morabito, F. C. (2020). A deep CNN approach to decode motor preparation of upper limbs from time–frequency maps of EEG signals at source level. Neural Networks, 124, 357–372. 10.1016/j.neunet.2020.01.027 [DOI] [PubMed] [Google Scholar]
- Marzetti, L. , Basti, A. , Chella, F. , D'Andrea, A. , Syrjälä, J. , & Pizzella, V. (2019). Brain functional connectivity through phase coupling of neuronal oscillations: A perspective from magnetoencephalography. Frontiers in Neuroscience, 13, 1–21. 10.3389/fnins.2019.00964 [DOI] [PMC free article] [PubMed] [Google Scholar]
- Mazher, M. , Abd Aziz, A. , Malik, A. S. , & Ullah Amin, H. (2017). An EEG‐based cognitive load assessment in multimedia learning using feature extraction and partial directed coherence. IEEE Access, 5, 14819–14829. 10.1109/ACCESS.2017.2731784 [DOI] [Google Scholar]
- McBride, J. , Zhao, X. , Munro, N. , Jicha, G. , Smith, C. , & Jiang, Y. (2015). Discrimination of mild cognitive impairment and Alzheimer's disease using transfer entropy measures of scalp EEG. Journal of Healthcare Engineering, 6, 55–70. 10.1260/2040-2295.6.1.55 [DOI] [PMC free article] [PubMed] [Google Scholar]
- Melia, U. , Guaita, M. , Vallverdú, M. , Embid, C. , Vilaseca, I. , Salamero, M. , & Santamaria, J. (2015). Mutual information measures applied to EEG signals for sleepiness characterization. Medical Engineering & Physics, 37, 297–308. 10.1016/j.medengphy.2015.01.002 [DOI] [PubMed] [Google Scholar]
- Meng, J. , Yao, L. , Sheng, X. , Zhang, D. , & Zhu, X. (2015). Simultaneously optimizing spatial spectral features based on mutual information for EEG classification. IEEE Transactions on Biomedical Engineering, 62, 227–240. 10.1109/TBME.2014.2345458 [DOI] [PubMed] [Google Scholar]
- Mercier‐Ganady, J. , Lotte, F. , Loup‐Escande, E. , Marchal, M. , & Lecuyer, A. (2014). The mind‐mirror: See your brain in action in your head using EEG and augmented reality. Proceedings IEEE Virtual Reality, 2014, 33–38. 10.1109/VR.2014.6802047 [DOI] [Google Scholar]
- Mheich, A. , Hassan, M. , Khalil, M. , Berrou, C. , & Wendling, F. (2015). A new algorithm for spatiotemporal analysis of brain functional connectivity. Journal of Neuroscience Methods, 242, 77–81. 10.1016/j.jneumeth.2015.01.002 [DOI] [PubMed] [Google Scholar]
- Moezzi, B. , & Goldsworthy, M. R. (2018). Commentary: Consistency of EEG source localization and connectivity estimates. Frontiers in Neuroscience, 12, 10–12. 10.3389/fnins.2018.00147 [DOI] [PMC free article] [PubMed] [Google Scholar]
- Mohanty, R. , Sethares, W. A. , Nair, V. A. , & Prabhakaran, V. (2020). Rethinking measures of functional connectivity via feature extraction. Scientific Reports, 10, 1–17. 10.1038/s41598-020-57915-w [DOI] [PMC free article] [PubMed] [Google Scholar]
- Mormann, F. , Lehnertz, K. , David, P. , & Elger, C. E. (2000). Mean phase coherence as a measure for phase synchronization and its application to the EEG of epilepsy patients. Physica D: Nonlinear Phenomena, 144, 358–369. 10.1016/S0167-2789(00)00087-7 [DOI] [Google Scholar]
- Mumtaz, W. , Ali, S. S. A. , Yasin, M. A. M. , & Malik, A. S. (2018). A machine learning framework involving EEG‐based functional connectivity to diagnose major depressive disorder (MDD). Medical & Biological Engineering & Computing, 56, 233–246. 10.1007/s11517-017-1685-z [DOI] [PubMed] [Google Scholar]
- Nentwich, M. , Ai, L. , Madsen, J. , Telesford, Q. K. , Haufe, S. , Milham, M. P. , & Parra, L. C. (2020). Functional connectivity of EEG is subject‐specific, associated with phenotype, and different from fMRI. NeuroImage, 218, 117001. 10.1016/j.neuroimage.2020.117001 [DOI] [PMC free article] [PubMed] [Google Scholar]
- Nolte, G. , Bai, O. , Wheaton, L. , Mari, Z. , Vorbach, S. , & Hallett, M. (2004). Identifying true brain interaction from EEG data using the imaginary part of coherency. Clinical Neurophysiology, 115, 2292–2307. 10.1016/j.clinph.2004.04.029 [DOI] [PubMed] [Google Scholar]
- Omidvarnia, A. , Mesbah, M. , O'Toole, J. M. , Colditz, P. & Boashash, B. 2011. Analysis of the time‐varying cortical neural connectivity in the newborn EEG: A time‐frequency approach. 7th International Workshop on Systems, Signal Processing and their Applications, WOSSPA 2011, pp. 179–182, Tipaza, Algeria. 10.1109/WOSSPA.2011.5931445 [DOI]
- Omidvarnia, A. H. , Mesbah, M. , Khlif, M. S. , O'Toole, J. M. , Colditz, P. B. & Boashash, B. (2011). Kalman filter‐based time‐varying cortical connectivity analysis of newborn EEG. Proceedings of the 31st Annual International Conference of the IEEE Engineering in Medicine and Biology Society EMBS, pp. 1423–1426, Hilton Minneapolis, Minnesota, USA. 10.1109/IEMBS.2011.6090335 [DOI] [PubMed]
- Palva, J. M. , Wang, S. H. , Palva, S. , Zhigalov, A. , Monto, S. , Brookes, M. J. , … Jerbi, K. (2018). Ghost interactions in MEG/EEG source space: A note of caution on inter‐areal coupling measures. NeuroImage, 173, 632–643. 10.1016/j.neuroimage.2018.02.032 [DOI] [PubMed] [Google Scholar]
- Piho, L. , & Tjahjadi, T. (2020). A mutual information based adaptive windowing of informative EEG for emotion recognition. IEEE Transactions on Affective Computing, 11, 722–736. [Google Scholar]
- Pijnenburg, Y. A. L. , Vd Made, Y. , Van Cappellen Van Walsum, A. M. , Knol, D. L. , Scheltens, P. , & Stam, C. J. (2004). EEG synchronization likelihood in mild cognitive impairment and Alzheimer's disease during a working memory task. Clinical Neurophysiology, 115, 1332–1339. 10.1016/j.clinph.2003.12.029 [DOI] [PubMed] [Google Scholar]
- Ponten, S. C. , Daffertshofer, A. , Hillebrand, A. , & Stam, C. J. (2010). The relationship between structural and functional connectivity: Graph theoretical analysis of an EEG neural mass model. NeuroImage, 52, 985–994. 10.1016/j.neuroimage.2009.10.049 [DOI] [PubMed] [Google Scholar]
- Qassim, Y. T. , Cutmore, T. R. H. , & Rowlands, D. D. (2017). FPGA implementation of wavelet coherence for EEG and ERP signals. Microprocessors and Microsystems, 51, 356–365. 10.1016/j.micpro.2017.01.001 [DOI] [Google Scholar]
- Rajendra Acharya, U. , Vinitha Sree, S. , Alvin, A. P. C. , & Suri, J. S. (2012). Use of principal component analysis for automatic classification of epileptic EEG activities in wavelet framework. Expert Systems with Applications, 39, 9072–9078. 10.1016/j.eswa.2012.02.040 [DOI] [Google Scholar]
- Rathee, D. , Cecotti, H. , & Prasad, G. (2017). Single‐trial effective brain connectivity patterns enhance discriminability of mental imagery tasks. Journal of Neural Engineering, 14, 056005. 10.1088/1741-2552/aa785c [DOI] [PubMed] [Google Scholar]
- Ratti, E. , Waninger, S. , Berka, C. , Ruffini, G. , & Verma, A. (2017). Comparison of medical and consumer wireless EEG systems for use in clinical trials. Frontiers in Human Neuroscience, 11, 1–7. 10.3389/fnhum.2017.00398 [DOI] [PMC free article] [PubMed] [Google Scholar]
- Ravan, M. , Hasey, G. , Reilly, J. P. , MacCrimmon, D. , & Khodayari‐Rostamabad, A. (2015). A machine learning approach using auditory odd‐ball responses to investigate the effect of clozapine therapy. Clinical Neurophysiology, 126, 721–730. 10.1016/j.clinph.2014.07.017 [DOI] [PubMed] [Google Scholar]
- Sadaghiani, S. , Brookes, M. J. , Baillet, S. (2021). Connectomics of human electrophysiology. arXiv, pp. 1–39. [DOI] [PMC free article] [PubMed]
- Sadaghiani, S. , & Kleinschmidt, A. (2016). Brain networks and α‐oscillations: Structural and functional foundations of cognitive control. Trends in Cognitive Sciences, 20, 805–817. 10.1016/j.tics.2016.09.004 [DOI] [PubMed] [Google Scholar]
- Saeedi, A. , Saeedi, M. , Maghsoudi, A. , & Shalbaf, A. (2020). Major depressive disorder diagnosis based on effective connectivity in EEG signals: A convolutional neural network and long short‐term memory approach. Cognitive Neurodynamics. 15(2), 239–252. 10.1007/s11571-020-09619-0 [DOI] [PMC free article] [PubMed] [Google Scholar]
- Sakkalis, V. (2011). Review of advanced techniques for the estimation of brain connectivity measured with EEG/MEG. Computers in Biology and Medicine, 41, 1110–1117. 10.1016/j.compbiomed.2011.06.020 [DOI] [PubMed] [Google Scholar]
- Salman, H. , Grover, J. , & Shankar, T. (2016). Electroencephalographic motor imagery brain connectivity analysis for BCI: a review. Neural computation, 28(6), 999–1041. 10.1162/NECO_a_00838 [DOI] [PubMed]
- Sankari, Z. , & Adeli, H. (2011). Probabilistic neural networks for diagnosis of Alzheimer's disease using conventional and wavelet coherence. Journal of Neuroscience Methods, 197, 165–170. 10.1016/j.jneumeth.2011.01.027 [DOI] [PubMed] [Google Scholar]
- Sankari, Z. , Adeli, H. , & Adeli, A. (2012). Wavelet coherence model for diagnosis of Alzheimer disease. Clinical EEG and Neuroscience, 43, 268–278. 10.1177/1550059412444970 [DOI] [PubMed] [Google Scholar]
- Sanz‐García, A. , Pérez‐Romero, M. , Pastor, J. , Sola, R. G. , Vega‐Zelaya, L. , Vega, G. , … Ortega, G. J. (2019). Potential EEG biomarkers of sedation doses in intensive care patients unveiled by using a machine learning approach. Journal of Neural Engineering, 16(2), 026031. 10.1088/1741-2552/ab039f [DOI] [PubMed] [Google Scholar]
- Sargolzaei, S. , Cabrerizo, M. , Goryawala, M. , Salah, A. , & Adjouadi, M. (2015). Scalp EEG brain functional connectivity networks in pediatric epilepsy. Computers in Biology and Medicine, 56, 158–166. 10.1016/j.compbiomed.2014.10.018 [DOI] [PubMed] [Google Scholar]
- Sarrigiannis, P. G. , Zhao, Y. , He, F. , Billings, S. A. , Baster, K. , Rittey, C. , … Grünewald, R. (2018). The cortical focus in childhood absence epilepsy; evidence from nonlinear analysis of scalp EEG recordings. Clinical Neurophysiology, 129, 602–617. 10.1016/j.clinph.2017.11.029 [DOI] [PubMed] [Google Scholar]
- Sarrigiannis, P. G. , Zhao, Y. , He, F. , Wei, H. , Billings, S. A. , Lawrence, S. , … Yianni, J. (2015). Direct functional connectivity between the thalamus (Vim) and the contralateral motor cortex: Just a single case observation or a common pathway in the human brain? Brain Stimulation, 8(6), 1230–1233. 10.1016/j.brs.2015.08.006 [DOI] [PubMed] [Google Scholar]
- Sarrigiannis, P. G. , Zhao, Y. , Wei, H. L. , Billings, S. A. , Fotheringham, J. , & Hadjivassiliou, M. (2014). Quantitative EEG analysis using error reduction ratio‐causality test; validation on simulated and real EEG data. Clinical Neurophysiology, 125, 32–46. 10.1016/j.clinph.2013.06.012 [DOI] [PubMed] [Google Scholar]
- Sartori, E. , Bertoldo, A. , Zavaglia, M. , Ursino, M. , & Toffolo, G. M. (2012). Structural equation modelling validation for connectivity analysis using a neural mass model. International Journal of Bioelectromagnetism, 14, 96–99. http://www.ijbem.org/volume14/number2/96-99.pdf [Google Scholar]
- Seth, A. K. , Barrett, A. B. , & Barnett, L. (2015). Granger causality analysis in neuroscience and neuroimaging. The Journal of Neuroscience, 35, 3293–3297. 10.1523/JNEUROSCI.4399-14.2015 [DOI] [PMC free article] [PubMed] [Google Scholar]
- Shahabi, H. , & Moghimi, S. (2016). Computers in human behavior toward automatic detection of brain responses to emotional music through analysis of EEG effective connectivity. Computers in Human Behavior, 58, 231–239. 10.1016/j.chb.2016.01.005 [DOI] [Google Scholar]
- Shan, X., Huo, S., Yang, L., Cao, J., Zou, J., Chen, L., … Zhao, Y. (2021). A Revised Hilbert‐Huang Transformation to Track Non‐Stationary Association of Electroencephalography Signals. IEEE Transactions on Neural Systems and Rehabilitation Engineering, 29, 841–851. 10.1109/tnsre.2021.3076311 [DOI] [PubMed]
- Shen, X. , Finn, E. S. , Scheinost, D. , Rosenberg, M. D. , Chun, M. M. , Papademetris, X. , & Constable, R. T. (2018). Using connectome‐based predictive modeling to predict individual behavior from brain connectivity. Physiology & Behavior, 176, 139–148. 10.1038/nprot.2016.178.Using [DOI] [PMC free article] [PubMed] [Google Scholar]
- Shen, Y. , Baingana, B. , Giannakis, G.B. , 2016. Nonlinear structural vector autoregressive models for inferring effective brain network connectivity. arXiv:1610.06551 . [DOI] [PMC free article] [PubMed]
- Siems, M. , & Siegel, M. (2020). Dissociated neuronal phase‐ and amplitude‐coupling patterns in the human brain. NeuroImage, 209, 116538. 10.1016/j.neuroimage.2020.116538 [DOI] [PMC free article] [PubMed] [Google Scholar]
- Silfverhuth, M. J. , Hintsala, H. , Kortelainen, J. , & Seppänen, T. (2012). Experimental comparison of connectivity measures with simulated EEG signals. Medical & Biological Engineering & Computing, 50, 683–688. 10.1007/s11517-012-0911-y [DOI] [PubMed] [Google Scholar]
- Stam, C. J. , Nolte, G. , & Daffertshofer, A. (2007). Phase lag index: Assessment of functional connectivity from multi channel EEG and MEG with diminished bias from common sources. Human Brain Mapping, 1193, 1178–1193. 10.1002/hbm.20346 [DOI] [PMC free article] [PubMed] [Google Scholar]
- Stam, C. J. , & van Dijk, B. W. (2002). Synchronization likelihood: An unbiased measure of generalized synchronization in multivariate data sets. Physica D (Nonlinear Phenomena), 20, 94–97. [Google Scholar]
- Supp, G. G. , Schlögl, A. , Trujillo‐Barreto, N. , Müller, M. M. , & Gruber, T. (2007). Directed cortical information flow during human object recognition: Analyzing induced EEG gamma‐band responses in brain's source space. PLoS One, 2(8), e684. 10.1371/journal.pone.0000684 [DOI] [PMC free article] [PubMed] [Google Scholar]
- Tafreshi, T. F. , Daliri, M. R. , & Ghodousi, M. (2019). Functional and effective connectivity based features of EEG signals for object recognition. Cognitive Neurodynamics, 13, 555–566. 10.1007/s11571-019-09556-7 [DOI] [PMC free article] [PubMed] [Google Scholar]
- Tarokh, L. , Carskadon, M. A. , & Achermann, P. (2010). Developmental changes in BRAIN connectivity assessed using the sleep EEG. Neuroscience, 171, 622–634. 10.1016/j.neuroscience.2010.08.071 [DOI] [PMC free article] [PubMed] [Google Scholar]
- Van de Steen, F. , Almgren, H. , Razi, A. , Friston, K. , & Marinazzo, D. (2019). Dynamic causal modelling of fluctuating connectivity in resting‐state EEG. NeuroImage, 189, 476–484. 10.1016/j.neuroimage.2019.01.055 [DOI] [PMC free article] [PubMed] [Google Scholar]
- Van Der Molen, M. J. W. , Stam, C. J. , & Van Der Molen, M. W. (2014). Resting‐state EEG oscillatory dynamics in fragile X syndrome: Abnormal functional connectivity and brain network organization. PLoS One, 9(2), e–88451. 10.1371/journal.pone.0088451 [DOI] [PMC free article] [PubMed] [Google Scholar]
- Van Diessen, E. , Numan, T. , Van Dellen, E. , Van Der Kooi, A. W. , Boersma, M. , Hofman, D. , … Stam, C. J. (2015). Clinical neurophysiology opportunities and methodological challenges in EEG and MEG resting state functional brain network research. Clinical Neurophysiology, 126, 1468–1481. 10.1016/j.clinph.2014.11.018 [DOI] [PubMed] [Google Scholar]
- van Mierlo, P. , Papadopoulou, M. , Carrette, E. , Boon, P. , Vandenberghe, S. , Vonck, K. , & Marinazzo, D. (2014a). Functional brain connectivity from EEG in epilepsy: Seizure prediction and epileptogenic focus localization. Progress in Neurobiology, 121, 19–35. 10.1016/j.pneurobio.2014.06.004 [DOI] [PubMed] [Google Scholar]
- van Mierlo, P. , Papadopoulou, M. , Carrette, E. , Boon, P. , Vandenberghe, S. , Vonck, K. , & Marinazzo, D. (2014b). Progress in neurobiology functional brain connectivity from EEG in epilepsy: Seizure prediction and epileptogenic focus localization. Progress in Neurobiology, 121, 19–35. 10.1016/j.pneurobio.2014.06.004 [DOI] [PubMed] [Google Scholar]
- Varela, F. , Lachaux, J. P. , Rodriguez, E. , & Martinerie, J. (2001). The brainweb: Phase synchronization and large‐scale integration. Nature Reviews. Neuroscience, 2, 229–239. 10.1038/35067550 [DOI] [PubMed] [Google Scholar]
- Varotto, G. , Fazio, P. , Rossi Sebastiano, D. , Duran, D. , D'Incerti, L. , Parati, E. , … Panzica, F. (2014). Altered resting state effective connectivity in long‐standing vegetative state patients: An EEG study. Clinical Neurophysiology, 125, 63–68. 10.1016/j.clinph.2013.06.016 [DOI] [PubMed] [Google Scholar]
- Varotto, G. , Visani, E. , Canafoglia, L. , Franceschetti, S. , Avanzini, G. , & Panzica, F. (2012). Enhanced frontocentral EEG connectivity in photosensitive generalized epilepsies: A partial directed coherence study. Epilepsia, 53, 359–367. 10.1111/j.1528-1167.2011.03352.x [DOI] [PubMed] [Google Scholar]
- Vecchio, F. , Miraglia, F. , Bramanti, P. , & Rossini, P. M. (2014). Human brain networks in physiological aging: A graph theoretical analysis of cortical connectivity from EEG data. Journal of Alzheimer's Disease, 41, 1239–1249. 10.3233/JAD-140090 [DOI] [PubMed] [Google Scholar]
- Vicente, R. , Wibral, M. , & Lindner, M. (2011). Transfer entropy—A model‐free measure of effective connectivity for the neurosciences. Journal of Computational Neuroscience, 30, 45–67. 10.1007/s10827-010-0262-3 [DOI] [PMC free article] [PubMed] [Google Scholar]
- Vijay Anand, S. , & Shantha Selvakumari, R. (2019). Noninvasive method of epileptic detection using DWT and generalized regression neural network. Soft Computing, 23, 2645–2653. 10.1007/s00500-018-3630-y [DOI] [Google Scholar]
- Visani, E. , Varotto, G. , Binelli, S. , Fratello, L. , Franceschetti, S. , Avanzini, G. , & Panzica, F. (2010). Photosensitive epilepsy: Spectral and coherence analyses of EEG using 14 Hz intermittent photic stimulation. Clinical Neurophysiology, 121, 318–324. 10.1016/j.clinph.2009.12.003 [DOI] [PubMed] [Google Scholar]
- Vortmann, L. M. , Kroll, F. , & Putze, F. (2019). EEG‐based classification of internally‐ and externally‐directed attention in an augmented reality paradigm. Frontiers in Human Neuroscience, 13, 1–14. 10.3389/fnhum.2019.00348 [DOI] [PMC free article] [PubMed] [Google Scholar]
- Wang, F. , Tian, Y.C. , Zhang, X. , & Hu, F. 2020. Detecting disorders of consciousness in brain injuries from EEG connectivity through machine learning. IEEE Transactions on Emerging Topics in Computational Intelligence. pp. 1–11. 10.1109/TETCI.2020.3032662 [DOI]
- Wang, H. E. , Bénar, C. G. , Quilichini, P. P. , Friston, K. J. , Jirsa, V. K. , & Bernard, C. (2014). A systematic framework for functional connectivity measures. Frontiers in Neuroscience, 8, 1–22. 10.3389/fnins.2014.00405 [DOI] [PMC free article] [PubMed] [Google Scholar]
- Wang, M. , El‐Fiqi, H. , Hu, J. , & Abbass, H. A. (2019). Convolutional neural networks using dynamic functional connectivity for EEG‐based person identification in diverse human states. IEEE Transactions on Information Forensics and Security, 14, 3359–3372. 10.1109/TIFS.2019.2916403 [DOI] [Google Scholar]
- Wendling, F. , Ansari‐asl, K. , Bartolomei, F. , & Senhadji, L. (2009). From EEG signals to brain connectivity: A model‐based evaluation of interdependence measures. Journal of Neuroscience Methods, 183, 9–18. 10.1016/j.jneumeth.2009.04.021 [DOI] [PubMed] [Google Scholar]
- Xie, S. , & Krishnan, S. (2013). Wavelet‐based sparse functional linear model with applications to EEGs seizure detection and epilepsy diagnosis. Medical & Biological Engineering & Computing, 51, 49–60. 10.1007/s11517-012-0967-8 [DOI] [PubMed] [Google Scholar]
- Yang, C. , Le Bouquin Jeannes, R. , Bellanger, J. J. , & Shu, H. (2013). A new strategy for model order identification and its application to transfer entropy for EEG signals analysis. IEEE Transactions on Biomedical Engineering, 60, 1318–1327. 10.1109/TBME.2012.2234125 [DOI] [PubMed] [Google Scholar]
- Yao, W. , & Wang, J. (2017). Multi‐scale symbolic transfer entropy analysis of EEG. Physica A: Statistical Mechanics and its Applications, 484, 276–281. 10.1016/j.physa.2017.04.181 [DOI] [Google Scholar]
- Yin, Z. , Li, J. , Zhang, Y. , Ren, A. , Von Meneen, K. M. , & Huang, L. (2017). Functional brain network analysis of schizophrenic patients with positive and negative syndrome based on mutual information of EEG time series. Biomedical Signal Processing and Control, 31, 331–338. 10.1016/j.bspc.2016.08.013 [DOI] [Google Scholar]
- Yu, H. , Liu, J. , Cai, L. , Wang, J. , Cao, Y. , & Hao, C. (2017). Functional brain networks in healthy subjects under acupuncture stimulation: An EEG study based on nonlinear synchronization likelihood analysis. Physica A: Statistical Mechanics and its Applications, 468, 566–577. 10.1016/j.physa.2016.10.068 [DOI] [Google Scholar]
- Yuvaraj, R. , Murugappan, M. , Acharya, U. R. , Adeli, H. , Ibrahim, N. M. , & Mesquita, E. (2016). Brain functional connectivity patterns for emotional state classification in Parkinson's disease patients without dementia. Behavioural Brain Research, 298, 248–260. 10.1016/j.bbr.2015.10.036 [DOI] [PubMed] [Google Scholar]
- Yvert, G. , Perrone‐Bertolotti, M. , Baciu, M. , & David, O. (2012). Dynamic causal modeling of spatiotemporal integration of phonological and semantic processes: An electroencephalographic study. The Journal of Neuroscience, 32, 4297–4306. 10.1523/JNEUROSCI.6434-11.2012 [DOI] [PMC free article] [PubMed] [Google Scholar]
- Zhao, Y. , Billings, S. A. , Wei, H. , He, F. , & Sarrigiannis, P. G. (2013). A new NARX‐based Granger linear and nonlinear casual influence detection method with applications to EEG data. Journal of Neuroscience Methods, 212, 79–86. 10.1016/j.jneumeth.2012.09.019 [DOI] [PubMed] [Google Scholar]
- Zhao, Y. , Billings, S. A. , Wei, H. , & Sarrigiannis, P. G. (2012). Tracking time‐varying causality and directionality of information flow using an error reduction ratio test with applications to electroencephalography data. Physical review. E, Statistical, Nonlinear, and Soft Matter Physics, 86(5), 051919. 10.1103/PhysRevE.86.051919 [DOI] [PubMed] [Google Scholar]
- Zhao, Y. , Billings, S. A. , Wei, H. L. , & Sarrigiannis, P. G. (2013). A parametric method to measure time‐varying linear and nonlinear causality with applications to EEG data. IEEE Transactions on Biomedical Engineering, 60, 3141–3148. 10.1109/TBME.2013.2269766 [DOI] [PubMed] [Google Scholar]
- Zhao, Y. , Laguna, R. C. , Zhao, Y. , Liu, J. J. , He, X. , Yianni, J. , & Sarrigiannis, P. G. (2018). A wavelet‐based correlation analysis framework to study cerebromuscular activity in essential tremor. Advanced Methods to Analyse the Complexity of the Brain, 2018, 7269494. 10.1155/2018/7269494 [DOI] [Google Scholar]
- Zhao, Y. , Zhao, Y. , Durongbhan, P. , Chen, L. , Liu, J. , Billings, S. A. , … Sarrigiannis, P. G. (2020). Imaging of nonlinear and dynamic functional brain connectivity based on EEG recordings with the application on the diagnosis of Alzheimer's disease. IEEE Transactions on Medical Imaging, 39, 1571–1581. 10.1109/TMI.2019.2953584 [DOI] [PubMed] [Google Scholar]
Associated Data
This section collects any data citations, data availability statements, or supplementary materials included in this article.
Data Availability Statement
Data sharing is not applicable to this review article as no new data was created or analyzed in this study.