

Abstract
Introduction:
Exposure to noise might influence risk of Alzheimer’s disease (AD) dementia.
Methods:
Participants of the Chicago Health and Aging Project (≥65 years) underwent triennial cognitive assessments. For the 5 years preceding each assessment, we estimated 5227 participants’ residential level of noise from the community using a spatial prediction model, and estimated associations of noise level with prevalent mild cognitive impairment (MCI) and AD, cognitive performance, and rate of cognitive decline.
Results:
Among these participants, an increment of 10 A-weighted decibels (dBA) in noise corresponded to 36% and 29% higher odds of prevalent MCI (odds ratio [OR] = 1.36; 95% confidence interval [CI], 1.15 to 1.62) and AD (OR = 1.29, 95% CI, 1.08 to 1.55). Noise level was associated with worse global cognitive performance, principally in perceptual speed (−0.09 standard deviation per 10 dBA, 95% CI: −0.16 to −0.03), but not consistently associated with cognitive decline.
Discussion:
These results join emerging evidence suggesting that noise may influence late-life cognition and risk of dementia.
Keywords: aging, Alzheimer’s disease, cognition, cognitive decline, dementia, epidemiology, noise
1 ∣. INTRODUCTION
Alzheimer’s disease and related dementias constitute some of the most significant neurodegenerative conditions of our time. An estimated 5.8 million older Americans have Alzheimer’s disease (AD) dementia,1 and 13.8 million AD cases are expected by 2050,1 a trend that will be echoed globally.2 There is suggestive evidence that chemical and structural hazards in the environment, such as air pollution and lead, may influence cognitive decline and dementia risk.3-5 Another environmental exposure that could plausibly affect dementia risk is exposure to community noise—from nearby roadways, railways, air transportation, industry, and construction.6
Noise has long been recognized as a hazard to human health. By 1968, when the U.S. Public Health Service co-sponsored a conference on the topic, the effects of noise on hearing loss and physiologic stress responses were already recognized.7 Since then, dozens of investigations have documented the effects of community noise on children’s cognition, their ability to learn, and the benefits of mitigating that noise.8 The neurotoxicity of noise might extend to older adults, possibly precipitating cognitive decline and dementia through direct effects on AD pathology and inflammatory processes, yet this is a largely understudied area of research.
In animal experiments, noise has been linked to neuropathological changes indicative of AD and in brain regions affected by AD. For example, in rats, noise exposure promoted the production of amyloid beta in hippocampal tissue.9 Noise-exposed rats also show signs of another neuropathologic hallmark in AD: increases in hyperphosphorylated tau and neurofibrillary tangles in the hippocampus and prefrontal cortex.10 Experimental noise exposures in animals appear to induce a wide range of other effects relevant to AD etiology, including oxidative stress and inflammation, degenerative changes to the ultrastructure of synapses, reduced frequency of neuronal firing, and neuronal apoptosis.9,11 Furthermore, noise-exposed animals exhibit declines in learning and memory ability.12-14
Apart from these neuropathologic effects, the vascular effects of noise also etiologically link it to dementia. These include increased heart rate,15 peripheral vasoconstriction, peripheral vascular resistance,16,17 as well as elevated risk of hypertension18 and myocardial infarction mortality, even after adjusting for air pollution.19 Noise exposure might also elevate cognitive risk by disrupting hearing and sleep.20
In spite of the biologically plausible links of exposure to AD risk, only a handful of epidemiologic studies have investigated community noise and AD-related outcomes21-24 and none has been set in the United States. The absence of U.S. studies may be important given that, by one rough estimate, more than 100 million persons in 2013 experienced annual noise levels exceeding the U.S. Environmental Protection Agency (EPA) limit (LEQ(24)) of 70 A-weighted decibels (dBA), placing them at risk for noise-induced hearing loss.25 Millions more Americans were likely exposed to the lower noise levels associated with non-auditory health outcomes, such as those potentially relevant to ADRD risk. Notably, community noise is modifiable at both population and individual levels via governmental actions and technological innovations.
We used a novel fine-scale spatial model26 of community noise developed for the Chicago area to predict long-term residential community noise levels among participants of the Chicago Health and Aging Project (CHAP), a population-based, longitudinal cohort study of cognitive aging in older adults. We then evaluated the relation of these noise levels with prevalent mild cognitive impairment (MCI) and AD, as well as cognitive performance and rate of cognitive decline.
2 ∣. METHODS
2.1 ∣. Study population
CHAP is a longitudinal study of residents, 65 years old and older, living in four adjacent neighborhoods on the south side of Chicago, IL, USA.27,28 From 1993 to 1996, CHAP recruited an original cohort of 6157 participants (79% of all age-eligible persons, established by community census); 4644 newly age-eligible participants were recruited in successive cohorts, for a total study population of 10,802 participants. Until 2003, participants were drawn from three contiguous neighborhoods. Starting in 2003, CHAP also recruited participants from a fourth adjoining neighborhood. Altogether, the study area is ≈15 square miles with participants living throughout.
CHAP participants underwent triennial in-home assessments during which they completed questionnaires and underwent evaluation of their cognitive function; 89% of all survivors, on average, completed follow-up visits subsequent to their baseline evaluations. We limited our analyses to those participants with cognitive assessments that occurred after January 1, 1999 (N = 8245) when our environmental exposure estimates are most reliable.
CHAP was approved by the institutional review board of Rush University Medical Center, and all participants provided written informed consent. This use of CHAP data was also reviewed and approved by the institutional review board at the University of Michigan.
2.2 ∣. Assessment of exposure to noise
We estimated each participant’s long-term noise exposure using a universal kriging model developed for the Chicago area. Briefly, this model was derived from 5-minute grab samples of A-weighted noise (the important frequencies for human hearing), collected at 136 unique locations. These samples were collected during daytime, non-rush hour periods between 2006 and 2007.26 Using geographic covariates such as land use and proximity to roadways, bus stops, and trains, as well as the observed spatial correlation structure for the area, we were able to predict noise levels at any location with an R2 of 0.7 using 10-fold cross-validation. Using original held-out values as well as a new external dataset collected 10 years later, we found an approximate mean absolute error (MAE) of our model of 3 dBA.
With this model, we first predicted noise levels at each participant’s residential address using geographic covariates. We then weighted our predicted noise levels according to their 5-year residential history prior to each interview, accounting for relocation in the 19% of those who moved (including moves to a nursing home) during the course of the study. Estimates of noise from this model tracked closely with noise annoyance from nearly 500 individuals living in the region. Furthermore, replicate sampling in the CHAP neighborhoods in 2016 demonstrated high stability in the spatial distribution of noise levels over time (Pearson correlation for samples at the same locations 10 years apart = 0.8).
2.3 ∣. Assessment of cognitive function
During their home interviews, all participants underwent a brief cognitive assessment that generated four test scores for functions that typically decline with AD. The Symbol Digit Modalities Test29 measures perceptual speed, a component of executive function; the East Boston Memory Test30 generates measures of both immediate and delayed episodic memory (two separate scores); and the Mini-Mental State Examination31 measures several cognitive functions, including orientation, memory, language, and visual construction. For each of the four test scores, we transformed the raw scores to z-scores based on the mean and standard deviation of each baseline score. We then constructed three cognitive measures, all scaled to the standard normal distribution to facilitate comparisons across tests. The first, a global cognition score, was created by first averaging the z-scores from all four tests into a composite z-score and then converting the resulting score to standard normal, using the baseline composite z-score’s mean and standard deviation.32-34 This conversion was necessary, because the average of several correlated z-scores does not have a standard deviation of 1. The second, the episodic memory score, was the average of the z-scores from the two components of the East Boston Memory Test, which we further transformed to standard normal as done for the global score. The third measure, the perceptual speed score, was the z-score from the Symbol Digit Modalities Test.
2.4 ∣. Assessment of MCI and AD
As previously described,27,28,34-36 samples of surviving participants who were AD free in the previous cycle were randomly selected for clinical evaluation of incident AD in cycles 2 to 6 within strata of age, race, sex, and change in cognitive function from the previous home interview. A team of clinicians led by a neurologist conducted these evaluations, which included a structured medical history, neurologic examination, and a battery of 21 cognitive tests, 11 of which encompassed five domains of function.28 All clinical examiners were blinded to the cognitive scores used for stratification. Diagnosis of AD followed the criteria of the National Institute of Neurological and Communicative Disorders and Stroke-Alzheimer’s Disease and Related Disorders Association.37 Also classified as AD cases were persons who met these AD criteria and may have had another condition impairing cognition. Nearly all dementia cases diagnosed in CHAP (93%) met clinical criteria for AD alone or AD mixed with another dementia.
Constraining our dementia assessments to those who were not only in this subsample but also had their assessments in 1999 onward (for compatibility with our environmental exposure estimates) limited the number of participants contributing data to our analyses of MCI and dementia. To circumvent this constraint, we used a previously developed multinomial model to classify each CHAP participant at each visit—whether in the subsample—a probability of having probable AD, MCI, or no cognitive impairment.38 These scores were developed from the subsample of participants who underwent additional clinical evaluations to diagnose dementia and MCI. The likelihood scores provided a diagnostic accuracy of 0.92 (95% confidence interval [CI], 0.88 to 0.95) for AD and 0.89 (95% CI, 0.82 to 0.94) for MCI.
2.5 ∣. Covariate data
At their in-home interviews, participants provided information on their date of birth, sex, race, education, household income, alcohol intake, smoking status, and physical activity. Interviewers also asked participants about their social connections and interactions; we used these data to form social engagement and network scores.39 Apolipoprotein E(APOE) genotype was measured using the hME Sequenom MassARRAY platform.
We also generated area-level covariates for each participant including neighborhood socioeconomic status (SES), neighborhood disorder scores, and traffic-related air pollution. Neighborhood SES was calculated using a previously published method40,41 that uses U.S. census block data (eg, median housing value, percentage with managerial occupation) to calculate area socioeconomic scores. Neighborhood disorder42 was measured using participants’ perceptions of safety and neighborhood neglect (eg, vandalism, poor sidewalks, broken curbs). Finally, we used ambient outdoor concentration of nitrogen oxides (NOx) at the participant’s residential location from a spatiotemporal model43,44 developed for the Multi Ethnic Study of Atherosclerosis as a measure of exposure to traffic-related air pollution.
2.6 ∣. Statistical analyses
To estimate the prevalence odds ratios (ORs) of MCI and AD across community noise levels, we used a multinomial logistic regression model fit with the multgee package in R for correlated nominal outcomes.45 Our primary associations of interest were the multivariable-adjusted MCI and AD prevalence ORs per 10-dBA of noise. We also compared baseline cognitive performance and longitudinal rate of cognitive decline by levels of residential noise using linear mixed effects regression models, with random intercepts for each participant, using age as the time metric. We fitted separate models for each of the three cognitive scores. The results of interest from these models were the multivariable-adjusted mean difference in baseline cognitive score, as estimated by the regression coefficient for noise, and the mean difference in rate of change in cognitive score, estimated by the regression coefficient for the cross-product of age and noise.
We adjusted all models for calendar time, age at assessment, sex, race/ethnicity (Black, non-Hispanic White, other race/ethnicity), household income (<$14,999; $15,000 to 29,999; >$30,000; missing), years of educational attainment, neighborhood SES, NOX, smoking (current, former, never), and alcohol intake (high, moderate, none). For cognitive performance, all variables were included as main effects and interactions with assessment age with the exception of smoking and alcohol use as these were only associated with baseline cognitive performance but not cognitive decline. We visually assessed the linearity of all associations with cognitive performance using penalized splines in R. Based on those results, we modeled age at the assessment as a piecewise linear spline with a knot at age 75 years (which included corresponding cross-products with noise). With this model, we estimated effects on change in cognitive score specific to assessment age <75 and ≥75 years. We used SAS 9.4 (Cary, North Carolina, USA) and R (gamm4 package46) for our modeling and report all associations per 10-dBA increment in noise level.
2.7 ∣. Sensitive subpopulations
We examined whether associations with noise varied by the following individual- and area-level factors that could convey susceptibility to noise: baseline age (<75 vs ≥75 years), race/ethnicity (Black vs non-Hispanic White), APOEε4 allele carriership (any vs none), and tertiles of both neighborhood SES and disorder.
2.8 ∣. Sensitivity analyses
We assessed the sensitivity of our results to several sources of potential bias. To address potential bias from post-baseline selective attrition, we re-analyzed the data using inverse probability-of-continuation weights.47 We also explored: whether our results were robust to further adjustment for social engagement and network, chronic diseases (hypertension, heart disease, and cancer), physical activity, and baseline age; averaging exposure over the year (rather than 5 years) prior to interview; and restriction to those who never moved.
3 ∣. RESULTS
We predicted residential noise levels for 7909 participants, of whom 5227 had complete data on outcomes and covariates. This resulted in 11,928 cognitive assessments for our analysis. Estimated levels of noise in the study area varied considerably with participant-specific levels ranging from 51.1 to 78.2 dBA, with a mean of 56.2 dBA (standard deviation, 2.9 dBA). Compared with participants who experienced lower noise levels, those in the highest quartile of noise tended to have fewer years of education and lived in households with lower incomes (Table 1). Neighborhoods with lower SES also had higher noise levels. Of note, NOX levels were not strongly correlated with noise in our region (r = 0.08).
TABLE 1.
Characteristicsa of participants at baseline, by quartile of exposure to community noise
| Quartile of noise level |
|||||
|---|---|---|---|---|---|
| All | Lowest (51.1-54.4 dBA) |
Second (54.4-55.4 dBA) |
Third (55.4-57.0 dBA) |
Highest (57.0-78 dBA) |
|
| N = 5227 | N = 1306 | N = 1307 | N = 1307 | N = 1307 | |
| Follow-up time (years) | 4.1 (3.6) | 4.1 (3.7) | 4.0 (3.6) | 4.2 (3.6) | 4.0 (3.7) |
| Number of cognitive assessments | 2.3 (1.1) | 2.3 (1.2) | 2.3 (1.1) | 2.3 (1.1) | 2.3 (1.1) |
| Age (years) | 73.7 (6.9) | 73.1 (6.5) | 73.4 (7.0) | 74.1 (7.4) | 74.1 (6.8) |
| Male | 38% | 38% | 40% | 38% | 36% |
| Race/ethnicity | |||||
| Black | 63% | 70% | 59% | 54% | 68% |
| Non-Hispanic White | 36% | 29% | 40% | 45% | 31% |
| Hispanic White and other | 1.4% | 0.6% | 0.7% | 1.4% | 1.9% |
| race/ethnicity | |||||
| Education (years) | 12.8 (3.3) | 12.7 (3.2) | 12.8 (3.3) | 13.1 (3.5) | 12.6 (3.4) |
| Neighborhood SES score, SD unitsb | −0.4 (3.3) | −0.6 (2.9) | 0.0 (3.4) | 0.3 (3.4) | −1.2 (3.2) |
| Personal income | |||||
| Low (<$14,999/year) | 21% | 20% | 21% | 19% | 24% |
| Medium ($15,000-$29,999/year) | 36% | 38% | 35% | 33% | 36% |
| High (>$30,000/year) | 40% | 39% | 41% | 44% | 37% |
| Missing | 3% | 3% | 3% | 3% | 3% |
| Social engagement scorec | 2.4 (1.7) | 2.4 (1.7) | 2.4 (1.7) | 2.4 (1.7) | 2.3 (1.6) |
| Social network scorec | 7.1 (6.1) | 6.9 (5.6) | 7.3 (6.5) | 7.3 (6.5) | 6.9 (5.8) |
| Smoking status | |||||
| Never | 46% | 46% | 44% | 48% | 47% |
| Current | 12% | 13% | 14% | 11% | 12% |
| Former | 42% | 41% | 42% | 42% | 41% |
| Alcohol consumption | |||||
| Low (0 g alcohol/day) | 66% | 70% | 63% | 61% | 70% |
| Moderate (>0 g alcohol/day, <2 drinks/day) | 6% | 5% | 6% | 8% | 5% |
| High (>0 g alcohol/day, ≥2 drinks/day) | 28% | 25% | 31% | 32% | 26% |
| Physical activity (hours/week) | 2.9 (4.6) | 2.7 (4.3) | 3.1 (5.0) | 3.0 (4.7) | 2.7 (4.3) |
| Body mass index (kg/m2) | 28.5 (6.1) | 28.6 (6.0) | 28.6 (6.4) | 28.4 (6.2) | 28.5 (5.8) |
| Environmental pollutant exposures | |||||
| Noise, dBA | 56.2 (2.9) | 53.5 (0.7) | 54.9 (0.3) | 56.1 (0.4) | 60.4 (2.6) |
| NOx, ppb | 40.8 (7.5) | 41.8 (6.7) | 40.1 (7.1) | 39.1 (7.5) | 42.2 (8.3) |
| Outcomes | |||||
| Global cognition score | 0.0 (1.0) | 0.0 (1.0) | 0.0 (1.0) | 0.0 (1.0) | −0.1 (1.0) |
| Episodic memory score | 0.0 (1.0) | 0.0 (1.0) | 0.0 (1.0) | 0.0 (1.0) | −0.1 (1.0) |
| Perceptual speed score | 0.0 (1.0) | 0.0 (0.9) | 0.1 (1.0) | 0.1 (1.0) | −0.1 (1.0) |
| AD likely | 11% | 9% | 10% | 12% | 12% |
| MCI likely | 30% | 30% | 29% | 29% | 32% |
Abbreviations: AD, Alzheimer’s disease dementia; dBA, A-weighted decibels; MCI, mild cognitive impairment; NOx, oxides of nitrogen; SD, standard deviation; SES, socioeconomic status.
Values shown are means (standard deviation) or percentages.
Higher score reflects higher socioeconomic status.
Higher scores reflect more social engagement and larger social networks.
3.1 ∣. Probability of MCI and AD
In unadjusted comparisons, the crude likelihood of AD was slightly higher with progressively greater quartiles of noise (Table 1). After adjustment for potential sources of confounding, community noise was associated with higher odds of both prevalent MCI and AD (Table 2). Specifically, a 10-dBA increment in noise exposure corresponded to a 36% higher odds of MCI (95% CI: 1.15, 1.62) and a 29% higher odds of AD (95%CI: 1.08, 1.55).
TABLE 2.
Adjusteda association of community noise level with the odds of prevalent MCI and AD
| Outcome | Prevalence odds ratio (95% CI) of outcome per 10-dBA increment in noise level |
|
|---|---|---|
| AD | 1.29 | (1.08, 1.55) |
| MCI | 1.36 | (1.15, 1.62) |
Abbreviations: AD, Alzheimer’s disease dementia; CI, confidence interval; dBA, A-weighted decibels; MCI, mild cognitive impairment; SES, socioeconomic status.
Adjusted for calendar time, baseline age, age at exam, sex, race/ethnicity, income, education, neighborhood SES, smoking, alcohol use, and air pollution (NOX).
3.2 ∣. Cognitive performance and decline
Participants in the highest residential noise quartile had slightly lower cognitive scores at baseline (Table 1). After adjustment for potential confounders (Table 3), we found that a 10-dBA increment in noise was associated with a 0.04 standard deviation (SD) unit lower global cognition score (95% CI −0.11 to 0.03). Underlying this association was the pronounced inverse association of noise with perceptual speed score (−0.09 SD per 10 dBA, 95% CI: −0.16 to −0.03). These associations were similar in magnitude to the difference in scores between participants who were 2 (perceptual speed) and 0.5 (global cognition) years apart in age at baseline. By contrast, there was little association of noise exposure with episodic memory performance (0.005 per 10 dBA; 95% CI: −0.08, 0.10). Noise exposure was also not consistently associated with rate of cognitive decline.
TABLE 3.
Adjusteda association of community noise level with baseline and rate of change in cognitive performance
| Mean difference (95% CI) per 10-dBA increment in noise level |
||||||
|---|---|---|---|---|---|---|
| Performance at baseline, SD units |
Rate of change, SD units per year |
|||||
| Age < 75 years at examination |
Age ≥ 75 years at examination |
|||||
| Cognitive measure | ||||||
| Global cognition | −0.04 | (−0.11, 0.04) | 0.01 | (−0.01, 0.02) | 0.00 | (−0.04, 0.04) |
| Episodic memory | 0.01 | (−0.08, 0.10) | 0.02 | (0.002, 0.04) | 0.00 | (−0.04, 0.05) |
| Perceptual speed | −0.09 | (−0.16, −0.03) | 0.00 | (−0.02, 0.01) | 0.00 | (−0.03, 0.04) |
Abbreviations: dBA, A-weighted decibels; CI, confidence interval; NOx, oxides of nitrogen; SD, standard deviation; SES, socioeconomic status.
Adjusted for calendar time, baseline age, age at exam, sex, race, income, education, neighborhood SES, smoking, alcohol use, and air pollution (NOx). Rate of change stratified by age at time of examination.
3.3 ∣. Sensitive subpopulations
Associations of noise with higher odds of AD and poorer cognition were most pronounced among participants living in neighborhoods with more neighborhood disorder and lower socioeconomic position (Figure 1). There were no substantial differences in association across levels of other factors.
FIGURE 1.
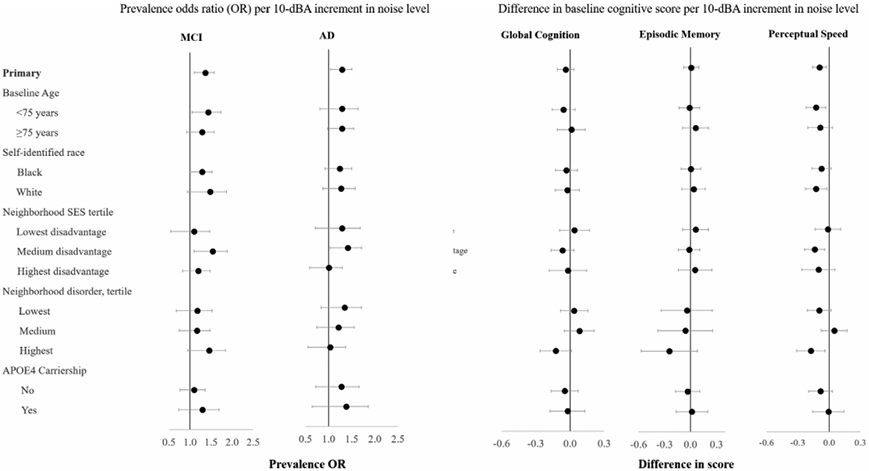
Association of community noise level with prevalent mild cognitive impairment and Alzheimer’s disease and baseline cognitive performance, by personal and neighborhood factors
Adjusted for calendar time, baseline age, age at exam, sex, race, income, education, neighborhood SES, smoking, alcohol use, and air pollution (NOx). Rate of change stratified by age at time of examination. dBA = A-weighted decibels; NOx = oxides of nitrogen; SES = socioeconomic status; AD = Alzheimer’s disease dementia; MCI = mild cognitive impairment
3.4 ∣. Sensitivity analyses
All associations were robust to further adjustment for social networks, social engagement, and physical activity. Associations were similarly robust to different averaging times for noise levels and restriction to those who did not move (Figure S1 in supporting information). With adjustment for post-baseline attrition bias with inverse probability-of-continuation weights, most associations with cognitive change over time shifted slightly downward (becoming less positive, more negative, or shifting from positive to negative), although they remained small in magnitude and imprecise. Associations with prevalent MCI and AD were not changed with adjustment for attrition.
4 ∣. DISCUSSION
In this first U.S.-based study of its kind, higher long-term exposure to community noise was associated with higher odds of MCI and AD as well as worse cognitive performance—specifically, perceptual speed—in older adults. These associations were observed across a range of noise levels that are typical in the United States, ranging from a quiet suburb to noisier urban settings near large automotive expressways. These associations were also independent of several measures of socioeconomic status and exposure to traffic-related air pollution, which was only weakly associated with noise exposure.
Although it has been well documented that children exposed to community noise are at heightened risk for developmental delays and deficits in learning and cognitive performance,20 data pertaining to noise and cognitive risk in older adults is sparse. In this study, we found a strong association between noise and perceptual speed, whereby the decrement in performance corresponding to a 10-dBA higher noise level was similar to the decrement in performance corresponding to being 2 years older at baseline. These findings add to those from the Heinz Nixdorf Recall Study, a cohort of German adults who were 45 to 75 years at baseline. In that investigation, researchers compared cognitive outcomes per 10-dBA increment in noise above thresholds of 60 dBA (for weighted 24-hour mean noise level [LDEN]) and 55 dBA (for nighttime noise). Their results suggested that participants with higher baseline exposure to community noise during the day and at night tended to have worse cognitive performance 5 years later on several tests of cognition.21 Unlike in our study, however, their estimates were somewhat attenuated with adjustment for long-term exposure to fine particulate matter, which itself was adversely associated with cognitive performance.
In another investigation from the Heinz Nixdorf cohort, higher suprathreshold noise exposure was also associated with higher risk of MCI22 with a magnitude almost identical to that which we found in CHAP, although exposures in the Heinz Nixdorf cohort were truncated at 60 dB. To our knowledge, only two other studies have reported on the relation of noise to dementia risk. Among London-area adults (50 to 79 years) with clinical data in the Clinical Practice Research Datalink, higher exposure to nighttime noise was associated with elevated dementia risk over the subsequent 9 years.23 The association was small in magnitude and appeared to be limited to those in the highest quintile of exposure (hazard ratio = 1.09, 95% CI: 0.95 to 1.25, comparing >53.8 dB vs 49.4 dB or lower). In another study set in Umeå, Sweden, community exposure to noise ≥55 dB (versus <55 dB) was not associated with dementia risk, with or without adjustment for NOX exposure.24
One challenge faced by the London and Sweden studies was their reliance on community medical care information on dementia status. Dementia classification based solely on medical records or health insurance claims, in contrast to regular uniform assessments of all persons, is highly prone to misclassification, even in settings with universal health insurance.48,49 Furthermore, variation in the interval from symptom onset to diagnosis can also introduce differential measurement error. For example, one study found that the time to diagnosis was shorter among those with more formal education.48 Although little is known about whether dementia misclassification varies by noise exposure, small variations in specificity across exposure level can lead to substantial bias in effect estimates.50 Another possible issue is that the adverse effects of community noise on cognition and risks of MCI and dementia may be most observable at moderate to high levels. A noise-dementia association in the London study was notably absent except among those with exposures in the highest nighttime noise quintile (53.8 to 75.1 dB [I. Carey, personal communication, September 2, 2019]). In the Swedish study, where no association was observed, <10% of participants in the Swedish study had exposures ≥55 dB and <2% (29) had exposures ≥60 dB, whereas our study and the Heinz Nixdorf Recall cohort both had maximum exposures of about 80 dBA and observed similar associations with noise.
Our study involved repeated uniform measures of cognition as opposed to administrative records. We also had detailed information on potential confounders including individual and neighborhood socioeconomic factors, as well as traffic-related air pollution. In addition, our exposure assessment was unique for research set in the United States, where quality assessments of community noise levels have been rare. Nonetheless, this study is not without limitations. First, we based our noise estimates on daytime measurements. Though nighttime noise may be important because it disrupts sleep, our model predictions track well with overall self-reported noise annoyance in this region.51 In addition, LDen and LNight appeared to be highly correlated in other areas such as in the Heinz Nixdorf Recall Study.52 A second potential limitation of this work is that our classification of MCI and AD relied on likelihood scores rather than comprehensive clinical evaluation of every participant. However, these scores were validated against uniform clinical evaluations of a subsample of participants, and using them nearly tripled the available sample size. Our study also evaluated prevalent rather than incident MCI and AD. Considering that prevalence increases with higher incidence and longer survival, our prevalence odds ratios should be a qualitative reflection of the incidence ratios so long as noise does not shorten survival. If noise exposure did shorten survival among those with MCI or AD then our prevalence odds ratios would underestimate the influence of noise on incidence. Finally, in light of the adverse associations we observed between noise exposure and cognitive performance as well as prevalent MCI and AD, it was somewhat unexpected to observe little association with cognitive decline, an outcome that more directly reflects the disease process of neurodegeneration. The duration of follow-up may have been insufficient to capture an effect on cognitive decline, the effects of noise on cognition may have persisted from an earlier period, or the effects may be acute but not progressive.
The estimated associations of noise with the outcomes in our study did not vary substantially by exposure to air pollution, specifically NOX. By contrast, in the Heinz Nixdorf Recall cohort, weighted 24-hour mean noise level (LDEN) was inversely associated with global cognitive performance among participants with above-median but not below-median exposure to air pollution, especially fine and coarse fraction particulate matter.53 Effect modification was not reported in other studies. “Mechanistic interactions” between noise and air pollution exposure are of etiologic and policy interest. Nonetheless, apart from the limited statistical power of these interactions, other challenges make it difficult to compare interaction estimates across studies. Heterogeneity across study populations in terms of exposure ranges, exposures assessed, and co-exposures could yield different interaction estimates, even if all estimates are unbiased.54
In conclusion, higher long-term exposure to community noise was associated with higher prevalence of MCI and AD and worse cognitive performance, especially perceptual speed. This association was detected in a diverse, urban, U.S.-based population of older adults with noise exposures that are likely to be consistent with exposure levels in other U.S. metropolitan areas.25 Therefore, if noise exposure does contribute to dementia risk—a question that warrants continued investigation, particularly in U.S. settings—its abatement may be a means for reducing the population burden of dementia.
Supplementary Material
RESEARCH IN CONTEXT.
Systematic review:
The authors reviewed the literature indexed on PubMed. Exposure to community noise adversely affects learning in children and is associated with cardiovascular disease. Several recent studies have evaluated community noise exposure in relation to dementia and related outcomes; none was in the United States. These relevant studies are appropriately cited.
Interpretation:
In a large US metropolitan area, we observed that higher levels of noise were associated with a higher prevalence of MCI and AD and worse cognitive performance after adjustment for other environmental and personal risk factors. Our findings were fairly consistent with findings of previous studies in which participants were exposed to similar levels of community noise. Nonetheless, the small number of studies make it challenging to draw definitive conclusions.
Future directions:
In light of the evidence amassed thus far, new research can address our understanding of the role of noise in dementia etiology by (a) using outcome assessments that minimize differential misclassification according to noise exposure, and (b) evaluating different dimensions of exposure, including time of day and indoor and outdoor sources.
ACKNOWLEDGMENTS
This work was supported by grants from the Alzheimer’s Association (16GRNT30960046) and the NIH-NIA (R01AG065359, R01AG11101, RF1AG057532, and R01AG051635). The authors would also like to thank Drexel Urban Health Collaborative for their data on NSES and technical support. The authors take sole responsibility for all data analyses, interpretation, and views expressed in this work.
Footnotes
CONFLICTS OF INTEREST
The authors have declared no conflicts of interest.
SUPPORTING INFORMATION
Additional supporting information may be found online in the Supporting Information section at the end of the article.
REFERENCES
- 1.Hebert LE, Weuve J, Scherr PA, Evans DA. Alzheimer disease in the United States (2010-2050) estimated using the 2010 census. Neurology. 2013;80(19):1778–1783. [DOI] [PMC free article] [PubMed] [Google Scholar]
- 2.Prince M, Wimo A, Guerchet M, et al. World Alzheimer Report 2015: The Global Impact of Dementia: An Analysis of Prevalence, Incidence, Cost, & Trends. London: 2015. [Google Scholar]
- 3.Bouchard MF, Oulhote Y, Sagiv SK, Saint-Amour D, Weuve J. Polychlorinated biphenyl exposures and cognition in older U.S. adults: nHANES (1999-2002). Environ Health Perspect. 2014;122(1):73–78. [DOI] [PMC free article] [PubMed] [Google Scholar]
- 4.Power MC, Adar SD, Yanosky JD, Weuve J. Exposure to air pollution as a potential contributor to cognitive function, cognitive decline, brain imaging, and dementia: a systematic review of epidemiologic research. Neurotoxicology. 2016;56:235–253. [DOI] [PMC free article] [PubMed] [Google Scholar]
- 5.Weuve J, Weisskopf MG. CHAPTER 1 Exposure to lead and cognitive dysfunction. Aging and Vulnerability to Environmental Chemicals: Age-related Disorders and Their Origins in Enviromental Exposures. The Royal Society of Chemistry; 2013:5–30. https://pubs.rsc.org/--/content/chapter/9781849734660-00005/978-1-84973-418-9/unauth [Google Scholar]
- 6.Paul KC, Haan M, Mayeda ER, Ritz BR. Ambient air pollution, noise, and late-life cognitive decline and dementia risk. Annu Rev Public Health. 2019;40:203–220. [DOI] [PMC free article] [PubMed] [Google Scholar]
- 7.Noise As a Public Health Hazard - Proceedings of the Conference June 13-14, 1968. Washington, D.C.: American Speech & Hearing Association, 1969. [Google Scholar]
- 8.Chepesiuk R Decibel hell: the effects of living in a noisy world. Environ Health Perspect. 2005;113(1):A34–A41. [DOI] [PMC free article] [PubMed] [Google Scholar]
- 9.Cui B, Li K, Gai Z, et al. Chronic noise exposure acts cumulatively to exacerbate alzheimer’s disease-like amyloid-beta pathology and neuroinflammation in the rat hippocampus. Sci Rep. 2015;5:12943. [DOI] [PMC free article] [PubMed] [Google Scholar]
- 10.Cui B, Zhu L, She X, et al. Chronic noise exposure causes persistence of tau hyperphosphorylation and formation of NFT tau in the rat hippocampus and prefrontal cortex. Exp Neurol. 2012;238(2):122–129. [DOI] [PubMed] [Google Scholar]
- 11.Cui B, Li K. Chronic noise exposure and Alzheimer disease: is there an etiological association?. Med Hypotheses. 2013;81(4):623–626. [DOI] [PubMed] [Google Scholar]
- 12.Cheng L, Wang SH, Chen QC, Liao XM. Moderate noise induced cognition impairment of mice and its underlying mechanisms. Physiol Behav. 2011;104(5):981–988. [DOI] [PubMed] [Google Scholar]
- 13.Liu L, Shen P, He T, et al. Noise induced hearing loss impairs spatial learning/memory and hippocampal neurogenesis in mice. Sci Rep. 2016;6:20374. [DOI] [PMC free article] [PubMed] [Google Scholar]
- 14.Rabat A, Bouyer JJ, George O, Le Moal M, Mayo W. Chronic exposure of rats to noise: relationship between long-term memory deficits and slow wave sleep disturbances. Behav Brain Res. 2006;171(2):303–312. [DOI] [PubMed] [Google Scholar]
- 15.Zijlema W, Cai Y, Doiron D, et al. Road traffic noise, blood pressure and heart rate: pooled analyses of harmonized data from 88,336 participants. Environ Res. 2016;151:804–813. [DOI] [PubMed] [Google Scholar]
- 16.Babisch W Transportation noise and cardiovascular risk: updated review and synthesis of epidemiological studies indicate that the evidence has increased. Noise and Health. 2006;8(30):1. [DOI] [PubMed] [Google Scholar]
- 17.Munzel T, Sorensen M, Gori T, et al. Environmental stressors and cardio-metabolic disease: part I-epidemiologic evidence supporting a role for noise and air pollution and effects of mitigation strategies. Eur Heart J. 2017;38(8):550–556. [DOI] [PubMed] [Google Scholar]
- 18.Kempen EV, Casas M, Pershagen G, Foraster M. WHO Environmental Noise Guidelines for the European Region: a systematic review on environmental noise and cardiovascular and metabolic effects: a summary. Int J Environ Res Public Health. 2018;15(2). [DOI] [PMC free article] [PubMed] [Google Scholar]
- 19.Heritier H, Vienneau D, Foraster M, et al. A systematic analysis of mutual effects of transportation noise and air pollution exposure on myocardial infarction mortality: a nationwide cohort study in Switzerland. Eur Heart J. 2019;40(7):598–603. [DOI] [PubMed] [Google Scholar]
- 20.Basner M, Babisch W, Davis A, et al. Auditory and non-auditory effects of noise on health. Lancet. 2014;383(9925):1325–1332. [DOI] [PMC free article] [PubMed] [Google Scholar]
- 21.Tzivian L, Dlugaj M, Winkler A, et al. Long-term air pollution and traffic noise exposures and cognitive function:a cross-sectional analysis of the Heinz Nixdorf Recall study. J Toxicol Environ Health A. 2016;79(22–23):1057–1069. [DOI] [PubMed] [Google Scholar]
- 22.Tzivian L, Dlugaj M, Winkler A, et al. Long-term air pollution and traffic noise exposures and mild cognitive impairment in older adults: a cross-sectional analysis of the Heinz Nixdorf Recall Study. Environ Health Perspect. 2016;124(9):1361–1368. [DOI] [PMC free article] [PubMed] [Google Scholar]
- 23.Carey IM, Anderson HR, Atkinson RW, et al. Are noise and air pollution related to the incidence of dementia? A cohort study in London, England. BMJ Open. 2018;8(9):e022404. [DOI] [PMC free article] [PubMed] [Google Scholar]
- 24.Andersson J, Oudin A, Sundstrom A, Forsberg B, Adolfsson R, Nordin M. Road traffic noise, air pollution, and risk of dementia - results from the Betula project. Environ Res. 2018;166:334–339. [DOI] [PubMed] [Google Scholar]
- 25.Hammer MS, Swinburn TK, Neitzel RL. Environmental noise pollution in the United States: developing an effective public health response. Environ Health Perspect. 2014;122(2):115–119. [DOI] [PMC free article] [PubMed] [Google Scholar]
- 26.Allen RW, Davies H,Cohen MA, Mallach G, Kaufman JD, Adar SD. The spatial relationship between traffic-generated air pollution and noise in 2 US cities. Environ Res. 2009;109(3):334–342. [DOI] [PMC free article] [PubMed] [Google Scholar]
- 27.Bienias JL, Beckett LA, Bennett DA, Wilson RS, Evans DA. Design of the Chicago Health and Aging Project (CHAP). J Alzheimers Dis. 2003;5(5):349–355. [DOI] [PubMed] [Google Scholar]
- 28.Evans DA, Bennett DA, Wilson RS, et al. Incidence of Alzheimer disease in a biracial urban community: relation to apolipoprotein E allele status. Arch Neurol. 2003;60(2):185–189. [DOI] [PubMed] [Google Scholar]
- 29.Smith A Symbol Digit Modalities Test Manual - Revised. Los Angeles: Western Psychological Services; 1982. [Google Scholar]
- 30.Albert M, Smith LA, Scherr PA, Taylor JO, Evans DA, Funkenstein HH. Use of brief cognitive tests to identify individuals in the community with clinically diagnosed Alzheimer’s disease. Int J Neurosci. 1991;57(3-4):167–178. [DOI] [PubMed] [Google Scholar]
- 31.Folstein MF, Folstein SE, McHugh PR. Mini-Mental State: a practical method for grading the state of patients for the clinician. J Psychiatr Res. 1975;12:189–198. [DOI] [PubMed] [Google Scholar]
- 32.Wilson RS, Bennett DA, Bienias JL, Mendes de Leon CF, Morris MC, Evans DA. Cognitive activity and cognitive decline in a biracial community population. Neurology. 2003;61(6):812–816. [DOI] [PubMed] [Google Scholar]
- 33.Wilson RS, Bennett DA, Mendes de Leon CF, Bienias JL, Morris MC, Evans DA. Distress proneness and cognitive decline in a population of older persons. Psychoneuroendocrinology. 2005;30(1):11–17. [DOI] [PubMed] [Google Scholar]
- 34.Weuve J, Barnes LL, Mendes de Leon CF, et al. Cognitive aging in Black and White Americans: cognition, cognitive decline, and incidence of Alzheimer disease dementia. Epidemiology. 2018;29(1):151–159. [DOI] [PMC free article] [PubMed] [Google Scholar]
- 35.Rajan KB, Weuve J, Wilson RS, Barnes LL, McAninch EA, Evans DA. Temporal changes in the likelihood of dementia and MCI over 18 years in a population sample. Neurology. 2020;94(3):e292–e298. [DOI] [PMC free article] [PubMed] [Google Scholar]
- 36.Bienias JL, Kott PS, Evans DA, Application of the delete-a-group jack-knife variance estimator to analyses of data from a complex longitudinal survey. Proceedings of the Annual Meeting of the American Statistical Association - Section on Survey Research Methods [CD-ROM]. 2003:539–544. [Google Scholar]
- 37.Bienias JL, Kott PS, Beck TL, Evans DA, Incorporating multiple observations into logistic regression models of incident disease. Proceedings of the Annual Meeting of the American Statistical Association - Section on Survey Research Methods [CD-ROM]. 2005:2767–2774. [Google Scholar]
- 38.McKhann G, Drachman D, Folstein M, Katzman R, Price D, Stadlan EM. Clinical diagnosis of Alzheimer’s disease: report of the NINCDS-ADRDA Work Group under the auspices of Department of Health and Human Services Task Force on Alzheimer’s disease. Neurology. 1984;34(7):939–944. [DOI] [PubMed] [Google Scholar]
- 39.Barnes LL, Mendesde Leon CF, Wilson RS, Bienias JL, Evans DA. Social resources and cognitive decline in a population of older African Americans and whites. Neurology. 2004;63(12):2322–2326. [DOI] [PubMed] [Google Scholar]
- 40.Roux AVD, Merkin SS, Arnett D, et al. Neighborhood of residence and incidence of coronary heart disease. N Engl J Med. 2001;345(2):99–106. [DOI] [PubMed] [Google Scholar]
- 41.Hajat A, Diex-Roux A, Adar S, et al. Air pollution and individual and neighborhood socioeconomic status: evidence from the multi-ethnic study of atherosclerosis (MESA). Environ Health Perspect. 2013;121(11-12):1325–1333. [DOI] [PMC free article] [PubMed] [Google Scholar]
- 42.Mendes de Leon CF, Cagney KA, Bienias JL, et al. Neighborhood social cohesion and disorder in relation to walking in community-dwelling older adults: a multilevel analysis. J Aging Health. 2009;21(1):155–171. [DOI] [PMC free article] [PubMed] [Google Scholar]
- 43.Keller JP, Olives C, Kim SY, et al. A unified spatiotemporal modeling approach for predicting concentrations of multiple air pollutants in the multi-ethnic study of atherosclerosis and air pollution. Environ Health Perspect. 2015;123(4):301–309. [DOI] [PMC free article] [PubMed] [Google Scholar]
- 44.Sampson PD, Szpiro AA, Sheppard L, Lindström J, Kaufman JD. Pragmatic estimation of a spatio-temporal air quality model with irregular monitoring data. Atmos Environ. 2011;45(36):6593–6606. [Google Scholar]
- 45.Touloumis A R Package multgee: a generalized estimating equations solver for multinomial responses. J Stat Softw. 2017;64(8):1–14. [Google Scholar]
- 46.Wood S, Scheipl F. gamm4: Generalized Additive Mixed Models using ‘mgcv’ and ‘lme4’. 2017; R package version 0.2-5. https://CRAN.R-project.org/package=gamm4. [Google Scholar]
- 47.Weuve J, Tchetgen Tchetgen EJ, Glymour MM, et al. Accounting for bias due to selective attrition: the example of smoking and cognitive decline. Epidemiology. 2012;23(1):119–128. [DOI] [PMC free article] [PubMed] [Google Scholar]
- 48.Rizzuto D, Feldman AL, Karlsson IK, Dahl Aslan AK, Gatz M, Pedersen NL. Detection of dementia cases in two Swedish health registers: a validation study. J Alzheimers Dis. 2018;61(4):1301–1310. [DOI] [PMC free article] [PubMed] [Google Scholar]
- 49.Wilkinson T, Ly A, Schnier C,et al. Identifying dementia cases with routinely collected health data: a systematic review. Alzheimers Dement. 2018;14(8):1038–1051. [DOI] [PMC free article] [PubMed] [Google Scholar]
- 50.Weuve J, Sagiv SK, Fox MP. Quantitative bias analysis for collaborative science. Epidemiology 2018;29(5):627–630. [DOI] [PMC free article] [PubMed] [Google Scholar]
- 51.Adar S, Diez-Roux A, Oron A, Kaufman J, Allen R, Modeled air pollution, modeled noise, and perceived noise in the Multi-Ethnic Study of Atherosclerosis (MESA). Oral presentation at Conference of the International Society of Exposure Science; 2012; Columbia, Washington, D.C., USA. [Google Scholar]
- 52.Tzivian L, Dlugaj M, Winkler A, et al. Long-term air pollution and traffic noise exposures and cognitive function:a cross-sectional analysis of the Heinz Nixdorf Recall study. J Toxicol Env Health Part A. 2016;79(22-23):1057–1069. [DOI] [PubMed] [Google Scholar]
- 53.Greenland S, Lash TL, Rothman KJ. Concepts of Interaction. In: Rothman KJ, Greenland S, Lash TL, eds. Modern Epidemiology. 3rd ed. Philadelphia: Lippincott, Williams & Wilkins; 2008:128–147. [Google Scholar]
Associated Data
This section collects any data citations, data availability statements, or supplementary materials included in this article.