Abstract
Traumatic brain injury (TBI) is a serious public health problem and the leading cause of death in children and young adults. It also contributes to a substantial number of cases of permanent disability. As lipids make up over 50% of the brain mass and play a key role in both membrane structure and cell signaling, their profile is of particular interest. In this study, we show that advanced mass spectrometry imaging (MSI) has sufficient technical accuracy and reproducibility to demonstrate the anatomical distribution of 50 μm diameter microdomains that show changes in brain ceramide levels in a rat model of controlled cortical impact (CCI) 3 days post injury with and without treatment. Adult male Sprague-Dawley rats received one strike and were euthanized 3 days post trauma. Brain MS images showed increase in ceramides in CCI animals compared to control as well as significant reduction in ceramides in CCI treated animals, demonstrating therapeutic effect of a peptide agonist. The data also suggests the presence of diffuse changes outside of the injured area. These results shed light on the extent of biochemical and structural changes in the brain after traumatic brain injury and could help to evaluate the efficacy of treatments.
INTRODUCTION
Traumatic brain injury (TBI) research has identified cellular mechanisms involved in response to focal or primary, to secondary diffuse injury, and repair. The focal injury causes immediate disruption in cell membranes upsetting the normal balance of extracellular neurotransmitters, homeostasis, and medium.1 Intact cells within the focal injury are immediately exposed to the stressed environment. Pathways involved in ion transport (Na, K, Ca) and excitatory amino acids such as glutamate and neurotransmitters are overwhelmed.2–8 Cerebral blood flow is also impaired which seemingly has two effects: the focal site retains an imbalanced ionic state while the proximal cellular environment is protected from the same fate.2,5,6,9–12 Secondary injury involves multiple cellular processes including inflammation and cytotoxicity.2,5,6,13–18 Opioid and nonopioid receptors,2,19 cyclooxygenase,4,16 and inflammatory cytokines2,4,7,15,20–23 have been investigated.
One nonopioid pathway is N-methyl-D-aspartate (NMDA)-mediated cell cytotoxicity and another is NMDA mediated dynorphin neurotoxicity. While extracellular glutamate and aspartate concentrations are elevated in TBI and affect cell potentials, activation of the NMDA receptor by dynorphin is an additional pathway to disrupting cell functions.4,8,11,16,24–37 In the central nervous system (CNS), dynorphin normally circulates at nanomolar concentrations.2,25,38 However, CNS injury results in release of micromolar concentrations of dynorphin, resulting in saturation of opioid receptors.2,38 The excess dynorphin interacts with an epitope of the NR1 subunit of the NMDA receptor resulting in reversal of flow at the membrane causing cell death.2,38 Dynorphin-NR1 subunit interaction is driven by strong noncovalent ionic attraction between an acidic epitope of NR1 and the basic residues of dynorphin. We previously demonstrated that a peptide with the same sequence as the NR1 epitope of NMDA receptor, that we termed “decoy peptide” interacts with excess dynorphin, thus preventing NMDA mediated dynorphin neurotoxicity.39 It was surmised that if dynorphin is involved in TBI, treatment with the decoy peptide could improve outcome in injured animals.
Roux et al.40 first reported that ceramide (CER), diacylglycerol (DAG), cholesterol ester (CE), sphingomyelin (SM), and phosphatidylcholine (PC) species abundance changed in the region of controlled cortical impact (CCI) and trended with the severity of the injury with respect to controls across multiple regions at 7 days. In particular, they showed that mass spectrometry imaging (MSI) with implanted silver nanoparticles (AgNPs) has accuracy and reproducibility to use the 0.5th percentile outliers to the control group distribution of m/z peaks as metrics for tracking biochemical sequelae of CCI. Ceramides were of particular interest because they are known to be biomarkers of cell death41–44 and may have the potential for monitoring loci therapeutic treatment if the decoy peptide in fact improves outcome in injured animals. This article will illustrate the potential utility of four ceramides m/z 644.4171 CER 34:1, m/z 670.4328 CER 36:2, m/z 674.4481 CER 36:1, and m/z 700.4797 CER 38:1 as biomarkers for monitoring effects of brain injury and drug treatment in an animal model of TBI.
RESULTS AND DISCUSSION
Technical improvements in laser desorption MSI with silver nanoparticles permit the effects of CCI and treatment to be examined meaningfully by graphical visualization of suprathreshold pixels in affected regions and by direct statistical comparisons of m/z peaks within brain regions of interest. An illustration of binary image representation where peak areas above threshold (1 220 000 counts) are white and peak areas less than or equal to threshold are black of CER 36:1 (m/z 674.4481) is presented in Figure 1. Each section image was then symmetrically divided into four areas (quadrants) as defined in Figure 1b to enable intra- and intersection statistical evaluation of regional effects of CCI and decoy peptide treatment. Quadrant 1 was the dorsal aspect of the section on the side contralateral to the craniotomy in control and CCI rats. Quadrant 2 was the ventral half of the section on the side contralateral to the craniotomy. On the side ipsilateral to the craniotomy, quadrant 3 occupied the ventral half and quadrant 4 was the dorsal half of the section, which contained the direct CCI site in the impacted animals.
Figure 1.
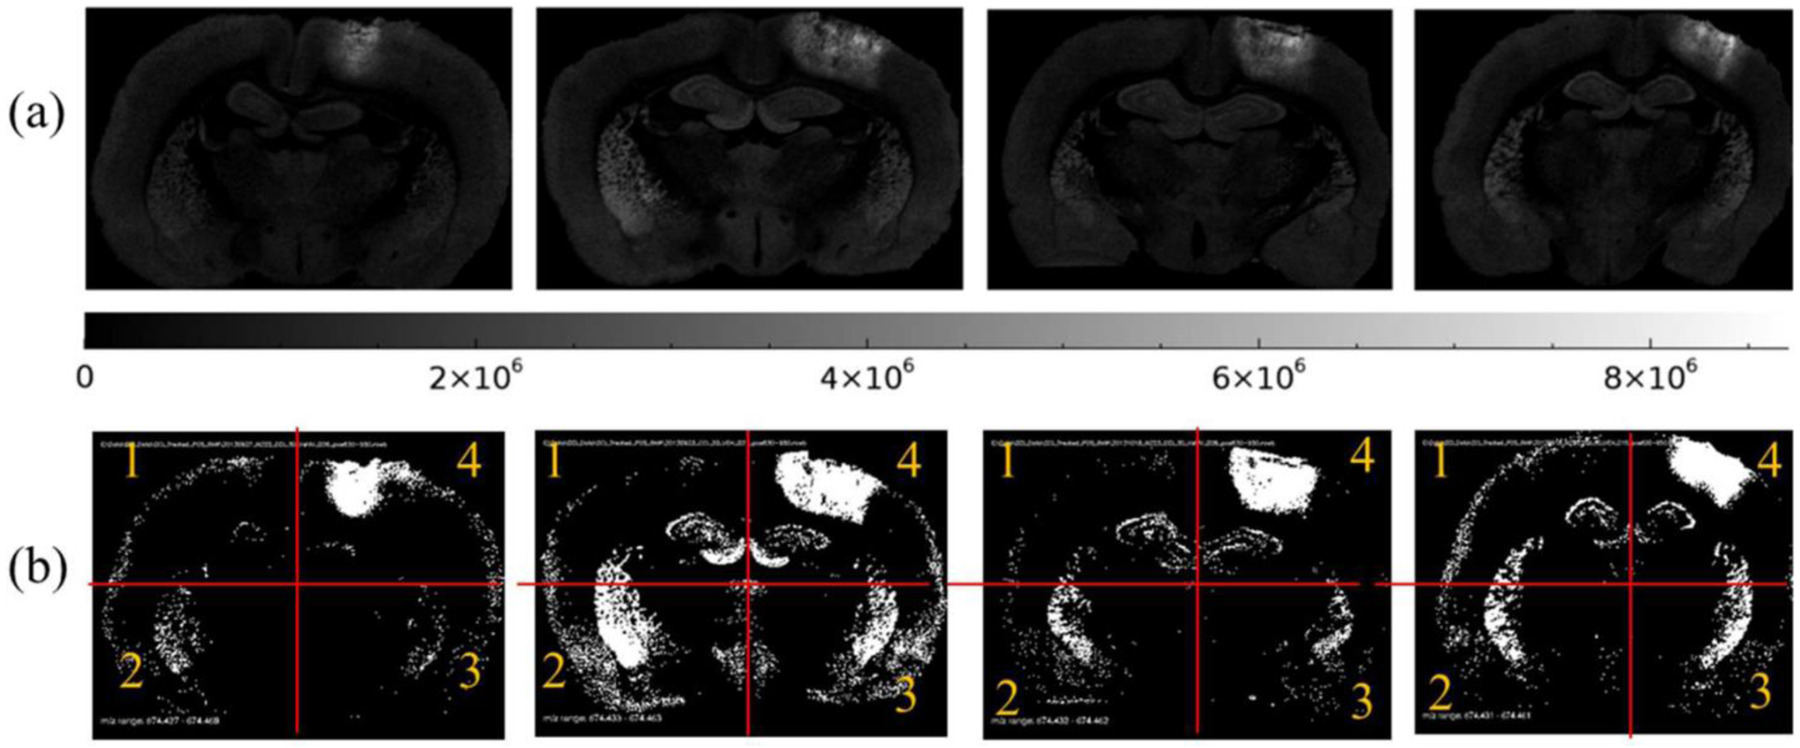
Distribution of CER 36:1 (m/z 674.4481) shown in two formats, (a) 8-bit grayscale images with scale and (b) binary threshold images (black pixel equals a pixel peak area less than or equal to 1 220 000 counts, and white pixel equals a pixel peak area greater than 1 220 000 counts) for CCI vehicle samples. Red lines illustrate approximate location of segmentation of each section into quadrants. Q4 is location of CCI.
The suprathreshold data for each m/z value serve as an objective, reproducible, and quantitative guide for counts of spatial features such as the number of suprathreshold pixels, total peak area of suprathreshold pixels, and the average peak area per pixel for pixels exceeding threshold, per section. A spatial overview of the effects of CCI and decoy peptide treatment on regional upregulation of CER species are documented by maps of samples that exceed a threshold at the upper 0.5% of the respective control vehicle group cumulative distribution functions (see Figure 1b for example).
The level of CER 34:1 in control vehicle and control treated animals was below the limit of detection for all but 0.67% of the pixels (0.62% in the control vehicle and 0.73% in the control treated groups). The suprathreshold (upper 0.5%, pixel peak area greater than 0 counts) distribution was restricted to the choroid plexus and ependymal lining associated with the cerebral ventricles in these control-operated animals (Figure 2). CER 34:1 was highly upregulated around the impact site in CCI groups (Figure 2). The average number of suprathreshold pixels in the damaged quadrant 4 was elevated significantly in CCI vehicle group relative to both control groups (Tukey HSD tests, p = 2 × 10⁻⁷ and p = 6 × 10⁻⁷, respectively). The CCI treated animals showed an intermediate number of suprathreshold pixels, indicating attenuation of CER 34:1 upregulation by the decoy peptide. Analyses of the total CER 34:1 peak areas of the suprathreshold samples (Figure 3) showed regional effects of CCI and treatment. In the impacted quadrant of the section (Q4), the total lipid peak was augmented significantly in the CCI vehicle group relative to the control treated (Tukey HSD tests, p = 1 × 10⁻⁶) group and the control vehicle (Tukey HSD tests, p = 6 × 10⁻⁷) group. Decoy peptide reduced the CCI-induced increase in the total CER 34:1 peak (i.e., relative to the CCI vehicle group, Tukey HSD tests, p = 4 × 10⁻⁴), but it remained greater than the total peak values for the control treated Q4 and control vehicle Q4. Effects of CCI and treatment were not significant in other quadrants.
Figure 2.
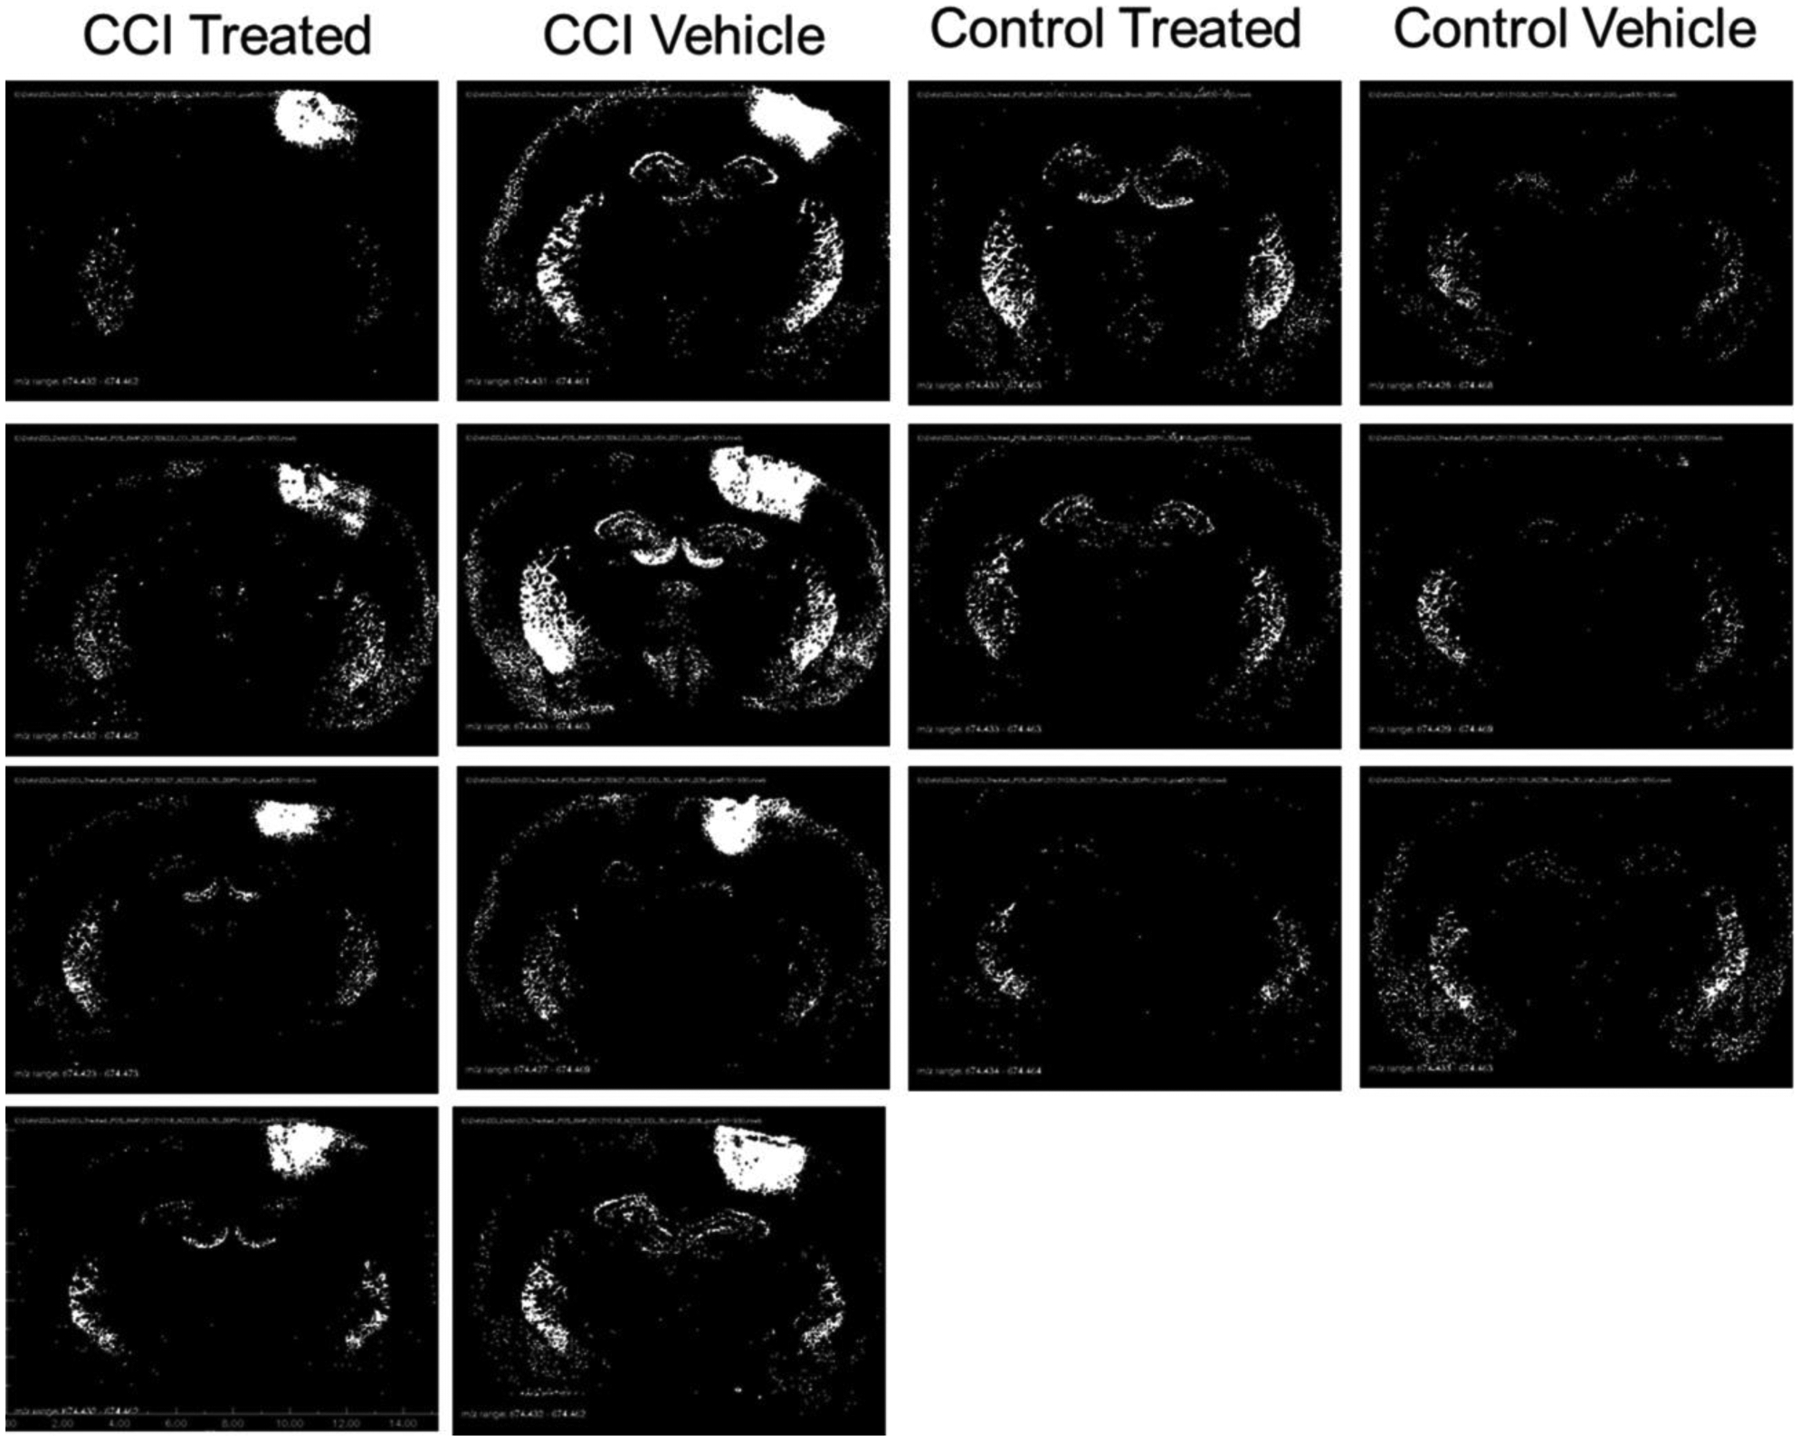
Distribution of CER 34:1 (m/z 644.4171) displayed as binary images of pixels exceeding peak area threshold. Black pixels represent peak area equal to 0 counts, and white pixels represent peak areas greater than 0 counts.
Figure 3.
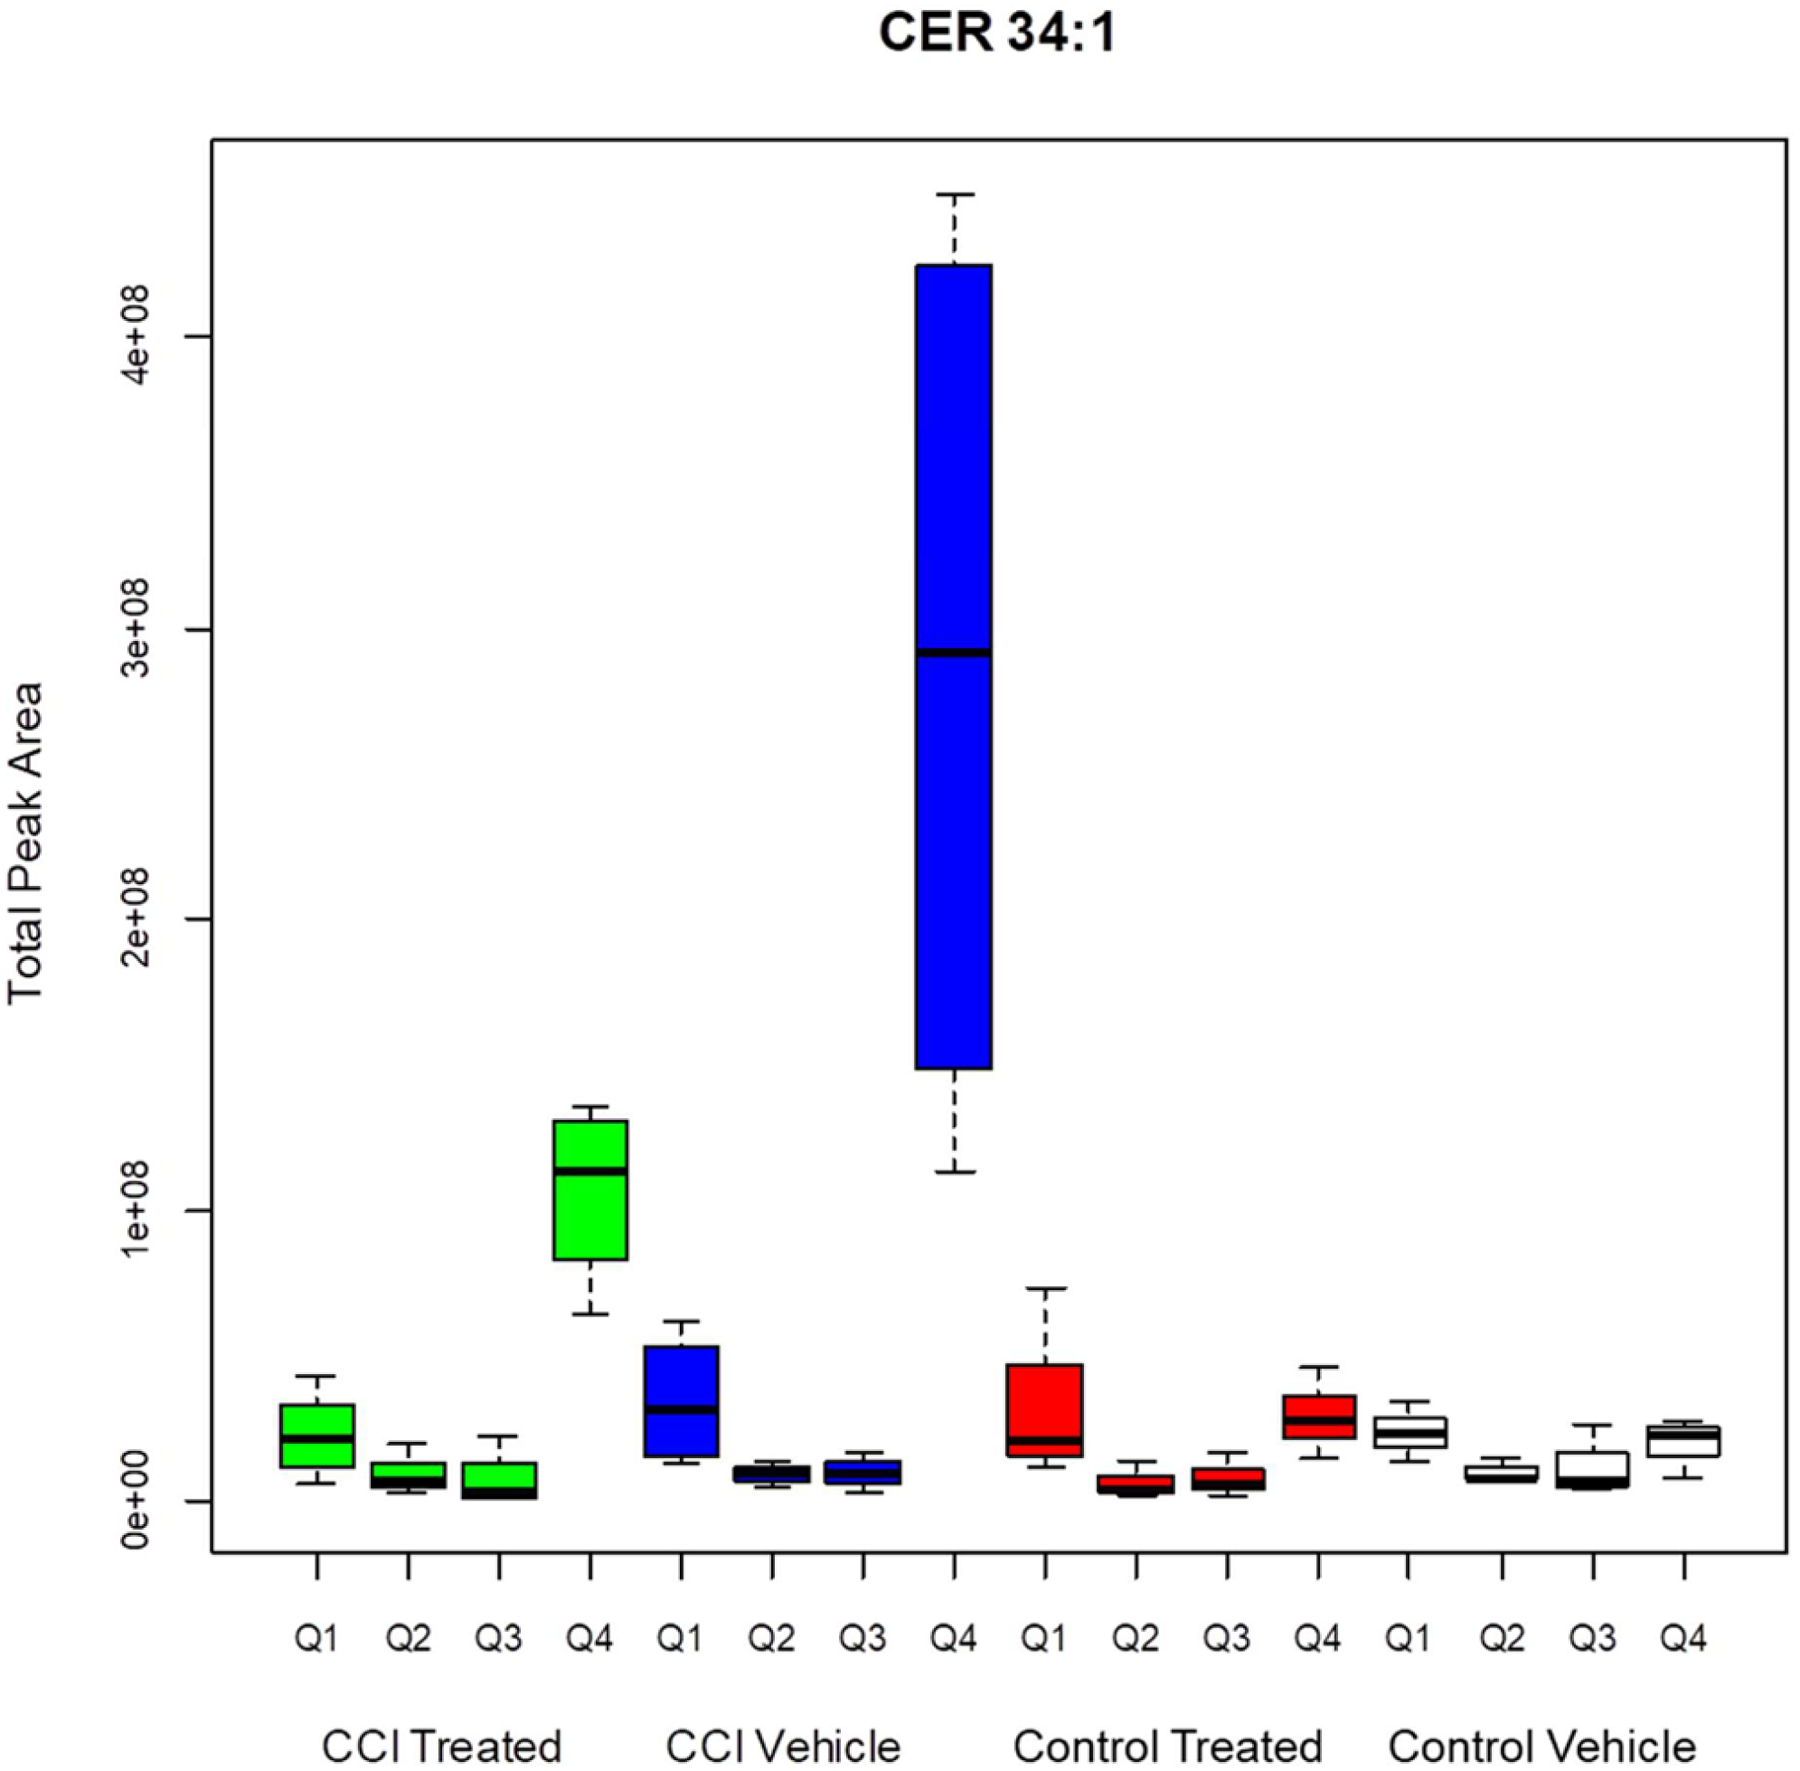
Total peak area for pixels greater than threshold for CER 34:1. CCI vehicle arm is significantly different than CCI treated (p < 0.001), control treated (p < 0.001), and control vehicle (p < 0.001) arms. CCI treated Q4 is significantly different from CCI vehicle Q4 (p = 0.002), control treated Q4 (p = 0.013), and control vehicle Q4 (p = 0.006).
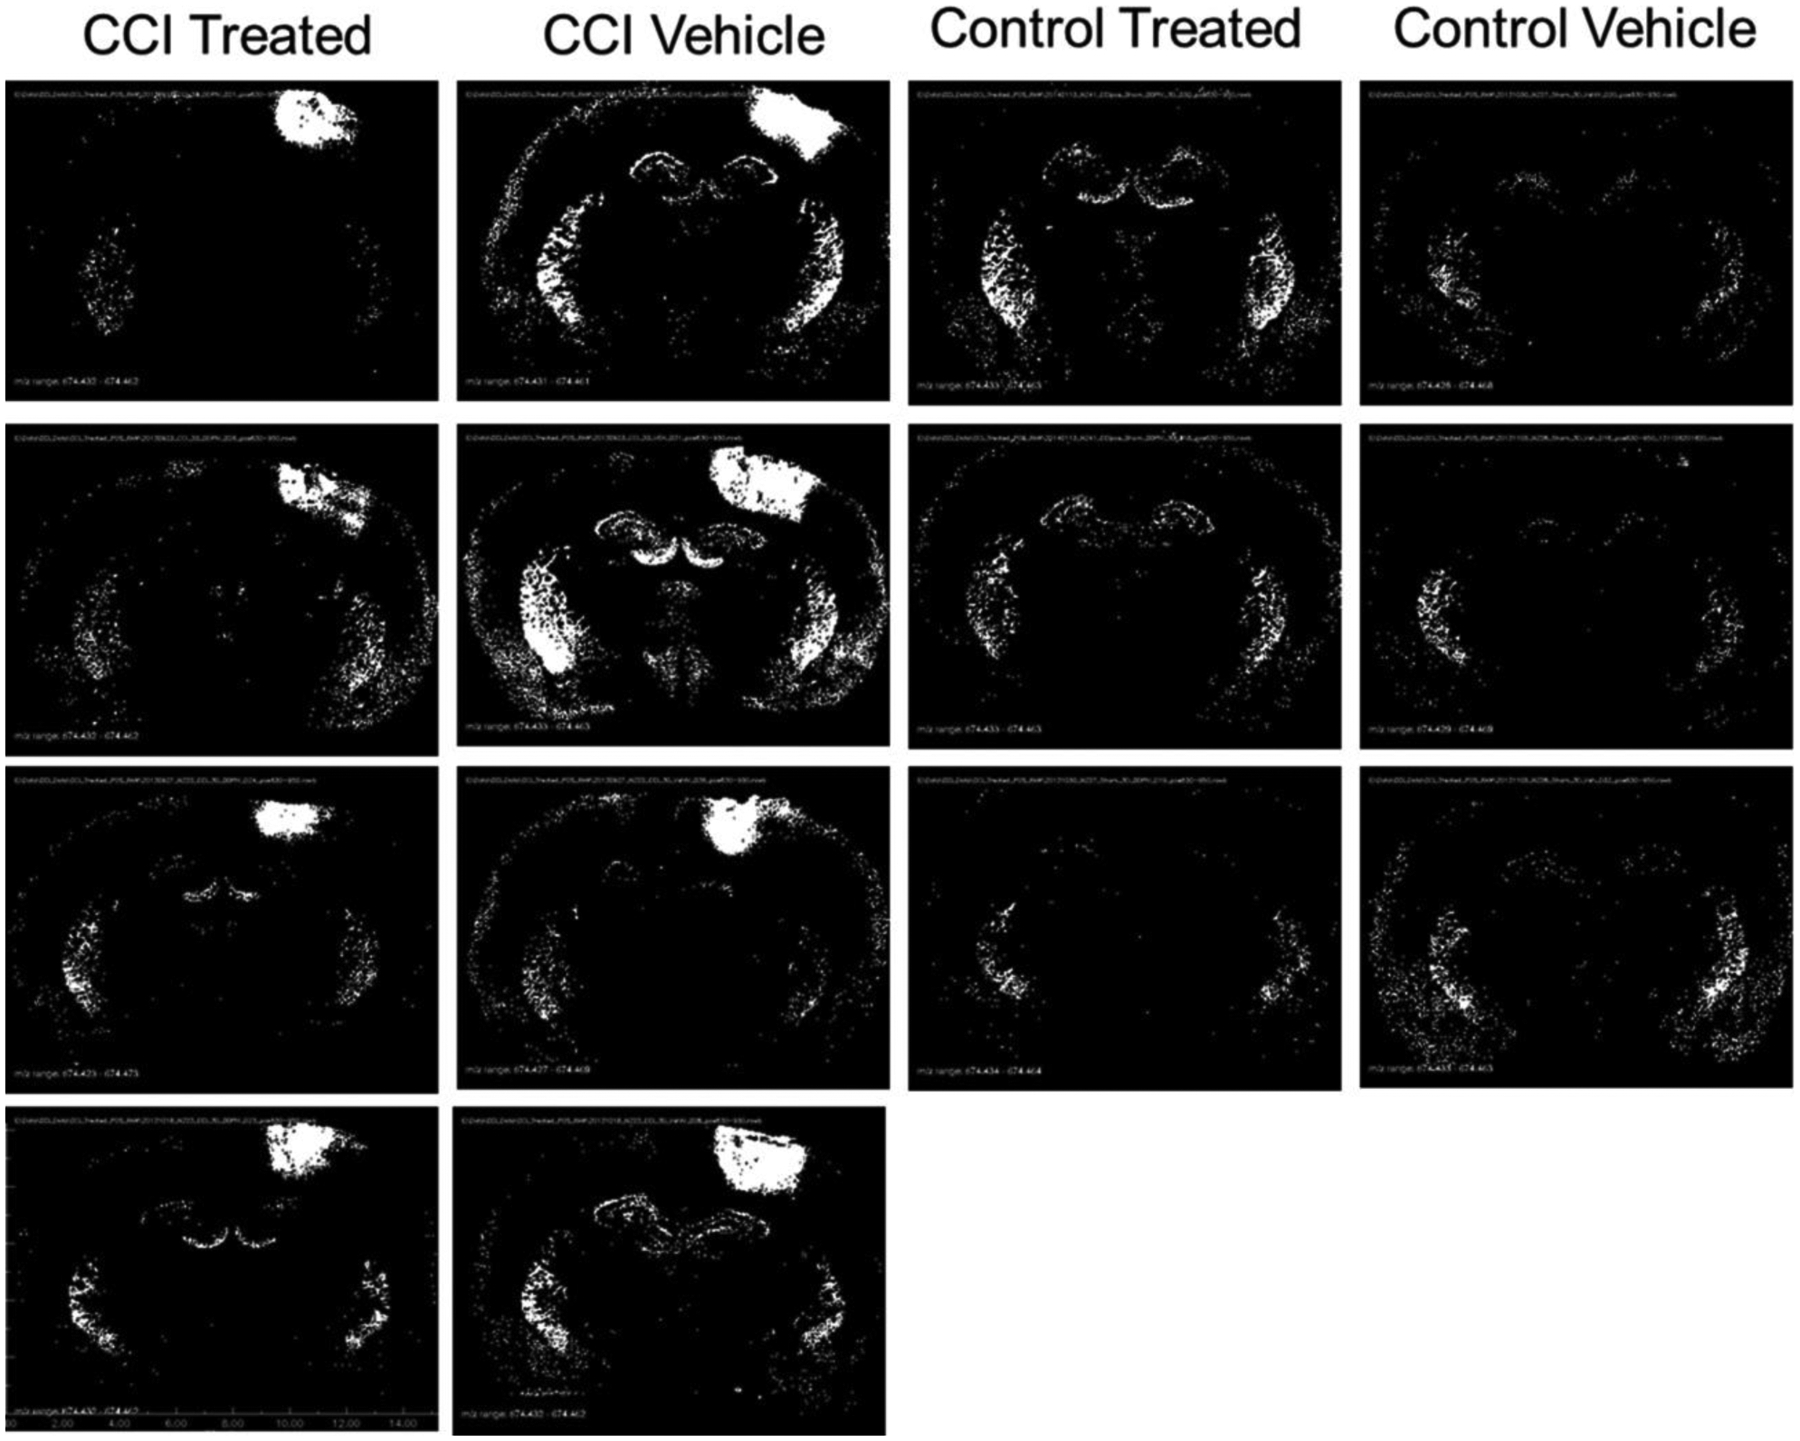
For CER 38:1 in the control groups, the suprathreshold (pixel peak area greater than 306 000 counts) sample sites were distributed evenly and diffusely in the neocortex (including cingulate cortex) and dorsal thalamus, with a lesser density in the hippocampal formation. The CCI sites showed a higher concentration of suprathreshold pixels. The average number of suprathreshold pixels in the damaged quadrant Q4 was elevated significantly in CCI vehicle group relative to the other groups (Tukey HSD tests, p = 7 × 10⁻⁶, p = 0, p = 3 × 10⁻⁷, respectively). Decoy peptide treatment produced a reduction in the distribution and total suprathreshold peak magnitude of CER 38:1 in the quadrant that received CCI (Figures 4 and 5). The number of suprathreshold pixels in CCI treated animals did not differ significantly from either control group, indicating that the decoy peptide eliminated CCI-related CER 38:1 upregulation. The total peak area data for pixels greater than threshold (Figure 4) was significantly greater in the CCI vehicle group than the two control injury groups (Tukey HSD tests, p = 0 for each comparison). The CCI-peptide treated group showed a significant reduction in the CER 38:1 total peak area in Q4 relative to the CCI vehicle group (p = 1 × 10⁻⁷) and did not differ significantly from either control treated Q4 or control vehicle Q4 group data. Effects of CCI and treatment were not significant in other quadrants.
Figure 4.
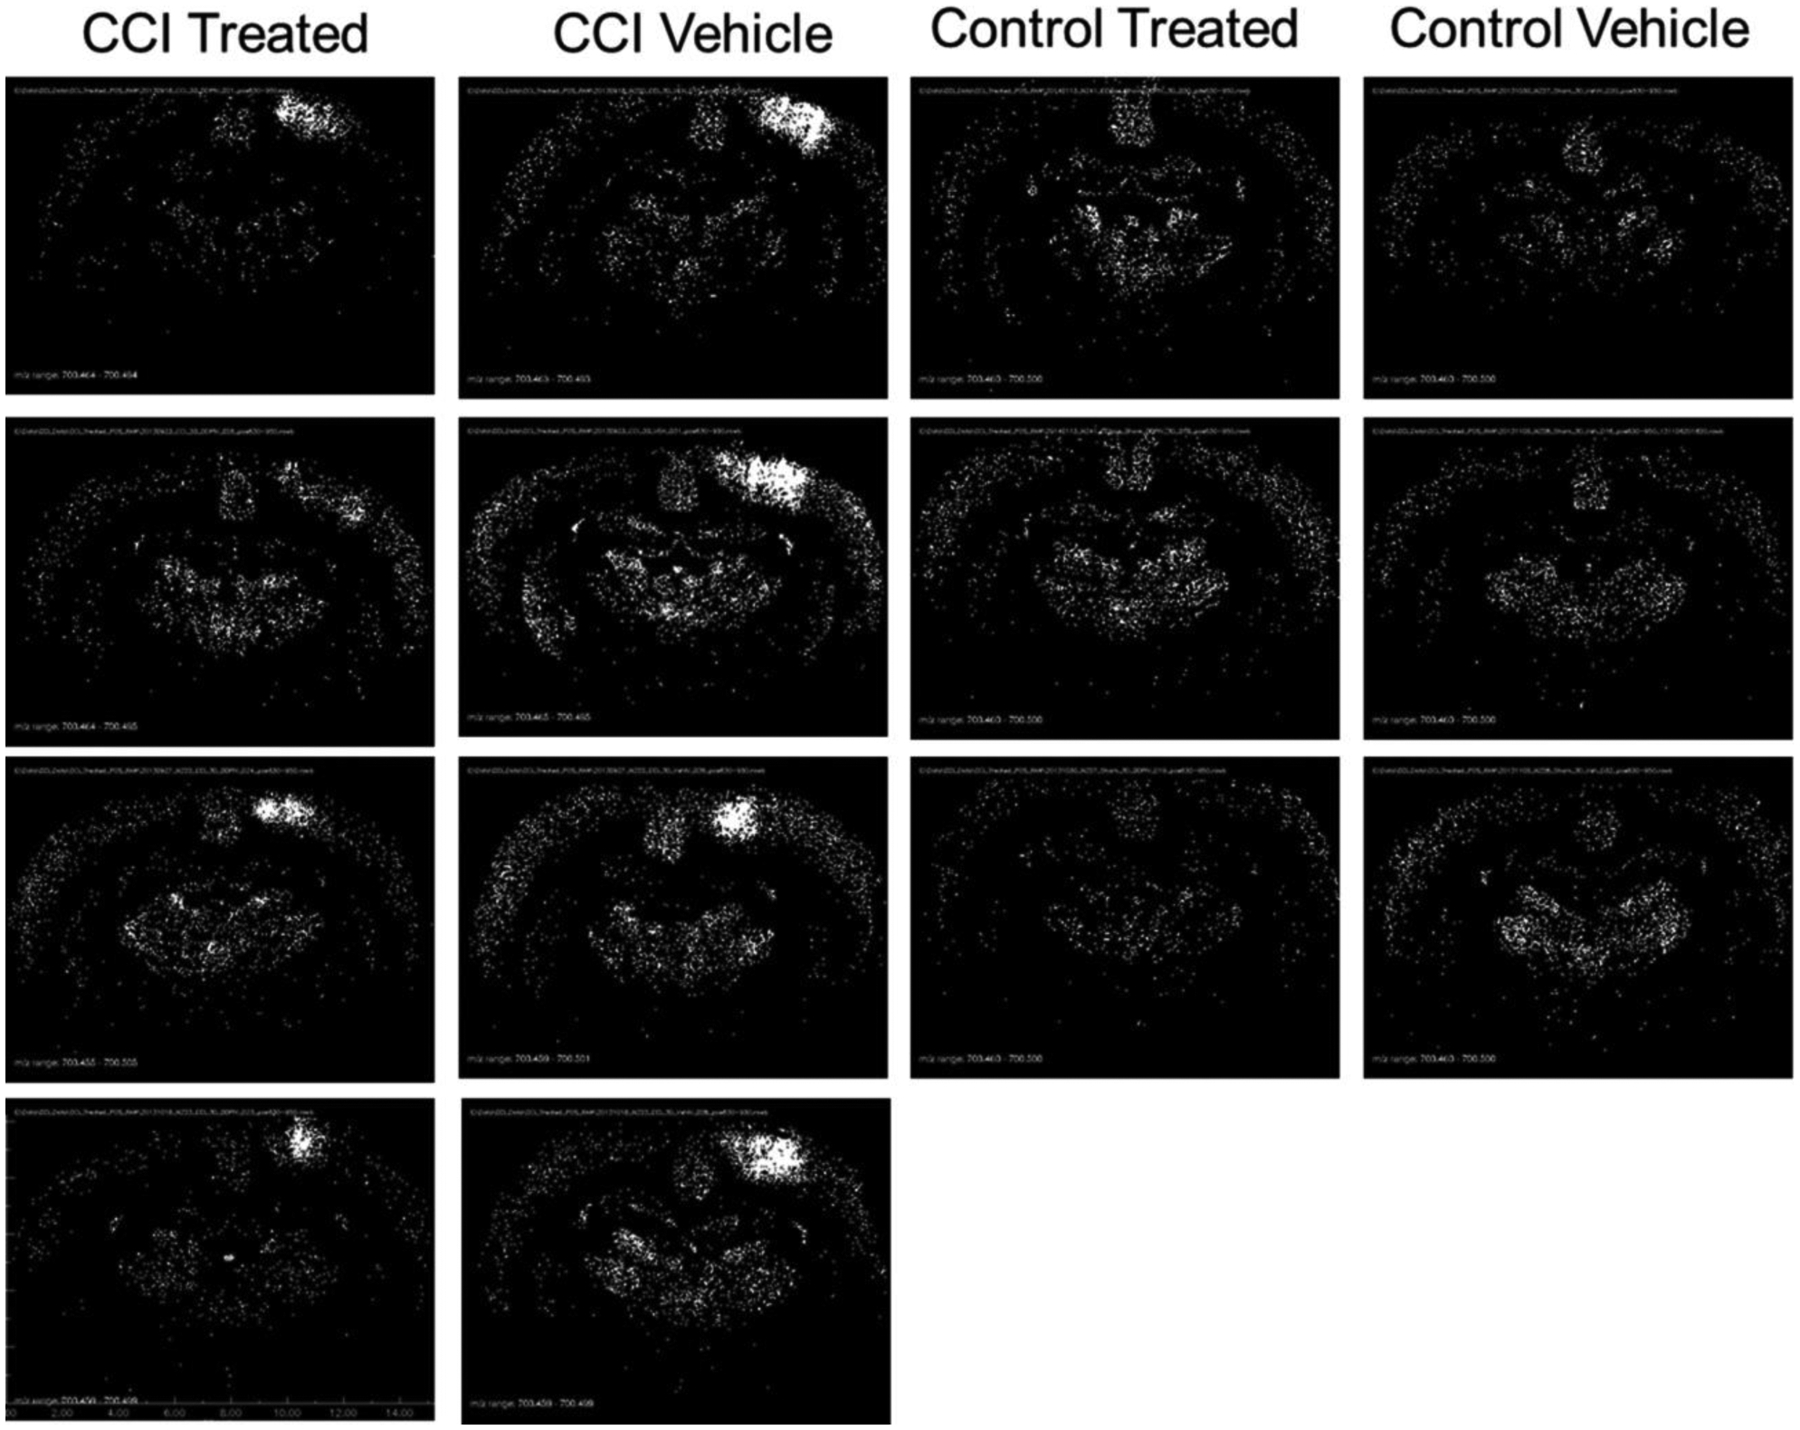
Distribution of CER 38:1 (m/z 700.4797) displayed as binary images of pixels exceeding peak area threshold. Black pixels represent peak area less than or equal to 306 000 counts, and white pixels represent peak areas greater than 306 000 counts.
Figure 5.
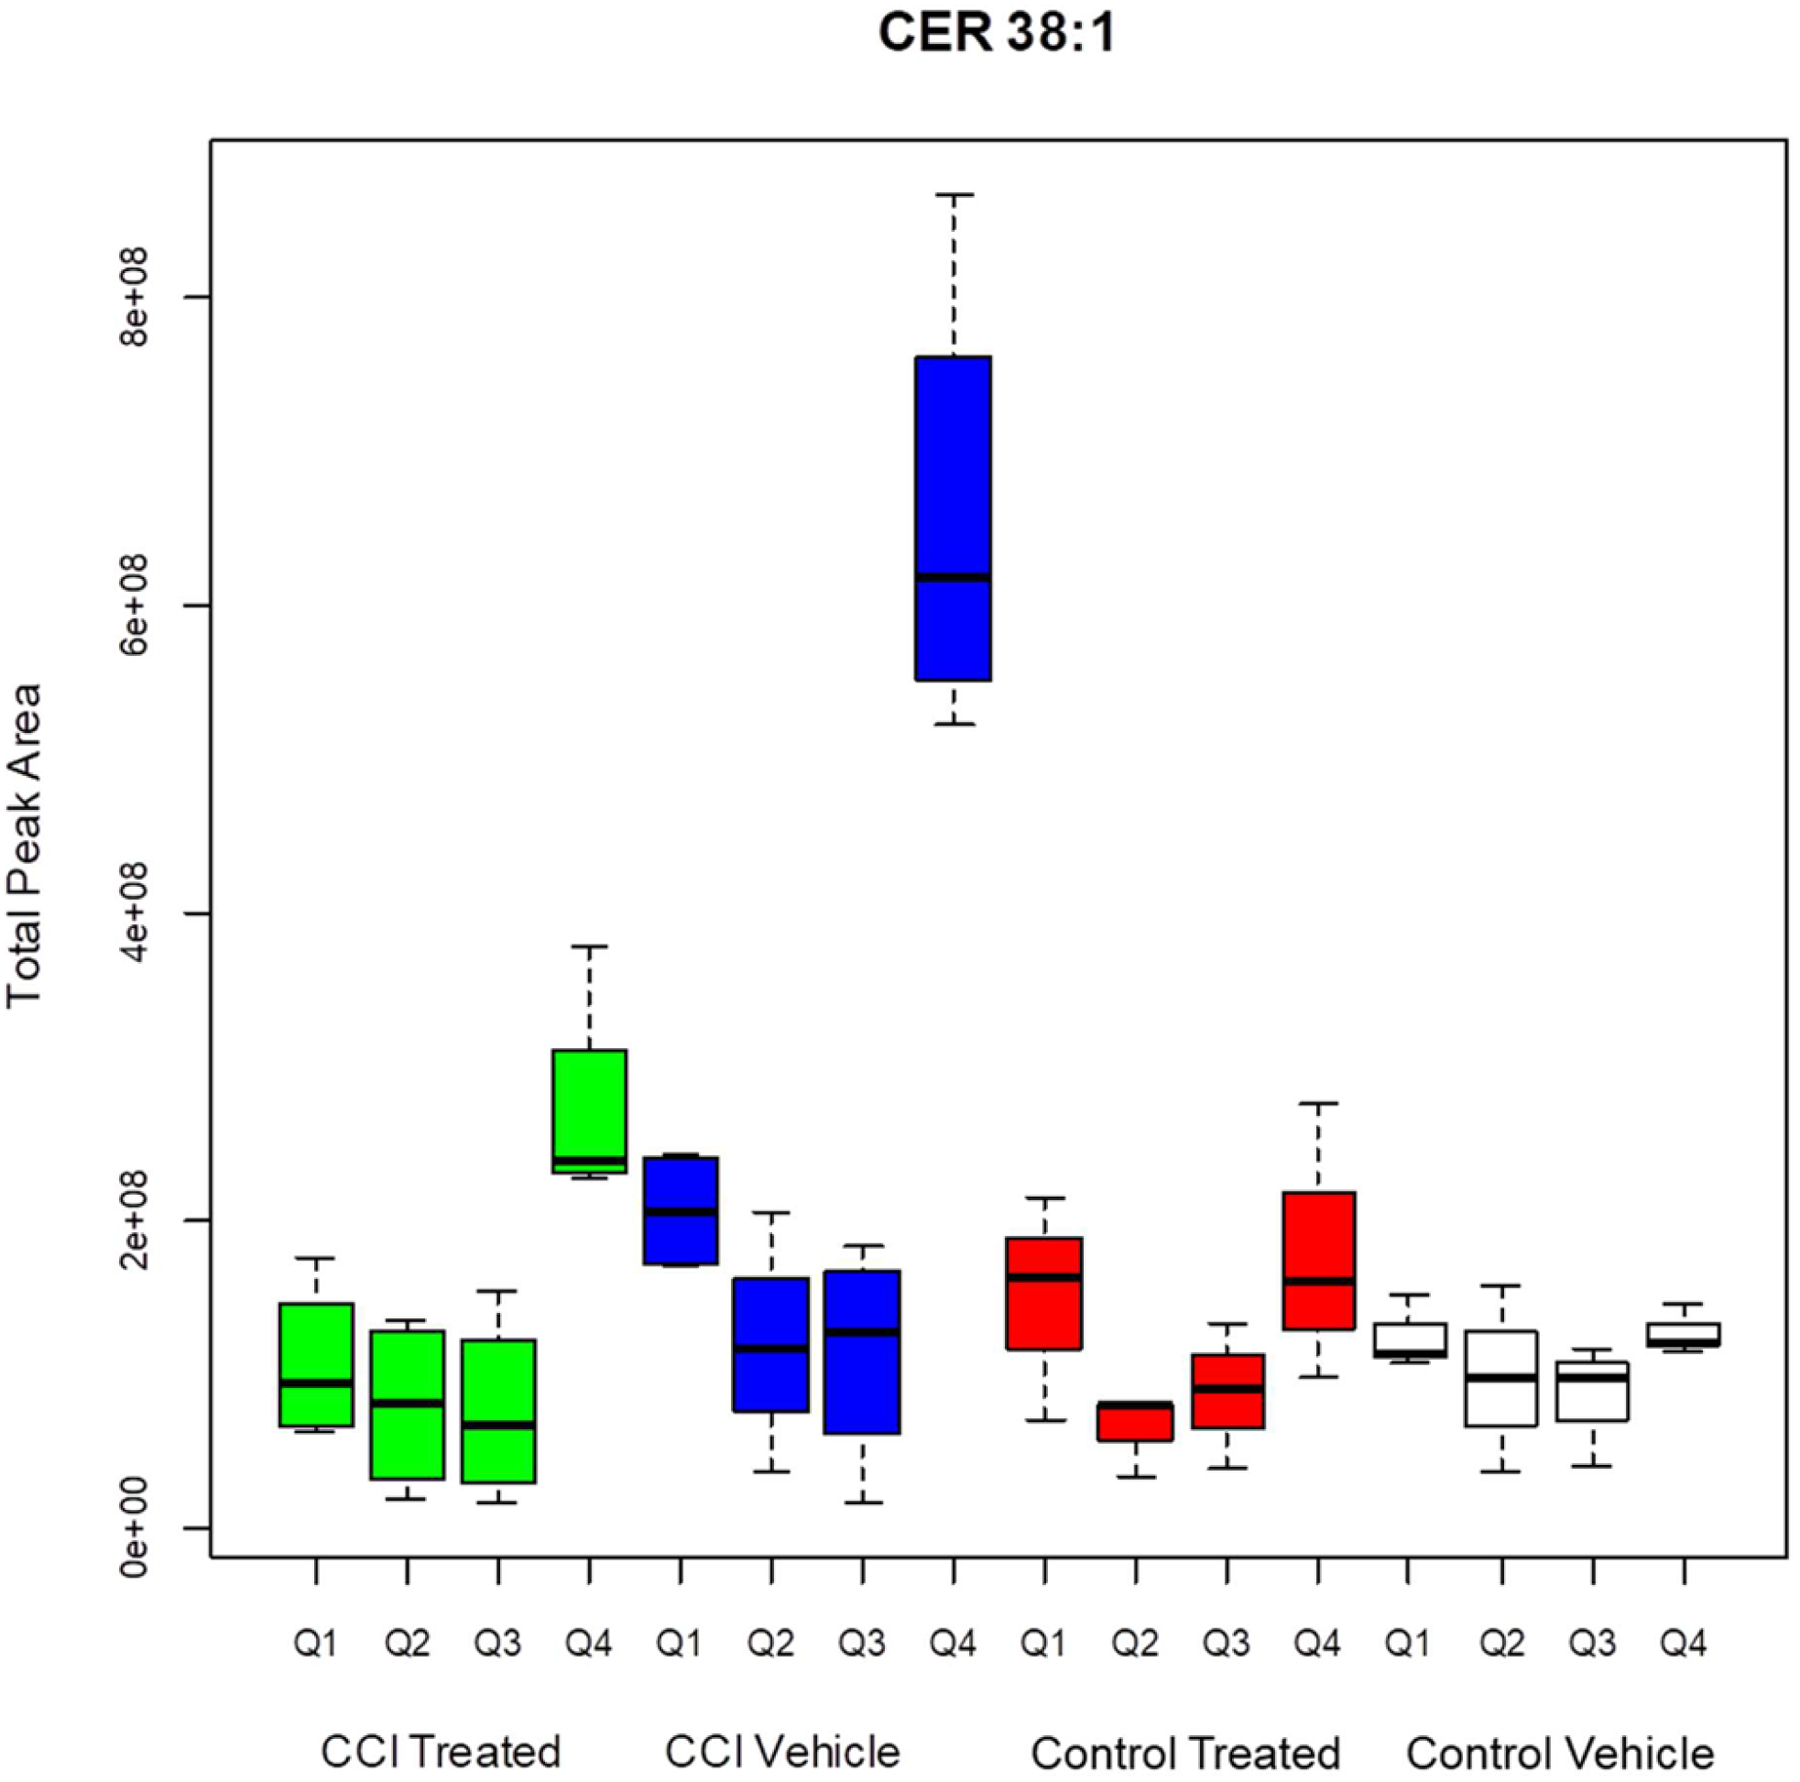
Total peak area for pixels greater than threshold for CER 38:1. CCI vehicle arm is significantly different than CCI treated (p < 0.001), control treated (p < 0.001), and control vehicle (p < 0.001) arms. CCI treated Q4 is significantly different from CCI vehicle Q4 (<0.001), control treated Q4 (p < 0.001), and control vehicle Q4 (p < 0.001).
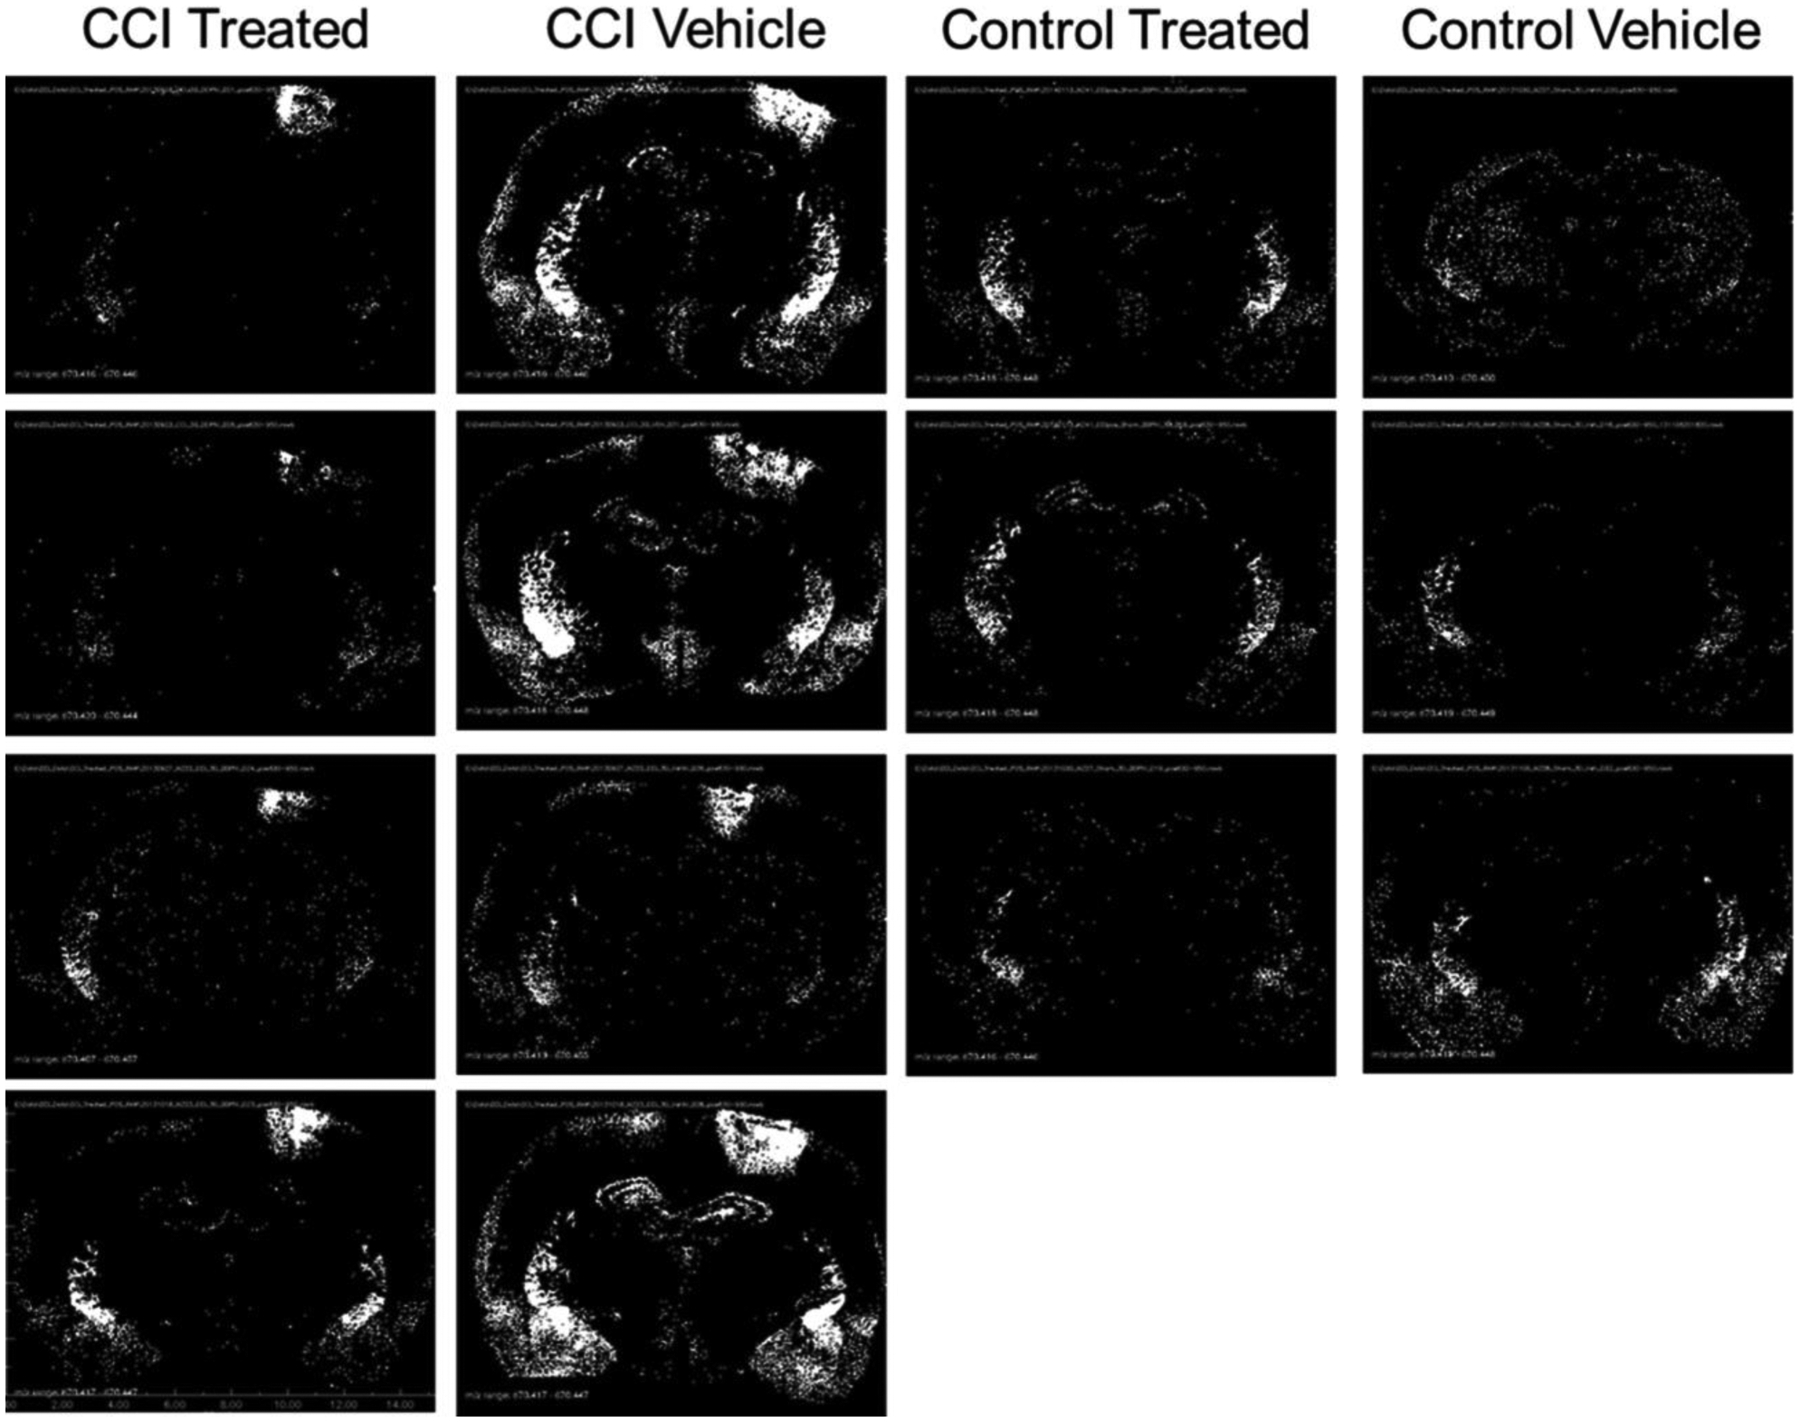
In the control animals, the samples with suprathreshold peaks for CER 36:1 were most concentrated in the caudate-putamen (Figure 6) and the piriform lobe (including amygdala), with a scattered distribution in the CA fields of the hippocampal formation. The CCI site showed a prominent increase in suprathreshold (pixel peak area greater than 1 220 000 counts) CER 36:1 sample sites relative to the control vehicle, control treated and CCI treated groups (Tukey HSD tests, p = 2 × 10⁻⁶ and p =7 × 10⁻⁶, respectively). The effect was partially attenuated by decoy peptide treatment; the CCI treated group had a greater number of suprathreshold pixels in quadrant 4 than either of the control groups (Tukey HSD tests, p = 0.02 and p = 0.06, respectively). The same pattern of effects was observed for the total peak area data for pixels greater than threshold near the CCI site (quadrant 4). The summary in Figure 7 shows the significantly higher values in the CCI vehicle group relative to the CCI treated, control treated, and control vehicle groups (Tukey HSD tests, p = 0.003, p = 0, and p = 0, respectively). CCI treated Q4 data were intermediate and were significantly greater than Q4 suprathreshold total peak values from either the control treated Q4 or the control vehicle groups (Tukey HSD tests, p = 0.013 and p = 0.006, respectively). A similar pattern was measured across groups in Q1 (contralateral to the CCI site). Tukey HSD tests showed that the number of suprathreshold pixels was elevated in the CCI vehicle group relative to the control vehicle and CCI treated groups (Tukey HSD, p < 0.05), with the control treated group in an intermediate position (not significantly different from any other group). Similarly, total peak area data for pixels greater than threshold was greater in the CCI vehicle group than the control vehicle group (Tukey HSD tests, p < 0.05), with the control treated and CCI treated groups in an intermediate position. Effects of CCI and treatment were not significant in other quadrants.
Figure 6.
Distribution of CER 36:1 (m/z 674.4481) displayed as binary images of pixels exceeding peak area threshold. Black pixels represent peak area less than or equal to 1 220 000 counts, and white pixels represent peak areas greater than 1 220 000 counts.
Figure 7.
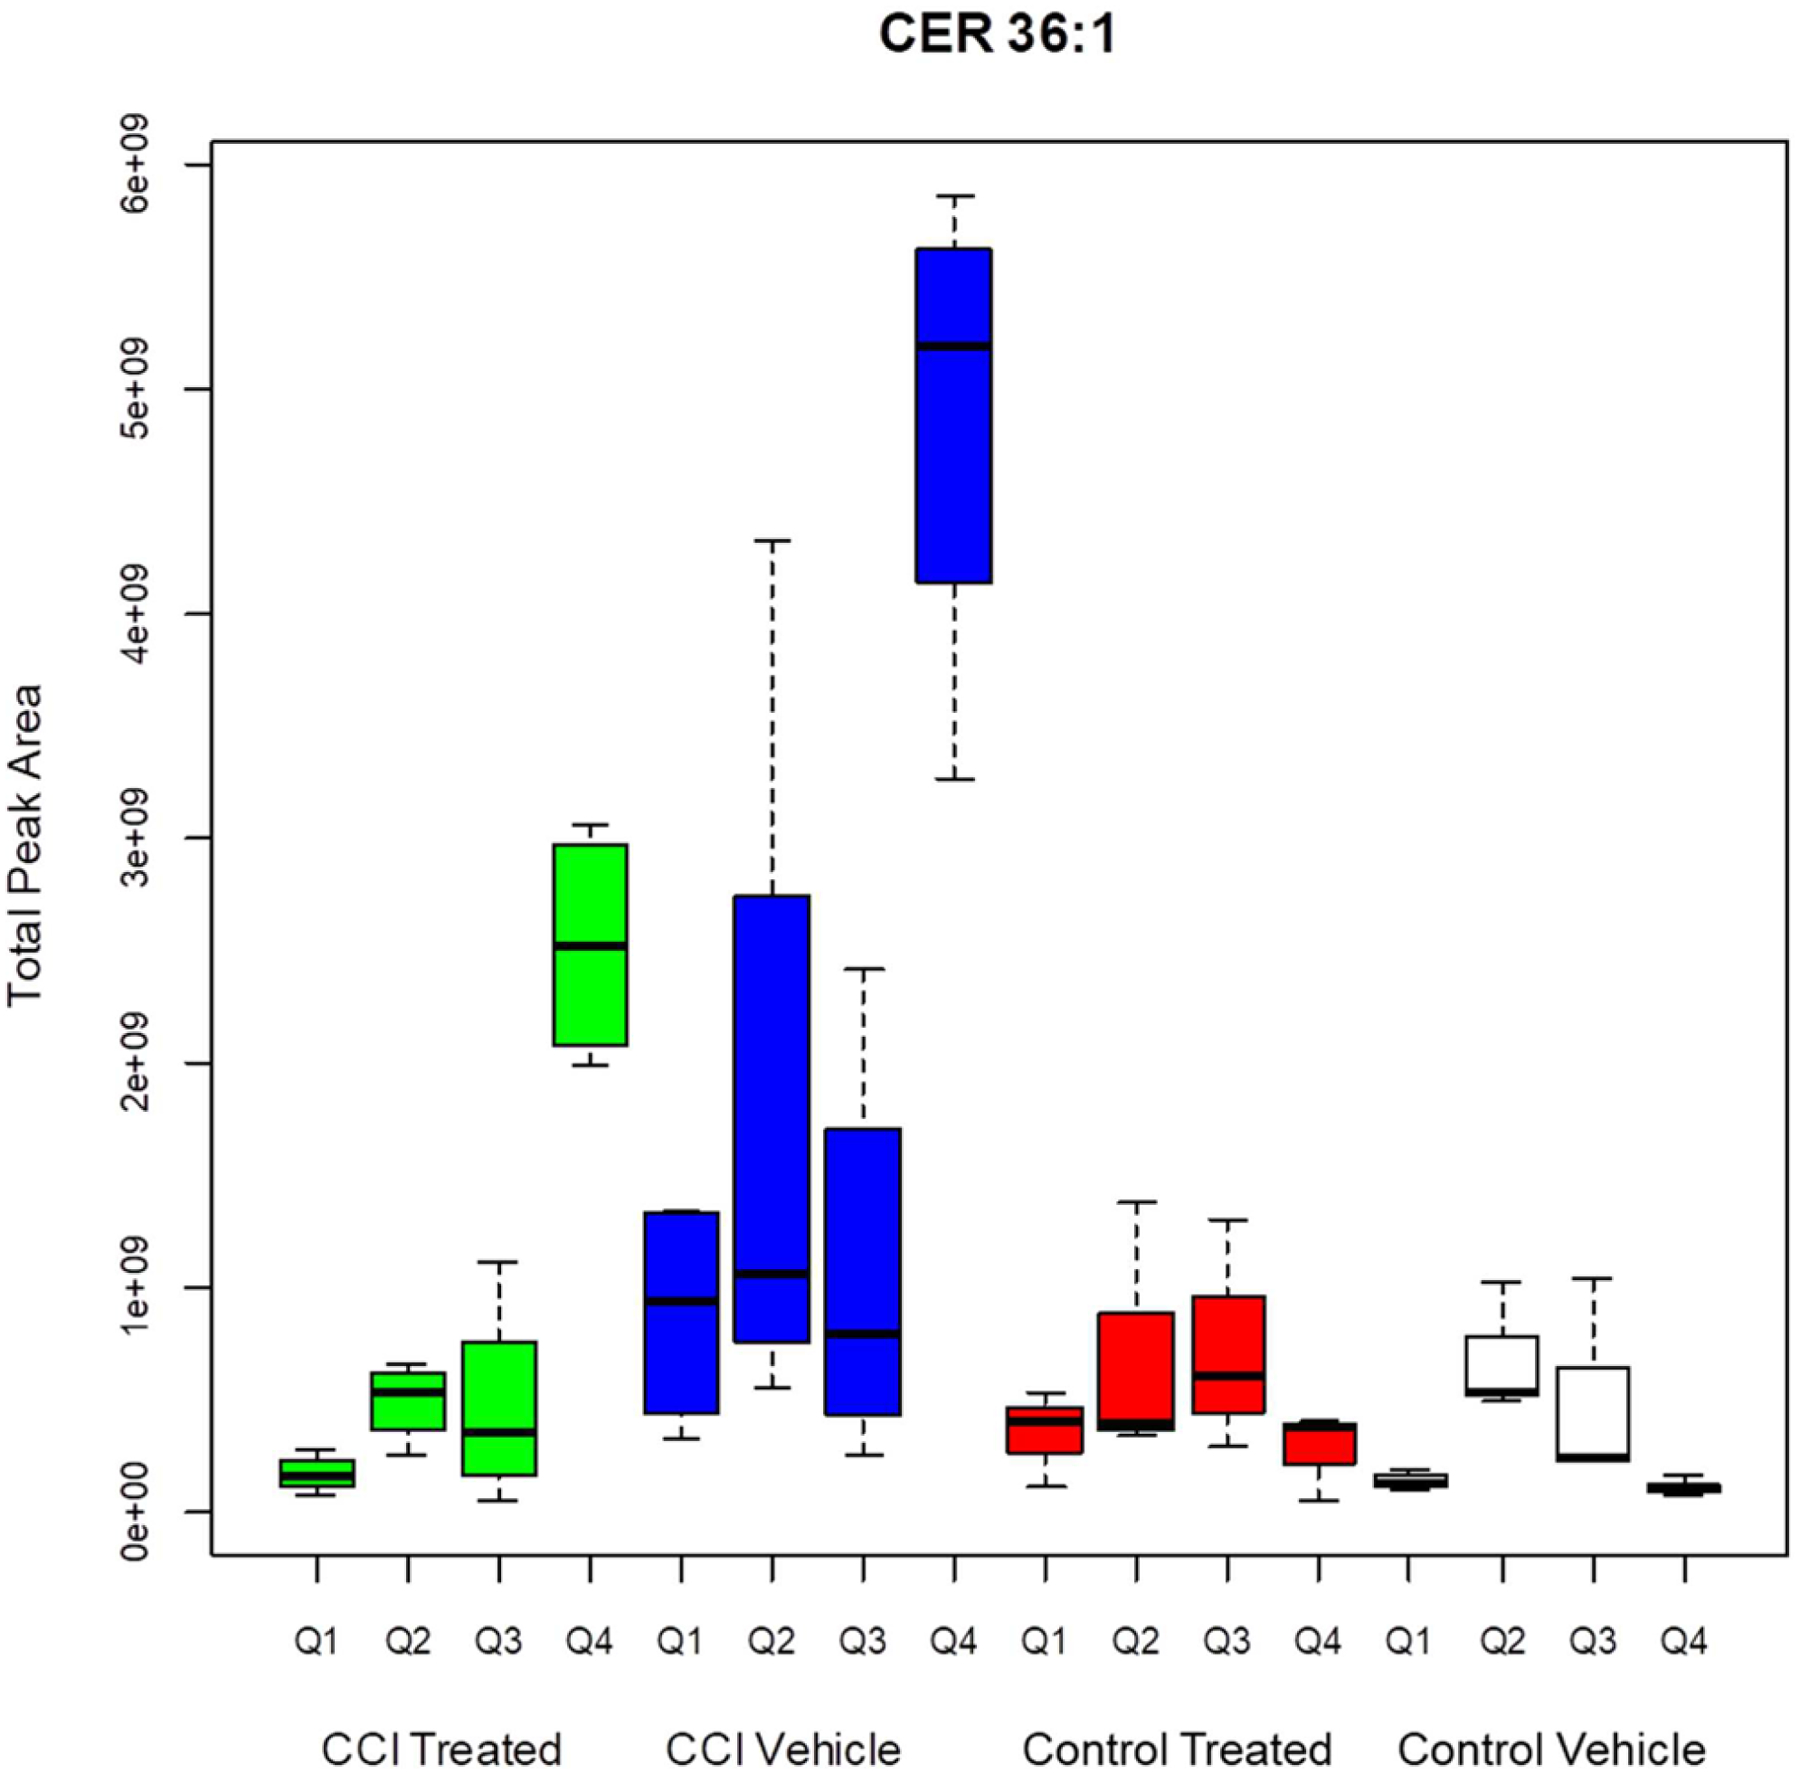
Total peak area for pixels greater than threshold for CER 36:1. CCI vehicle arm is significantly different than CCI treated (p < 0.001), control treated (p < 0.001), and control vehicle (p < 0.001) arms. CCI treated Q4 is significantly different from CCI vehicle Q4 (p = 0.002), control treated Q4 (p = 0.013), and control vehicle Q4 (p = 0.006).
The anatomical distribution of suprathreshold sample sites for CER 36:2, in the control vehicle group (Figure 8) was very similar to the pattern for CER 36:1 (Figure 6). The effects of CCI on the distribution of high expression pixels, though, extended to the caudate-putamen and piriform lobe (particularly perirhinal cortex and amygdala). For the quadrant including the CCI site (Q4), there was a highly significant increase in the number of suprathreshold pixels (pixel peak area greater than 345 000 counts) in the CCI vehicle group, relative to the control vehicle and control treated groups (Tukey HSD tests, p = 0.38, p = 0.025, p = 0.036). This increase was attenuated marginally by decoy peptide in the CCI treated group, which did not differ significantly from the other groups. The same results were observed for the than Q4 suprathreshold total peak values (Figure 9). The CCI-related increase in the striatum in Figure 8 was reflected in the analysis of data from quadrant 2, which is contralateral to the CCI site. The number of suprathreshold pixels in Q2 for CER 36:2 was elevated significantly in the CCI vehicle group relative to the control vehicle group and the CCI treated group (Tukey HSD test, p = 0.009 and p = 0.008, respectively) and marginally greater (Tukey HSD test, p = 0.019) from the control treated group. For the suprathreshold total peak values, though, the CCI vehicle groups had higher levels than all of the other groups (Tukey HSD test, p < 0.007, p = 0.017, and p = 0.009, respectively). Hence, the decoy peptide appears to attenuate CER upregulation after CCI, at both the primary damage site and a distant site.
Figure 8.
Distribution of CER 36:2 (m/z 670.4328) displayed as binary images of pixels exceeding peak area threshold. Black pixels represent peak area less than or equal to 345 000 counts, and white pixels represent peak areas greater than 345 000 counts.
Figure 9.
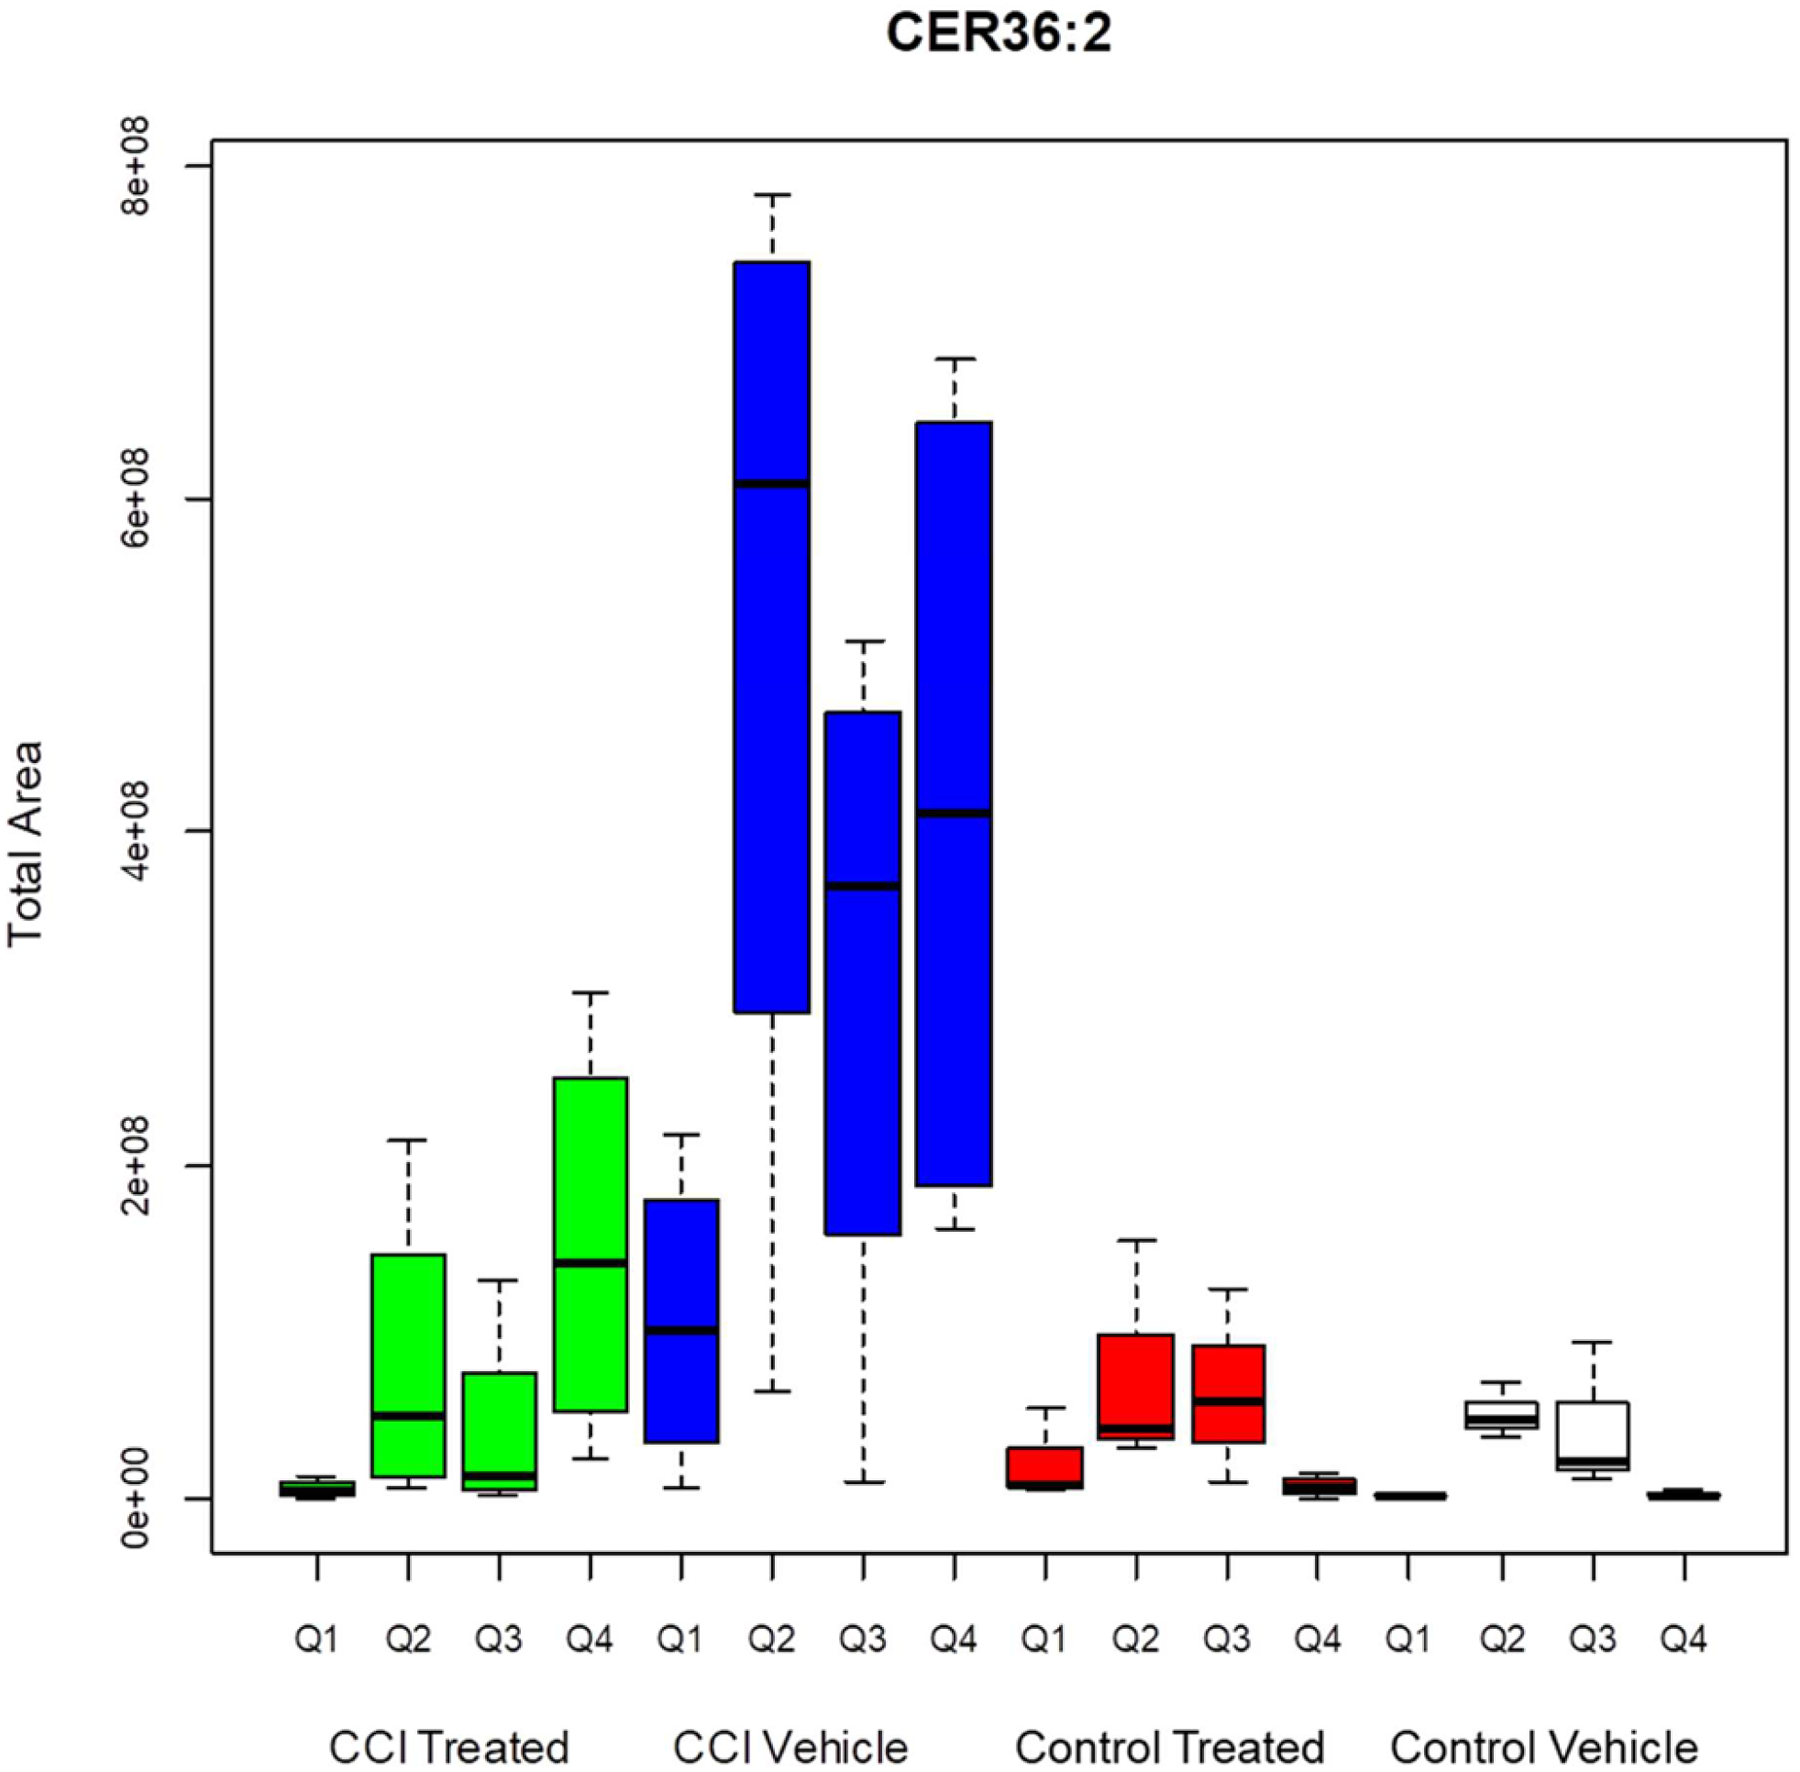
Total peak area for pixels greater than threshold for CER 36:2. CCI vehicle arm is significantly different than CCI treated (p < 0.001), control treated (p < 0.001), and control vehicle (p <0.001) arms. CCI vehicle Q2 is significantly different from CCI treated Q2 (p = 0.006), control treated Q2 (p = 0.025), and control vehicle Q2 (p = 0.025). CCI vehicle Q4 is significantly difference from control treated Q4 (p = 0.028) and control vehicle Q4 (p = 0.021). CCI vehicle Q4 is not statistically significant from CCI treated Q4 (p = 0.293).
Two significant effects were observed outside the primary CCI injury zone in Q4. First, CER 36:2 was elevated significantly in a contralateral region that includes the caudate-putamen, perirhinal cortex and amygdala. Second, CER 36:1 was elevated significantly in a region that included the contralateral hippocampus and overlying cerebral cortex. It is possible that these findings are a direct effect of the CCI procedure. Given that the angle of incidence of CCI is perpendicular with respect to the line between the ear bars in the stereotaxic frame, it is anticipated that any mechanical factor involved in the remote elevation would appear on the ipsilateral as well as the contralateral side. There is no possibility that the angle of impact could have pointed toward the contralateral lower forebrain since the direction of impact was always toward the ipsilateral lower forebrain. This does not eliminate the possibility that there was a contra-coup effect on the contralateral side, but it is not clear how such a contralateral effect could occur for purely mechanical reasons. If the changes in CER expression were the result of mechanical impact in this brain region, we would have also expected changes to the cortical areas wrapping around the site of increased expression, not merely changes in this internal region.
Although Roux et al. reported that CER, DAG, CE, SM, and PC species are altered at a 7-day time period after CCI at the sites of injury, we have found that only ceramides were statistically significant markers of a treatment effect at a single time point of 3 days post injury in other regions of brain sections. The DAG, CE, SM, and PC species were found to be significantly elevated in Figure 6. Distribution of CER 36:1 (m/z 674.4481) displayed as binary images of pixels exceeding peak area threshold. Black pixels represent peak area less than or equal to 1 220 000 counts, and white pixels represent peak areas greater than 1 220 000 counts. CCI groups (see Supporting Information Figures S1–S6) compared to control groups but only at the location of injury (Q4). These species were not elevated in the remaining quadrants of any group and thus would only be markers of the site of injury. It is certainly possible that DAG, CE, SM, and PC species could be therapeutic markers at different time points, but this study was limited to the day 3 time point and therefore no further inference to the role of these species as treatment markers could be assessed. With regard to DAG species specifically, it has been reported that DAG species abundance can change significantly within minutes postmortem.45 Therefore, sample processing timing would need to be carefully monitored to potentially use DAG as biomarkers.
The dynorphin binding decoy peptide affects regulation of four CER species that have different tissue distributions. CER 34:1 is prevalent in blood; hence, its association with the choroid plexus and the CCI primary injury site. CER 36:2, 36:1, and 38:1 are all associated with areas containing concentrations of neuronal cell bodies (gray matter) in the brain. Hence, the findings suggest that the dynorphin binding decoy peptide affects upregulation of cellular CER species across cell types. A single dose of the decoy peptide significantly attenuated CCI-induced upregulation of four different CER ion species, both at the site of injury and at distant sites. Effects of both CCI and peptide treatment were documented for CER 36:1 in the contralateral dorsal quadrant (cortex plus hippocampus) and for CER 36:2 in the contralateral caudate-putamen, perirhinal cortex and amygdala. Dynorphin is distributed widely in the central nervous system46–48 and is thought to be a mediator of components of stress responses.49 Hence, changes in dynorphin after TBI38,50 may have a role in regulating local CER levels as part of remodeling and plasticity processes in response to brain injury and accompanying stressors.
In summary, the distribution of high levels of CER species varied with chain length and degree of saturation. The CCI exposure resulted in changes in the distribution of desorption samples with high levels of CER expression in both the injury site and sites with baseline high CER levels. The spatial distributions of CCI-induced high levels of each CER also were attenuated by decoy peptide treatment. These results show that the effects of a treatment on CER levels can be assessed by AgNP-matrix assisted MSI at the level of each 50 μm diameter laser desorption sampling domain, then reassembled in the context of an image of the tissue. This approach provides an objective method for assessing lipid biomarkers during pathologic processes and responses to interventions in both cellular and tissue contexts.
METHODS
A CCI injury model51 in adult male rats was used to evaluate the effects of NMDA-NR1 decoy peptide treatment on changes in ceramides resulting from TBI. MSI with AgNPs was used to locate, analyze, and study changes in brain lipid composition at a single time point 3 days post CCI.
Animals
All procedures were performed under protocols PHA-09-724, PHA-10-746, and PHA-13-746 approved by the Uniformed Services University Animal Care and Use Committee. Adult male Sprague–Dawley rats weighing 225–250 g at the start of the study were kept in a 12/12 h light/dark cycle with access to food and water ad libitum. The study contained four arms: (1) control vehicle (n = 3 rats), (2) control treated (n = 3 rats), (3) CCI vehicle (n = 4 rats), and (4) CCI treated (n = 4 rats).
Peptide
Peptide with the amino acid sequence KVNSEEEEEDA (amino acids 590–600 of the NR1 subunit of the NMDA receptor) was synthesized by the Sequencing and Synthesis Laboratory at the Johns Hopkins School of Medicine. The peptide was dissolved in water at a concentration of 10 mmol per liter.
Intravenous Administration
Peptide or saline vehicle was administered to the rats via intravenous cannula at 30 min post CCI or control injury. A polyethylene catheter (PE 50, ID 0.58 mm) was placed into the left jugular vein toward the heart while the animal was under isoflurane anesthesia (2–3% isoflurane, administered via a nose cone). The vein was isolated, the cerebral end closed with a suture, and the cannula, filled with heparinized saline (10 U/mL), inserted into the vein and advanced about 1.5 cm toward the heart and tied in place. The CCI injury (see below) was applied immediately after jugular vein cannula placement. Thirty minutes later, with the rat still under isoflurane anesthesia, 25 μL of DP (containing 250 nmol) in water was administered via the left jugular vein cannula over a period of 2 min, and the cannula flushed with 50 μL saline. Five minutes later, the cannula was removed, and the central end of the jugular vein tied off to prevent bleeding. Vehicle control animals received 25 μL of water administered over 2 min in place of the peptide solution. The skin incisions over the skull and jugular vein were then closed and isoflurane anesthesia discontinued. The rats were allowed to recover righting reflexes before being returned to their home cages. Thereafter the drinking water in the cages of the rats subjected to CCI injury contained acetaminophen (6 mg/mL) in a sweetened solution to provide relief of possible postsurgical pain.52 The rats recovered rapidly and showed normal behaviors within about 2 h of recovery from anesthesia.
Controlled Cortical Impact, Tissue Implantation, and Imaging
The CCI method uses a rigid impactor to deliver mechanical energy to intact dura, exposed following a craniotomy51 in rats anesthetized with isoflurane. The impact was centered 2.04 mm posterior to bregma and 3.0 mm left of the midline (Figure 1) [–2.04 mm, Figure 50 in Paxinos and Watson rat brain atlas53]. The impactor had a 3 mm diameter flat tip, and the parameters used for the impact were a depth of 2.0 mm, a velocity of 5 m/s, and a latency of 2 ms. Control animals received no cortical impact strike, but otherwise received the same treatment as the CCI animals, including a craniotomy under isoflurane anesthesia. The animals were euthanized 3 days post injury. Under ketamine/xylazine (100 mg/kg; 10 mg/kg) anesthesia, the chest of each rat was opened and the head perfused through a catheter placed in the ascending aorta with 50–100 mL of phosphate buffered saline at room temperature, allowing blood to flush from the head through an opening in the superior vena cava. When the perfusate was largely clear of blood, the skull was carefully opened, and the brain dissected. After removing meninges, each brain was rapidly frozen in a small beaker containing 30 mL of isopentane precooled by immersion of the beaker in dry ice, then removed, wrapped individually in aluminum foil, and stored at −80 °C until sectioned. Coronal 18 μm thick sections through the area of the injury were cut using a cryostat (Leica Microsystems CM3050S, Bannockburn, IL). The specific location of individual sections was identified by comparisons of the morphology of major structures in relation to the Paxinos and Watson rat brain atlas.53
Tissue sections were implanted with silver nanoparticles (AgNP) 6 nm in diameter, using a nanoparticle implanter (Ionwerks, Houston, TX). A Thermo Scientific MALDI LTQ-XL-Orbitrap (Thermo Fisher Scientific, San Jose, CA) and Xcalibur software were used for MALDI mass spectrometry imaging data acquisition. MS images of coronal sections near the level of bregma −2.04 mm were collected in positive and negative ion mode. The mass resolution was set to 60 000, and the mass range was set to 630–950 Da. The sample stage raster step size was 50 μm for both the X and Y axes. Lipid identifications were completed in separate studies.40,54
Data Processing and Statistical Analysis
The m/z values for intact ceramide (CER) 34:1, 36:2, 36:1, and 38:1 [M + Ag]+ were used to extract the integrated area of the peak for each m/z value per pixel of each image if a peak was detected within ± 0.003 Da (Imagewerks, Ionwerks, Inc., Houston, TX) to produce mass images (see Supporting Information Figures S7–S10). The peak area per pixel was then exported for each CER mass image for statistical processing. In the case of CER 36:1 and 36:2 where isotopic envelopes overlap, the [M +107Ag]+ peak was used for CER 36:2 whereas the [M + 109Ag]+ peak was used for CER 36:1 to avoid any possible interference between components. The relative abundance of 107Ag and 109Ag isotopes is 51.8 and 48.2, respectively. The relative abundance of each isotope was not taken into consideration for peak areas because no comparison of peak areas is done between CERs. However, the similar relative abundance of isotopes eliminated any limitation on sensitivity for the CERs such that using either isotope is just as effective for performing calculations.
An empirical cumulative distribution function of peak area for each m/z identified in the control vehicle arm of the study was calculated in R55 and used to establish a control threshold for each m/z value. A conservative threshold value for peak area per pixel where Fn(x) = 0.995 was obtained for each m/z value (see Supporting Information Figure S11). For example, the peak area threshold value for CER 36:1 (m/z 674.4481) was calculated to be 1 220 000 counts. The threshold value for each m/z was then used to set the intensity scale for a binary image of each section to visualize the location of pixels of greater peak area. The total number of pixels above threshold (0.5th percentile of pooled control vehicle sections) was calculated for each quadrant as a measure of the spatial distribution of CER upregulation. The peak area for each pixel greater than threshold was summed to obtain a total peak area, and was calculated as a metric of the magnitude of expression changes (see Supporting Information Table S1). Analysis of variance (ANOVA) calculations were performed to test the effects of location (within subject factor: quadrant) and treatment (between subjects factors: CCI and decoy peptide treatment). Tukey HSD tests were used for post hoc comparisons.
Supplementary Material
ACKNOWLEDGMENTS
The authors thank Gregory Bull for his technical support.
Funding
This work was supported in part by grants from Department of Defense, Center for Neuroscience and Regenerative Medicine(CNRM), Rockville, MD and the Intramural Research Program of the National Institute on Drug Abuse, NIH. Ionwerks gratefully acknowledges support of this work through NIH SBIR Phase II Grants R44DA030853-03 5R44DA036263-03. Notes: The opinions and assertions contained herein are the private opinions of the authors and are not to be construed as official or reflecting the views of the Uniformed Services University, the Department of Defense, the National Institutes of Health, the National Institute on Drug Abuse, the Department of Health and Social Services or the Government of the United States. The authors declare no competing financial interest.
ABBREVIATIONS
- TBI
traumatic brain injury
- MSI
mass spectrometric imaging or mass spectrometry imaging
- CCI
controlled cortical impact
- NMDA
N-methyl-D-aspartate
- CNS
central nervous system
- AgNP
silver nanoparticles
- CER
ceramide
- HSD
honest significant differences
- kg
kilogram
- g
gram
- mg
milligram
- mL
milliliter
- mm
millimeter
- μm
micrometer
- °C
Celsius
- Da
Dalton
REFERENCES
- (1).MacFarlane MP, and Glenn TC (2015) Neurochemical cascade of concussion. Brain Inj. 29, 139–153. [DOI] [PubMed] [Google Scholar]
- (2).Ray SK, Dixon CE, and Banik NL (2002) Molecular mechanisms in the pathogenesis of traumatic brain injury. Histol. Histopathol 17, 1137–1152. [DOI] [PubMed] [Google Scholar]
- (3).McIntosh TK (1993) Novel pharmacologic therapies in the treatment of experimental traumatic brain injury: a review. J. Neurotrauma 10, 215–261. [DOI] [PubMed] [Google Scholar]
- (4).Kulkarni M, and Armstead WM (2002) Relationship between NOC/oFQ, dynorphin, and COX-2 activation in impaired NMDA cerebro vasodilation after brain injury. J. Neurotrauma 19, 965–973. [DOI] [PubMed] [Google Scholar]
- (5).Armstead WM, Kiessling JW, Riley J, Cines DB, and Higazi AA (2011) tPA contributes to impaired NMDA cerebro vasodilation after traumatic brain injury through activation of JNK MAPK. Neurol. Res 33, 726–733. [DOI] [PMC free article] [PubMed] [Google Scholar]
- (6).Baethmann a, Maier-Hauff K, Schürer L, Lange M, Guggenbichler C, Vogt W, Jacob K, and Kempski O(1989) Release of glutamate and of free fatty acids in vasogenic brain edema. J. Neurosurg 70, 578–91. [DOI] [PubMed] [Google Scholar]
- (7).Strauss KI, Barbe MF, Marshall RM, Raghupathi R, Mehta S, and Narayan RK (2000) Prolonged cyclooxygenase-2 induction in neurons and glia following traumatic brain injury in the rat. J.Neurotrauma 17, 695–711. [DOI] [PMC free article] [PubMed] [Google Scholar]
- (8).Hererra-Marschitz M, You B, Goiny M, Meana JJ, Silveira R, Godukhin V, Pettersson E, Loidi F, Lubec G, Andersson K, and Ungerstedt U (1996) On the Origin of Extracellular Glutamate Levels Monitored in the Basal Ganglia of the Rat by In Vivo Microdialysis. J. Neurochem 66, 1726–1735. [DOI] [PubMed] [Google Scholar]
- (9).Başkaya MK, Doğan a, Temiz C, and Dempsey RJ (2000) Application of 2,3,5 triphenyltetrazolium chloride staining to evaluate injury volume after controlled cortical impact brain injury: role of brain edema in evolution of injury volume. J. Neurotrauma 17, 93–99. [DOI] [PubMed] [Google Scholar]
- (10).Kubota M, Narita K, Nakagomi T, Tamura A, Shimasaki H, Ueta N, and Yoshida S (1996) Sphingomyelin changes in rat cerebral cortex during focal ischemia. Neurol. Res 18, 337–41. [DOI] [PubMed] [Google Scholar]
- (11).Faden AI (1992) Dynorphin increases extracellular levels of excitatory amino acids in the brain through a non-opioid mechanism. J.Neurosci 12, 425–429. [DOI] [PMC free article] [PubMed] [Google Scholar]
- (12).Yatsu FM, and Moss SA (1971) Brain Lipid Changes Following Hypoxia. Stroke 2, 587–593. [DOI] [PubMed] [Google Scholar]
- (13).Schuhmann MU, Stiller D, Skardelly M, Bernarding J, Klinge PM, Samii A, Samii M, and Brinker T (2003) Metabolic Changes in the Vicinity of Brain Contusions: A Proton Magnetic Resonance Spectroscopy and Histology Study. J. Neurotrauma 20, 725–743. [DOI] [PubMed] [Google Scholar]
- (14).Gatson JW, Barillas J, Hynan LS, Diaz-Arrastia R, Wolf SE, and Minei JP (2014) Detection of neurofilament-H in serum as a diagnostic tool to predict injury severity in patients who have suffered mild traumatic brain injury. J. Neurosurg 121, 1232–1238. [DOI] [PubMed] [Google Scholar]
- (15).Tulley JM, Palmer JL, Gamelli RL, and Faunce DE (2008) PREVENTION OF INJURY-INDUCED SUPPRESSION OF T-CELL IMMUNITY BY THE Cd1d/NKT CELL-SPECIFIC LIGAND α-GALACTOSYLCERAMIDE. Shock 29, 269–277. [DOI] [PubMed] [Google Scholar]
- (16).Koetzner L (2004) Nonopioid Actions of Intrathecal Dynorphin Evoke Spinal Excitatory Amino Acid and Prostaglandin E2 Release Mediated by Cyclooxygenase-1 and -2. J. Neurosci 24, 1451–1458. [DOI] [PMC free article] [PubMed] [Google Scholar]
- (17).Whitehead SN, Chan KHN, Gangaraju S, Slinn J, Li J, and Hou ST (2011) Imaging mass spectrometry detection of gangliosides species in the mouse brain following transient focal cerebral ischemia and long-term recovery. PLoS One 6, e20808. [DOI] [PMC free article] [PubMed] [Google Scholar]
- (18).Sparaco M, Gaeta LM, Tozzi G, Bertini E, Pastore A, Simonati A, Santorelli FM, and Piemonte F (2006) Protein glutathionylation in human central nervous system: Potential role in redox regulation of neuronal defense against free radicals. J. Neurosci. Res 83, 256–263. [DOI] [PubMed] [Google Scholar]
- (19).McIntosh TK, Head VA, and Faden AI (1987) Alterations in regional concentrations of endogenous opioids following traumatic brain injury in the cat. Brain Res. 425, 225–233. [DOI] [PubMed] [Google Scholar]
- (20).Hannun YA, and Obeid LM (2002) The ceramide-centric universe of lipid-mediated cell regulation: Stress encounters of the lipid kind. J. Biol. Chem 277, 25847–25850. [DOI] [PubMed] [Google Scholar]
- (21).Scarlatti F, Bauvy C, Ventruti A, Sala G, Cluzeaud F, Vandewalle A, Ghidoni R, and Codogno P (2004) Ceramidemediated Macroautophagy Involves Inhibition of Protein Kinase B and Up-regulation of Beclin 1. J. Biol. Chem 279, 18384–18391. [DOI] [PubMed] [Google Scholar]
- (22).Hannun YA, and Obeid LM (2011) Many Ceramides. J. Biol. Chem 286, 27855–27862. [DOI] [PMC free article] [PubMed] [Google Scholar]
- (23).Kim JH, Ee SM, Jittiwat J, Ong ES, Farooqui AA, Jenner AM, and Ong WY (2011) Increased expression of acyl-coenzyme A: Cholesterol acyltransferase-1 and elevated cholesteryl esters in the hippocampus after excitotoxic injury. Neuroscience 185, 125–134. [DOI] [PubMed] [Google Scholar]
- (24).Hauser KF, Foldes JK, and Turbek CS (1999) Dynorphin A (1–13) Neurotoxicity in Vitro: Opioid and Non-Opioid Mechanisms in Mouse Spinal Cord Neurons. Neurol. 160, 361–375. [DOI] [PMC free article] [PubMed] [Google Scholar]
- (25).Wagner JJ, Terman GW, and Chavkin C (1993) Exp Endogenous dynorphins inhibit excitatory neurotransmission and block LTP induction in the hippocampus. Nature 363, 451–454. [DOI] [PMC free article] [PubMed] [Google Scholar]
- (26).Skilling SR, Sun X, Kurtz HJ, and Larson AA (1992) Selective potentiation of NMDA-induced acitivity and release of excitatory amino acid by dynorphin:possible roles in paralysis and neurotoxicity. Brain Res. 575, 272–278. [DOI] [PubMed] [Google Scholar]
- (27).Tang Q, Lynch RM, Porreca F, and Lai J (2000) Dynorphin A elicits an increase in intracellular calcium in cultured neurons via a non-opioid, non-NMDA mechanism. J. Neurophysiol 83, 2610–5. [DOI] [PubMed] [Google Scholar]
- (28).Woods A, and Zangen A (2001) A direct chemical interaction between dynorphin and excitatory amino acids. Neurochem. Res 26, 395–400. [DOI] [PubMed] [Google Scholar]
- (29).Crowley NA, Bloodgood DW, Hardaway JA, Kendra AM, McCall JG, Al-Hasani R, McCall NM, Yu W, Schools ZL, Krashes MJ, Lowell BB, Whistler JL, Bruchas MR, and Kash TL (2016) Dynorphin Controls the Gain of an Amygdalar Anxiety Circuit. Cell Rep. 14, 2774–2783. [DOI] [PMC free article] [PubMed] [Google Scholar]
- (30).Long JB, Rigamonti DD, Oleshansky MA, Wingfield CP, and Martinez-Arizala a. (1994) Dynorphin A-induced rat spinal cord injury: evidence for excitatory amino acid involvement in a pharmacological model of ischemic spinal cord injury. J. Pharmacol. Exp. Ther 269, 358–366. [PubMed] [Google Scholar]
- (31).Zhang L, Peoples RW, Oz M, Harvey-White J, Weight FF, and Brauneis U (1997) Potentiation of NMDA receptor-mediated responses by dynorphin at low extracellular glycine concentrations. J. Neurophysiol 78, 582–90. [DOI] [PubMed] [Google Scholar]
- (32).Bakshi R, Newman AH, and Faden AI (1990) Dynorphin A-(1–17) induces alterations in free fatty acids, excitatory amino acids, and motor function through an opiate-receptor-mediated mechanism. J.Neurosci 10, 3793–3800. [DOI] [PMC free article] [PubMed] [Google Scholar]
- (33).Caudle RM, and Isaac L (1988) A novel interaction between dynorphin(1–13) and an N-methyl-d-aspartate site. Brain Res. 443, 329–332. [DOI] [PubMed] [Google Scholar]
- (34).Björnerås J, Gräslund A, and Mäler L (2013) Membrane interaction of disease-related dynorphin A variants. Biochemistry 52, 4157–4167. [DOI] [PubMed] [Google Scholar]
- (35).Iremonger KJ, and Bains JS (2009) Retrograde opioid signaling regulates glutamatergic transmission in the hypothalamus. J. Neurosci 29, 7349–58. [DOI] [PMC free article] [PubMed] [Google Scholar]
- (36).Solin AV, Korozin VI, and Lyashev YD (2013) Effects of regulatory peptides on the stress-induced changes of lipid metabolism in experimental animals. Bull. Exp. Biol. Med 155, 324–326. [DOI] [PubMed] [Google Scholar]
- (37).Wang JQ, Daunais JB, and Mcginty JF (1994) NMDA Receptors Mediate AmphetamineInduced Upregulation of and Preprodynorphin mRNA Expression in Rat Striatum. Synapse 18, 343–353. [DOI] [PubMed] [Google Scholar]
- (38).Hauser KF, Aldrich JV, Anderson KJ, Bakalkin G, Christie M, Hall ED, Knapp PE, Scheff SW, Singh IN, Vissel B, Woods AS, Yakovleva T, and Shippenberg TS (2005) Pathobiology of dynorphins in trauma and disease. Front. Biosci, Landmark: Ed. 10, 216. [DOI] [PMC free article] [PubMed] [Google Scholar]
- (39).Woods AS, Kaminski R, Oz M, Wang Y, Hauser K, Goody R, Wang HYJ, Jackson SN, Zeitz P, Zeitz KP, Zolkowska D, Schepers R, Nold M, Danielson J, Gräslund A, Vukojevic V, Bakalkin G, Basbaum A, and Shippenberg T (2006) Decoy peptides that bind dynorphin noncovalently prevent NMDA receptor-mediated neurotoxicity. J. Proteome Res 5, 1017–1023. [DOI] [PMC free article] [PubMed] [Google Scholar]
- (40).Roux A, Muller L, Jackson SN, Post J, Baldwin K, Hoffer B, Balaban CD, Barbacci D, Schultz JA, Gouty S, Cox BM, and Woods AS (2016) Mass spectrometry imaging of rat brain lipid profile changes over time following traumatic brain injury. J. Neurosci. Methods 272, 19–32. [DOI] [PMC free article] [PubMed] [Google Scholar]
- (41).Thon L (2005) Ceramide mediates caspase-independent programmed cell death. FASEB J. 19, 1945–1956. [DOI] [PubMed] [Google Scholar]
- (42).Woodcock J (2006) Sphingosine and ceramide signalling in apoptosis. IUBMB Life 58, 462–466. [DOI] [PubMed] [Google Scholar]
- (43).Aureli M, Murdica V, Loberto N, Samarani M, Prinetti A, Bassi R, and Sonnino S (2014) Exploring the link between ceramide and ionizing radiation. Glycoconjugate J. 31, 449–459. [DOI] [PubMed] [Google Scholar]
- (44).Taniguchi M, and Okazaki T (2014) The role of sphingomyelin and sphingomyelin synthases in cell death, proliferation and migration from cell and animal models to human disorders. Biochim. Biophys. Acta, Mol. Cell Biol. Lipids 1841, 692–703. [DOI] [PubMed] [Google Scholar]
- (45).Lee C, and Hajra AK (1991) Molecular species of diacylglycerols and phosphoglycerides and the postmortem changes in the molecular species of diacylglycerols in rat brains. J. Neurochem 56, 370–379. [DOI] [PubMed] [Google Scholar]
- (46).Cone RI, Weber E, Barchas JD, and Goldstein A (1983) Regional distribution of dynorphin and neo-endorphin peptides in rat brain, spinal cord, and pituitary. J. Neurosci 3, 2146–52. [DOI] [PMC free article] [PubMed] [Google Scholar]
- (47).Fallon JH, and Leslie FM (1986) Distribution of dynorphin and enkephalin peptides in the rat brain. J. Comp. Neurol 249, 293–336. [DOI] [PubMed] [Google Scholar]
- (48).Watson SJ, Khachaturian H, Akil H, Coy DH, and Goldstein A (1982) Comparison of the distribution of dynorphin systems and enkephalin systems in brain. Science 218, 1134–6. [DOI] [PubMed] [Google Scholar]
- (49).Land BB, Bruchas MR, Lemos JC, Xu M, Melief EJ, and Chavkin C (2008) The Dysphoric Component of Stress Is Encoded by Activation of the Dynorphin -Opioid System. J. Neurosci 28, 407–414. [DOI] [PMC free article] [PubMed] [Google Scholar]
- (50).Hussain ZM, Fitting S, Watanabe H, Usynin I, Yakovleva T, Knapp PE, Scheff SW, Hauser KF, and Bakalkin G (2012) Lateralized Response of Dynorphin A Peptide Levels after Traumatic Brain Injury. J. Neurotrauma 29, 1785–1793. [DOI] [PMC free article] [PubMed] [Google Scholar]
- (51).Romine J, Gao X, and Chen J (2014) Controlled Cortical Impact Model for Traumatic Brain Injury. J. Visualized Exp, e51781. [DOI] [PMC free article] [PubMed] [Google Scholar]
- (52).Mickley GA, Hoxha Z, Biada JM, Kenmuir CL, and Bacik SE (2006) Acetaminophen self-administered in the drinking water increases the pain threshold of rats (Rattus norvegicus). J. Am. Assoc. Lab. Anim. Sci 45, 48–54. [PubMed] [Google Scholar]
- (53).Paxinos G, and Watson C (2007) The Rat Brain in Stereotaxic Coordinates, sixth ed., Elsevier, Oxford. [Google Scholar]
- (54).Muller L, Baldwin K, Barbacci DC, Jackson SN, Roux A, Balaban CD, Brinson BE, McCully MI, Lewis EK, Schultz JA, and Woods AS (2017) Laser Desorption/Ionization Mass Spectrometric Imaging of Endogenous Lipids from Rat Brain Tissue Implanted with Silver Nanoparticles. J. Am. Soc. Mass Spectrom 28, 1716. [DOI] [PMC free article] [PubMed] [Google Scholar]
- (55).Team RC (2016) R: A language and environment for statistical computing, R Foundation for Statistical Computing, Vienna. [Google Scholar]
Associated Data
This section collects any data citations, data availability statements, or supplementary materials included in this article.


